Crystallography and Molecular Dynamics · 2020-01-09 · occ*e-Bs2*f 0() occ=0.8, B=30Å2 occ ......
17
Tim Grüne K + Transport through Membrane Channels Crystallography and Molecular Dynamics: Water–Free K + Transport through Membrane Channels Tim Gruene Paul Scherrer Institute [email protected] Regio Meeting 2015 1/18
Transcript of Crystallography and Molecular Dynamics · 2020-01-09 · occ*e-Bs2*f 0() occ=0.8, B=30Å2 occ ......

Tim Grüne K+ Transport through Membrane Channels
Crystallography and Molecular Dynamics:
Water–Free K+ Transport through Membrane Channels
Tim GruenePaul Scherrer Institute
Regio Meeting 2015 1/18
Tim Grüne K+ Transport through Membrane Channels
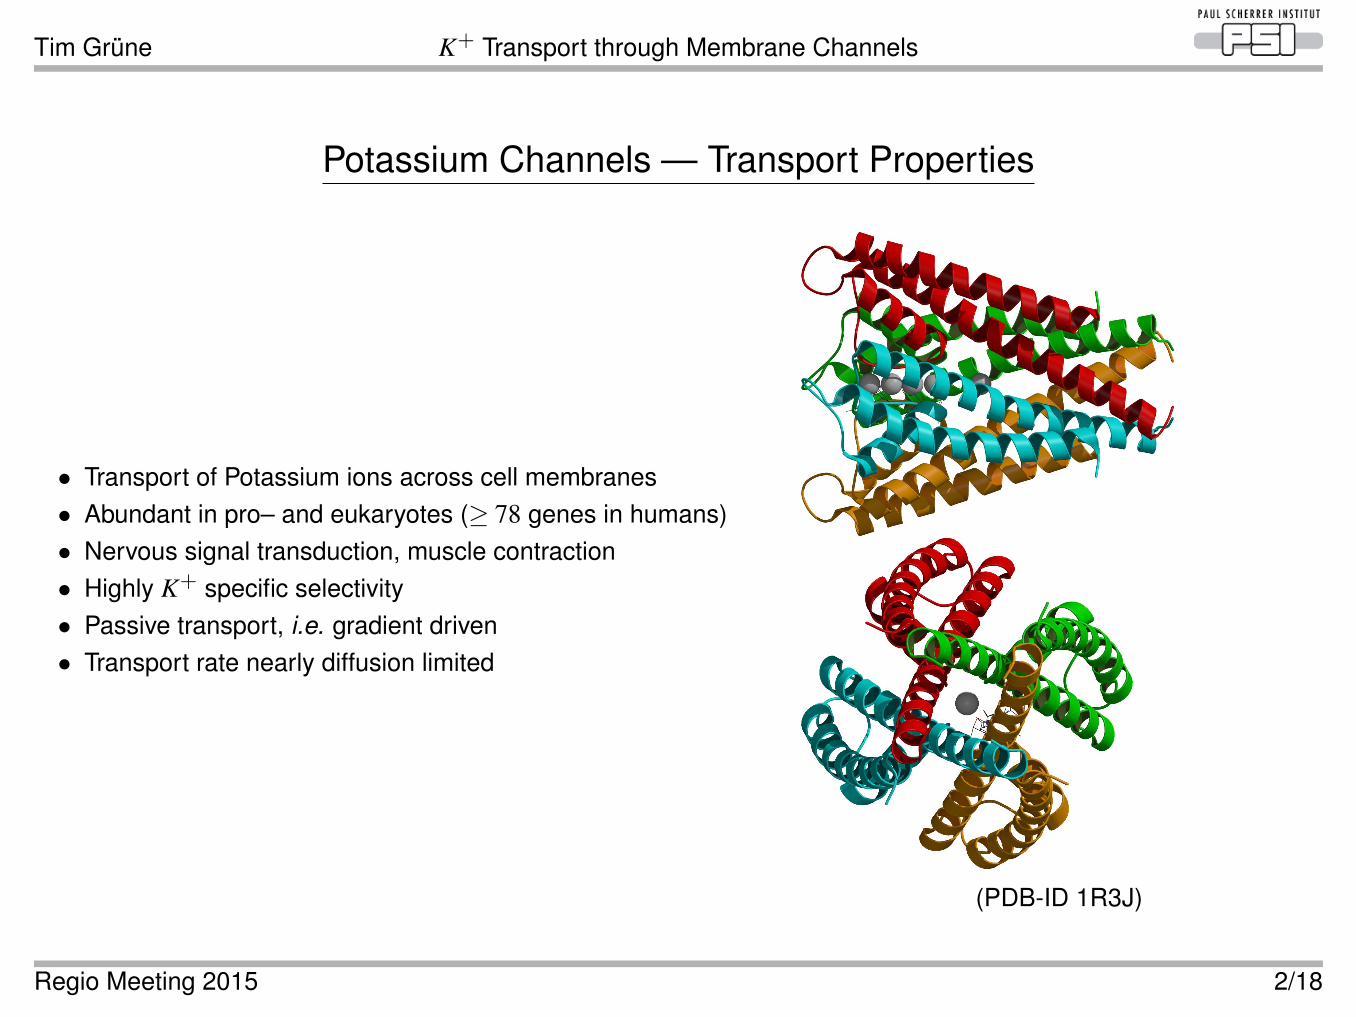
Potassium Channels — Transport Properties
• Transport of Potassium ions across cell membranes• Abundant in pro– and eukaryotes (≥ 78 genes in humans)• Nervous signal transduction, muscle contraction• Highly K+ specific selectivity• Passive transport, i.e. gradient driven• Transport rate nearly diffusion limited
(PDB-ID 1R3J)
Regio Meeting 2015 2/18

Tim Grüne K+ Transport through Membrane Channels
The Selectivity Filter
1998 First Crystal Structures of the K+ channel KcsA by Roderick MacKinnon.
• Core of channel: 12Å tube• Scav→ S4→ S1: transport into membrane compartment• Conserved sequence TVGYG• K+–O≈ 2.8Å• (Backbone–) oxygen atoms mimic 1st hydration shell⇒ Blocks other ions, e.g. Na+,Ca2+: X–O≈ 2.4Å
Regio Meeting 2015 3/18

Tim Grüne K+ Transport through Membrane Channels
The “KWKW ” Conduction Mechanism
• A. L. Hodgkin, R. D. Keynes (1955): electrostatic repulsion prohibits K+K+K+K+. Shielding by water molecules
• Morais–Cabral, Zhou, MacKinnon, Nature (2001), 414, 37–42: determination of electron density with K+ andRb+
• Zhou & MacKinnon, JMB (2003), 333, 965–975: Crystallographic occupancy by means of the anomalous signalof T l+ and K+
1. T l+–O≈ K+–O≈ 2.8Å: interchangeable2. Occupancy refinement based on the anomal-
ous signal of T l+
3. Comparison with K+–density⇒ on average 2 K+ inside filter⇒ Crystal structure = mixture between “KWKW ”
and “WKWK” K+ K+
K+K+
K+ K+K+ K+
K+
K+
K+
W
K+
K+
S1 S2 S3 S4
W W
WW
W WW W
W
W
W
W
W
W
W
Established view: co–transport of water through Selectivity Filter
Regio Meeting 2015 4/18

Tim Grüne K+ Transport through Membrane Channels
The de Groot/Köpfer Mechanism
Based on Molecular Dynamics: no water inside Selectivity Filter
Köpfer, Song, Gruene, Sheldrick, Zachariae, de Groot: Science (2014), 346, pp. 352–355Regio Meeting 2015 5/18

Tim Grüne K+ Transport through Membrane Channels
Molecular Dynamics: Transport Model
Crystallography: Experimental Data
MD simulation contradicts established model. Crystallogrpahy:
Can K+ ions occupy adjacent sites within the selectivity filter?
Regio Meeting 2015 6/18

Tim Grüne K+ Transport through Membrane Channels
Crystallography: Occupancy vs. thermal vibration
0 2 4 6 8
10 12 14 16 18 20
10Å 5Å 3Å 2Å 1Å
Scat
terin
g fa
ctor
f(θ
)
Resolution d (=1/2s)
occ*e-Bs2*f0(θ)
occ=0.8, B=30Å2
occ=1.0, B=50Å2
occ=0.6, B=10Å2
f0(θ) K+: 18e-
Refinement “sees” the area underneath each curveRegio Meeting 2015 7/18

Tim Grüne K+ Transport through Membrane Channels
Atomic Resolution does not Resolve all Problems
• Correlation between atomic displacement parameter and occupancy > 90%
• Restraints: bind B–values to chemical environment?
• K+ ions on 4–fold symmetry axis: artefacts (1R3J (T l+))
Regio Meeting 2015 8/18

Tim Grüne K+ Transport through Membrane Channels
Step 1: Anomalous Signal in Reciprocal Space
Regio Meeting 2015 9/18

Tim Grüne K+ Transport through Membrane Channels
Relative Occupancy of T l+ from SAD Phasing
Advantages
• Only anomalous signal: no contribution from water molecules
• “Normalized structure factors”: point like atoms at 0 K, i.e. independence from B–values
Drawback: occupancies only relative to strongest peak
Regio Meeting 2015 10/18

Tim Grüne K+ Transport through Membrane Channels
Results Step 1: Ions equally distributed inside Selectivity Filter
1r3j fa.res T l+
S1 S2 S3 S4 Scav #6relative occ. 1.0 0.9 0.9 1.0 0.6 0.12
experimental anomalous electron density
Drawback: occupancies only relative to strongest peak
Regio Meeting 2015 11/18

Tim Grüne K+ Transport through Membrane Channels
Consequence from Equal Distribution for Occupancy
SAD Phasing: occ(S1) = occ(S2) = occ(S3) = occ(S4), unknown absolute.
Possible Scenarios:
average SF content Distribution occupancy⟨1 T l+
⟩Tl W W WW Tl W WW W Tl WW W W Tl 〈occ〉 ≤ 0.25⟨
2 T l+⟩
Tl W Tl WW Tl W Tl 〈occ〉 ≤ 0.5⟨
3 T l+⟩
Tl Tl Tl WTl W Tl TlW Tl Tl TlTl Tl W Tl 〈occ〉 ≤ 0.75⟨
4 T l+⟩
Tl Tl Tl Tl 〈occ〉 ≤ 1.00
Ion separation by water requires all four occupancy at least < 0.75.
Regio Meeting 2015 12/18

Tim Grüne K+ Transport through Membrane Channels
Step 2: Absolute Occupancy of T l+ from Structure Refinement
• T l+: unrestrained B–values
• T l+: anisotropic B–values
• including anomalous signal
Regio Meeting 2015 13/18

Tim Grüne K+ Transport through Membrane Channels
Result Step 2: Ions in Selectivity Filter fully occupied
1R3J (T l+)S1 S2 S3 S4 Scav
absolute occupancy (SHELXL) 1.02 (4) 0.93 (3) 0.92 (4) 0.99 (4) 0.47 (3)B[Å2] 28(1) 26(1) 25(1) 27(1) 20(2)relative occupancy (SHELXD) 1.0 0.9 0.9 1.0 0.6
• No occupancy < 75%
⇒ T l+T l+T l+T l+ predominant in crystal
Regio Meeting 2015 14/18

Tim Grüne K+ Transport through Membrane Channels
Why are the Results Different from the Original Work?
3LDC: MthK pore with 100mM K+, dmin = 1.45Å
S4 S3 S2 S1occupancy:1.00 1.00 0.80 0.92
B-value: 20(1) 18(1) 17(1) 18(1)
S4 S3 S2 S1occupancy:0.50 0.50 0.50 0.50
B-value: 12 12 11 12
Refined occupancies Fixed occupancies: 50% K+, 50% H2O
(Especially) S2: Fluctuations in map due to B↔ occ
Regio Meeting 2015 15/18

Tim Grüne K+ Transport through Membrane Channels
Conclusions
• Molecular dynamics simulations correct “text book” mechanism
• Crystallographic experimental data confirm molecular dynamics simulations
• K+–transport through membrane channels without shielding water
Regio Meeting 2015 16/18

Tim Grüne K+ Transport through Membrane Channels
Acknowledgements
B. de GrootD. KöpferG.M. Sheldrick
Roderick MacKinnon
Reference: Köpfer, Song, Gruene, Sheldrick, Zachariae, de Groot: Science (2014), 346, pp. 352–355
Regio Meeting 2015 17/18