Crystallization kinetics of glassessestak/yyx/CrystallizationKinetics.pdf · Crystallization...
68
Crystallization kinetics of glasses J. Sestak TH APPLICABILITY OF DTA TO THE STUDY OF CRYSTALLIZATION KINETICS OF GLASSES Phys Chem Glasses 15 (1974) J. Sestak USE OF PHENOMENOLOGICAL KINETICS AND THE ENTHALPY VERSUS TEMPERATURE DIAGRAM (AND ITS DERIVATIVE - DTA) FOR A BETTER UNDERSTANDING OF TRANSITION (CRYSTALLIZATION) PROCESSES IN GLASSES Thermochimica Acta 280/281 (1996) 511 521 N. Koga and J. Sestak CRYSTAL NUCLEATION AND GROWTH IN LITHIUM DIBORATE GLASS BY THERMAL ANALYSIS J. Am. Ceram. Soc., 83 [7] 1753–60 (2000) J. Sestak THE ROLE OF THERNAL ANNEALING IN THE PROCESSING OF METALLIC GLASSES Thermochimica Acta 110 (1987) 427 J. Šesták, E. Illekova JMAYK- AND NGG- CRYSTALLIZATION KINETICS OF METALLIC MICRO-, NANO- AND NON- CRYSTALLINE ALLOYS Book chapter 2012
Transcript of Crystallization kinetics of glassessestak/yyx/CrystallizationKinetics.pdf · Crystallization...

Crystallization kinetics of glasses J. Sestak TH APPLICABILITY OF DTA TO THE STUDY OF CRYSTALLIZATION KINETICS OF GLASSES Phys Chem Glasses 15 (1974) J. Sestak USE OF PHENOMENOLOGICAL KINETICS AND THE ENTHALPY VERSUS TEMPERATURE DIAGRAM (AND ITS DERIVATIVE - DTA) FOR A BETTER UNDERSTANDING OF TRANSITION (CRYSTALLIZATION) PROCESSES IN GLASSES Thermochimica Acta 280/281 (1996) 511 521 N. Koga and J. Sestak CRYSTAL NUCLEATION AND GROWTH IN LITHIUM DIBORATE GLASS BY THERMAL ANALYSIS J. Am. Ceram. Soc., 83 [7] 1753–60 (2000) J. Sestak THE ROLE OF THERNAL ANNEALING IN THE PROCESSING OF METALLIC GLASSES Thermochimica Acta 110 (1987) 427 J. Šesták, E. Illekova JMAYK- AND NGG- CRYSTALLIZATION KINETICS OF METALLIC MICRO-, NANO- AND NON- CRYSTALLINE ALLOYS Book chapter 2012


therm0chimica acta
E L S E V I E R Thermochimica Acta 280/281 (1996) 175 190
Use of phenomenological kinetics and the enthalpy versus temperature diagram (and its derivative - - DTA)
for a better understanding of transition processes in glasses 1
J a r o s l a v Sestfik
Institute o[' Physies Division o/'Solid-State Physics, Academy of Sciences of the Czech Republic, Cukrot, arnickd 10, 16200 Praha 6, Czech Republic
Abstract
Thermophysical bases of vitrification and crystallization are discussed in terms of the enthalpy versus temperature diagram and its derivative (DTA) illustrating relaxation and glass transform- ation as well as crystallization of glassy and amorphous states to form stable and metastable phases. Non-isothermal kinetics are thoroughly discussed and the use of one- (JMAEK) and two- (SB) parameter equations is described. The practical case of the complementary 70SiO 2
10A1203 20ZnO glass treatment is demonstrated for both standard nucleation-growth curves and corresponding DTA recordings; these show a good coincidence of the activation energies obtained.
Keywords: Crystallization; DSC; DTA; Enthalpy temperature diagram; Glass transitions; Non-isothermal kinetics; SiO 2 A120 3 Z n O ; Vitrification
1. Introduction
Second phase nucleation and its consequent growth can be unders tood as a general process of new phase formation. It touches almost all aspects of our universe account- ing for the formation of smog as well as the embryology of viruses [1]. On the other hand the supression of nucleation is impor tant for the general process of vitrification, itself impor tant in such diverse fields as metaglasses or cryobiology trying to achieve
1 Dedicated to Professor Hiroshi Suga.
0040-6031,/96,,'$15.00 i; 1996 Elsevier Science B.V. All rights reserved SSDI 0 0 4 0 - 6 0 3 1 (95)02641-X
176 d. fesRkk/Thermochimica A eta 280/281 ( 1996 ) 175 190
non-crystallinity for highly non-glass-forming alloys or intra- and extracellular solu- tions needed for cryopreservation.
A characteristic process worthy of specific note is the sequence of relaxation nucleation growth processes associated with the transition of the non-crystalline state to the crystalline one. Such a process is always accompanied by a change of enthalpy content which, in all cases, is detectable by thermometric (differential thermal analysis, DTA) and/or calorimetric (differential scanning calorimetry, DSC) measurements [2, 3]. Some essential aspects of such types of investigation will be reviewed and attempts will be made to explain them more simply.
The article has two parts with different information levels. The aim of Section 3 is to show an easy way of graphically illustrating processes associated with devitrification. The diagram of enthalpy versus temperature is employed, including its relationship to conventional DTA DSC measurements; this is easily understandable in terms of the temperature derivatives [3]. Inherent information, however, is very complex and its successful utilization, particularly in determining the reaction kinetics of crystalliza- tion, is not easy. Therefore a more specialised section 4 is added in order to review some current practices of non-isothermal kinetics evaluations.
2. Theoretical basis of D T A - D S C
Most DTA instruments can be described in terms of a double non-stationary calorimeter [3] in which the thermal behaviour of the sample (S) is compared with that of an inert reference (R) material. The resulting effects produced by the change of the sample enthalpy content can be analysed at four different levels, namely:
(1) identity (fingerprinting of sequences of individual thermal effects); (2) quality (determination of points characteristic of individual effects such as begin- nings, onsets, outsets, inflections and apexes); (3) quantity (areas, etc.); (4) kinetics (dynamics of heat sink and/or generation responsible for the peak shapes).
The identity level plays an important role in deriving the enthalpy against temperature plots while study of kinetics pays attention to profile of their derivatives.
From the balance of thermal fluxes the DTA equation can be established [3,4] relating the measured quantity, i.e., the temperature d(~'erence between the sample and reference, A TDTA = Ts - TR, against the investigated reaction rate, d~/dt. The value of the extent of reaction, :¢, is then evaluated by simple peak area integration assuming the averaged values of extensive (~) and intensive (T) properties obtained from the sample specimen. It may be complicated by the inherent effect of heat inertia, Cp(dA TDTA/dT), when the DTA peak background is not simply given by a linear interpolation [2, 3].
A similarly derived DSC equation shows the direct relationship for the measured compensation thermalflux, AQ, supplied to both specimens under the conditions where the specimen difference A TDTA serves only as a regulated quantity kept as close to zero as possible. Therefore during any DTA experiments the actual heating rate of the

J. S'estfik/Thermochimica Acta 280/281 (1996) 175 190 177
sample is in reality changed [4] because of the DTA deflection due to heat release and/or absorption, which is also a direct measure of the deviation between the true and programmed (predetermined) temperatures (maintained by the reference). At the moment when a completely controlled thermal condition of the specimens is attained [-3] the DTA peak would be diminished while that of DSC becomes more accurate. Both types of measurement provide a unique source of input data which is usually undervalued and underestimated for more sophisticated kinetic analysis.
Initially we should make clear that ordinary DTA can never satisfy all the demands arising from specific characteristics of the glassy state and the non-equilibrium nature of its investigation. Micro-DTA, where possible temperature gradients of microgram samples are maximally decreased, is an useful tool for a precise detection of charac- teristic temperatures while macro-DTA enables more effective measurement of integral changes needed in calorimetry. However, glassy samples of shapes like fibres or very thin metallic ribbons or even fine powders must be treated with increased attention as the process of sample pretreatment as well as filling a DTA cell can introduce not only additional interfaces and defects but also unpredictable mechanical tension and interactions with the sample holder surface all of which are sensitively detected and exhibited on thermometric recordings. Under limiting conditions, and particularly for a very small sample, it is then difficult to distinguish between effects caused by bulk and surface properties of a sample as well as by a self-catalyzing generation of heat. Consequently heat transfer from the reacting zone may become a rate-controlling process [-3].
3. Thermophysics of vitrification and crystallization
Glasses (obtained by a suitable rapid cooling of melts) or amorphous solids (reached by an effective disordering process) are in a constrained (unstable) thermodynamic state [5] which tends to be transformed to the nearest, more stable state on reheating [2, 6]. The well-known dependence of a sample's extensive property on temperature can best illustrate the possible processes which can take place during changes of sample temperature [-3]. A most normal plot was found in the form of H versus T which can be easily derived using an ordinary lever rule from a concentration section of a conven- tional phase diagram [7]. The temperature derivatives of this course (dAH/dT) resembles the DTA DSC traces each peak and/or step corresponding to the individual transformation exhibited by the step and/or break in the related H vs T plot.
3.1. Fundamentals of glass-jormation processes
Fig. 1 illustrates possible ways of achieving a non-crystalline state. The latter can be either glass obtained in the classical way of liquid freeze-in via the metastable state of undercooled liquid (RC) or any other amorphous phase prepared by disintegration of crystalline solids (MD, upwards from solid to dotted line) or deposition from the gaseous state (VD, to thin sloped line). In the latter cases the characteristic region of

178 d. ,~esttik/Thermochimica Acta 280//281 ( 1996 ) 175-- 190
H ; gas
. . t ~ I ~ RC ~ VD .~ I " undercooled ..----,"
~ . / glass I . / ' - " "1" r ,
. . . . . . . I ~ .,H i t
~ f ~_ J l equ,l,br,um ,,
'~'--- Solidification
l
42 undercooled
glass-formation
t equilibirium melting and ~ I ~, recrystallizatien ] j ~ " ~
i glass-transformation ~, ] and crystallization
V " ~.i i L - - . ] enhanced
i i , I g lass -c rys ta l l i za t ion
] ' ' i ' ! ~ f = I i ~ II I
T 'c r Tg Tcr Tmelt
Fig. 1. Schematic diagram of enthalpy, H, versus temperature, T, and its derivative (A T) presented in the actual form which can be used to reconstruct the DTA DSC recording. The solid, dashed and dotted lines indicate the stable, metastable and unstable (glassy) states. Rapid cooling of the melt (RC) can result in equilibrium or non-equilibrium solidification or glass-formation (T g) which on reheating exhibits recrystall- ization. On the other hand an amorphous solid can be formed either by deposition of vapour (VD) against a cooled substrate (thin line) or the mechanical disintegration (MD) of the crystalline state (moving vertically to meet the dotted line)• Reheating of such an amorphous solid often results in early crystallization which overlaps the Tg region•
g lass - t ransformat ion is usual ly ove r l apped by ear ly crys ta l l iza t ion on heat ing which can be dis t inguished only by the basel ine separa t ion occurr ing due to the change of heat capaci ty. Such typical cases exist in oxide glasses but a bet ter example can be found for non-crys ta l l ine chalcogenides p repared by var ious me thods of d i sorder ing [8]. F o r most metal l ic glasses, however, there is negligible change of Cp between the glassy and crystal l ine states and thus the D T A D S C baselines do not show the required displace- ment which even makes it difficult to locate Ty, It is wor th not ing that the entire glassy state [5] can further be classified accord ing its origin, d is t inguishing l iquid glassy crystals, etc. [9], charac ter i sed by their own g lass - t rans format ion regions.

J. S~est~k/Thermochimi~ a Acta 280/281 (1996) 175 190 179
3.2. Basic rules of relaxation and glass transformation
During heat treatment of an as-quenched glass relaxation processes can take place within the short and medium range ordering [10] to cover (i) topological short-range movement of constitutional species and relaxation of structural defects, (ii) composi- tional short-range rearrangements of the nearest neighbours where usually chemically similar elements can exchange their atomic positions and (iii) diffusional ordering connected again with structural defects and gradients created during quenching of real bodies [2, 10-13]. Such processes are typical during both the isothermal annealing and slow heating which occur below T 0 and can consequently affect the glass transform- ation region as well as the medium-range ordering, possibly initiating segregation of clusters capable of easier nucleation. Characteristic types of T o region during cooling and heating are illustrated at Fig. 2.
3.3. Crystallization of glasses
There are extensive sources of the basic theory for nucleation-growth controlled processes [14-17]; these form the framework of the resulting description of a centred process of overall crystallization. Schematically, see Fig. 3, the metastable glassy state (dotted) first undergoes glass transformation followed by separation of the closest crystalline phase usually metastable (dot-and-dashed). Consequent and/or overlap- ping T o (I and II) indicate the possibility of two phase-separated glasses. If considering a more complex case, for example the existence of a second metastable phase, the sequences of processes became multiplied since the metastable phase is probably produced first to precipitate later into more stable phases. This can clearly give an idea of what kind of an equilibrium background [7] is to be considered for the overall crystallization. Thus the partial reaction steps experimentally observed as the indivi- dual peaks can be classified to fit the scheme chosen in accordance with the stable metastable boundary lines in the given type of a phase diagram related to the sample composition [4].
4. Non-isothermal crystallization kinetics
4.1. Constitutive equations, derivation methods and applicability checking
The so-called phenomenological description of crystallization kinetics emerged as a separate category to enable utilization of thermoanalytically measured data on the mean and normalised extent of crystallization, ~, for a simplified description of the nucleation-growth-controlled processes [3]. It is conventionally based on a physical-geometrical model, f(~), responsible for crystallization kinetics traditional- ly employing the classical Johnson Mehl Avrami Yerofeeyev Kolgomorov equation (abbreviated JMAYK) read as - ln(1 ~)=(kTt) r. It follows that f ( ~ ) = (1 - ~ ) ( - l n ( 1 -:¢))P where p = 1 1/r [2, 3] has been derived, however, under strict isothermal conditions. Beside the standard requirements of random nucleation and

180 J. S~estdtk/Thermochimica Acta 280/281 (I 996) 175 190
J
H
t
AT
H
AT
H
AT
glass I " ~ - ~ . . J . ~ / . . - ' ~
metals
oxide=
I T I
\
/ " / /~z
_ 5 _ _
annealing
I f / II I ~t
ql
T _'2"-
Fig. 2. Enlarged parts of a hypothetical glass transformation region (cf Fig. 1) shown for several characteris- tic cases such as cooling two different sorts of material (upper), reheating identical samples at two different heating rates (middle) and reheating after sample annealing (bottom).
T

J. S~estfk/Thermochimica Acta 280/281 (1996) 175 190 181
]
H
~T
I
I Tcr7
I I I I
T~r'a f I T
I . . - - ~ I ~ '~"
" 5 . . . . ;>, ~ ~ - - . - " 5 . . ~ f I ~ ' l " " " - " " " "
/ , T-"j
~ ~ n III
Tgl Tgtt Tcrl Tcr2 Tc,.3 T,
1 1
f J
J J
T
Fig. 3. Hypothetical crystallization of one metastable phase (Tcrl, dot-and-dashed line) or two metastable phases (To,l, Tc~2, bottom)including the possibility of two glasses (Tg~, Tg.), transformation as a possible result of preceding liquid liquid phase separation.
consequent growth, the rate of which is temperature-but not time-dependent, the JMAYK equation is only valid at constant temperature. Some pecularities of non- isothermal kinetics and the general applicability of the JMAYK equation are thus worth reconsidering.
It must be reminded that the extent of crystallization, ~, cannot be considered as a s t a t e f u n c t i o n itself ~=~ f , ( T , t) [3,7]. For the sake of simplicity the truly effective

182 J. S~estdk/Thermochimica Acta 280/28I (1996) 175 190
constitutive equation in kinetics can thus be simplified to be valid for the two basic rates only, i.e., that of crystallization d~/dt=f~(7, T) and of temperature change d T/dt =fr(~, T). Therefore any additional term of the type (d~/dT) t sometimes re- quired to correct the non-isothermal rate in the fundamental Arrhenius equation [18, 19] dct/dt = kTf(~ ) by the additional multiplying term [1 + ( T - To)E/RT 2] is unjustified [7] and incorrect [3]. The resultant isokinetic hypothesis is then accounted for in the construction of TTT and CT diagrams [2], also.
The true temperature-dependent intergration of the basic nucleation growth equa- tion yields very similar dependences [3,20] comparable to the classical JMAYK equation obtained under classical isothermal derivation. It effectively differs only by a constant in the preexponential factor depending on the numerical approximation employed during the integration [3]. This means that the standard form of the JMAYK equation can be used throughout non-isothermal treatments. Therefore a simple preliminary test of its applicability is recommendable. In particular, the value of the multiple (d~/dt)T can be used to check which maximum should be confined to the value 0.63_+0.01 [21]. Another handy test is the shape index, i.e., the ratio of intersections (b I and b:) of the inflection slopes with the linearly interpolated peak baseline which should show a linear relationship [21] ~ =bl /b 2 =0.52+0 .916 [(Ti2/Til ) - 1 ] where T i are respective inflection point temperatures.
This highly mechanistic picture of an idealized process of crystallization bears, however, a little correlation to morphological views and actual reaction mechanism [21,22]. If neither the (d~/dt)T value nor the shape index ~ comply to JMAYK requirements we have to account for real shapes, anisotrophy, overlapping, etc., being usually forced to use a more flexible empirical kinetic model function usually based on two exponents (SB) instead the one (JMAYK) only.
4.2. Apparent values of activation eneryies
Conventional analysis of the basic JMAYK equation shows that the overall value of activation energies, Eapp, usually evaluated from D TA -D S C measurements, can be roughly correlated on the basis of the partial energies of nucleation Enucl, growth Eg r and diffusion Edifi [23]. It follows [24] that E a p p = (13Enu d + OdEgr)/(u + Od) where the denominator equals the power exponent of the JMAYK equation, r, and the coefficients t~ and d indicate the nucleation velocity and the growth dimensionality. The value of ff corresponds to 1 or 1/2 for the movement of the growth front controlled by chemical boundary reaction or diffusion, respectively.
The value of Eap p is easily determined from the classical Kissinger plot [3,4] of In (fl/T 2) versus ( - 1 / R Tp) for a series of the DTA-DSC peak apexes (Ta) at different heating rates (fl) irrespective of the value of exponent r. Adopting the//-dependent concentration of nuclei Matusita and Sakka [25] proposed a modified equation of ln(fl~r+d)/T 2) versus (-dEgr/RTa) applicable to the growth of bulk nuclei where the nuclei number is inversely proportional to the heating rate (~ -~ 1). This is limited, however, to such a crystallization where the nucleation and growth temperature regions are not overlapping. If E,u d = 0 then Eap p simplifies to the ratio (dEg r + 2[t~ + d - 1] R Ta)/(d + t)) where dEg r >> 2 [r + d - 1] R T a. There are various

J. Sestdk/Thermochimica Acta 280/281 (1996) 175 190 183
further explanations of the effective meaning which can be associated with the value of apparent activation energy [4, 20, 21,26, 27].
4.3. Effect of particle size
In the case of surface-controlled crystallization the DTA exotherm is initiated at a lower temperature for the smaller particle size. In contrast the temperature region for the growth of bulk nuclei is independent of particle size. Thus for larger particles the absolute number of surface nuclei is smaller owing to the smaller relative surface area in the particle assembly resulting in predominant growth of bulk nuclei. With decreasing particle size the number of surface nuclei gradually increases, becoming responsible for the DTA exotherm. The particle-size-independent part ofEap p can be explained on the basis of the nucleus formation energy being a function of the curved surface. Concave and convex curvature decreases or increases, respectively, the work of nucleus forma- tion [-24]. Extrapolation OfEap p to the flat surface can be correlated with Egr, U = 1 and d = 3, being typical for silica glasses. It, however, is often complicated by secondary nucleation at the reaction front exhibited by decreasing Eap p with rising temperature for the various particle zones. The invariant part ofEap ~ then falls between the microscopi- cally observed values of Eg r and Enucl the latter being frequently a characteristic value for a yet possible bulk nucleation for the boundary composition of a given glass.
Assuming that the as-quenched glass has a nuclei number equal to the sum of a constant number of quenched-in nuclei and that, depending on the consequent time-temperature heat treatment, the difference between the DTA-DSC apex tempera- tures for the as-quenched and nucleated glass (T a - T °) becomes proportional to the nuclei number formed during thermal treatment [26, 28]. A characteristic nucleation curve can then be obtained by plotting ( T a - T °) against temperature [26] or even simply using only the DTA DSC peak width at its half maximum [28].
For much less stable metallic glasses the situation becomes more complicated because simultaneous processes associated with the primary, secondary and eutectic crystallization often take place not far from each other's characteristic composition. Typically thin ribbons of iron-based glasses close to the critical content, x, of metalloids (x s + Xsi = 25% with glass-forming limit x R -~ 10%) usually exhibit two consecutive peaks. This is frequently explained by the formation of ~-Fe embryos in the complex matrix containing quench-in sites followed by the formation of the metastable Fe3Si- like compounds which probably catalyze heterogeneous nucleation of more stable compounds. Experimental curves are usually fitted by the classical JMAYK equation describing nucleation and three-dimensional growth. However, small additions of Cu and/or Nb cause the two DTA peaks to overlap each other, essentially decreasing inherent areas (the heat of crystallization is cut down to about one fourth) indicating probably the dopant surfactant effect directed on the critical work of nuclei formation due to the reduced surface energy. The resulting process of associated nanocrystal formation (fin-met~,ls) [29-31] is thus different from the conventional nucleation growth usually characterised by high r(>_ 4). This is still far from being unambiguous and is often a matter of simplified hypotheses on grain growth. Nowadays nano- crystallization is thus another more specific case under increased attention becoming so

184 J. festcik/Thermochimica Acta 280/281 (1996) 175 190
complicated to be explainable in terms of classical physical geometrical theories. It is clear that a sort of fully phenomenological description could here be equally suitable for such a formal description, regardless of the entire mechanism of the reaction in question.
4.4. Phenomenological models in kinetics
There exist different phenomenological treatments, such as the geometric-probabi- listic approach or a purely analytical description by the exponent containing the fraction (a/x + b/x 2) 1. It enables continuous transfer from a quadratic to linear profile [-3] making it possible to identify formally the changes of reaction mechanism by checking characteristics of the peak shape only. Nevertheless, for a general expression of heterogeneous kinetics a most useful approach seems to be the traditional type of a formal description based on an analytical model, f(:¢), regarded as a distorted case of the classical homogeneous-like description (1 - ~)", where n is the so-called reaction order. A recently introduced function, h(~) [22], called the accommodation function (being put equal to either ( - l n ( l (1 - :¢))P or :~"), expresses the discrepancy between the actual, f(:Q, and ideally simplified, (1 - ~)" models. The simplest example of such an accommodation is the application of non-integral exponents (m, n, p) within the one- (JMAYK) or two- (SB) parametric function f(~), in order to match the best fitting of the functional dependences of an experimentally obtained kinetic curve. These non- integral kinetic exponents are then understood as related to thefractal dimensions [22]. From a kinetic point of view the interfacial area plays in crystallization kinetics the same role as that of concentration in homogeneous-like kinetics.
It is apparent that any specification of all (more complicated) processes in solid-state chemistry is difficult [32] to base unambiguously on physical geometrical models although they have been a subject of the popular and widely reported evaluations [32-35]. As already mentioned it can be alternatively replaced by an empirical- analytical (SB) formula [3], f(~) = (1 ~),~m, often called Sestak-Berggren equation [32, 34 36], which exhibits certain interrelation with the JMAYK equation, see Fig. 4. This can be found particularly serviceable in fitting the prolonged reaction tails due to the actual behaviour of real particles and can nicely match the particle non-sphericity, anisotropy, overlapping or other non-ideality [22].
It is worth mentioning that the typical kinetic data derived are strongly correlated with the Arrhenius equation, in the other words, a DTA DSC peak can be interpreted within several kinetic models by simple variation of the activation energy E and preexponential factor A [36]. A correct treatment then requires an independent determination of E from multiple runs and its consequent use to analyse a single DTA-DSC peak in order to determine a more realistic kinetic model and preexponen- tial factor [32, 34].
5. Crystallization of ZnO-Ai203-SiO 2 glasses
An example of complex analysis of the crystallization processes is a complementary investigation of the above-mentioned system which is illustrated in Fig. 5. The upper

d. SestOk/Thermochimica Acta 280/281 (1996) 175-190 185
0.25
n
0.50
0.75
n
J
I 2 3 4 5
5
0 .60
m
0.65
0.70
I 1.00 [ 0.75
I
0 . 0 0 . 2 0 .~ 0 .6 0 .8 1 .0
8
e-1
o
Fig. 4. This diagram demonstrates the relationship between the single exponent r of the JMAYK equation - l n ( l - :~)= (krt) r and the twin exponents n and m of the SB equation (1 -c&c~ m. Upper lines show the gradual development of both exponents m and n with r while the bottom curve illustrates a collective profile of n on m for increasing r.
pa r t represents the s t anda rd da t a ob ta ined by opt ica l measurements by two-s tep me thod and the b o t t o m par t shows the associa ted D T A curves of var ious ly t rea ted samples.
F o r the powdered glass, where the surface crys ta l l iza t ion of/~-SiO 2 is dominan t , the value of Eap p was a l ready repor ted [37] to corre la te to the reciprocal of par t ic le radius, indica t ing enhanced nuclei fo rmat ion on a curved surface. Act iva t ion energy then changes as a function of the surface curva ture and its ex t r apo la t ion to the flat surface reaches Eap p = 50 kcal c o m p a r a b l e to Eg = 66 kcal for l inear g rowth [37].
A more interest ing case is cer ta in ly the bulk crys ta l l iza t ion either spon taneous (gahnite and willemite) or ca ta lysed (Zn-petal i te) a imed at the p r epa ra t i on of low d i l a ta t ion g lass -ceramics . Assuming the crystal g rowth of Zn-pe ta l i te from both the cons tan t number of nuclei ( J M A Y K , r = 3) and at the cons tan t nuclea t ion rate (r = 4) the theoret ica l D T A curve can be ca lcula ted and c o m p a r e d with the exper imenta l one. F o r the ins tan taneous values of g rowth the best agreement was achieved for sa tu ra ted nuclea t ion based on the m a x i m u m nuclea t ion rate. This is shown in Table 1 where the crys ta l l iza t ion rates based on the opt ical and D T A measurements are compared , and agree within the o rde r of magni tude . The appa ren t value of E der ived from D T A traces

186 J. S~estdk/Thermochimica Acta 280/281 (1996) 175-190
log At I
[cm -3 mL,--11
8
6
4
2
0
ATDTA
" ~ ~ //Z~petalite . zro. \ / . zro.
" - ~ ' 7 / - ~ " 7aptic al
Z n oPSt raot2~ / / ~4ahnztrS 2)
- _ / Z , ,, 750 850 950 1050 1150
T---- Crystalization ~" ~ i /
volume / d / /
catalysed / / "T " .~1 // / i
surface / ~ . ~ ' ' J..l I i J ~ " ~" - -I" ~ "7 / " ]7 • ~'" Hypothetical
{J-Si02i'.,~-"/'./"~ ~ ' / V elagram Zn-petahte
Tg I ~ gahnit~
T I . - I
.,o , [ /Wo
powder glad,surface Lt ~
bulk glass
I - - I i
950 1050 1150
galqnit & willemit
' G / 1 0 3
[ c m m i n -1 ]
exo
endo
4 % Zr02
4 % Zr02 ~ ' (annealed 750 °C, 7 h)
6 % ZrO 2 Zn-petalite
l w
DTA Curves
Fig. 5. Complex view to the crystallization behaviour of the 20ZnO 30AIzO 3 70SiO 2 glassy system showing its nucleation (N) and growth (G) data obtained by the classical two-step optical observation of growth (upper), schematic view of the enthaply versus temperature diagram exhibiting the presence of two metastable phases of/~-quartz and Zn-petalite (middle) and respective DTA curves (bottom) obtained either on the powdered glass or on the bulk glass (cast directly into the DTA cell), in-weight about 200 mg, heating rate 10'C min- ~ Netzsch apparatus with classical chart recording.

J. Sestfk/Thermochimica Acta 280/281 (1996) 175--190
Table 1 Crystallization of Zn-petalite
187
Temperature/°C Growth rate, G~ Time of growth, d:~/dTdlr/(min - 1) dct/d TD-rA/(min- 1) (cm min - 1) t/min
820 1.6x10 4 2 1.6×10 2 l x l 0 1 830 1.9x10 4 4 2.2x10 1 4x10 1 840 3.0x10 4 6 2.9x10 ° l x l 0 ° 850 4.6x10 4 8 2.5x101 5x10 ° 860 6.3x10 4 10 1.2×10² 8x101
d~/d Ta~ r was evaluated on basis of the JMAYK equation (p = 2/3) and optical data employing the growth rate in (cm min l) and saturation nucleation rate N -~ 5 x 10 l° (cm 3 min ~), do:/dTDx A = (KDTAAT+ Cp d A T / d T ) / A H where the apparatus constant KDT A of the Netzsch instrument used was 5 x 10² (cal K 1 min l) at 850°C and the heat released AH ~ lOcal.
(Eap p'-~ 345 kcal, see T a b l e 2) a lso agrees wi th the s u m of three Eg r (-~ 285 kcal)
i nd i ca t i ng aga in the s a t u r a t i o n of the sites c apab l e of n u c l e a t i o n p r io r the g r o w t h
process . C o n v e n t i o n a l ana lys is of the J M A Y K e x p o n e n t p r o v i d e d an e x p o n e n t va lue
close to three; thus b o t h a b o v e - m e n t i o n e d checks of the J M A Y K va l id i ty were found to
be pos i t ive . S i m u l t a n e o u s l y ca l cu la t ed [32, 34, 35] e x p o n e n t s of the SB e q u a t i o n give
thei r r espec t ive va lues c lose to 3/4. O n the o t h e r h a n d the a n a l o g o u s analys is of gahn i t e c rys t a l l i za t ion shows the
di f ference of a b o u t t w o o rde r s of m a g n i t u d e for b o t h cases u n d e r ca lcu la t ion , see T a b l e
3. T h u s b o t h tests for p r o v i n g the va l id i ty of J M A Y K also shows misfits. At the s a m e
t ime the Eap p ca l cu l a t ed f rom D T A is t o o low ( abou t 130 kcal) to satisfy the t r ip le va lue
of r e spons ib l e Eg r ( "-~ 75 kcal) as s h o w n in T a b l e 2. T o g e t h e r wi th the de l ayed onse t of
the D T A p e a k a n d the shape of its acce l e ra t ing pa r t it c lear ly ind ica tes a m o r e
c o m p l i c a t e d p rocess t h a n a s ingle n u c l e a t i o n - g r o w t h even t for gahni te . It is poss ib ly
affected by the Z r O z - c a u s e d o r d e r i n g which m a y affect p r enuc l eus site f o r m a t i o n
[38 40]. T h e c o r r e s p o n d i n g va lues of r -~ 3.3 and n -~ 0.6 a n d m ~- 0.7 are aga in n o t
Table 2 Apparent kinetic data of the volume crystallization of 20ZnO 30Al:O s 70SiO 2 glass doped with ZrO 2. Nucleation N in cm s min 1, activation energy E in kcal
Nucleator content Gahnite Zn-petalite E from DTA or treatment
Nma x E.u d Eg r Nma x Enucl Egr G a h n i t e Petal i te
4% Z r O 2 6 .4x 104. 115 75 5x 10 ° 45 95 130 Same, 7 h ~ " at 755"C (_~ 108) a ( ~ 107) a 190 6% ZrO 2 5 X 10 l° 350 95 345
a Estimated from the DTA peak, other data from optical measurements, see Fig. 5.

188 J. Sestdk/Thermochimica Acta 280/281 (1996) 175 190
Table 3 Crystallization of gahnite
TemperatureS'C Growth rate, G~ Time of growth d:t/dTdir/(min 1) d~/dTDTA/(mi n 1) (cm min l) t/min
820 ~-10 6 28 ~10 4 ~-10 2 960 9.6×10 5 32 1.7×10 3 6×10 1 980 1.8x10 s 36 1.6×10 2 4×10 °
1000 2.2×10 5 40 3.6×10 z 9×10 ° 1020 2.7×10 5 44 1.0x10⁻¹ 2×101 1040 2.9x10 5 48 2.0×10 i 5×10 ~
d~/d Ta~ r was evaluated on basis of the Y MAYK equation (p = 2/3) and optical data employing the growth rate in (cm min 1) and saturation nucleation rate N -~ 6 x 10⁴ (cm 3 min 1), d~/d TDT A = (KDTAA T + Cp dAT/dT)/AH where the apparatus constant KDT A of the Netzsch instrument used was 9 x 10² [cal K 1 min - 1] at 1000°C and the heat released AH ~ 10 cal.
c h a r a c t e r i s t i c e n o u g h for a s ing le p r o c e s s to be s i m p l y u n d e r s t o o d w i t h o u t f u r t h e r
c o m p l e m e n t a r y i n f o r m a t i o n .
Acknowledgement
T h e w o r k was c a r r i e d o u t u n d e r p r o j e c t no. A 2 0 1 0 5 3 2 s u p p o r t e d b y the A c a d e m y
of Sc iences of t h e C z e c h R e p u b l i c .
D e e p t h a n k s a re d u e to P r o f e s s o r Z. S t r n a d of t he L a b o r a t o r y for B i o a c t i v e G l a s s -
C e r a m i c M a t e r i a l s in P r a g u e ( L A S A K ) for k i n d l y s h a r i n g o p t i c a l m e a s u r e m e n t s of t he
Z n O A l z O 3 - S i O 2 sys tem. C o n t i n u o u s c o o p e r a t i o n in s o l v i n g p e c u l a r i t i e s of n o n -
i s o t h e r m a l k i n e t i c s is a l so a p p r e c i a t e d , in p a r t i c u l a r m e n t i o n i n g Dr . J. M ~ l e k o f t he
L a b o r a t o r y for S o l i d - S t a t e C h e m i s t r y a t the P a r d u b i c e U n i v e r s i t y a n d Dr . N. K o g a of
t he C h e m i s t r y L a b o r a t o r y of H i r o s h i m a U n i v e r s i t y .
References
[1] J. Sest/tk, The Art and Horizon of Non-equilibrated and Disordered States and the New Phase Formation, in D. Uhlmann and W. H61and (Eds.), Proc. Kreidl's Symp. Glass Progress, Liechtenstein 1994, in press.
[2] J. Sestfik, Glass: Phenomenology of Vitrification and Crystallization Processes, in Z. Chvoj, J. Sest/tk and A. Tfiska (Eds.) Kinetic Phase Diagrams, Elsevier, Amsterdam 1991. p. 169.
[3] J. Sestfik, Thermophysical Properties of Solids, Elsevier (Amsterdam) 1984. [4] J. Sestak, Applicability of DTA and Kinetic Data Reliability of Non-isothermal Crystallization of
Glasses, a Review, Thermochim. Acta, 98 (1986) 339. [5] J. gest~ik, Some Thermodynamic Aspects of Glassy State, Thermochim. Acta, 95 (1985) 459. [6] J. Sestfik, Thermal Treatment and Analysis in the Preparation and Investigation of Different Types of
Glasses, J. Therm. Anal., 33 (1988) 789. [7] P. Holba and J. Sestfik, Kinetics of Solid State Reactions Studied at Increasing Temperature, Phys.
Chem. Neue Folge, 80 (1971) 1.

J. ~festdk/Thermochimica Acta 280/281 (1996) 175 190 189
[8] L. t~ervinka and A. Hrub~,, Structure of amorphous and glassy sulphides, J. Non-Cryst. Solids, 48 (1982) 231.
[9] H. Suga, Calorimetric Study of Glassy Crystals, J. Therm. Anal., 42 (1994) 331; Thermochim. Acta 245 (1994) 69.
[10] J. Sestak, The Role of Thermal Annealing during Processing of Metallic Glasses, Thermochim. Acta, 110 (1987) 427.
[11] M. Lasocka, Reproducibility Effects within Tg Region, J. Mater. Sci. 15 (1980) 1283. [12] E. Illekov& Generalised Model of Structural Relaxation of Metallic and Chalcogenide Glasses, Key
Engineering Materials, 81 83 (1993) 541. [13] J. Mfilek, Thermal Stability of Chalkogenide Glasses, J. Non-Cryst. Solids, 107 (1989) 323; J. Therm.
Anal., 40 (1993) 159. [14] M.C. Weinberg, Use of Saturation and Arrhenius Assumptions in the Interpretation of DTA DSC
Crystallization Experiments, Thermochim. Acta, 194 (1992) 93. [15] E.D. Zanotto, Isothermal and Adiabatic Nucleation in Glasses, J. Non-Cryst. Solids, 89 (1987) 361. [16] L. Granasy, Nucleation Theory for Diffuse Interfaces, Mater. Sci. Eng., A178 (1994) 121. [17] P. Demo and Z. Ko2i~ek, Homogeneous Nucleation Process; Analytical Approach, Phys. Rev. B: 48
(1993) 362. [18] E.A. Marseglia, Kinetic Theory of Crystallization of Amorphous Materials, J. Non-Cryst. Solids, 41
(1980) 31. [19] H. Yinnon and D.R. Uhlmann, Application of TA Techniques to the Study of Crystallization Kinetics
in Glass-Forming Liquids, J. Non-Cryst. Solids, 54 (1983) 253. [20] T. Kem~ny and J. Sest~tk, Comparison of Equations Derived for Kinetic Evaluations under Isothermal
and Non-lsothermal Conditions, Thermochim. Acta, 110 (1987) 113. [21] J. Mfilek, Applicability of JMAYK Model in Thermal Analysis of the Crystallization Kinetics of
Glasses, Thermochim. Acta, (in print 1995). [22] J. Sestfik, Diagnostic Limits of Phenomeuological Kinetic Models when Introducing an Accommoda-
tion Function, J. Therm, Anal., 37 (1991) 111. [23] J. Sestak, Application of DTA to the Study of Crystallization Kinetics of Iron Oxide-Containing
Glasses, Phys. Chem. Glasses 15 (1974) 137. [24] N. Koga and J. Sestfik, Thermoanalytical Kinetics and Physico geometry of the Nonqsothermal
Crystallization of Glasses, Bol. Soc. Esp. Ceram. Vidrio, 31 (1992) 185. [25] K. Matusita and S. Sakka, Kinetic Study of Non-lsothermal Crystallization of Glasses by DTA, Bull.
Inst. Res. Kyoto Univ., 59 (1981) 159 (in Japanese). [26] A. Marota, F. Branda and A. Buri, Study of Nucleation and Crystal Growth in Glasses by DTA,
Thermochim. Acta, 46 (1981) 123; 85 (1985) 231; J. Mater. Sci., 16 (1981) 341. [27] Q.C. Wu, M. Harmelin, J. Bigot and G. Martin, Determination of Activation Energies for Nucleation
and Growth in Metallic Glasses, J. Mater. Sci., 21 (1986) 3581. [28] C.S. Ray and D.E. Day, J. Am. Ceram. Sco., 73 (1990) 439; in M.C. Weinber (Ed.), Nucleation and
Crystallization in Liquids and Glasses, Ceram. Trans., Am. Ceram. Soc. 1993, p. 207. [29] N. Mingolo and O.E. Martinez, Kinetics of Glass Formation Induced by the Addition of Perturbing
Particles. J. Non-Cryst. Solids, 146 (1992) 233. [30] E. lllekova, K. Czomorova, F.A. Kunhast and J.M. Fiorani, Transformation Kinetics of FeCuNbSiB
Ribbons to the Nanocrystalline State, Mater. Sci. Eng. A:, in print, 1995. [31] L.C. Chert and F. Spaepen, Grain Growth in Microcrystalline Materials Studied by Calorimetry,
Nanostructured Mater., 1 (1992) 59. [32] J. Sest~tk, and J. Mfilek, Diagnostic Limits of Phenomenological Models of Heterogeneous Reactions
and Thermal Analsysi Kinetics, Solid State Ionics 63 65 (1993) 245. [33] S. Surinach, M.D. Baro, M.T. Clavaguera-Mora and N. Clavaguera, Kinetic Study of Isothermal and
Continuous Heating Crystallization Alloy Glasses, J. Non-Cryst. Solids, 58 (1983) 209. [34] J. Malek, Kinetic Analysis of Nonisothermal Data, Thermochim. Acta, 200 (1992) 257. [35] J. M{llek and J.P. Criado Empirical Kinetic Models in Thermal Analysis, Thermochim. Acta, 203
(1992) 25. [36] N. Koga, Mutual Dependence of the Arrhenius Parameters Evaluated by TA Study of Solid-State
Reactions: Kinetic Compensation Effect, Thermochim. Acta, 244 (1994) 1.

190 d. S~est6k/Thermochimica Acta 280/281 (1996) 175 190
[37] Z. Strnad and J. Sestfik, Surface Crystallization of 70SiO 2 30Al20 3 20ZnO Glasses, in Reactivity of Solids, (Proc. ICRS), Elsevier, Amsterdam, 1977, p. 410.
[38] J. Sestfik and J. Sestfikov~, Thermodynamic and Kinetic View of Transformation Processes in Glasses, in Thermal Analysis (Proc. ICTA), Heyden, Tokyo/London, 1978, p. 222.
[39] N. Koga, J. Sestfik and Z. Strnad. Crystallization Kinetics, in Soda-Lime Silica System by DTA, Thermochim. Acta, 203 (1992) 361.
[40] Z. Ko~,i~ek and P. Demo, Transient Kinetics of Binary Nucleation, J. Cryst. Growth, 132 (1993) 491. [41] A. Dobrewa and I. Gutzow, Kinetics of Non-Isothermal Overall Crystallization in Polymer Melts,
Cryst. Res. Tech., 26 (1991) 863; J. Appl. Polym. Sci., 48 (1991) 473. [42] M.C. Weinberg, Analysis of Nonisothermal Thermoanalytical Crystallization Experiments J. Non-
Cryst. Solids, 127 (1991) 151.

Crystal Nucleation and Growth inLithium Diborate Glass by Thermal Analysis
Nobuyoshi Koga*Chemistry Laboratory, Faculty of Education, Hiroshima University, Higashi–Hiroshima 739–8524, Japan
Jaroslav Sestak
Division of Solid-State Physics, Institute of Physics, Czech Academy of Sciences, CZ-162 00 Praha 6, Czech Republic
The kinetics of nucleation and crystal growth in a Li2B4O7
glass were investigated using differential thermal analysis(DTA) and differential scanning calorimetry (DSC). This meltforms a glass even when it is cooled at a very slow rate (2K/min). The temperature range of nucleation was determinedby comparing the heights of the exothermic DTA crystalliza-tion peaks for samples that were annealed at different temper-atures for a fixed time (10 min). Nucleation for this glassoccurred in the temperature region of glass transition, wherethe nucleation rate had a maximum value at;770 K. The realdetectable enthalpy change that was due to crystallizationoccurred at temperatures well above the temperature rangefor nucleation; hence, the temperature regions for nucleationand crystal growth were assumed to be well separated. Theglass sample with an almost-saturated number of nuclei, whichwas prepared by annealing at a temperature of 770 K for 10min while the melt was cooled, was subjected to DSC measure-ments at various heating rates (fh). The kinetics of crystalgrowth were analyzed via the conventional isoconversionmethod. For the sample without any annealing treatment, thenumber of nuclei for growth varied, depending on the thermalhistories within the temperature region for nucleation, whichwas characterized by the linear cooling rate (fc) of the meltand the linear heating ratefh of the glass. A kinetic approachthat considered the dependence of the number of nuclei onfc
and fh was applied to the crystal growth in the nonannealedglass. The three-dimensional growth of the preexisting nucleiwith apparent activation energies (E) of 315.66 4.6 kJ/mol forthe annealed glasses and 300.66 9.5 kJ/mol for the nonan-nealed glasses was determined. This agreement in the values ofE indicates that the change in the number of nuclei, dependingon fc and fh, can be treated successfully by the present kineticapproach for crystal growth.
I. Introduction
NUCLEATION and crystal-growth kinetics in melt-quenchedLi2B4O7 glass have been investigated using microscopic
measurement.1–4 Two different mechanisms of crystal growth—surface-nucleated growth and bulk growth—have been analyzedkinetically, near the glass-transition temperature and in a higher-temperature region, respectively.1,2,4 The surface-nucleated
growth and bulk growth for this glass indicated comparable ratesof linear growth near the glass-transition temperature.4
When the process of crystal growth in a glass is investigatedunder a programmed temperature change via thermal analysis(TA), the relationship between the nucleation and growth kineticsmust be characterized, to interpret the experimental data for theoverall kinetics of crystallization. When the temperature ranges ofnucleation and crystal growth are sufficiently well-separated, thedifferential thermal analysis/differential scanning calorimetry(DTA/DSC) crystallization exotherm can be assumed to occur as aresult of the growth of preexisting nuclei. In such a case, thenumber of preexisting nuclei for the subsequent growth is depen-dent on the thermal history of the glass sample in the temperaturerange of nucleation. Therefore, kinetic analysis for such a processmust be conducted by considering the number of preexistingnuclei. This type of kinetic approach to the crystal growth ofpreexisting nuclei has been proposed by modifying the conven-tional isoconversion methods5,6 and subsequently discussed in arigorous way.7–9 The modified isoconversion methods have beenapplied to the crystallization of as-quenched glasses by studyingthe change in the number of nuclei as a function of the appliedheating rate (fh). Further extension of the kinetic method thatincludes the effect of the cooling rate (fc) is required for glassesthat have been prepared by slowly cooling the melts, because,during glass formation, the sample may stay in the temperaturerange of nucleation long enough to allow the nuclei to form.
In the present study, criteria for the glass formation from theLi2B4O7 melt, the temperature range of nucleation, and thekinetics of the crystal growth in the as-prepared glass have beeninvestigated using DTA and DSC. The temperature range ofnucleation and the temperature of maximum nucleation rate havebeen determined by examining the DTA crystallization exothermof the sample that has been annealed at various temperatures for afixed time. The relationship between the crystal nucleation andgrowth processes is estimated on time scales of cooling theglass-forming melt and heating the glass sample. The process ofcrystal growth is analyzed kinetically by considering the thermalhistory of the glass sample.
II. Theoretical Details
(1) Number of Nuclei for Crystal GrowthAn ideal process of crystallization in glass is assumed, where
the random nucleation occurs in a low-temperature range and thesubsequent crystal growth proceeds independently in a higher-temperature range. For such a process, the overall rate of crystalgrowth is expected to be dependent on the number of preexistingnuclei, because no secondary nucleation is assumed to occur in thetemperature range of crystal growth. The number of preexistingnuclei per unit volume (N) varies with the thermal history of theglass sample within the temperature range for nucleation. When a
R. K. Brow—contributing editor
Manuscript No. 189717. Received November 30, 1998; approved December 21,1999.
Supported in part by the Grant Agency of Czech Republic (No. 104/97/0589).*Member, American Ceramic Society.
J. Am. Ceram. Soc.,83 [7] 1753–60 (2000)
1753
journal
glass-forming melt is cooled at a ratefc and the as-prepared glasssample is heated at a ratefh, the value ofN is expressed by thefollowing equation:6,7
N 5 E0
t
I ~T! dt 5 F~f! N0 (1a)
where
N0 5 ET1
T2
I ~T! dT 5 constant (1b)
I(T) is the steady-state nucleation rate at temperatureT per unitvolume andF(f) is a function offc and fh. Assuming that thenucleation behaviors that are observed while cooling the melt andheating the glass are identical,F(f) can be formalized for thefollowing three different cases:
(1) When a suitable nucleus-forming agent is added (hetero-geneous nucleation) or annealing within the temperature range ofnucleation is performed for a sufficiently long time, the glass isalmost saturated with the nuclei. The value ofN for growth isconstant, irrespective offc andfh:
N 5 constant (2a)
F~f! 5 constant (2b)
(2) If the glass-forming melt is rapidly quenched, the numberof nuclei in the as-quenched glass can be neglected. When theglass sample is heated at a ratefh, the time required to pass thetemperature range of nucleation is inversely proportional tofh:
N 5 S 1
fhDN0 (3)
whereF(f) 5 1/fh.(3) When the melt is cooled at a slow cooling ratefc and the
glass is heated atfh, the value ofN is influenced both byfc andfh:
N 5 S 1
fc1
1
fhDN0 (4a)
F~f! 51
fc1
1
fh(4b)
(2) Kinetic Equation for Crystal GrowthAssuming that an Arrhenius-type relationship for crystal growth
is valid in the temperature range of kinetic calculation, the rate oflinear advance of the crystallization interface (v(T)) can beexpressed as6,7
v~T! 5 v0 expS2 E
RTD (5)
where v0 is the preexponential factor andE is the activationenergy. The radius (r) of a crystal particle at timet is given as6,7
r 5 v0E0
t
expS2 E
RTD dt (6)
By considering the growth dimension and impingement of thecrystal particles, the following kinetic equation is derived:7
g~a! 5 @2 ln ~1 2 a!#1/m 5 ~Z0!1/mu (7a)
where
Z0 5 gNv0m (7b)
and
u 5 E0
t
expS2 E
RTD dt (7c)
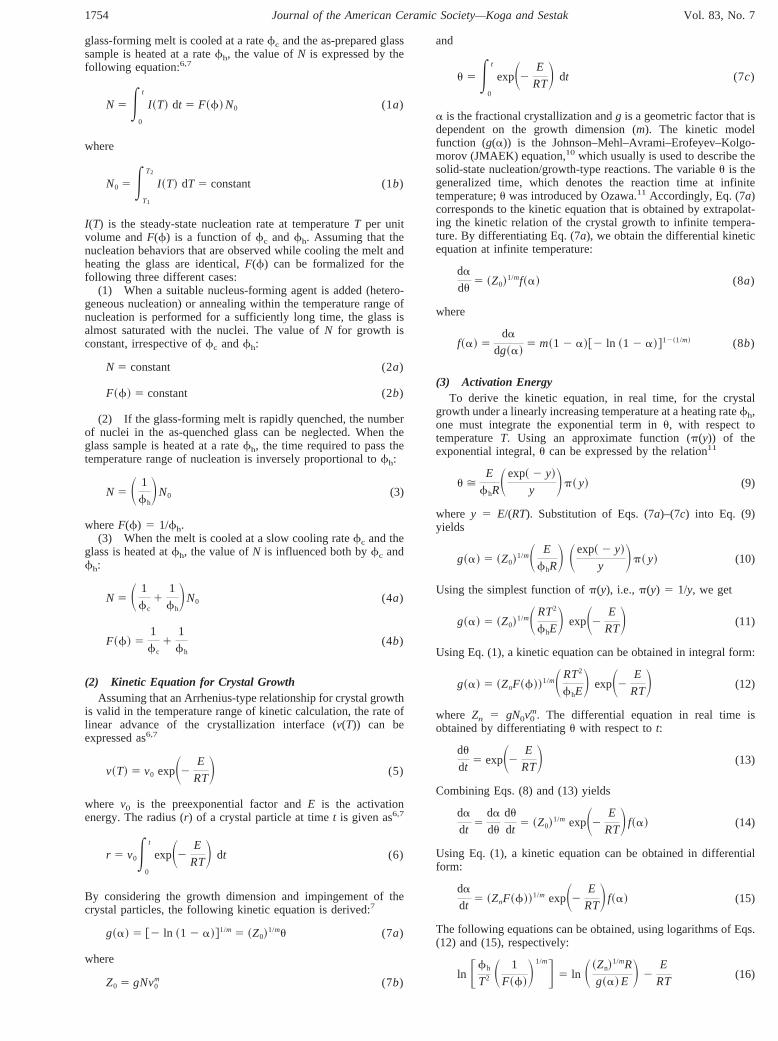
a is the fractional crystallization andg is a geometric factor that isdependent on the growth dimension (m). The kinetic modelfunction (g(a)) is the Johnson–Mehl–Avrami–Erofeyev–Kolgo-morov (JMAEK) equation,10 which usually is used to describe thesolid-state nucleation/growth-type reactions. The variableu is thegeneralized time, which denotes the reaction time at infinitetemperature;u was introduced by Ozawa.11 Accordingly, Eq. (7a)corresponds to the kinetic equation that is obtained by extrapolat-ing the kinetic relation of the crystal growth to infinite tempera-ture. By differentiating Eq. (7a), we obtain the differential kineticequation at infinite temperature:
da
du5 ~Z0!
1/mf~a! (8a)
where
f~a! 5da
dg~a!5 m~1 2 a!@2 ln ~1 2 a!#12~1/m! (8b)
(3) Activation EnergyTo derive the kinetic equation, in real time, for the crystal
growth under a linearly increasing temperature at a heating ratefh,one must integrate the exponential term inu, with respect totemperatureT. Using an approximate function (p(y)) of theexponential integral,u can be expressed by the relation11
u >E
fhRSexp~2 y!
y Dp~ y! (9)
where y 5 E/(RT). Substitution of Eqs. (7a)–(7c) into Eq. (9)yields
g~a! 5 ~Z0!1/mS E
fhRD Sexp~2 y!
y Dp~ y! (10)
Using the simplest function ofp(y), i.e.,p(y) 5 1/y, we get
g~a! 5 ~Z0!1/mSRT2
fhED expS2 E
RTD (11)
Using Eq. (1), a kinetic equation can be obtained in integral form:
g~a! 5 ~ZnF~f!!1/mSRT2
fhED expS2 E
RTD (12)
where Zn 5 gN0v0m. The differential equation in real time is
obtained by differentiatingu with respect tot:
du
dt5 expS2 E
RTD (13)
Combining Eqs. (8) and (13) yields
da
dt5
da
du
du
dt5 ~Z0!
1/m expS2 E
RTD f~a! (14)
Using Eq. (1), a kinetic equation can be obtained in differentialform:
da
dt5 ~ZnF~f!!1/m expS2 E
RTD f~a! (15)
The following equations can be obtained, using logarithms of Eqs.(12) and (15), respectively:
ln Ffh
T2 S 1
F~f!D1/mG 5 ln S ~Zn!
1/mR
g~a! E D 2E
RT(16)
1754 Journal of the American Ceramic Society—Koga and Sestak Vol. 83, No. 7

ln Fda
dt S 1
F~f!D1/mG 5 ln ~~Zn!
1/mf~a!! 2E
RT(17)
A series of kinetic curves measured at various heating ratesfh
for the sample that has been pretreated at various ratesfc andfh
are used to obtain the crystal-growth activation energyE. Usingkinetic data at a selected value ofa, which were obtained from aseries of kinetic curves, to which one of the models for nucleation(Eqs. (2)–(4)) is applicable,E can be determined by plotting theleft-hand side of Eq. (16) or (17) versus the inverse temperature(1/T), by determining the value ofF(f) and assuming a value form. These procedures of determining the value ofE can berecognized as an extended application of the isoconversion meth-ods in integral and differential forms.12 Application of Eq. (16) toa series of peak top temperatures of the crystallization exotherm atdifferent heating ratesfh is taken as an extended Kissingermethod.13 Practical applicability of the extended Kissinger methodalready has been examined, as exemplified by the crystallization ofLi2B4O7 glasses with different thermal histories.14 Similarly, thekinetic procedure based on Eq. (17) is taken as an extendedFriedman method.15 For the process with saturated nuclei, Eqs.(16) and (17) can be applied without consideringF(f) andm, aswas done in the conventional isoconversion methods.6,7,12
(4) Kinetic Model and Preexponential FactorUsing theE value that is determined by assuming a value ofm,
the experimental kinetic curves can be extrapolated to infinitetemperature. The values ofu and da/duat various values ofa canbe calculated using Eqs. (18) and (19), respectively:11,16,17
u >E
fhRSexp~2 y!
y Dp~ y! (18a)
where
p~ y! 5y3 1 18y2 1 86y1 96
y4 1 20y3 1 120y2 1 240y1 120(18b)
and
da
du5
da
dtexpS E
RTD (19)
The termp(y) is an approximate function that was proposed bySenum and Yang.18 Using Eq. (1), the kinetic equations at infinitetemperature (Eqs. (7) and (8)) can be rewritten as
g~a! 5 ~Zn!1/mun (20)
whereun 5 u(F(f))1/m and
S da
dunD 5 ~Zn!
1/mf~a! (21a)
with
S da
dunD 5
da
du S 1
F~f!D1/m
(21b)
Equations (20) and (21) indicate that the plots ofg(a) vs un and(da/dun) vs f(a) are linear if an appropriate value ofm is usedthroughout the kinetic analysis. The value of (Zn)
1/m is determinedfrom the slope of these linear plots.
Furthermore, multiplying Eqs. (20) and (21) together yields thefollowing equation:
S da
dunDun 5 Sda
duDu 5 f~a! g~a! (22)
This equation indicates that the value of (da/du)u is dependentonly ona. For the JMAEK equation, the value off(a)g(a) showsa maximum ata 5 0.632,19 irrespective ofm. Therefore, thevalidity of the above-described kinetic procedure, based on the
JMAEK equation, can be evaluated from the position of themaximum of the plot of (da/du)uvs a.
III. Experimental Procedures
(1) Glass FormingCrystalline Li2B4O7 was prepared via the thermal dehydration
of Li2B4O7z3H2O, which was identified by powder X-ray diffrac-tometry (XRD), Fourier transform infrared (FT-IR) spectroscopy,and Li/B chemical analysis. Approximately 8 mg of crystallineLi2B4O7 was weighed into a platinum crucible (5 mm in diameterand 2.5 mm in height). Using a simultaneous thermogravimetry/differential thermal analysis (TG-DTA) (Model TGD-9600, UL-VAC, Japan) apparatus that was equipped with an infrared imagefurnace, the sample was melted by heating up to 1225 K at aheating rate offh 5 30 K/min in flowing nitrogen gas (50mL/min) and then cooled below the glass-transition temperature,according to various temperature–time programs.
(2) Nucleation BehaviorTo investigate the nucleation behavior, DTA measurements
were performed using two types of temperature profiles:(1) While cooling the glass-forming melt at a rate offc 5 30
K/min, the sample was annealed at different temperatures in therange of 675–875 K for 10 min, as a nucleation treatment. Aftercooling at a rate offc 5 30 K/min to 625 K, which is;150 Klower than the glass-transition temperature, the glass sample wasimmediately reheated at a rate offh 5 30 K/min until thecrystallization was complete, as depicted by an exothermic DTApeak.
(2) After cooling the melt at a rate offc 5 30 K/min to 625K without any annealing treatment, the glass sample was heatedimmediately to a temperature of 675–775 K, where it was annealedfor 10 min, and then heated again atfh 5 30 K/min until thecrystallization was complete.
To determine the temperature range for nucleation and thetemperature for the maximum nucleation rate, the peak tempera-ture (Tp) and peak height ((dT)p) due to crystal growth wereinvestigated as a function of the annealing temperature.
(3) Crystal GrowthTwo types of glass samples with different cooling histories were
prepared: (i) while cooling the melt in the TG-DTA apparatus at arate of fc 5 30 K/min down to room temperature, nucleationtreatment was performed at a temperature of 770 K for 10 min; and(ii) the melt was cooled to room temperature in the TG-DTAapparatus at various cooling rates (fc 5 2–30 K/min) without anyadditional nucleation treatments.
The glass samples were placed into a heat-flux DSC apparatus(Model DSC-9400, ULVAC). DSC measurements were conductedat various heating rates (fh 5 2–30 K/min) in a helium gas flow(30 mL/min).
The glass samples that were prepared with the annealingtreatment are designated as preannealed glasses. Glass samplesthat were prepared without the annealing treatment are designatedas nonannealed glasses.
IV. Results and Discussion
(1) Glass FormationFigure 1 shows typical TG-DTA curves for the thermal behav-
ior of crystalline Li2B4O7z3H2O during several heating and cool-ing runs atfh 5 fc 5 10 K/min. The total mass loss during theinitial heating of Li2B4O7z3H2O was 24.4%6 0.3%, which was ingood agreement with the theoretical value (24.2%) that wascalculated by assuming the following dehydration reaction:Li2B4O7z3H2O3 Li2B4O7 1 3H2O. A broad exotherm just afterthe dehydration seems to be due to the crystallization of poorlycrystallized Li2B4O7. The decomposition product at a temperatureof 1125 K was identified as crystalline Li2B4O7, using XRD,
July 2000 Crystal Nucleation and Growth in Lithium Diborate Glass by Thermal Analysis 1755

FT-IR spectroscopy, and Li/B chemical analysis. The sharp endo-thermic peak at a temperature of 1183.96 0.3 K corresponds tothe melting of the Li2B4O7 crystals. Such thermal behavior for thedecomposition and melting of Li2B4O7z3H2O also has been re-ported by other researchers.20
In the temperature range of 755–790 K, detectable exothermicand endothermic shifts of the DTA trace were observed, when themelt was cooled and when the as-prepared glass was reheated,respectively, because of the glass transition (“(g)” in Fig. 1). Thesharp exothermic peak, upon subsequent heating, corresponds tothe crystallization of Li2B4O7 (“(c)” in Fig. 1). The endothermicpeak of melting of the crystallized Li2B4O7 is observed again at;1184 K (“(m)” in Fig. 1). The thermal behaviors of glassformation and devitrification were observed, even at a very slowrate of cooling and heating (i.e.,;2 K/min), and were unchangedduring the repeated cooling and reheating runs.
(2) Nucleation BehaviorFigure 2 shows typical DTA curves at a heating rate offh 5 30
K/min for the unannealed glass and for the glasses that have beenannealed for 10 min at 748, 763, and 783 K while the melt wascooled. The values ofTp and (dT)p both change as the annealingtemperature changes, whereas the peak area remains almostconstant (at;360.36 3.26 mVs/mg). The differences in 1/Tp or(dT)p for the annealed glass from those for the nonannealed glass(D(1/Tp) or D(dT)p) can be related to the number of preexistingnuclei in the glass samples, which are used empirically to draw thenucleation-like curves ofD(1/Tp) or D(dT)p versus the annealing
temperature.21–23 Such empirical procedures for estimating thenucleation-like curves also have been substantiated theoretically.24,25
Figure 3 shows the plot ofD(dT)p versus the annealingtemperature. The nucleation-like curve indicates a maximum at atemperature of;770 K. The temperature for the maximumnucleation rate, as determined in the present work, is;10 K lowerthan that which has been determined using microscopic measure-ments.3 The difference in the temperature, as determined byentirely different techniques, seems to be acceptable and shows
Fig. 2. Effect of annealing temperature on DTA crystallization peak fora Li2B4O7 glass; the annealing time was 10 min, and the DTA heating ratewas 30 K/min.
Fig. 3. (– – –) Nucleation-like curve drawn for the plot ofD(dT)p againstannealing temperature and (—) DSC curve for nonannealed Li2B4O7 glassat fh 5 30 K/min.
Fig. 4. Influence of annealing time at 770 K on the (—) height and (– – –)area of the DTA crystallization peak. Lines are drawn to guide the eye.
Fig. 1. Typical TG-DTA curves for the thermal behavior of crystalline Li2B4O7z3H2O during heating, cooling, and reheating at rates offc 5 fh 5 10K/min. Legend is as follows: “(d),” decomposition; “(m),” melting; “(g),” glass transition; and “(c),” crystallization.
1756 Journal of the American Ceramic Society—Koga and Sestak Vol. 83, No. 7

rather close agreement. Experimentally, comparable values ofD(dT)p were obtained for the samples that were annealed at aconstant temperature while the melt was cooled and the as-prepared glass was heated, which indicated the same nucleationbehavior during the cooling and the heating. As a reference, a DSCcurve for the nonannealed glass also is shown in Fig. 3. Thenucleation clearly occurs effectively in the temperature range ofglass transition, i.e.,T 5 755–790 K. The temperature range ofnucleation is separated satisfactory from that of crystal growth onthe time scale of TA measurements, because the DSC crystalliza-tion exotherm is observed at.840 K.
Figure 4 shows the change inD(dT)p, relative to the annealingtime at 770 K, while the melt was cooled at a rate offc 5 30
K/min. The value ofD(dT)p shows a maximum at 10 min, and thepeak area decreases when the annealing time increases to.10min. These findings indicate that the crystallization occurs par-tially when the sample was annealed for.10 min; this observationalso is expected from the fact that the crystal growth does occurnear the glass-transition temperature.4
(3) Crystal GrowthFigures 5 and 6 show typical kinetic curves for the crystal
growth, which have been derived from DSC traces for thepreannealed and nonannealed glasses, respectively. For the prean-nealed glass, the kinetic curves shift systematically to higher
Fig. 5. Typical kinetic curves for crystal growth in the preannealed glass.
Fig. 6. Typical kinetic curves for crystal growth in the nonannealed glass.
July 2000 Crystal Nucleation and Growth in Lithium Diborate Glass by Thermal Analysis 1757

temperatures as the heating ratefh increases. A variety of kineticcurves are obtained for the nonannealed glass, depending onfc
andfh. It is apparent that, in the nonannealed glass, the number ofnuclei for the crystal growth changes, depending onfc and fh,whereas an almost-saturated number of nuclei exists in thepreannealed glass. Despite such changes in the shape and temper-ature of the exothermic peak of DSC traces, the enthalpy change ofthe crystallization remains unchanged, irrespective of the heating/cooling rate (fc and fh) that was applied: the average enthalpychange is252.96 1.9 kJ/mol.
Under the assumption that the number of nuclei for crystalgrowth in the preannealed glass remains constant, irrespective ofthe heating ratefh, the conventional isoconversion method isapplicable to determine the apparent value ofE for crystal growth.Figure 7 shows typical Friedman plots15 for the crystal growth inthe preannealed glass at several selected values ofa. An approx-imately linear correlation of the Friedman plot, relative to thecorrelation coefficient of linear-regression analysis (g , 20.99),was observed in a wide range ofa values (a 5 0.05–0.95). TheEvalues that were calculated from the slope of the Friedman plots atvariousa values (a 5 0.20–0.80, in steps of 0.01) are practicallyunchanged (315.66 4.6 kJ/mol).
When applying the isoconversion method to the nonannealedglass, the change in the number of preexisting nuclei for the crystalgrowth, depending onfc and fh, should be considered, as isformalized by Eq. (17). By assuming a value ofm, the plots of ln((da/dt)/F(f)1/m) vs 1/T at various selecteda values were exam-ined for crystal growth in the nonannealed glass, in addition to theconventional Friedman plots. These plots indicated fairly goodlinearity, irrespective of the value ofm that was applied. Figure 8compares theE values that were calculated from the conventionalFriedman plot and from Eq. (17) with differentmvalues. Althoughthe value ofE decreases slightly as the value ofa increases, thechange is within65% of the average value. When the conven-tional Friedman plot was applied, the value ofE, averaged over arange ofa 5 0.2–0.8, was 231.06 9.3 kJ/mol, which was notconsistent with that obtained for the preannealed glass. Thisobservation indicates that a false value ofE is obtained if thechange in the number of nuclei is not considered. When a value ofm 5 3 was assumed in Eq. (17), the best agreement of theE valuewith that for the preannealed glass was observed: an averageEvalue of 300.66 9.5 kJ/mol (fora 5 0.2–0.8) was observed,which suggested three-dimensional (3-D) growth of the nuclei.
The rate behavior of the crystal growth in the preannealed glasswas reproduced at infinite temperature by extrapolating the ratedata according to Eq. (19), withE 5 315.6 kJ/mol. Figure 9 showsthe rate behavior of the crystal growth in the preannealed glass atinfinite temperature, as a plot of da/du vs a. The error barsindicate the standard deviation of the data, calculated from thekinetic data at different heating ratesfh. In Fig. 10, the values ofda/du were plotted versusf(a) for different values ofm, accordingto Eq. (8). A linear correlation, as predicted by Eq. (8), wasobtained only form 5 3, which again indicates that this glasscrystallizes via a 3-D growth mechanism.
Similarly, the kinetic data of the crystal growth in the nonan-nealed glass were extrapolated to infinite temperature by assuminga value ofm and the corresponding value ofE, according to Eqs.(19) and (21). Figure 11 represents the rate behavior of the crystalgrowth in the nonannealed glass at infinite temperature, as a plotof (da/dun) vs a. The shapes of the curve change slightly as theassumed value ofmchanges. Figure 12 shows the plots of (da/dun)vs f(a) with different values ofm. The plot withm 5 3 gives thebest linearity, which, in turn, indicates the validity of the apparentvalue ofE 5 300.66 9.5 kJ/mol, as determined by the extendedFriedman method by assuming a value ofm 5 3.
Fig. 7. Typical Friedman plots for crystal growth in the preannealedglass. Dashed curves indicate the kinetic curves at respectivefh values.
Fig. 8. Apparent values ofE, calculated from conventional and extended Friedman plots by assuming various values ofm for the crystal growth in thenonannealed glass.
1758 Journal of the American Ceramic Society—Koga and Sestak Vol. 83, No. 7

According to Eq. (22), the suitability of the JMAEK equationfor describing the present crystallization mechanism can be eval-uated by plotting (da/du)uvs a, as shown in Fig. 13. Both plots,which are derived from the series of kinetic data for the prean-nealed and nonannealed glasses, show the peak maximum ata 50.61, which closely agrees with the theoretical position of themaximum for the JMAEK model, i.e.,a 5 0.632. The above-described examinations imply that the kinetics of the crystal
growth of Li2B4O7 are described satisfactorily by the kineticequation based on the JMAEK model, where the 3-D growth of thepreexisting nuclei is estimated by the activation energy of theinterface advance (;300 kJ/mol).
V. Conclusion
Li2B4O7 glass can be prepared by cooling the glass melt, evenat a very slow cooling rate (e.g.,fc ' 2 K/min). The glass-transition region of this glass was observed in the temperaturerange of 755–790 K, using differential thermal analysis anddifferential scanning calorimetry, followed by the crystallizationexotherm that was initiated at.800 K with an enthalpy change of252.9 6 1.3 kJ/mol. The peak temperature and height of thecrystallization exotherm at a selected heating rate (fh) bothchanged as the annealing temperature changes while the melt wascooled and also while the as-prepared glass was heated. Thetemperature range for nucleation, as estimated from the depen-dence of the peak height on the annealed temperature, corre-sponded closely to the temperature range of glass transition; themaximum nucleation rate appeared at a temperature of 770 K.Also, the temperature range of crystal nucleation was separatedsatisfactorily from that of crystal growth on the time scale ofpresent thermal analysis runs within a heating rate offh 5 2–30K/min. Accordingly, the crystallization exotherm was assigned tothe crystal growth of the preexisting nuclei, where the number ofnuclei changes depending on the thermal history of the samplebefore the crystallization.
Fig. 9. Plot of da/duvs a for crystal growth in the preannealed glass.
Fig. 10. Plots of da/duagainstf(a) with various values ofm for crystalgrowth in the preannealed glass. Solid line is the linear-regression line forthe plot atm 5 3.
Fig. 11. Plots of (da/du)/F(f)1/m vs a, at variousm values, for crystalgrowth in the nonannealed glass.
Fig. 12. Plots of (da/du)/F(f)1/m vs f(a), at variousm values, for crystalgrowth in the nonannealed glass. Solid line is the linear-regression line forthe plot atm 5 3.
Fig. 13. Plots of (da/du)uvs a for crystal growth in the preannealed andnonannealed glasses.
July 2000 Crystal Nucleation and Growth in Lithium Diborate Glass by Thermal Analysis 1759

Kinetic analysis of the crystal growth was performed for twodifferent series of kinetic data: for preannealed and nonannealedglasses. For crystal growth in the preannealed glasses, the conven-tional isoconversion method was applied to obtain the apparentactivation energy (E), because an almost-saturated number ofnuclei exists in the sample, irrespective of the heating ratefh thatis applied. To apply the isoconversion method to the nonannealedglasses, a correlation of the change in the number of nuclei,depending on the values offc andfh in the kinetic equation, isrequired. From the conventional and extended isoconversionmethods, the apparent values ofE—315.66 4.6 and 300.66 9.5kJ/mol, respectively—were determined for the crystal growth inthe preannealed and nonannealed glasses, respectively. This agree-ment of theE values indicates that the change in the number ofnuclei, depending onfc and fh, was treated successfully by theextended isoconversion method. By analyzing the rate behavior ofthe crystal growth that was reproduced at infinite temperature, thegrowth of the preexisting nuclei has been concluded to occur threedimensionally, in both the preannealed and nonannealed glasses.
References
1S. R. Nagel, L. W. Herron, and C. G. Bergeron, “Crystal Growth of Li2B4O7,”J. Am. Ceram. Soc.,60 [3/4] 172–73 (1977).
2L. W. Herron and C. G. Bergeron, “Heat-Flow-Controlled Growth during Li2B4O7
Crystallization,”J. Am. Ceram. Soc.,62 [1/2] 110–11 (1979).3G. L. Smith and M. C. Weinberg, “Crystal Nucleation in Lithium Diborate Glass,”
Phys. Chem. Glasses,32 [2] 37–42 (1991).4G. L. Smith and M. C. Weinberg, “Crystal Growth in Lithium Diborate Glass”; pp.
141–49 in Ceramic Transactions, Vol. 30,Nucleation and Crystallization in Glassesand Liquids. Edited by M. C. Weinberg. American Ceramic Society, Westerville, OH,1993.
5K. Matusita and S. Sakka, “Kinetic Study on Crystallization of Glass byDifferential Thermal Analysis -Criterion on Application of Kissinger Plot,”J.Non-Cryst. Solids,38/39, 741–46 (1980).
6K. Matusita, T. Komatsu, and R. Yokota, “Kinetics of Non-isothermal Crystalli-zation Process and Activation Energy for Crystal Growth in Amorphous Materials,”J. Mater. Sci.,19, 291–96 (1984).
7T. Ozawa, “Nonisothermal Kinetics of Crystal Growth from Preexisting Nuclei,”Bull. Chem. Soc. Jpn.,57, 639–43 (1984).
8T. Kemeny and J. Sestak, “Comparison of Crystallization Kinetics Determined byIsothermal and Nonisothermal Methods,”Thermochim. Acta,110, 113–29 (1987).
9N. Koga and J. Sestak, “Thermoanalytical Kinetics and Physico-geometry of theNonisothermal Crystallization of Glasses,”Bol. Soc. Esp. Ceram. Vidr.,31 [3]185–90 (1992).
10J. Sestak,Thermophysical Properties of Solids. Elsevier, Amsterdam, TheNetherlands, 1984.
11T. Ozawa, “A New Method of Analyzing Thermogravimetric Data,”Bull. Chem.Soc. Jpn.,38 [11] 1881–86 (1965).
12T. Ozawa, “Estimation of Activation Energy by Isoconversion Methods,”Thermochim. Acta,203, 159–65 (1992).
13H. E. Kissinger, “Variation of Peak Temperature with Heating Rate in Differen-tial Thermal Analysis,”J. Res. Natl. Bur. Stand. (U.S.),57 [4] 217–21 (1956).
14N. Koga, K. Yamaguchi, and J. Sestak, “Crystallization Kinetics of LithiumDiborate Glass by DTA,”J. Therm. Anal. Calor.,56, 755–61 (1999).
15H. L. Friedman, “Kinetics of Thermal Degradation of Cha-Forming Plastics fromThermogravimetry, Application to a Phenolic Plastic,”J. Polym. Sci.,Part C, 6,183–95 (1964).
16J. Malek, “The Kinetic Analysis of Nonisothermal Data,”Thermochim. Acta,200, 257–69 (1992).
17N. Koga, “Kinetic Analysis of Thermoanalytical Data by Extrapolating to InfiniteTemperature,”Thermochim. Acta,258, 145–59 (1995).
18G. I. Senum and R. T. Yang, “Rational Approximation of the Integral of theArrhenius Function,”J. Therm. Anal.,11, 445–47 (1977).
19J. M. Criado, J. Malek, and A. Ortega, “Applicability of the Master Plots inKinetic Analysis of Non-isothermal Data,”Thermochim. Acta,147, 377–85 (1989).
20M. Touboul and E. Betourne, “LiB2O3(OH)zH2O as Precursor of Lithium BoronOxide LiB2O3.5: Synthesis and Dehydration Process,”Solid State Ionics,63/65,340–45 (1993).
21A. Marotta, A. Buri, F. Branda, and S. Saiello, “Nucleation and Crystallization ofLi2Oz2SiO2 Glass—A DTA Study”; pp. 146–52 in Advances in Ceramics, Vol. 4,Nucleation and Crystallization in Glasses. Edited by J. H. Simmons, D. R. Uhlmann,and G. H. Beall. American Ceramic Society, Columbus, OH, 1982.
22C. S. Ray and D. E. Day, “Determining the Nucleation Rate Curve for LithiumDisilicate Glass by Differential Thermal Analysis,”J. Am. Ceram. Soc.,73 [2]439–42 (1990).
23X. J. Xu, C. S. Ray, and D. E. Day, “Nucleation and Crystallization ofNa2Oz2CaOz3SiO2 Glass by Differential Thermal Analysis,”J. Am. Ceram. Soc.,74[5] 909–14 (1991).
24M. C. Weinberg, “Interpretation of DTA Experiments Used for Crystal Nucle-ation Rate Determinations,”J. Am. Ceram. Soc.,74 [8] 1905–909 (1991).
25K. F. Kelton, “Estimation of the Nucleation Rate by Differential ScanningCalorimetry,”J. Am. Ceram. Soc.,75 [9] 2449–52 (1992). M
1760 Journal of the American Ceramic Society—Koga and Sestak Vol. 83, No. 7


JMAYK- AND NGG- CRYSTALLIZATION KINETICS OF METALLIC
MICRO-, NANO- AND NON- CRYSTALLINE ALLOYS
Emília Illeková, Jaroslav Šesták
Institute of Physics,, Slovak Academy of Sciences, Dúbravská cesta 9, SK-845 11 Bratislava, Slovakia; Email: [email protected]
New Technology - Research Center in the Westbohemian Region, University of West Bohemia, Univerzitní 8, CZ- 306 14, Plzeň, Czech Republic; Email: sestak @fzu.cz,
1. Introduction to metallic glasses The kinetic spotlight of crystallization [1-4] has been studied to a large extent by preceding crucial studies (e.g. [1-50] and books [51-65] arranged chronologically) as well as by numerous papers published on a specific subject of metallic glasses within the recent years (e.g. [66-89]). This chapter, however, provides no inventory attempt to assess all of them [50] though the metallic glasses are intensely remaining as a yet active area of research due to various characteristic peculiarities of its crystallization kinetics. A new methodological approach for the kinetic analysis has been practiced being based on the complexity of both the isothermal and the continuous heating modes [13-19]. They are disproportional in its form of integral examinations, where especially the Suriñach’s curve fitting procedure [22,35,71] was found useful and worth introduction and profitable employment [32-37]. The crystallization kinetic parameters have been determined and followed by the concluding interpretation upon assuming certain mechanisms, which are deduced within the scope of both modes: the classical (nucleation-and-growth abbreviated as JMAYK) and the alternative (normal-grain-growth abbreviated as NGG) kinetic laws. Results are a part of a current systematic investigation of the thermodynamic stability and crystallization of the series of Pd-Si, Fe-Co-B, Fe-Si-B and Al-based metallic glassy samples casted in the form of ribbons. Results have been generalized for a variety of rapidly quenched metallic ribbons from a binary metal-metalloid up to the multi-component metallic alloys established in relation to the kinetics of their crystallization. The as-quenched slices have been divided into two types, namely the conventional metallic glasses and the multi-component precursors for the nano-crystalline alloys. The forerunner samples of the foregoing kinetic analyses are quickly quenched melts [24,32-37,52,57,60,90-95] employing rapid solidification (cooling rates ~105 K/min). The method called planar-flow casting technique was applied in our laboratory [91,92] fabricating the metallic ribbon-shape samples (thickness ~ 20-35 μm, width ~ 6–30 mm, length of several m). Slowly cooled samples (cooling rate < 102 K/ min) providing a bulk-shape metal-metalloid and multi-metallic alloys with the dimension >1mm were additionally produced. The as-quenched ribbons did not manifest the presence of any crystallinity. After their thermoanalytical examination, the resultant species were nanocrystalline or partially crystalline heterogeneous composites. 2. General reviewing of crystallization kinetics
The classical theory of crystallization of solids/liquids [1-4] is briefly revised even though the pervasive extent of crystallinity can often be detected already before the completion of devitrification into the undercooled liquid state of metallic glasses. Generally

saying, crystallization typically occurs by two independent but inter-correlated elementary events, i.e., nucleation and growth, each of them being controlled by either mechanisms: diffusion of atoms (or movable units) to, through, or out of the liquid (or glassy matrix) crystal interface and surface chemical reaction (i.e., incorporation of reacting units into and out of the interface). Nucleation may be homogeneous or heterogeneous, or there may be pre-existing nuclei of various natures (homogeneous or heterogeneous, internal or surfacial, cf. Table I). Growth may be primary, eutectic or polymorphic [10,21]. For a partially transformed material, in which the transformed regions, i.e. the crystalline grains, are randomly dispersed, the volume fraction transformed x is related to the extended volume fraction xex [1-3,39,24,51-65], When introducing the impingement concept, i.e. that the impingement of two growing grains causes the cessation of their growth, we obtain a traditional exponential proportionality x = 1- exp (- xex ) where xex is easily derivable in the customary isothermal case as shown in comprehensive literature [51-65]. The same treatment, however, can be extended to any exposed thermal regime (such as a non-isothermal common during DTA/DSC measurements) when assuming temperature-dependent integration [13-19]. Such a distinctive case was analyzed in more details by Kemeny and Šesták [19] yielding the concealed but anticipated fact that that the non-isothermal equivalent of the isothermally derived JMAYK relation is mathematically almost correspondent differing just by the integration-dependent multiplying constant, which is reliant to the means of approximation of the temperature integral [58-61]. Table I: Common mathematical expressions for variety of nucleation rates [44,52,61] nucleation rate law differential form integral form nucleation type (I = dN/dT) (N) exponential kN0e-kt N0(1 - e-kt) single-step constant rate kN0 kN0t single-step instantaneous ∞ N0 single-step power Zwt(w-1) Ztw multistep
where N is the number of growth nuclei present at time, t, and k is the rate constant (of nucleation kN), w is the heating rate and Z is a complex parameter consisting of No(kt)w/w.
Routinely proceeding xex = (4π/3) N0u3t3 for spherical crystals with radii growing in
time t at a constant rate u on a fixed number of nuclei per unit volume N0 of already existing sites. When nucleation occurs at a constant frequency per unit volume, i.e., with a constant nucleation rate I, then xex = (π/3) Iu3t4. The extended volumes are additive, so for a material with both the pre-existing and new nuclei sites we can write, x = 1 – exp [ - (π/3) u3 (4N0t3 + It4)]. (1) Commonly, isothermal kinetics of crystallization of metals is evaluated using the generalized Johnson-Mehl-Avrami-Yerofeeyev-Kolmogorov (JMAYK) relation, which is accepted as the rate equation for most types of interface-controlled crystallization as well as the approximate rate equation in the case of the diffusion-controlled crystallization.

αT(t) = 1 – exp [- (kTt)n] (2) where α(t) is the dimensionless extent of a transition in time t or, more commonly, the kinetic degree of conversion (crystallization) α (0 ≤ α(t) ≤ 1), kT is the overall rate constant (including both the growth rate and the nucleation rate), and n is a parameter (often called Avrami exponent) that depends on the mechanism of crystallization by the way shown given in Table II [5,52,58]. Generally n = nI + nu where nI and nu are the nucleation and growth Avrami parameters. Endowing with that claim that the temperature range is not too large, the temperature dependence of kT is thought to obey an Arrhenius type of exponential equation k(T) = A exp (-ΔE+/RT) where both the pre-exponential term A and the Arrhenius activation energy ΔE+ are temperature independent and R is the customary gas constant. The empirical activation energy ΔE+ is a weighted sum of the basic nucleation and growth ones, e.g. ΔE+ = (nI ΔEI
+ + nu ΔEu+) / (nI + nu). (3)
A detailed discussion directed to the crystallization (of metals and alloys) can be found in source paper (Hulbert [4], Köster [10], Greer [9,20], Kelton [11,39], Illekova [32-35], Khawam and Flanagan [44]) and also in various books (Burke [51], Christian [52], Köster [57], Šesták [58-59]). At temperatures at which atomic mobility is noticeable, local rearrangements of the various atomic species occur simultaneously as a result of thermal agitation following thus the classical theory of homogeneous nucleation. In the state of non-equilibrium glass or an undercooled liquid (below the melting temperature T < Tm), these embryonic regions become of considerable importance because they are a potential source of nuclei ready for a change to a more stable structure. The embryos for crystallization are assumed to be internally uniform and have the same structure, composition and properties as the final product phase in bulk form, e.g., the crystals. The Gibbs free energy of formation of an crystalline embryo of radius r, is ΔG(r) = 4/3πr3ΔGcr-l + 4πr2γ + ΔGelast + ΔGdeform, (4) Table II: Specific values of kinetic power exponents Polymorphic changes, interface growth n Diffusion controlled growth n Increasing nucleation rate, 3-D growth Constant nucleation rate, 3-D growth Decreasing nucleation rate, 3-D growth Zero nucl. rate (saturation) 3-D growth, Constant nucl. rate, 2-D (plate) growth Zero nucl. rate, 2-D (plate) growth Cont. nucl. rate (saturation), 1-D growth Zero nucl. rate, 1-D (needle) growth
>4 4 3-4 3 3 2 2 1
Increasing nucl. rate, 3-D growth Constant nucl. rate, 3-D growth Decreasing nucl.rate, 3-D growth Constant nucl. rate, 2-D growth Zero nucleation rate, 3-D growth Constant nucl. rate, 1-D growth Zero nucleation rate, 2-D growth Zero nucleation rate, 1-D growth
>2.5 2.5 1.5-2.5 2 1.5 1.5 1 0.5
in which ΔGcr-l = < 0 for T < Tm is the difference between the Gibbs free energy of a crystal and a liquid (or a glass) per unit volume of a crystal being thus the driving force for crystallization, γ > 0 is the interfacial energy per unit area of the crystal-liquid interface ( assumed independent of the interface curvature r). ΔGelast and ΔGdeform are respectively the evolved elastic strain energy and lattice deformation energy often administered to be neglected in the instance of crystallization of metallic glasses. ΔG(r) passes through a maximum, which is denoted by W being the work (or energy) of formation of a stable embryo (traditionally named as nucleus) at a radius rc , which is the critical nucleus size. Growth of

embryos smaller than rc leads to an increase in G(r) and thus there is a distinctive predisposition for such embryos to disappear rather than grow; only embryos larger than rc are stable (taking already the shape of crystalline grains) because their growth is accompanied by a decrease in Gibbs energy G(r). Differentiation of eq. (4) with respect to r reads as rc = -2γ /ΔGcr-l so that W = (16πγ3)/(3ΔGcr-l
2). An embryo of radius rc has an equal chance of shrinking or growing and it becomes a nucleus when gaining one or more atoms. The nucleation rate or the number of nuclei that appear per unit volume of a liquid (or a glass) per unit time (under a steady state condition) is then Is = NV Ns pN ν exp [-(ΔGD’
+ +W)/(RT)] = I0 exp [-ΔGN+/(RT)], (5)
where NV is the number of sites per unit volume at which embryos can form, Ns is the number of atoms in the matrix at the surface of the critical embryo, ν is the frequency of vibration of these atoms, and pN is the probability that a vibration realizes in the direction of the embryo and ΔGD’
+ is the activation Gibbs free energy of the jump process across the embryo/liquid interface (Generally noting, no distinction is made in the text between activation Gibbs free enthalpy ΔG+, activation enthalpy ΔH+ and activation energy ΔE+ since this distinction was not done in many older papers in the field. Besides, a particular activation entropy ΔS+ could formally be integrated into the particular pre-exponential term).
Heterogeneous nucleation taking place on impurity surfaces can be modeled in a similar way to homogeneous nucleation, where the work of formation of critical nuclei Whet
can be generally reduced in a great extent according to the angle of contact θ (as for example shown in ref. [13, 51]), Whet = W (2 + cosθ)(1 - cosθ)2/4 . In the classical theory the transient nucleation effect can occur because all clusters of the nucleation phase, i.e., the nuclei are factually assembled ‘molecule-by-molecule’ and thus do not arise by single large fluctuations. Consequently during nucleation, there exists a distribution of cluster sizes. In a steady state the nucleation rate can subsist only if the steady state of size distribution can be established. Attending the steady state, transient effects can arise in nucleation and during the devitrification transient nucleation effects are particularly significant because of low atomic (or molecular) mobility. When a glass is formed at a given quenching rate, which is greatly exceeding the critical quench necessary for glass formation, the population of crystal clusters in the initial glass may be negligible. In such a case there exist single form analytical approximations for nucleation kinetics [51,58] I(t) = Is (t - θ) or = Is exp (-θ /t) or = Is exp [1 + 2 ∑p=1
∞ (-1)p exp( -p2t /θ )] (6) where Is is the steady state nucleation rate, t is the total experimental time, θ is the effective time lag (or better induction time) and p is an integer. However, a wide variety of transient nucleation behavior is observable in the presence of quenched–in clusters. Then nucleation cannot be characterized by a single time lag and a numerical approach is necessary to follow the each particular case.
Growth of a stable nucleus takes place by the thermally activated transfer of atoms from the liquid (or glass) to the crystal lattice causing the interface to advance through the initial phase. The basic atomic process is analogous to diffusion. In the case of the polymorphic transformation type of crystallization the reaction interface involves just the movement of individual atoms across the short distances (characterize by ΔGD’’
+). When dealing with a eutectoid formation and precipitation (primary crystallization), when a composition changes are accommodated, the crystallization is accomplished by the long distances transport of various kinds of atoms (characterized by ΔGD
+). In any case the rate of

growth depends upon the relative rates of the interface reaction and diffusion and becomes only constant if the former is vastly slower than the latter. Then, taking into account the concept of activation states and the forward-and-backward interface reactions, the empirical (Turnbull) expression for the linear (or constant) rate of the growth of the crystalline phase u is (being in general use for the crystallization of amorphous metals)
u = VatNspuνε exp[-ΔGD’’
+/(RT)]{1–exp[ΔGcr-l/(RT)]}≈- u0ΔGcr-l/(RT) exp[-ΔGu+/(RT)], (7)
where Vat is the volume of one atom (or the moving element) and ε is the accommodation coefficient for the crystal, pv and ΔGD’’
+ are the probability and the activation Gibbs free energy of the jump process across the crystal/liquid interface. {-ΔGcr-l/(RT)} term simplifies the exponential in curled brackets in eq. (7) for |ΔGcr-l| << RT.
The Arrhenius-like expressions defining I0, u0, ΔGN+ and ΔGu
+ as the nucleation and crystal growth rate pre-exponential terms and the activation energies are merely apparent because of considerable temperature (and particularly undercooling) dependences of various embraced parameters. In general, it follows from eqs. (5) and (7) that both I and u are zero at Tm (when ΔGcr-l = 0) and also at T = 0 K (when pN = pu = 0), attaining their maxima at some intermediates temperature. Further
γ(T) = -(β / Κ′) ΔHcr-l(T) (Vmol / Na )1/3, (8) where the constant β ~ 0.43 (depicted for metals), Κ′ is an interface quality factor, Vmol is the molar volume of the substance and Na is the Avogadro number. At the undercooling, ΔT = T – Tm < 0, and when assuming that both the enthalpy and entropy of crystallization are constant material parameters being equivalent to the melting ones, ΔHcr-l = -ΔHm and ΔScr-l = -ΔSm = -ΔHm/Tm, then ΔGcr-l(T,ΔT) = ΔHcr-l - ΔScr-l T= ΔHm ΔT / Tm. (9) In general, the JMAYK kinetic law (eq. 2) with the time-dependent nucleation and growth rates, I(t) and u(t), and under the assumption that the density of nuclei N(t) = N0 +∫0
t I(t′) [1-α(t′)]dt′, (i.e., eliminating the impingement effects for nucleation, see e.g. [51,58]) is α(t) = 4π/(3V).{N0 [∫0
t u(t′) d t′]nu + ∫0t I(t′) [1-α(t′)].[ ∫t′t u(λ) dλ]nudt′}. (10)
If assuming that the growing nuclei do not overlap (e.g. [39]) it reads 1/{ln [1- α(t)]} = 4π/(3V).{N0 [∫0
t u(t′) d t′]nu + ∫0t I(t′)[ ∫t′
t u(λ) dλ]nudt′}. (11) Although neither of these versions of the JMAYK expression accounts for a real impingement, the numerically fitted material kinetic parameters more-or-less confirm the validity of this JMAYK model for many cases of metallic glasses. For instance it is the simultaneous surface and volume crystallization of glassy ribbon of Pd82Si18 or even the crystallization of glassy Fe80B20 [11,9] if the growth rate is allowed to vary with drawing direction. A very limited studies have been done on the quantitative modeling of primary crystallization kinetics in the case of partitioning two-component metallic systems, in which the varying composition of both the clusters and the remaining untransformed glass has to be accounted for [40,74] as well variable mobility, i.e., so called soft-impingement

Alternatively to the JMAYK (nucleation-and-growth crystallization process), the NGG normal-grain-growth of extremely fine crystalline grains (coalescence process, were suggested for the condition of nano-crystal formation in certain metallic foils [12]. In the normal-grain-growth process, larger grains in the already crystalline material increase their size at the expense of smaller grains. The driving force for this process provides the decrease in the interfacial enthalpy, i.e, H(t) = H0 r0 / r(t), where H0 and r0 respectively are the initial interfacial enthalpy and the initial average grain radius (embryos dimension of approximately several angstroms being thus experimentally “invisible”). The increase in the average grain radius r(t) is controlled by the following kinetic equation [7] dr(t) /dt = K(T) / [m r(t) (t)m-1] , (12) where the grain growth rate constant K(T) has the Arrhenius-like temperature dependence K(T) = AGG exp [-ΔE+
GG /(RT)]. (13) Here m is the grain growth exponent (depending on the mechanism of the coalescence by the way given in Table III)., AGG and ΔE+
GG being the pre-exponential factor and activation energy, respectively. Because the evolution of the total interfacial enthalpy is related to the measured DTA/DSC signal y(t) = dH(t)/dt as H(t) = H0 + ∫0t y(t’) dt’ = H0 [1 – α(t)], (14) the NGG integral kinetic equation is [7] [1 - α(t)]m = τGG(T) /[t + τGG(T)], (15) where the time constant τGG(T) is related to the rate constant K(T) as τGG(T) = r0
m(T) / K(T).
Table III. Values of m in NGG kinetic law αT(t) = 1 – [(r0m τGG )/(t + r0
m τGG)]1/m
mechanism controlling grain growth m
pure system all 2
impure system
coalescence of second phase by lattice diffusion 3 coalescence of second phase by grain boundary diffusion 4 solution of second phase 1 diffusion through continuous second phase 3 impurity drug (low solubility) 3 impurity drag (high solubility) 2
3. Simplified model solutions: JMAYK, NGG and SB equations
As shown above the crystallization kinetics is traditionally evaluated in terms of a simple JMAYK equation in the comprehensive form of ln (1-α) = {k(T) t}n where the robust

exponent n possess partial values regarding its derivative form ( ) ( )[ ]pg ααα −−−= 1ln1)( as revealed in Table IV. [5,58]:.
Table 1V. Dimensionality within nucleation-growth laws n nuclei growth ⇒ ⇓
Growth dimension
Interface reaction Eapp =
Diffusion controlled Eapp =
Instantaneous nucleation from fixed sites
1-D n=1, EG n=0.5, ED/2 2-D n=2, 2 EG n=1, ED 3-D n=3, 3 EG n=1.5, 3 ED/2
Constant rate of homogeneous nucleation
1-D n=2, EG + EN n=1.5, ED /2 + EN 2-D n=3, 2 EG + EN n=2, ED + EN 3-D n=4, 3 EG + EN n=3, 3 ED /2 + EN
Associated conventional analysis of the basic JMAYK equation also shows [5] that the overall values of activation energies, Eapp, (usually determined on the basis of DTA/DSC, measurements, ≅ EDTA), can be roughly correlated on the basis of the partial energies of nucleation, EN, growth, EG and diffusion, ED. It follows that Eapp = (a EN, + b d EG)/(a + b d), where the denominators (a + b d) equal the power exponent, n, of the integral form of JMAYK equation and the coefficients a and d indicate the character of nucleation velocity and the growth dimension. The value of b corresponds to 1 or ½ for the movement of the growth front controlled by chemical boundary (chemical) reaction or diffusion, respectively, as shown in the Table IV [5].
A simple preliminary test of the JMAYK applicability to each studied case is worth of mentioning. The simple multiple of temperature, T, and the maximum reaction rate, dα/dt, which should be confined to the value of 0.63 ± 0.02 [61,66], can be used to check its suitability. Another handy test is the value of shape index, i.e., the ratio of intersections, b1 and b2, of the in inflection slopes of the observed peak with the linearly interpolated peak baseline, which should show a linear relationship of the kind b1/b2 = 0.52 + 0.916 {(Ti1/Ti2)-1}, where Ti’s are the respective inflection-point temperatures [28].
Another related useful correlation can provide interrelation between the experimental activation energy, EDTA, and those for shear viscosity, Eη, on the basis of the relative constant width of Tg, (i.e., difference between the onset and outset temperatures). It reveals a rough temperature dependence of the logarithm of shear viscosity on the measured temperature, T, using the simple relation log η = 11.3 + {4.8/2.3 Δ(1/Tg)}(1/T – 1/Tg) [29].
However, the JMAYK relation bears its analytical integral form where the term {-ln (1- α)}P (P related to the original form of JMAYK through the relation P = (1-1/n) can be mathematically converted to another simpler function, αM, through an expansion in the infinite series and then recombined and converted back. The resulting two parameter differential form with fractal exponents N and M, αM (1-α) N, is identical to the Šesták-Berggren (SB) equation [46], which has been widely used throughout kinetic examinations resulting in abundant literature on transformation kinetics [50]. This logistic-like equation consists of two essential but counteracting parts, the first responsible for the fortility, αM, (i.e., product formation) and the other for mortality, (1-α)N, (i.e., reagent disappearance resembling thus an extended reaction-order concept ≅ (1-α)N), forming together an “autocatalytic” effect. Such a SB equation has, however, no analytical form for its integral version, but is conventionally exploited in those cases where the standard JMYAK equation fails to provide reasonable values of the power exponents loosing thus its desired diagnostic role and

providing mere data fitting. Nevertheless this SB equation has become a convenient method of kinetic evaluation [46,47-50] often employed as an alternative of the JMAYK equation. For example, if a solid is involved with acting interfaces the formation and growth of nuclei are described by dα/dt = k α 2/3 (1 – α) 2/3, generally as k α x (1 – α) y with the solution mentioned already by Kolmogorov [1] assuming x = ½, 2/3, ¾, 4/5, …, 1 to give y = 0.774, 0.7, 0.664, 0.642, …., 0.556, respectively. Malek [28] showed that for these JMAYK exponents 0→1.5→2→3 the SB exponents M-N keep on the succeeding values of 0-1→0.35-0.88→0.54-0.83→0.72-0.76. Such a phenomenological description of crystallization kinetics was expansively applied for glasses of chalcogenide alloys [95-101] which range, however, lies beyond our transcript. Assessment mostly aroused from the zero value of the second derivative at the inflection point of an experimental α-T curve providing thus a useful dependence, often called Kissinger plot. It is known since 1957 [102] and from that time extensively cited with various modifications and reproves [103-108] showing the basic relation between the ratio of heating rate w and the temperature of that inflex point, Tp, bestowing the activation energy E, which is one of the most quoted kinetic figures. Its meaning, however, may become questionable [47] and concurrent thermal methods [48] may not provide analogous results.
Worth mentioning, however, is an apparent correspondence of the so-called NGG mechanism [7] to that of phase boundary reactions [4,58,61] exhibiting a single value (of comparable reaction order N), which is a relevant option to the JMAYK crystallization kinetics. Though introduced by Atkinson [7] in late eighties it became not so renowned but again can be regarded as a special case of SB equation where M is equal zero. The involved term (1–α)n+1/(n ro
n) is likewise the phase-boundary model (but including the symbol ro for the initial grain radius), which is mostly applicable for a case of longer-range diffusion. The kinetics of the NGG-like type has been effectively applied by Illekova [32-37] (particularly noting her chapter “Kinetic characteristic of nanocrystal formation in metallic glasses” in ref. [43]). It factually reflects the process of coarsening of the microcrystalline phases, justifiable in most cases of nano-crystalline glass-ceramics (like ‘finemets’) when the final mean grain size is below 10 nm. When comparing with JMAYK-caused DSC/DTA peaks, the shape of analogous NGG-caused DSC/DTA exothermic peak becomes different with an atypical symmetry with little shifts of the apexes along with the increasing heating rate. The discrepancy results from rationales arising from the differences in JMAYK and NGG modes of modeling. The process of pre-annealing has also different consequences increasing the initial micro-grain radius, thus shifting the onset of the NGG peak to higher temperatures and leading to a narrower transformation range.

Figure 1a: left, overlapping and validity broadening of three individual sorts of models (D-diffusion, A-JMAYK nucleation-growth and F and R- NGG boundary reactions). Right the interrelation of the robust JMAK exponent r related to the SB exponents m and n .
Worth noting is the treaties by Ozao and Ochiai [61,108] assuming an arbitrary
position of the particle fractal size (r) in the D-dimension (fractal) agglomerates where the diffusion flux (dN/dt) may become constant irrespective of r, i.e., ≈ ΔN {-ln (r/ro)}-1 or ≈ ΔN {r(2-D) – ro
(2-D)}-1 for D=2 and 2<D≤3, respectively. This provides modified models of diffusion such as D4 in the form of dα/dt ≈ {(1-α)(2-D)/D – 1] or can apply to the growth (JMAYK) models with the fractal exponent (D-1)/D as (1-α)1 {- ln (1-α)}(D-1)/D . By a simple substitution of D’s with the integers 1,2 and 3 we match the standard equations listed previously [61].
4. Crystallization kinetics of metallic glasses
In classical multi-component metallic glasses, the crystallization is characterized by a sequence of crystallization steps, R1, R2, R3,… and until recently it is an unresolved questions whether all of the steps (especially the first step R1) are always taking place in the whole body of the sample (i.e. questioning the homogeneity in the one-component glassy precursor or the matrix) or only in its separated parts (i.e., the problem of dimensionality of the heterogeneities [32,33,109] in the two-cluster model [32,33,109,110]. Commonly, the higher values of activation energies for crystallization indicate the viscous-flow-dependent mechanism; they eventually decrease with increasing temperature or with increasing degree of conversion [37]. This might suggest occurrence of some changes in the mobile structural units (as for the crystallization of the amorphous matrix [37]) or some modification in either rates controlling the elementary process (as for the FINEMET-type ribbons in the case of JMAYK kinetics [33]) or being in charge of the proportion between the individual processes in the complex transformation [37]. In general, the nucleation-and-growth crystallization (JMAYK kinetics) with several characteristic peculiarities has been active in the case of conventional metallic glasses [36,37,109] for long. However, the application of JMAYK kinetics completely fails in a specific group of rapidly quenched ribbons, which implicate nano-crystallization, as in the case of nicknamed group of materials like FINEMETs, NANOPERMs, HITPERMs or even some other Al-based alloys [32,33,109,110]. In a broader-spectrum, the mathematical formalism of the normal-grain-growth crystallization (GG kinetics [7]) can interpret exclusively the experimental data in the case of stable nano-crystal formation in rapidly quenched ribbons [109,110]. In the case of the primary crystallization of some metallic ribbons some diffusion reactions might take place, too, if the change of the chemical composition in the non-crystalline matrix was indicated (the so called ‘softening effects’) [32,33,109,110]. 4.1. Peculiarities in the JMAYK-like crystallization kinetics of conventional metallic glasses
Glassy Fe-Si-B ribbons are of great technological importance because of their functional magnetic properties. In addition, they represent a basic glass-forming material for multi-component alloys formed upon crystallization of a extremely fine crystalline phase, best known as FINEMETs. (The mutual ratio of the elements in the glassy matrix of the FINEMET corresponds approximately to Fe75Si15B10 [37].)
A series of both the hypoeutectic and the hypereutectic Fe-Si-B compositions as a source for quenched non-crystalline ribbons (namely Fe80SixB20-x with x = 2, 4, 6, 8 and 10 and Fe75Si15B10) , were prepared by planar flow casting method technologically providing

750 770 790 810 830 850 870Temperature ( K )
-7.5
-5.0
-2.5
0.0
Hea
ting
pow
er (
W g
)
-1
.
.
T =793 K, t = 0 min0.5
1
as-q
1.52
2.53
a a
0 100 200 300 400 500 600Time (s)
2.2
2.4
2.6
2.8
Hea
t pow
er (
mW
)
.
0 400 800 1200Time (s)
0.0 0.4 0.8 1.2 1.6 2.0-ln (1 - )
-0.8
-0.4
0.0
0.4
ln [f
( )]
.
I I I I I I II0.2 0.4 0.6 0.8
α
α
α
R2
their 10 mm width and approximately 25 μm thickness. Their kinetics of crystallization was examined using DSC and high precision electrical resistivity measurements [36,37]. The initial amorphous state and the corresponding phases after the crystallization were observed using transmission electron microscopy (TEM) and x-ray diffraction (XRD) analysis.
Fig. 1. Effect of pre-annealing on the continuous heating DSC curve of the crystallization of Fe75Si15B10 ribbon (the pre-annealing temperature Ta = 793 K; the pre-annealing time ta is the parameter; heating rate w+ = 40 K min-1) [37]. Fig. 2. Isothermal DSC crystallization curves at various temperatures Ta of the as-quenched glassy Fe75Si15B10 ribbon. For Ta =803 K (– – – –) and 793 K (——) the upper time scale holds. For Ta = 783 K (-.-.-.-) and 773 K (…….) the lower time scale holds. The symbols (x) mark the partial crystallization effects produced by the pre-annealing heat treatments for the measurements shown in Fig. 1 [37].
The whole of Fe-Si-B-based glasses with composition in the mentioned region of interest crystallize usually in a two-step crystallization reaction due to their thermal activation taking place in the course of continuous heating or isothermal annealing. The two extensive exothermal reactions are related within the two different phase transformations. Their eventual overlap, the relation between both the enthalpies and also the kinetics of R1 and R2 transformations depends on the actual chemical composition and thermal history of the samples (w+, Ta, pre-annealing). As a typical example (shown in Fig. 1.), one large and sharp thermal effect appears closely followed by the smaller secondary one (at the heating of w+ = 40 K min-1 ), which is well visible for Fe75Si15B10 ribbon. Both DSC exotherms have slightly slower leading edges than the trailing ones. Any pre-annealing shifts both peaks to lower temperatures significantly decreasing their enthalpies. Also in the isothermal mode, the DSC curves show two exothermal effects as is seen in Fig. 2. Both isothermal transformations are temperature dependent significantly shortening their time by increasing the temperature.

Figs. 3 (a) and (b). The Suriñach plots for R1 and R2, respectively, both for the isothermal and continuous-heating crystallization peaks of the as-quenched glassy Fe75Si15B10 ribbon and the theoretical curves obtained for the JMAYK kinetic equation with the exponents n1 = 2.5 in the case of R1 and n2 = 3 in the case of R2, respectively. Full lines are the theoretical curves. Symbols are the experimental data for the isotherm at Ta = 773 K (▲), 783 K (▼), 793 K (x), 808 K (●); and the continuous heating at 40 K min-1 (+) (the connecting dashed line is a guide to the eye for + symbols) [37].
The kinetics of the R1- and R2- DSC effects was studied by the complex kinetic analysis [37]. Accordingly, in order to test the relevancy of JMAYK nucleation–growth
kinetics to study R1 and R2 crystallization steps of the as-quenched Fe75Si15B10 ribbon, the Suriñach curve fitting procedure [22] was employed. All measured curves (from Figs. 1 and 2) were used resolving that all measured data for both crystallization steps could be unambiguously characterized by the JMAYK kinetics (Figs. 3 (a) and (b)). In the case of R1, Suriñach graphs follow one master curve; however, the value of its JMAYK exponent n1 is not constant. In the early stages, n1 alternates steeply revealing the transient nucleation effect reaching the value of n1 = 2.5 (see the central part of the transformation). Later n1 continuously decreases reflecting thus the probable saturation of nucleation and in the dynamic measurements also the influence of the secondary crystallization step. In the case of R2, the transformation can be well characterized by single JMAYK exponent (n2 =3).
Figs. 4 (a) and (b) show the dependence of the activation energy on the evaluation method (DSC kinetic analysis applied to the crystallization of respective steps R1 and R2), in the as-quenched Fe75Si15B10 glassy ribbon. (1) The Kissinger activation energy ΔE+
K, (2) the Arrhenius method activation energy calculated for the isothermal peak maximum ΔE+
A,α=0.45, (3) and (4) the iso-conversional continuous heating and isothermal activation energies ΔE+
Ich and ΔE+Ii, respectively, (5)
the isothermal Suriñach method activation energy ΔE+S. Horizontal bars - the width of the temperature
interval taken into account; vertical bars – the error of the presented mean value [37] .
500 520 540 560Temperature (K)
440
460
480
500
520
Activ
atio
n en
ergy
(kJ
(g a
tom
) )
-1
12
35
.
.
4
760 780 800 820 840 860Temperature (K)
280
320
360
400
Activ
atio
n en
ergy
(kJ
(g a
tom
) )
-1
12
3
4
5
..
R1 R2
0.0 0.4 0.8 1.2 1.6 2.0-ln (1 - )
-1.2
-0.8
-0.4
0.0
ln [f
( )]
.
I I I I I I II0.2 0.4 0.6 0.8
α
αα
R1

The heating rate dependence of the maximum for R1 crystallization peak [111] is specified by the activation energy ΔE+
K1 = 473 ±13 kJ mol-1 (as-quenched Fe75Si15B10 ribbons). However, the temperature dependent Kissinger slope [102] revealed some peculiarities in R2 mechanism with an average activation energy ΔE+
K2 = 395 ±14 kJ mol-1. The value of ΔE+
S1 = 484 ±3 kJ mol-1is independent of Ta, and ΔE+S2 is decreasing from 384
to 293 kJ mol-1 with increasing Ta (found from the vertical shift between the Suriñach plots of DSC isothermal R1 and R2 peaks [35]). The isothermal Arrhenius method (consequential of eq. 2) is providing ΔE+
A1,α=0 = 651 ±67 kJ mol-1, ΔE+A1,α=0.45 = 480 ±5 kJ mol-1and ΔE+
A1,α=1 = 417 ±3 kJ mol-1. Both isothermal and continuous heating iso-conversional methods [111] (ΔE+
Ii1(α) in Fig.5 in [37] and ΔE+Ich1(α)) revealed systematic acceleration for R1
transformation with advanced time. ΔE+2(α) kept a constant value during the whole R2
transformation, As is typical for the case of the crystallization of Fe-Si-B ribbons [36] the above-
mentioned results demonstrated that the determined activation energies are dependent on the measuring regime and the method of kinetic analysis applied. These quantities are summarized in Figs. 4 (a) and (b). It can be seen, that they agree within the experimental error for both R1 and R2 stages. Nevertheless, on the bases of these absolute values and their error
bars (as well as in accordance with the results of the TEM and XRD analyses) the following interpretation has been formulated [37].
Concerning the Fe75Si15B10 ribbon, the crystallization of two types of micro-crystals, namely the homogeneous nucleation and growth of <b.c.c> Fe(Si) (or alternativelyFe3Si) and also composite crystals consisting <b.c.c> Fe(Si) nucleating heterogeneously and growing on the surface of the previously formed orthorhombic Fe3B microcrystalline cores, is proceeding in the R1 crystallization step. The relative proportions of these two types of micro-crystals are dependent on the temperature. The apparent activation energy of this primary crystallization ΔE1
+ = f(α1) and the Avrami exponent n1 = f’(α1) are independent of temperature and they decrease with increasing α1 during R1 and with the pre-annealing (namely n1 decreases from 2.5 to 1.5) promoting thus the formation of the orthorhombic Fe3B grain-cores. The decay of the nucleation and the three-dimensional diffusion controlled growth of the composite are the prevailing mechanisms in the advanced stages of the R1 transformation (for α1 > 0.6). During the R1 crystallization step the chemical composition of the matrix continuously changes to reach the eutectic one. Finally, following the R2-DSC peak, the primary metastable Fe3B cores of the composites transform in to the stable Fe2B micro-crystals. Simultaneously, the remaining amorphous matrix (certainly, if any) crystallizes by the eutectic reaction forming the Fe3Si and Fe2B eutectic structure. The apparent activation energy ΔE2
+ = f’’(T1) decreases with increasing temperature of the primary R1 reaction and the content of boron in the crystallizing pseudobinary eutectics decreases. The parameters ΔE2
+ and n2 = 3 are constant during the R2 transformation.
Concerning all Fe-Si-B/based ribbons [36], physical properties such as the Curie poins, R1 and R2 crystallization temperatures, partial and total crystallization heats or activation energies, show monotonous tendency along with the increasing silicon content up to 8 at. % Si, culminating for the sample with 10 at % of Si. However, for the 15 at % Si the values become significantly different. JMAYK kinetic exponents are almost constant (n1 = 2.5 or 1.5 and n2 = 4 or 3) reflecting alternatively a probable exhaustion of nucleation sites (Tab.1 in Ref. 36).
Generally speaking [36], crystallization kinetics, chemical composition and the morphology of arising phases strongly depend on the mutual ration of components in the

amorphous alloy. The investigated region of interest is divided in to the eutectic through the hypoeutectic up to the hypereutectic parts (when respecting to boron content cB). The R1 crystallization step for hypoutectic compositions corresponds to the formation of α-Fe(Si) crystals; the remaining amorphous matrix transforms during the R2 step to α-Fe(Si) and stable tetragonal Fe2B. For hypereutectic compositions the R1 step of crystallization is characterized by formation of crystals of metastable Fe3B. Due to changes in local ordering of atoms the α-Fe phase nucleates and grows on their surface forming the so-called ‘composite crystals’ [36]. The R2 step of crystallization for these compositions besides the transformation of eventually remaining amorphous matrix corresponds to the transformation of metastable borides into stable Fe2B and α-Fe. The local fluctuations of silicon concentration seem to be very important for the understanding of this process, particularly taking place during the phase transformations of the Fe-Si-B system. The application of the so-called ‘local ordering’ (double-cluster model) based on the role of silicon seems to be justifiable for the explanation of crystallization reactions observed. The determining factor is the co-called critical silicon concentration ccrit
Si = ¼ (1 - 5 cB); above this value silicon causes changes in local ordering of atoms increasing thus the preference for the nucleation and growth of α-Fe(Si) phase [36]. 4.2. Kinetics of nanocrystal formation in FINEMETs
Nano-crystalline alloys with the composition close to Fe73.5Cu1Nb3Si13.5B9 (FINEMET®) have attracted technological and scientific interest extensively owing to their attractive properties as the soft magnetic materials. It is known that Cu and Nb affect not only the chemical short-range order in the resulting nano-crystalline structure but also the transformation kinetics of this structure. In numerous studies (by XRD, TEM, Mössbauer spectroscopy, as well as microprobe analysis) of the FINEMET the phase analyses revealed (see references in [33,109,110] the presence of the crystalline iron-based silicon phase as well as the remainder of the amorphous phase with a reduced content of silicon. The nano-crystalline α-Fe(Si) phase with a mean grain size of 10-20 nm has the DO3 structure of Fe3Si with a silicon content of 16-22 at.% [33]. On the contrary there still have been contradicting conceptions about the transformation kinetics of the FINEMET-like precursors (as a rapidly quenched ribbon) to the nano-crystalline state. JMAYK kinetics has traditionally been assumed; however, an unusually low exponent n ≈ 0.5 and numerous other irregularities were observed [33,36].
Following the continuous heating measurements by DSC, the main transformation (R1 = Rnano) in the as-quenched Fe73.5Cu1Nb3Si13.5B9 ribbon (the thick line in Fig. 5) starts at Tx,nano = 816 K. The exothermal peak is wide, asymmetrical, with a long high temperature tail. Before the beginning of the next pronounced exothermal anomaly (R2 at Tx2 = 957 K) another less energetic exothermal transformation R1’ is superimposed, which is associated with changes of some magnetic properties of the material. This effect can be separated from R1 by the isothermal heat treatment [33]. Any heat treatment of the sample at temperature Ta close to Tx,nano, or even at much lower temperatures in the range of pronounced structural relaxation effects, shifts the main transformation exotherm to higher temperatures diminishing its total enthalpy as is exhibited in Fig. 5. These observations are utterly conflicting the classical JMAYK crystallization kinetics (represented by Fe-Si-B glasses in Fig. 1) where the heat-treatment at Ta ≈ Tx1 shifted the R1 peak to lower temperatures diminishing thus the associated Avrami exponent. At Ta < Tx1-50 K it was not influencing the peak position neither enthalpy nor the kinetic mechanism of the crystallization.

Fig. 5. (Right) Effect of pre-annealing on the continuous heating DSC signal of Fe73.5Cu1Nb3Si13.5B9 ribbon during the main transformation to the nano-crystalline state (the pre-annealing temperature is Ta and the pre-annealing time is ta being the parameters and the heating rate w+ = 40 K min-1 [33]. Fig. 6. (left) Isothermal DSC traces (first runs) at various temperatures Ta of as-quenched Fe73.5Cu1Nb3Si13.5B9 ribbon representing the transformation to the nano-crystalline state (Ta being the parameter). The dotted line is the baseline obtained as a 2nd run under identical conditions after finishing the main transformation; it was shifted down to be seen in the picture [33].
In the case of the isothermal regime of the main transformation in the Fe73.5Cu1Nb3Si13.5B9 ribbon, the unusual measurements are reported in ref. [32,33,109] and usually accredit to the work by Illeková.. After a steep negative increasing, the isothermal DSC signal is monotonically approaching zero (see Fig. 6). Such decaying signals (or apparent exothermal peaks) were measured at Ta from 783 to 823 K the interval of which exceeds substantially the usual 25 K interval, where the R1 crystallization peak of metallic glasses is conveniently observed by the isothermal DSC technique (compare Fig. 2). Almost no change in the position of this main exothermal effect along with the temperature has ever been monitored. Only the changes of amplitude and slightly of the total enthalpy were detected.
In order to report both the continuous heating and the isothermal experimentation with respect to the interpretation of kinetics of the main transformation R1 in various Fe-Cu-Nb-Si-B ribbons the DSC was carried out and related to such a kinetic treatment revealing the peculiarities of nano-crystalline construction. Therefore various samples were measured with changeable content of Cu (between 0 and 1 at. %), of Nb( between 0 and 4.5 at.%) and of the Si/B ration (between 0 and 1.5) [110]. In the R1 transformation, the nano-crystalline α-Fe was formed (the case of the FMCu0Si0 and FMSi0 samples - concerning the names follow Table V) with the mean grain size d < 10 nm. In the other samples, which contained more than 1 at. % of Si, the component α-Fe(Si) appeared with increasing tendency to DO3 ordering with increasing Si content and fine-grained structure (with d ~ 10 nm). Therefore, all above mentioned samples are collectively named FINEMETs in all further citations. In the sample FMNb0, larger micro-crystals (d > 100 nm) grow similarly the case of conventional metallic glasses, discussed in the previous paragraph.
730 770 810 850T [ K ]
0.000
0.375
0.750
1.125
1.500
Hea
t pow
er [
W g
]
-1.
.
120
2010
532
T = 788 K, t = 1 minas-q T = 753 K
t = 80 min
aa
a
a

Fig. 7. (Left) Continuous heating DSC signal from the main transformation process of various as-quenched Fe-Cu-Nb-Si-B ribbons. 1-FMCu0Si0, 2-FMSi0, 3-FMSi4.5 (dashed line 3’’ refers to the isothermally pre-annealed at 713 K for 200 min sample), 4-FMSi7, 5-FMSi79.2, 6-FMCu0Si12.7, 7-FMSi13.5, 8-FMNb0. The chemical compositions of the samples are in Tab. V. The crystallization stages R1, R’
1 and R2 are related to the DSC exothermal peaks for some samples. The heating rate is 40 K min-1. The vertical scale for the sample FMNb0 (curve 0) is shrunk by the factor of 4. [110]. Fig. 8. (Right) Isothermal DSC traces from the main transformation process of various as-quenched Fe-Cu-Nb-Si-B alloys. 61-FMCu0Si12.7 (813 K), 81-FMNb0 (698 K), 11-FMCu0Si0 (763 K), 31-FMSi4.5 (713 K), 32-FMSi4.5 (723 K), 71-FMSi13.5 (778 K), 72-FMSi13.5 (823 K). The chemical compositions of the samples are in Tab. V. [110].
Fig. 7 and Fig. 8 show the continuous heating and isothermal DSC dependencies of all investigated samples. The shape of these curves does not depend on w+ (excepting its horizontal shift) and it is slightly modified with Ta. In the case of FM Cu0Si12.7, the R1 peak occurs above 860 K. In all samples, excepting the FMNb0, the DSC continuous heating R1 peak is wide, asymmetrical, with longer high temperature part (Fig. 7); any pre-annealing at a temperature below the main transformation shifts the R1 peak to higher temperatures (the same as in Fig. 5). The quantitative characteristics of R1 peaks are summarized in Table V. The onset and minimum temperatures Tx1 and Tp1 vary with the actual chemical composition. They are significantly higher in the samples without Cu. All main transformation enthalpies ΔH1 are less than one-half of the enthalpy of the first crystallization peak of the Fe75Si15B10 metallic glass (104 Jg-1 in [37]). These quantities are also proportional to the content of the crystalline product. The Kissinger activation energies ΔE+
K1 are less significant because of their dependence on the heat treatment and the used measuring technique [33]. In addition, another minor transformation stage R1’ occurs before the termination of R1 peak (as is shown in Fig. 7 for FMSi4.5 or in [33] for FMSi13.5). At higher temperatures, the second complex
760 800 840Temperature [ K ]
Hea
t pow
er
.
.
2 W
/g
0
6
7
5
4
3
2
1
8 W
/g
3",
R1
R1
R1
R1
R1
R1
R1
R2
R1'
0 20 40 60Time [min]
Hea
t pow
er
.
.
8
1
3
3
7
7
0.4
W/g
1
1
1
1
1
2
2
2
2
6

exothermal peak R2 always stays on due to the additional growth of grains and crystallization of the remaining amorphous matrix. The isothermal main transformation curves have a bimodal character (Fig. 8), i.e. the DSC signal is continuously decaying simultaneously manifesting a superimposed exothermal peak in special cases. The mutual relation between both effects is strongly dependent on temperature due to a typical Ta dependence of the peak mode suggesting the JMAYK kinetics, whereas the decay mode (suggesting the normal-grain-growth (GG) or coalescence kinetics as will be shown in Fig. 10 and Fig. 11) is relatively insensitive to Ta (see curves 31 and 32 for the sample FMSi4.5). At lower temperatures, Ta ~ Tx1 – 50 K mainly the peak mode was detected (curve 61) whereas at higher temperatures, Ta > Tx1 –10 K, only the decay mode could be detected (curve 72). Besides, the enthalpic proportion between the GG-like and JMAYK-like modes is strongly related to the chemical composition of samples.
The above-mentioned character of R1 transformation cannot be interpreted by any of the conventional JMAYK crystallization kinetics [5,35,51,52,61,95]. As an example, the isothermal DSC curves from Fig. 8 (excepting curve 81 which represents FMNb0 sample) cannot be linearized using the Avrami linearization method (see Fig. 9) even by subtracting any incubation time τJMA. The slope of the Avrami plot shows a systematic artificial decrease from 4 to 3 in the case of a TA curve with a large JMAYK-mode participation, finally dropping to 1.5 in the case that the peak-mode provides less significant contribution. Otherwise, the slope of the Avrami plot rapidly decreases after a short time giving an extremely low apparent exponent n1 < 1. The last mentioned case is the most frequent and characteristic mode in the instance of FINEMETs. However, the spherulitic shape of the nano-crystals and the fact that the new grains do still appear also in the advanced stage of the main transformation can hardly be interpreted by any simple step JMAYK nucleation-and-growth kinetics with exponent n = nI + 3nu ≤ 1.
Fig. 9. Linearized Avrami representation of the isothermal DSC traces and presented in Fig. 8. are shown for the main transformation of various as-quenched Fe-Cu-Nb-Si-B ribbons. 7’
1 and 3’2 –refer
to the separated peaks only. [110].
2 3 4 5 6 7ln (ta - ) [ s ]
-6
-4
-2
0
2
ln (
-ln (1
-
) )α
.
3
7
1 3 7 8
6
τJMA
0.008
0.018
0.13
0.63
α
1
1
1
1
1
2
2, ,

Fig. 10. Suriñach plots [22,71], which are showing the difference between the JMAYK-like and GG-like modes in the main transformation of the as-quenched Fe-Cu-Nb-Si-B ribbons. The isothermal data are taken from Fig. 8. 32-FMSi4.5 (723 K), 3’
2- FMSi4.5 separated peak only, 72-FMSi13.5 (823 K), 3’’ refers to the continuous heating run of isothermally pre-annealed at 713 K for 200 min FMSi4.5 sample (data are from Fig. 7). The curves are shifted to show the maxima at the same level. Dashed lines are the plots for the theoretical JMAYK kinetics with n = 4 and 2 and GG kinetics with m = 1. [110] . Fig. 11. Suriñach representations of the continuous heating DSC curves (presented in Fig. 7) derived from the main transformation of as-cast Fe-Cu-Nb-Si-B ribbons. The FMNb0 sample is marked. The curves are shifted to show the maxima at the same level. Dashed lines are the plots for the theoretical JMAYK kinetics with n = 4 and 1.1 and GG kinetics with m = 1. [110].
Besides, the nanocrystal formation reveals the bimodal character in the isothermal regime. In Fig. 10, our hypothesis of the participation of several independent processes in the R1 step in FINEMETs (two modes of the main transformation R1 and the participation of the R1’ step) is evidenced and the influence of this fact on the deduced kinetic laws for the decomposed individual processes is demonstrated. The Suriñach curve fitting procedure was used. Thus for the example FMSi4.5, the Suriñach plot [22,35] follows the GG-like kinetics [7] with m1 = 1 for α1 < 0.2, then the kinetics continuously changes (when the peak starts to appear in the DSC signal) fitting well the JMAYK-like one with n1 = 3 and finally with n1 = 2 for α1 >0.5 for the curve 32 from Fig. 8 in Fig. 10. On the other hand, The Suriñach plot representing just the extracted peak from the same curve 32 (after the appropriate baseline subtraction [110]) fits only one mode having the JMAYK kinetics with n1 = 2 for all α1 (see curve 3’
2 in Fig. 10. Concerning the other DSC curves containing the peak mode, the JMAYK exponents vary between 3 and 1.5 depending on the composition of individual samples (they are summarized in Table 3).
0.0 0.4 0.8 1.2 1.6 2.0-ln ( 1 - )
-1.5
-1.0
-0.5
0.0
0.5
ln [
f ( d
/d
t ) ]
αα .
n=4
n=1.1
m=1
FMNb0
0.2 0.4 0.6 0.8α
0.0 0.4 0.8 1.2 1.6 2.0-ln ( 1 - )
-1.5
-1.0
-0.5
0.0
0.5
ln [
d /
dt ]
α
α
ll l ll l ll0.2 0.4 0.6 0.8
α
3
3
7
n=4
n=2
m=1
2
2
2
2
"
,3

Table V: Thermodynamic and kinetic characterization of the main transformation of the as-cast FeCuNbSiB ribbons, where Ta and ta the annealing temperature and time of the isothermal measurements are respectively, Tx1, Tp1 and ΔH1 are the onset and minimum temperatures and the enthalpy of the continuous-heating DSC peak R1 (heating rate w = 40 K min-1), respectively. ΔE+
K1 is the activation energy deduced by the Kissinger method [102] . n1 and m1 (both ± 0.5) are the JMAYK and GG exponents 109] deduced by the Suriñach isothermal and continuous-heating methods [22,35], respectively. The symbols * and # indicate the quantities which were not or could not be given, respectively [110].
However, in the case of sufficiently high annealing temperature (Ta > Tx1 – 10 K) the
GG-mode is only observed (curve 72 in Fig. 8) and the Suriñach plot [22] finally showing the concave curvature (see curve 72 in Fig. 10) and indicating the long-range diffusion (cf. review in ref. [22]). In the case of DSC continuous heating data, the R1 peaks independently of the used heating rate follow one characteristic master curve for all as-quenched samples except the sample FMNb0 as it can be seen in Fig. 11 namely, the main transformation begins with the JMAYK-like kinetics having the JMAYK exponent 1 < n1 < 1.5. Next, the JMAYK-based kinetics collapses immediately and the master curve is parallel to the GG-like theoretical straight line with the GG exponent m1 ≥ 1 for α1 ≥ 0.2. Concerning the FMNb0 sample, its Suriñach plot implies a significantly higher proportion of the JMAYK kinetic mode with n1
Sample /Chart
Chemical composition Ta, ta [K,min]
Tx1 [K]
Tp1 [K]
ΔH1 [Jg-1]
ΔE+K1
[kJmol-1] n1 m1
FMCu0Si0 (1) (11)
Fe80.5Nb7B12.5 763, 60
788.7
802.7
-20
532±16
no 1.5
1
FMSi0 (2)
Fe77.5Cu1Nb4,5B17 *
766.9
794.8
-34
*
no
1
FMSi4.5 (3) (31) (32) (33)
Fe78Cu1Nb3Si4.5B13.5 713, 200 450,6 723, 60 540, 813, 60
751.7
765.8
>-61
298±6
no 2 2
1 1 1
FMSi7 (4)
Fe73.5Cu1Nb3.2Si7B15.3 *
809.1
837.7
>-27
600±25
*
1
FMSi9.2 (5)
Fe74.6Cu1Nb3.2Si9.2B12 *
789.8
811.7
>-25
357±33
*
1
FMCu0Si12.7 (6) (61)
Fe74.7Nb3.1Si12.7B9.5 813, 180
863.6
>873
#
#
# 4
#
FMSi13.5 (7) (71) (72)
Fe73.5Cu1Nb3Si13.5B9 778, 60 823, 60
815.1
831.4
-45
418±8
no 3 no
1.5 1.5 no
FMNb0 (8) (81)
Fe75.6Cu1Si14B9.4 698, 120
744.3
751.8
-66
314±5
* 3-1.5
no

decreasing from 2.5 to 1.5 for α1 <0.3. Then, the curve is gradually degraded due to the presence of R2 crystallization step. The GG-like mode was not detected in that case.
Relying on all the observed facts, the following GG-kinetic bimodal model is rather concisely formulated [109,110]. The nano-structure formation of any type of FINEMET samples is composed of the processes of two types, namely the conventional JMAYK nucleation-and-growth mode [1-4] and the mode, which has been very well described by the GG coalescence kinetic law [7,32]. Let is underline that these two modes are mutually independent. As a rule the JMAYK kinetics is manifested in the early stages of the R1 transformation representing both the nucleation and the three-dimensional crystal growth of the α-Fe-based phase, which is dispersed in the amorphous matrix. The JMAYK exponent n1 initially being 4 for the samples rich in Si continuously decreases to 1.5 along with increasing time of the thermal treatment. The GG-like mode dominates at higher temperatures and in the advanced stages of the R1 transformation independent of the content of Cu and Si and being controlled by the specific rearrangement of niobium. If the GG-like kinetics takes place in the initial amorphous state of sample consequently a nano-crystalline structure must be formed. Remarkably the Fe75.6Cu1Si14B9.4 sample (FMNb0) does not exhibit the GG-like kinetics and it does not form any nano-crystalline (FINEMET-like) structure. After the start of the R1 transformation, the long-range diffusion of Si-controlled reordering occurs during longer times in the FINEMETs containing Si (R1’ transformation).
5. Two types of the crystallization kinetics in rapidly quenched ribbons
Our results support an increased significance of DSC investigations applied to the crystallization in glasses. Owing these results, two distinct types of rapidly quenched metallic ribbons have been identified, namely “the conventional metallic glasses” and “the so-called precursors for the stable three-dimensional nanostructure alloys” (being the product of their first devitrification step R1). These ribbons are classified within two different characteristic facets and kinetics of the crystalline product during the R1 crystallization.
Independently of their chemical composition (as Pd-Si-based, some Fe-B-based [36,37], some Al-based, Zr-based multicomponent ribbons, etc.) the conventional metallic glasses principally follow the JMAYK nucleation-and-growth kinetic law. Thus the theoretically calculated shape of the continuous heating DSC peak is asymmetrical [109] with independency of the parameter n being always at a slower rise on the low-temperature side. Any pre-annealing of such samples increases the initial fraction transformed, which shifts the JMAYK peak to lower temperatures and make it broader. If n > 1, the JMAYK isothermal signal shows a reportable peak for nonzero degree of conversion, αmin = 1 – exp [(1 – n)/n], i.e., at a nonzero time (tmin = τ [(n-1)/n]1/n), which (due to τ = 1/k and the Arrheinus k(T)) is dependent on temperature. However, because the extremely non-equilibrium thermodynamic state of metallic glasses (due to rapid quenching) and also owing to their characteristic heterogeneity (characterized by the cluster-type medium-range order and distinct macroscopic anisotropy) reflecting the surface/volume morphology of ribbons, numerous peculiarities within the JMAYK kinetics occur (especially in the case of magnetic alloys). For example, if the ΔE1
+ = f(α1) and n1 = f’(α1), which results the transient heterogeneous nucleation of R1 phase and/or if ΔE2
+ = f’’(T1), which reflects the subordinated composition of amorphous matrix towards the actual kinetics (of the specific R1 phase in the case of Fe-Si-B ribbons) the JMAYK kinetics come about the application.
Concerning the second type of rapidly quenched alloys, independently of the initial chemical composition (such as FINEMETs [33,110], NANOPERMs [109], HITPERMs or some aluminum based ribbons [109]) the ribbons after the R1 transformation are characterized by extremely high nanocrystal density at relatively low total crystalline content,

high enough thermal stability, extraordinary magnetic, corrosion or mechanical properties. The continuous-heating as well as the isothermal nanocrystal formation, as the main transformation step R1, is characterized by a distinctive kinetics [32,33,109,110]. Specifically, the isothermal DSC signal posses a monotonically decreasing feature while the continuous-heating DSC signal retains asymmetry that is reversed to the JMAYK kinetics one. The clearest effect, however, is that the pre-annealing (i.e., increment of the initial grain radius) shifts the onset of the DSC peak to higher temperatures and leads to narrower transformation range. Thus the behavior of such a nano-crystallization is similar to the normal-grain-growth one. Even though the original idea of Atkinson [7] of the GG-like mechanism (where the larger grains in the already fine-crystalline sample increase their size at the expense of smaller ones - coalescence) does not correlate well enough with structural observations in our heterogeneous two-phase systems, the GG-like kinetic law may well rationalize all peculiarity of most DSC results without need of any correction [109]. The desired kinetic parameter m and other characteristics of the nanocrystal formation (stage R1) in metallic ribbons under our studies are summarized in Table VI. It can be seen that m < 2 may well reflect the presence of a second phase (amorphous matrix) interpretable also in relation to the final grain radius (of the R1 phase). Table VI: Structural characterization (nano-crystalline phase and final grain diameter) and kinetic parameters (Kissinger activation energy and the normal-grain-growth exponent) of the nanocrystal formation stage in metallic ribbons [109].
Sample Product d [nm]
ΔE+
[kJ mol-1] m
Fe76Mo8Cu1B15 α-Fe <10 511±24 1.7 Fe73.5Cu1Nb3Si13.5B9 α-Fe(Si) 12 418±8** 1.5 Fe87-xCu1Nb3SixB9 α-Fe(Si) 10-12 ~300-600** 1 Fe63.5Ni10Cu1Nb3Si13.5B9 α-FeNi(Si) 15-18 429±5** 0.5 Al90Fe7Nb3 α-Al >10 162±24 0.15
** ΔE+ is heat-treatment dependent because of the bimodal character of R1 stage
In the case of the Al90Fe7Nb3 ribbon [109], both the α-Al nanocrystal formation (R1) and the eutectic-like crystallization of the amorphous matrix into intermetallic one (in a polycrystalline α-Al matrix - R3 step) can take place within the temperature range of standard DSC measurements. Therefore, we can mutually relate the GG-like (in R1 step) and JMAYK-like (in R3 step in this case) kinetics. Namely, in the continuous heating regime, the R1 peak is wider and shifted to higher temperatures while the R3 peak is narrower and shifted to lower temperatures (when treated by appropriate isothermal pre-annealing, cf. Fig. 12. In the isothermal regime, the DSC signal of R1 transformation step is decaying and independent of temperature. However, in the case of the R3 transformation step, the DSC signal forms the peak, which rime-scale significantly prolongs with decreasing Ta, (cf. Fig. 13). The revealing Suriñach plots [22] are straight lines for R1 step (since α = 0.1) but become convex curves with a maximum at α = 0.54 for R3 step (cf. Fig. 14).

Fig. 12. DSC traces from as-quenched and heat-treated Al90Fe7Nb3 ribbons. The inset shows an expanded view of the peaks from low-temperature pre-annealed samples. Numbers in parentheses indicate annealing temperature in K and annealing time in min [109]. Fig. 13. Isothermal DSC traces at various temperatures of as-quenched Al90Fe7Nb3 ribbons. Numbers in parentheses indicate annealing temperature in K and annealing time in min [109]. Fig. 14. Suriñach plots for the continuous heating DSC transformation peaks R1 and R3 from Fig. 12 and for isothermal peaks R3i from Fig.13 for as-quenched Al90Fe7Nb3 ribbons. ○, x and + correspond to experimental data, respectively, (not all points are shown), —— to the theoretical GG kinetics for m = 0.13, ― · ― and ― ··· ― to the theoretical JMAYK kinetics for n = 1 and 4, respectively [109]. References [1] Kolmogorov A (1937) Statistical theory for the recrystallization of metals. Akad. Nauk SSSR. Izv. Ser. Matem. 1:355 (in Russian); and (1961) in Reaction rate of processes involving solids with different specific surfaces, the Proceedings of 4th International Symposium Reactivity of Solids, Elsevier, Amsterdam, pp. 273-282..
0 50 100 150 200Time [ min ]
-0.12
-0.10
-0.08
-0.06
-0.04
-0.02
0.00
0.02H
eat p
ower
[ W
/g ]
.
.
(658,150)(653,120)
(648,105)(643,240)
(503,180)(518,180)(523,180)
0.0 0.4 0.8 1.2 1.6 2.0-ln (1 - )
38.5
39.0
39.5
ln (f
( ))
.
0.2 0.4 0.6 0.8
α
α
α
I I I I I I II
n=4
R3i
R3
n=1
m=0.15
R1
400 500 600 700 800Temperature [ K ]
-3
-2
-1
0
Hea
t pow
er [
W/g
]
.
.
400 600 800
-0.4
-0.2
0.0
0.2
(as-q)
(648,70)
(648,105)
(as-q)(508,180)(523,180)
w = 40 K/min

[2] Johnson WA, Mehl RF (1939) Reaction kinetics in processes of nucleation and growth. Trans. Amer. Inst. Min. Metal. Petro. Eng. 135: 416 ; reprinted (2010) in Metall. Mater. Trans. A – Phys. Metall. Mater. Sci.; 41A: 2713-2775.
[3] Avrami M (1939) Kinetics of phase change I – General theory. J. Chem. Phys. 7: 1103-1112; and (1940) Granulation, phase change and microstructure – Kinetics of phase change III. J. Chem. Phys. 9: 177-184.
[4] Hulbert HF (1969) Models for solid-state reactions in powdered compacts: a review. J. Br. Ceram. Soc. 6: 11-20.
[5] Reed RL, Weber L, Gottfried BS (1965) DTA and Reaction Kinetics. Ind. Eng. Chem. Fundamen. 4: 38–46.
[6] Šesták J (1974) Applicability of DTA to study crystallization kinetics of glasses. Phys. Chem Glass; 15:137-140; and Šesták J, Strnad Z (1977) Simulation of DTA crystallization peak on basis of nucleation-growth curves determined by optical microscopy. in the procedings XI Inter. Congress on Glass, (J. Gotz ed), DT CVTS, Prague, Vol. II, P. 249-258
[7] Atkinson HV (1988) Theories of normal grain growth in pure single phase systems. Acta Metall, 36: 469-491.
[8] Matusita K, Sakka S (1979) Kinetic study of crystallization of glass by DTA. Phys Chem Glasses 20: 81-84. [9] Greer AL (1982) Crystallization kinetics of Fe80B20 glass. Acta Metall. 30: 171-192
[10] Köster U (1982) Micromechanisms of Crystallization in Metallic Glasses. In: Phase Transformations in Crystalline and Amorphous Alloys, (B.L.Mordike, ed), Clausthal-Zellerfeld , DGM‘1983, pp.113-126
[11] Kelton KF, Spaepen F (1985) A study of the devitrification of Pd82Si18 over a wide temperature range. Acta Metall. 33: 455-464.
[12] Chen LC, Spaepen F (1992) Calorimetric evidence for the micro-quasicrystalline structure of amorphous Al/transition metal alloys. Nature 336: 366-368; and (1992) Grain growth in microcrystalline materials studied by calorimetry. Nanostruct. Mater. 1: 59-64
[13] Kemény T, Vincze I, Fogarassy B (1979) Structure and crystallization of Fe-B metallic glasses Phys. Rev. B 20: 476–488; and Šesták J, Kemeny T (1984) Distinction between crystallization kinetics of metallic glasses determined by isothermal and non-isothermal calculation methods. In the workbook of Chinese symposium on calorimetry and thermodynamics, Handzhow (China).
[14] Henderson DW (1979) Experimental analysis of nonisothermal transformations involving nucleation and growth. J. Thermal Anal.; 15: 325–31; and (1979) Thermal analysis of non-isothermal crystallization kinetics in glass forming liquids. J. Non-Cryst. Solids 30: 301-315.
[15] de Bruijn TJW, de Jong WA, van den Berg PJ (1981) Kinetic parameters in Avrami - Erofeev type reactions from isothermal and non-isothermal experiments. Thermochim. Acta 45: 315-325
[16] Šesták J (1981) Integration of nucleation-growth equation when considering non-isothermal regime. In the proceedings of 2nd ESTAC “Thermal Analysis”, (Europ. Symp. on Thermal Analysis, D. Dolimore, ed), Heyden, London, p. 11-119.
[17] Ramanan VRV, Fish EG (1982) Crystallization kinetics in Fe–B–Si metallic glasses. J. Appl. Phys., 53: 2273–2276.

[18] Altounian, Z. Volkert, CA. Strom‐Olsen, JO. (1985) Crystallization characteristics of Fe‐Zr metallic glasses from Fe43Zr57 to Fe20Zr80 J Appl Phys, 57: 1777 – 1782
[19] Kemeny T, Šesták J (1987) Comparison of crystallization kinetics determined by isothermal and nonisothermal methods, Thermochim. Acta 110: 113-121
[20] Greer AL (1988) Crystal Nucleation in Glass-Forming Alloys. Materials Sci. Enging, 97: 285-290; and (1989) Crystallization - views of interfacial ephemera. Nature 338 462-462; and (2005) Athermal heterogeneous nucleation of solidification. Acta Materialia 53: 2683-2692.
[21] K. F. Kelton KF, Greer AL (1986) Transient Nucleation Effects in Glass-Formation. J Non-Cryst Solids, 79: 295-309; and (1988) Test of Classical Nucleation Theory in a Condensed System. Physical Review B, 38: 10089-10092.
[22] Suriñach S, Baró MD, Clavaguera-Mora MT, Clavaguera N (1983) Kinetic study of isothermal and continuous heating crystallization in GeSe2-GeTe-Sb2Te3 alloy glasses. J Non-Cryst. Solids 58: 209-217.
[23] Kopelman R (1988) Fractal reaction kinetics. Science 241: 620-625.
[24] Šesták J. (1991) Phenomenology of nonisothermal vitrification and crystallization in book Kinetic Phase Diagrams: nonequilibrium phase transitions. (Chvoj Z, Šesták J, Tříska A., edts) , Elsevier, Amsterdam.
[25] Chen LC, Spaepen F (1991) Analysis of calorimetric measurements of grain growth J. Appl. Phys. 69: 679-688
[26] Málek J, Criado JM, Šesták J, Militký J (1989) Boundar conditions of kinetic models Thermochim. Acta 153: 429-435; and Militký J, Šesták J (1992) Evaluation and interpretation of nonisothermal kinetic models Thermochim. Acta 203: 31-38.
[27] Koga N, Šesták J (1992) Thermoananlytical kinetics and physico-geometry of the nonisothermal crystallization of glasses“ Bol. Soc. Esp. Ceram. Vidr. 31: 185; and (2005) Crystal nucleation and growth in glasses studied by thermal analysis. J. Am. Ceram. Soc. 83: 1753-1760
[28] Málek J (1995) The applicability of Johnson-Mehl-Avrami model in the thermal analysis of crystallization kinetics of glasses. Thermochim. Acta 267: 61-73; and (2000),Kinetic analysis of crystallization processes in amorphous materials Thermochim. Acta 355: 239-247.
[29] Moynihan CT (1993) Correlation between the width of the glass-transition region and the temperature dependence of glass viscosity J. Amer. Cer. Soc. 76: 1081
[30] Köster U, Meinhardt J (1994). Crystallization of highly undercooled metallic melts and metallic glasses around the glass transition temperature. Mate Sci Eng A221: 271-278.
[31] Šesták J (1986) Applicability of DTA and kinetic data reliability of nonisothermal crystallization of glasses. Thermochim. Acta 98: 339-358; and (1996) Use of phenomenological kinetics and the enthalpy-temperature diagrams (and its derivative DTA) for a better understanding of transition processes in glasses“ Thermochim. Acta 280/281: 175.
[32] Illeková E, Kuhnast FA, Fiorani JM (1995) The Grain-Growth Versus Nucleation-Growth Kinetics in the As-Quenched to the Nanocrystalline Transformation of FINEMET, in book Nanostructured and Non-Crystalline Materials, (Proceedings of the Fourth International Workshop on Non-Crystalline Solids, Madrid, Spain, M.Vazquez & A. Hernando edts.), World Scientific, Singapore: 490-494.

[33] E. Illeková, K. Czomorová, F.A. Kuhnast, J.M. Fiorani. Transformation Kinetics of the Fe73.5 Cu1Nb3Si13.5B9 Ribbons to the Nanocrystalline State, Mater. Sci. Eng. A205 (1996) 166-179.
[34] Illeková E, Malizia F, Ronconi F (1996) The complex DSC analysis of the first crystallization peak of Fe80Si10B10 metallic glass. Thermochim. Acta, 282/283: 91–100.
[35] Illeková E (1996) The crystallization kinetics of Fe80Si4B16 metallic glass, Thermochim. Acta 280/281: 289-301.
[36] Maťko I, Illeková E, Švec P, Duhaj P (1997) Crystallization characteristics in the Fe-Si-B glassy ribbon system, Mater. Sci. Eng. A225: 145-152.
[37] Illeková E, Maťko I, Duhaj P, Kuhnast FA (1997) The complex characteristics of crystallization of the Fe75Si15B10 glassy ribbon, J. Mater. Sci. 32: 4645-4654
[38] Weinberg MC (1996) Glass-formation and crystallization kinetics. Thermochim Acta 280/281: 63 71; and (1996) Avrami exponents for transformations producing anisotropic particles. J. Non-Cryst. Solids 202: 290-296; and (1999) Examination of the temperature dependencies of crystal nucleation and growth using DTA/DSC. J. Mining Metal 35:197-210.
[39] Kelton KF (1997) Analysis of crystallization kinetics. Mat. Sci. Eng. A226/228: 142-150
[40] Hermann H, Mattern N, Roth S, Uebele P (1997) Simulation of crystallization processes in amorphous iron-based alloys. Phys. Rev. B56: 13888-13897.
[41] Varschavski A, Šesták J (1999) Applications of differential scanning calorimetry for the study of transformation processes in quenched alloys in book Characterization techniques of Glasses and Ceramics (J. M. Rincon and M. Romero, edts), Springer-Verlag, Berlin: 85-111
[42] Illeková E (201) FINEMET-type nanocrystallization kinetics, Thermochim. Acta 387: 47-56
[43] Illeková E (2005) Kinetic characterization of nanocrystal formation in metallic glasses, in book Properties and Applications of Nanocrystalline Alloys from Amorphous Precursors, NATO Science Series II vol. 184, Mathematics, Physics and Chemistry, (B. Idzikowski, P. Švec, M. Miglierini, edts.), Kluwer, Dordrecht, 2005: 79-90
[44] Khawam A, Flanagan DR. (2006) Solid-state kinetic models: basics and mathematical fundamentals. J. Phys. Chem. B 110: 17315-17328.
[45] Gutzow I, Schmelzer JWP, Petroff B. (2008) Phenomenological theories of glass transition: Classical approaches, new solutions and perspectives. J Non-cryst Solids 354: 311-324; and Schmelzer JWP, Fokin VM, Abyzov AS, Zannoto ED, Gutzow I, (2010) How Do Crystals Form and Grow in Glass-Forming Liquids. Int J Appl Glass Sci 1: 16–26
[46] Šesták J, Berggren G. (1971) Study of the kinetics of the mechanism of solid-state reactions at increasing temperature. Thermochim. Acta. 3: 1-13; and Šesták J, Kozmidis-Petrovic A, Zivkovic Z (2011) Crystallization kinetics accountability and the correspondingly developed glass-forming criteria. J. Min. Metall. Sect. B-Metall. 47: 229 - 239
[47] Šesták J (2012) Rationale and fallacy of thermoanalytical kinetic patterns: how we model subject matter, J Thermal Anal Calor, in print - DOI 10.1007/s10973-011-2089-1.
[48] Málek J, Zmrhalová Z, Barták J, Honcová P. (2010) A novel method to study crystallization kinetics in glassy materials. Thermochim. Acta, 511: 67 – 73; and Málek J, Zmrhalová Z, Honcová P (2011) Crystallization in glasses monitored by thermomechanical analysis. J. Therm. Anal. Calorim. 105 565-570.

[49] Svoboda R, Krbal M, Málek J (2011) Crystallization kinetics in Se-Te glassy systém. J. Non-Cryst. Solids 357: 3123 – 3129; and Svoboda R, Málek J (2012) Complex crystallization processes studied by DSC - potential of the method . Thermochim. Acta, (in print).
[50] Šesták J. (2012) Citation records and some forgotten anniversaries in thermal analysis. J Thermal Anal Calor, (in print - DOI:10.1007/s10973-011-1625-3).
[51] Burke J (1965) The kinetics of phase transformations in metals, Pergamon Press, New York.
[52] Christian JW (1975) The theory of transformations in metals and alloys, Pergamon Press, Oxford.
[53] Donth EJ (2001) Glass Transition, Relaxation and Disordered States. Springer, Berlin
[54] Idzikowski B, Švec B, Miglierini M, editors (2004) Properties and Application of Nano-crystalline Alloys. Kluwer, Dordrecht.
[55] Jürn D, Schmelzer WP, editors (2005) Nucleation Theory and Application. Wiley, New York.
[56] Kelton KF, Greer AL (2010) Nucleation in Condensed Matter - Vol. 15. Elsevier, Amsterdam
[57] Köster U, Herold U (1981) Crystallization of Metallic Glasses. Springer, Berlin.
[58] Šesták J (1984) Thermophysical Properties of Solids: theoretical thermal analysis. Elsevier, Amsterdam; and (1987) Těoretičeskij těrmičeskij analyz. Mir, Moscow (in Russian)
[59] Šesták J, editor (1992) Reaction kinetic by thermal analysis, special issue of Thermochim. Acta, Vol. 203, Elsevier, Amsterdam.
[60] Egami T, Greer A. L, Inoue A, Ranganathan S editors (2003) Supercooled Liquids, Glass Transition and Bulk Metallic Glasses, Cambridge.
[61] Šesták J (2004) Heat, thermal analysis and society. Nucleus, Hradec Kralove; and (2005) Science of Heat and Thermophysical Studies: a generalized approach to thermal analysis. Elsevier, Amsterdam.
[62] Henkel M,; Pleimling M, Sanctuary R editors (2007) Ageing and the Glass Transition, Springer, Berlin.
[63] Šesták J, Mareš JJ, Hubík P, editors (2011) Glassy, amorphous and nanocrystalline materials: Thermal physics, analysis, structure and properties. Springer, Berlin.
[64] Kalikhmanov VI (2011) Nucleation Theory. Springer, Berlin.
[65] Schmelzer J. W. P, Gutzow I.S, Mazurin O. V, Priven A. I, Todorova S. V, Petroff B. P editors (2011) Glasses and the glass transition, Wiley, New York.
[66] Li C, Wang L, Inoue A (2001). Initial crystallization processes of Zr-Cu-Rh metallic glasses. J. Phys.: Condens. Matter 13: L803-L809; and (1986) J Noncryst Solids 81:129-134
[67] Guo X. Louzguine D. Inoque A. (2001) Crystallization Kinetics of Ti-Zr-Ni-Cu Metallic Glasses. Mater Trans 42: 2406-2409.
[68] dos Santos DS, dos Santos DR, (2002) Crystallization kinetics of Fe–B–Si metallic glasses. J. Non-Cryst. Solids 304: 56–63.
[69] McHenry ME, Johnson F, Okumura H, Ohkubo T, Ramanan VRV, Laughlin DE, (2003) The kinetics of nanocrystallization and microstructural observations in FINEMET, NANOPERM and HITPERM nanocomposite magnetic materials. Scripta Mater 48: 881–887.

[70] Chrissafis K, Maragakis MI, Efthimiadis KG, Polychroniadis EG, (2005) Detailed study of the crystallization behaviour of the metallic glass Fe75Si9B16. J Alloys Comp 386: 165–173
[71] Ile DC, Révész A, Grahl H, Eckert J, Crespo P, Martın P, Hernando A, Suriñach S, Muñoza JS, Baró MD (2004) Thermal stability and crystallization behavior of Fe77C5B4(AlGa)3(PSi)11 metallic glasses Materials. Sci Eng A 375/377: 297–301.
[72] Soliman AA, Al-Heniti A, Al-Hajry A, Al-Assiri M, Al-Barakati G, (2004) Crystallization kinetics of melt-spun Fe83B17 metallic glass. Thermochim. Acta, 413: 57–62.
[73] Yan ZJ, He SR, Li JR, Zhou YH , (2004) On the crystallization kinetics of Zr60Al15Ni25 amorphous alloy. J. Alloys Compd., 368: 175–179.
[74] Kelton KF, Croat TK, Gangopadhyay AK, Xing LQ, Greer AL, Weyland M, Li X, Rajan K. (2003) Mechanisms for nanocrystal formation in metallic glasses. J. Non-Cyst. Solids 317: 71-77; and Shen TS, Xing LQ, Kelton KF, (2005) Formation and crystallization of ZrCuTi metallic glasses. Philosophical Magazine 85: 3673-3682
[75] Suñol1 JJ, Clavaguera-Mora MT, Clavaguera N. (2002) Thermally activated crystallization of two FeNiPSi alloys. J Thermal Anal Calor. 70: 173–179
[76] Chrissafis K (2003) Crystallization kinetics of amorphopus Fe75.xCuxSi9B16. J Thermal Anal Calor. 73: 745.753
[77] Révész A (2004) Ccrystallization kinetics and thermal stability of amorphous Fe77C5B4Al2GaP9Si2 bulk metallic glass. J Thermal Anal Calor 91: 879–884
[78] Shanker Rao TL, Lad KN, Pratap A, (2004) Study of nonisothermal crystallization of amorphous Cu50Ti50 alloy. J Thermal Anal Calor 78: 769–774
[79] Poloczek T, Griner S, Nowosielski R. (2006) Crystallization process of Ni-base metallic glasses. J. Achiev Mater Manufac Eng 17: 133-136
[80] J.S.C. Jang a. S.F. Tsao. L.J. Chang. G.J. Chen, J.C. Huang. Crystallization kinetics of the Zr61Al7.5Cu17.5Ni10Si4 alloy using isothermal DSC and TEM observation Journal of Non-Crystalline Solids 352 (2006) 71–77
[81] Xu D, Johnson WL. (2006) Crystallization kinetics and glass-forming ability of bulk metallic Pd40Cu30Ni10P20 and Zr41.2Ti13.8Cu12.5Ni10Be22.5 glasses from classical theory. Phys. Rev. B74: 111-122.
[82] Wang XD, Wang Q, Jiang JZ. (2007) Avrami exponent and isothermal crystallization of Zr/Ti-based bulk metallic glasses J Alloys Comp 440: 189–192; and Finney EE, Finke RG. (2009) Is there a minimal chemical mechanism underlying classical Avrami-Erofeev treatments of phase-transformation kinetic data? Chem. Mater. 21: 4692–4705; and Schmelzer JWP (2010) On the determination of the kinetic pre-factor in classical nucleation theory. J Noncryst Solids 356: 2901-1907
[ 83] Nowosielski R, Babilas R, Griner S, Dercz G, Hanc A. (2009) Crystallization of Fe72B20Si4Nb4 metallic glasses ribbons J Achiev. Mater. Manufact. Eng. 34: 14-22.
[84] Shivaee HA, Hosseini HRM, (2009) Advanced isoconversional kinetics of nanocrystallization in Fe73.5Si13.5B9Nb3Cu1 alloy. Thermochim. Acta, 494 : 80–85.
[85] Wang ZX, Lu JB, Xi XJ. (2010) Crystallization mechanism of CeAlFeCo bulk metallic glasses. J Rare Earths 28: 158-160

[86] Suñol J, Bonastre J. (2010) Crystallization kinetics of metallic glasses: transformation diagrams J Thermal Anal Calor, 102: 447-450.
[87 ] Gao YL, Shen J, Sun JF, Wang G, Xing DW, Xian HZ, Zhou BD, (2010) Crystallization behavior of ZrAlNiCu bulk metallic glass with wide supercooled liquid region. J Thermal Anal Calor, 102: 447-450. [88] Torrens-Serra I, Venkataraman S, Stoica M, Kuehn U, Roth S, Eckert J, (2011) Non-Isothermal Kinetic Analysis of the Crystallization of Metallic Glasses Using the Master Curve Method, Materials 4: 2231-2243
[89] Gogebakan M, Karteri I, Avar B, Kursun C (2012) Crystallization behavior of Mg–Cu–Y amorphous alloy. J Therm Anal Calorim, in print (DOI 10.1007/s10973-011-1992-9)
[90] Davies HA (1976) Formation of metallic glasses (Diamond Jubilee Edition) Phys Chem. Glasses 17: 159-173; and (1978) Prediction of glass-forming ability for metallic systems, J NonCryst Solids 39: 77-85.
[91] Duhaj P, Sladek V, Mrafko P. (1973) Production of thin amorphous samples using a rapidly rotating mill device. Czech. J. Physics A23: 617-619 (in Slovak)
[92] Duhaj P, Mrafko P, editors, book Amorphous Metallic Materials (1980) Veda, Bratislava (Slovakia)
[93] Jacobson LA, McKittrick J, (1994) Rapid solidification processing, Mat. Sci. Eng. R11: 355-408.
[94] Suryanarayana C, Inoue A (2011) Bulk Metallic Glasses (eBook), CRC Press Inc, (IBSN 9781439859698)
[95] Šesták J, editor (1996) Vitrification, Transformation and Crystallization of Glasses, special issue of Thermochim. Acta, Vol. 280/281, Elsevier, Amsterdam
[96] Málek J, Klikorka J, Šesták J (1987) Thermoelectrical conductivity of Ge-Bi-S glass as a complementary method to DTA, Thermochim. Acta 110: 281-288; and Šesták J, Málek J. (1993) Diagnostic limits of phenomenological models of heterogeneous reactions and thermoanalytical kinetics. Solid State Ionics. 63/65: 254-259.
[97] Černošek Z, Holubová J, Černošková E, Liška M, (2002) Enthalpic relaxation and the glass transition. J. Optoelectron. Adv. Mat., 4 : 489; and (2005) Glass transition by the StepScan DSC technique. J Optoelectron. Adv. Mat., 7: 2671.
[98] Joraid AA. (2005) Limitation of the Johnson–Mehl–Avrami formula for kinetic analysis of the crystallization of a chalcogenide glass. Thermochim Acta. 433:78–82.
[99]Abdel-Rahim MA, Hafiz MM, Shamekh AM (2005) Study of crystallization kinetics of some Ge-Se-In glasses. Physica B 369: 143-154; and Abu-Sehly AA, Alamri SN, Joraid AA (2009) Mesurements of DSC isothermal crystallization kinetics in amorhous Se bulk samples. J Alloys Comp 476: 348-351.
[100] Svoboda R, Krbal M, Málek J. (2011) Crystallization kinetics in Se-Te glassy system. J. Noncryst. Solids 357: 3123 – 3129; and Zmrhalová Z, Málek J, Švadlák D, Barták J. (2011) Crystallization kinetics of Sb2S3 in (GeS2)0.4 (Sb2S3)0.6 glass Physica Status Solidi C2011: 1- 4.
[101] Patial BS, Thakur N, Tripathi SK (2011) Crystallization study of Sn additive Se-Te chalcogenide alloys. J Thermal Anal Calor 106: 845-852; and Ahmad M, Kumar P, Suri N, Kumar J, Thangaraj R (2009) Kinetics of nonisothermal crystallization on glassy Se-Te and Se-In by DSC. Appl Phys A 94: 933-937

[102] Kissinger HE. Reaction kinetics in differential thermal analysis. Anal. Chem. 1957; 29: 1702-1706
[103] Matusita K, Sakka S (1978) Kinetic study of crystallization by DTA: criterion and application of Kissinger plot. J Noncryst. Sol. 39: 741-746
[104] Augis JA, Bennet JE (1978). Calculation of Avrami parameters for heterogeneous solid-state reactions using a modification of Kissinger method. J Thermal Anal. 13:283-292.
[105] Criado JM, Ortega A. (1988) Nonisothermal transformation kinetics in relation to Kissinger method. J Noncryst. Sol. 87: 302-311; and Sánchez-Jiménez PE, Criado JM, Pérez-Maqueda LA (2008) Kissinger kinetic analysis of data obtained under different heating schedule. J Thermal Anal Calor 94: 427-432
[106] Mehta M, Kumar A. (2005) Applicability of Kissinger relation in the determination of activation energies of glass transition processes J Optoelect Adv Mater 7: 1473–1478; and Soliman AA (2007) Derivation of the Kissinger equation for non-isothermal glass transition peaks. J Therm Anal Calorim. 89:389–92.
[107] Budrugeac P, Segal E (2007). Applicability of the Kissinger equation in thermal analysis. J Therm Anal Calorim 88:703–7.
[108] Yi C, Yanchun L, Yunlong H. (2008) Correctional kinetic equation for peak tempareture in DTA. J Thermal Anal Calorimetry, Vol. 93: 111–113; and (2010) Supplement on applicability of the Kissinger equation in thermal Analysis. J Therm Anal Calorim 102:605–608
[108b] M. Ochiai, R. Ozao. Fractal reactions in solids. Bull. Ceram. Soc. Jpn. 26(1991)1181 and J. Thermal Anal. 38(1992)1901
[109] Illeková E, (2005) in: Properties and Applications of Nanocrystalline Alloys from Amorphous precursors, NATO Science Series II: Mathematics, Physics and Chemistry, 184. (editors. B. Idzikowski, P. Švec, M. Miglierini), Kluwer Academic Publishers, Dordrecht, pp. 421
[110] Illeková E, (2002) FINEMET-type nanocrystallization kinetics. Thermochim. Acta. 378: 47-56.
[111] Starink MJ, (2003) The determination of activation energy from linear heating rate experiments: a comparison of the accuracy of isoconversion methods. Thermochim. Acta 404: 163-176.