Crystallinity analysis in molecular dynamics
18
Crystallinity Analysis in Polyethylene Molecular Dynamics Noah Paulson - ME Alex Lohse - MSE ME8883 Materials Informatics 12/10/2014
-
Upload
npaulson -
Category
Engineering
-
view
193 -
download
4
Transcript of Crystallinity analysis in molecular dynamics
Crystallinity Analysis in
Polyethylene
Molecular Dynamics
Noah Paulson - ME
Alex Lohse - MSE
ME8883 Materials Informatics
12/10/2014
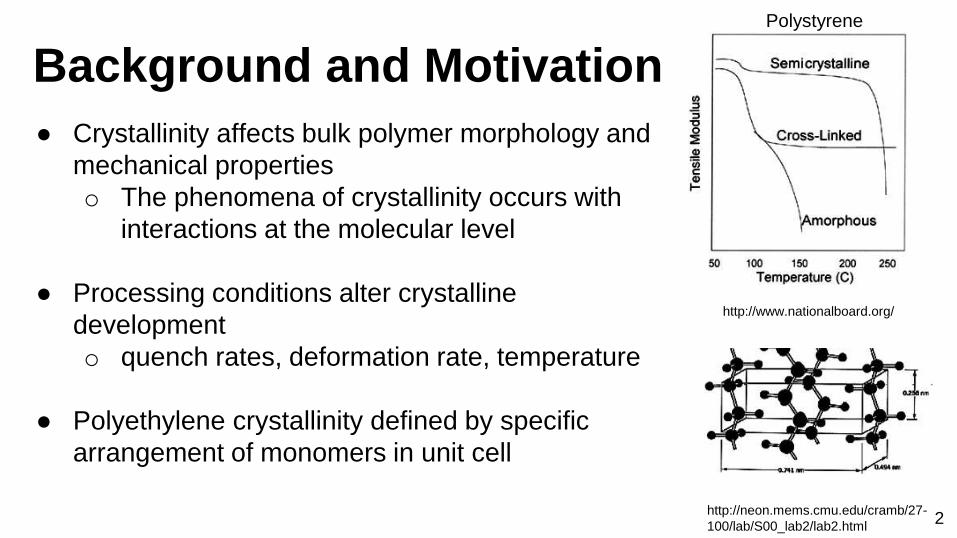
Background and Motivation
● Crystallinity affects bulk polymer morphology and
mechanical properties
o The phenomena of crystallinity occurs with
interactions at the molecular level
● Processing conditions alter crystalline
development
o quench rates, deformation rate, temperature
● Polyethylene crystallinity defined by specific
arrangement of monomers in unit cell
Polystyrene
http://www.nationalboard.org/
http://neon.mems.cmu.edu/cramb/27-
100/lab/S00_lab2/lab2.html2
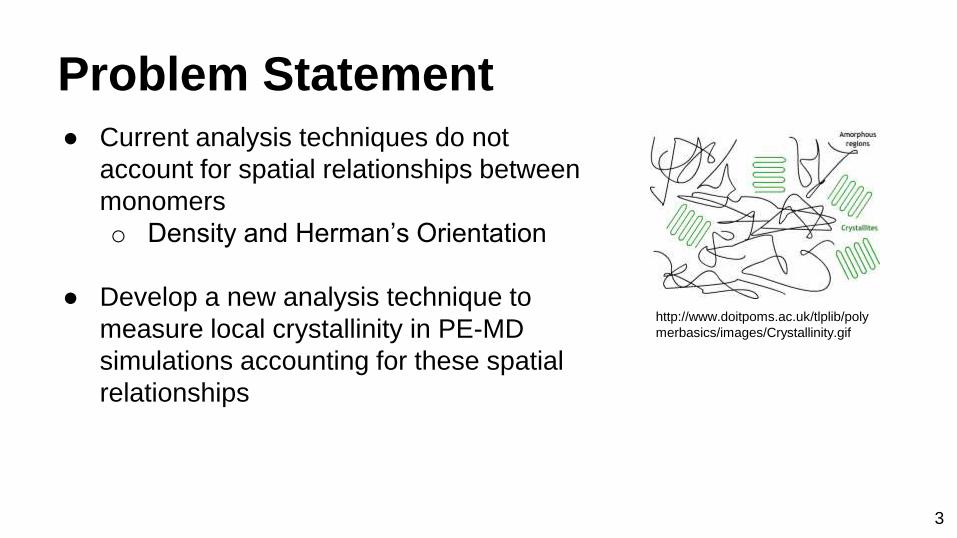
Problem Statement● Current analysis techniques do not
account for spatial relationships between
monomers
o Density and Herman’s Orientation
● Develop a new analysis technique to
measure local crystallinity in PE-MD
simulations accounting for these spatial
relationships
http://www.doitpoms.ac.uk/tlplib/poly
merbasics/images/Crystallinity.gif
3
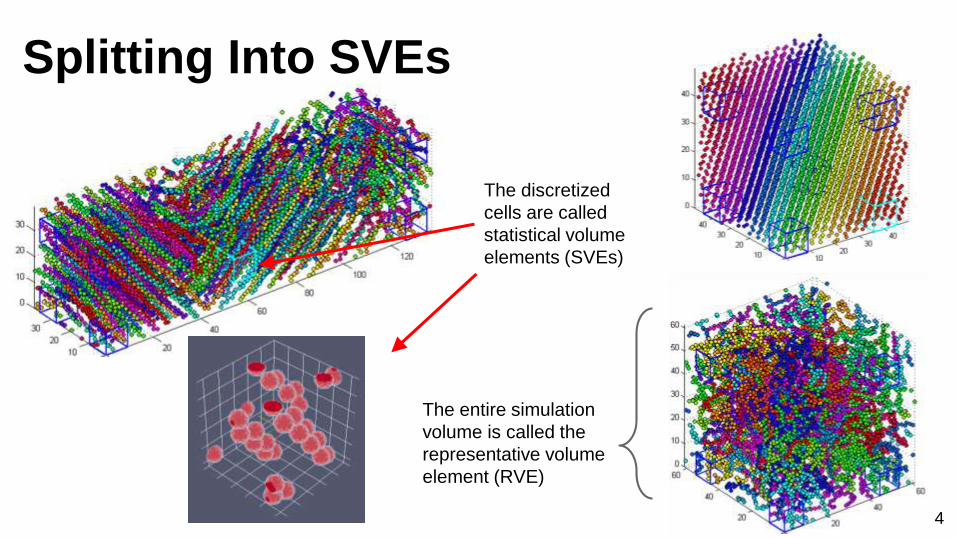
The entire simulation
volume is called the
representative volume
element (RVE)
The discretized
cells are called
statistical volume
elements (SVEs)
Splitting Into SVEs
4
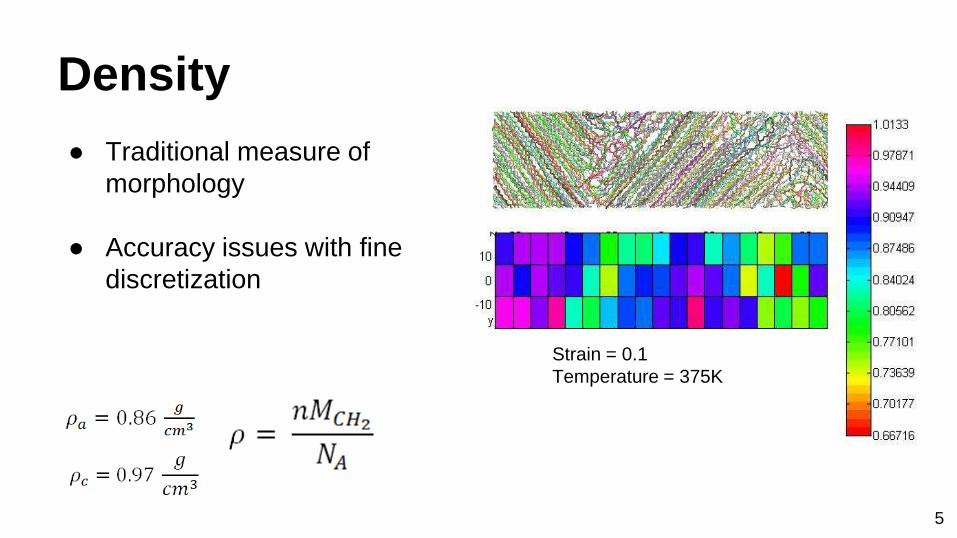
Density
● Traditional measure of
morphology
● Accuracy issues with fine
discretization
Strain = 0.1
Temperature = 375K
5
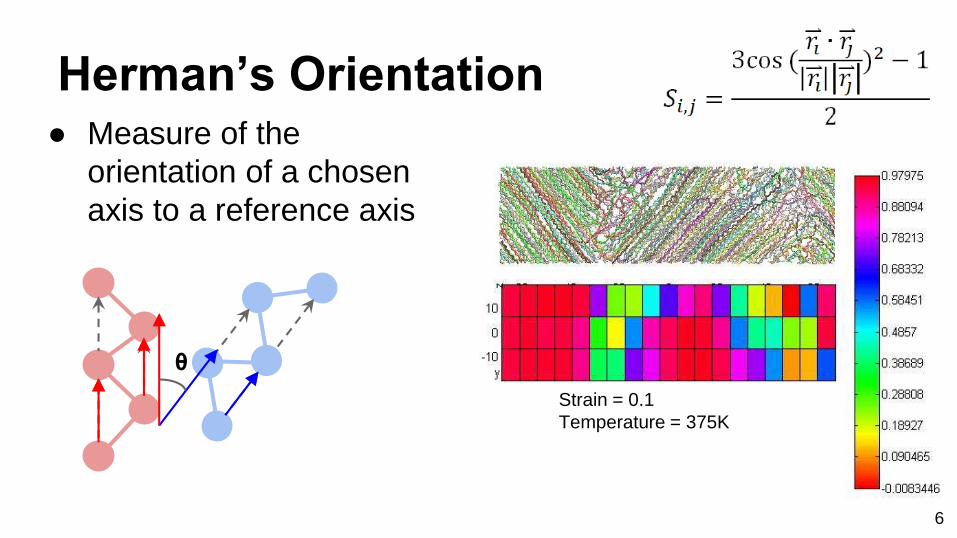
Herman’s Orientation● Measure of the
orientation of a chosen
axis to a reference axis
Strain = 0.1
Temperature = 375K
θ
6
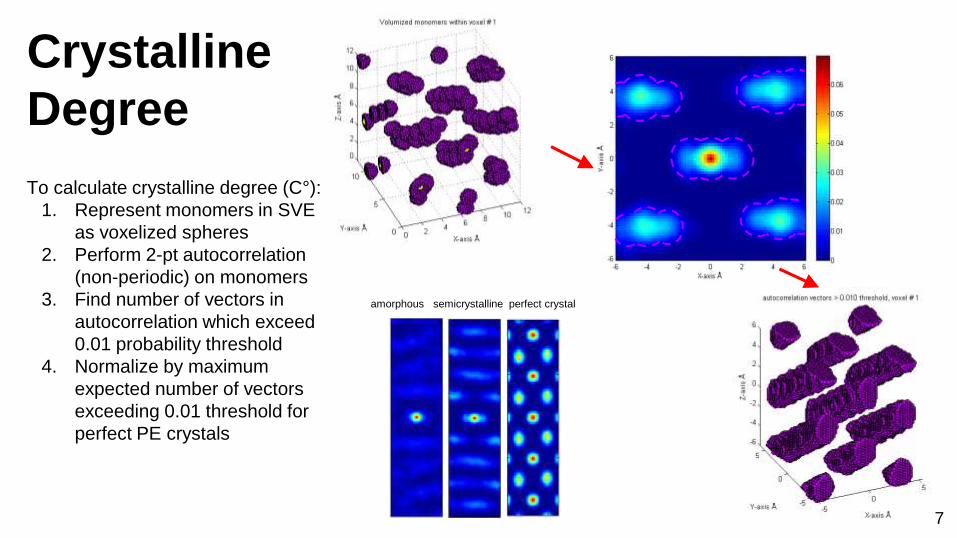
Crystalline
Degree
To calculate crystalline degree (C°):
1. Represent monomers in SVE
as voxelized spheres
2. Perform 2-pt autocorrelation
(non-periodic) on monomers
3. Find number of vectors in
autocorrelation which exceed
0.01 probability threshold
4. Normalize by maximum
expected number of vectors
exceeding 0.01 threshold for
perfect PE crystals
amorphous semicrystalline perfect crystal
7
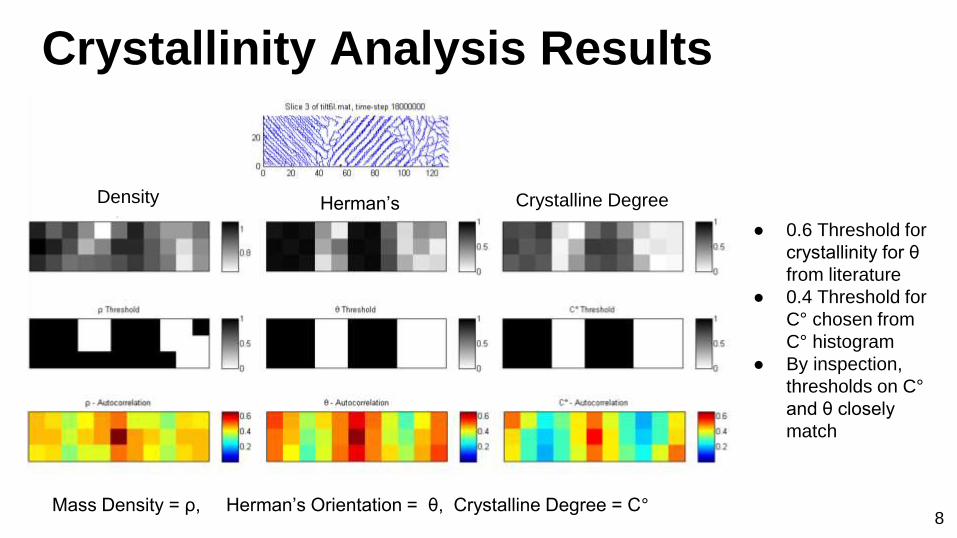
Crystallinity Analysis Results
Mass Density = ρ, Herman’s Orientation = θ, Crystalline Degree = C°
● 0.6 Threshold for
crystallinity for θ
from literature
● 0.4 Threshold for
C° chosen from
C° histogram
● By inspection,
thresholds on C°
and θ closely
match
8
Density Herman’s Crystalline Degree
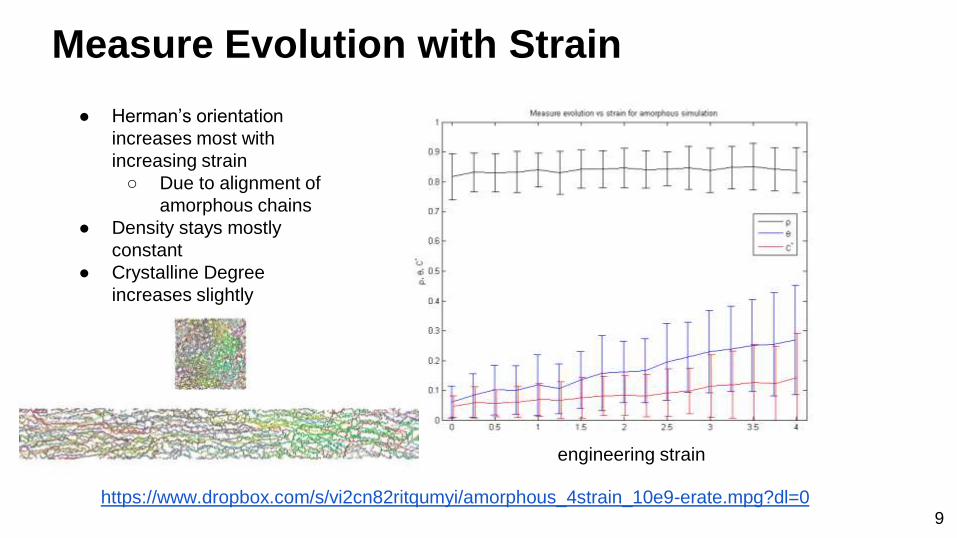
Measure Evolution with Strain
https://www.dropbox.com/s/vi2cn82ritqumyi/amorphous_4strain_10e9-erate.mpg?dl=0
● Herman’s orientation
increases most with
increasing strain
○ Due to alignment of
amorphous chains
● Density stays mostly
constant
● Crystalline Degree
increases slightly
9
engineering strain
Future Work
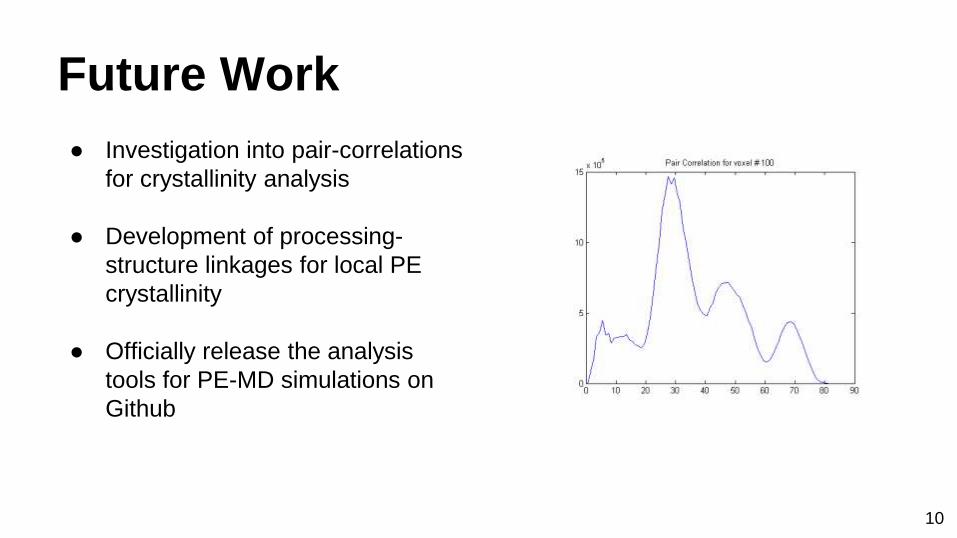
● Investigation into pair-correlations
for crystallinity analysis
● Development of processing-
structure linkages for local PE
crystallinity
● Officially release the analysis
tools for PE-MD simulations on
Github
10
Collaborative Interactions
External Tools and Codes
● SpatialStatsFFT.m code for non-periodic 2-pt statistics - Dr. Tony Fast,
GaTech
● Nanohub.org, Polymer Builder Tool - Benjamin Haley, Purdue Nano
Collaboration Network (NCN) project
● Amorphous Polymer Generator LAMMPS script - Mark Tschopp, Cooperative
Computing Group at Mississippi State University
Thank You’s
● Trial PE-MD simulations and LAMMPS assistance from Xin Dong
● Consultation with Prof. Karl Jacob for PE-MD expertise, with Prof. Surya
Kalidindi for data science expertise and Dr. Tony Fast for coding expertise
● ME8883 classmates for countless beneficial interactions in-class and online
11
References
● Dong, X. McDowell, DL. Kalidindi, SR. & Jacob, K. (2014). Polymer, 55, 4248–4257.
● Haley, BP, et. al. (2014), "Polymer Modeler" https://nanohub.org/resources/polymod.
● Hossain, D., et. al. Polymer, 2010, 51(25), 6071–6083.
● Ko, M. J., Waheed, N., Lavine, M. S., & Rutledge, G. C. (2004). The Journal of Chemical
Physics, 121(6), 2823-2832.
● Niezgoda, S. R., Fullwood, D. T., & Kalidindi, S. R. (2008). Acta Materialia, 56(18), 5285–5292.
● Pant, P. V. K., Han, J., Smith, G. D., & Boyd, R. H. (1993). 99(1), 597–604.
Questions?
12
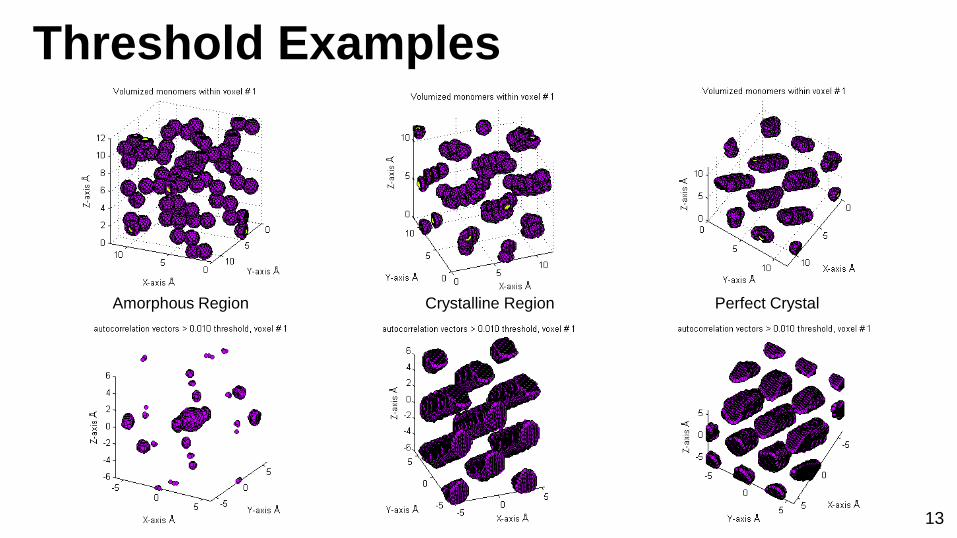
Threshold Examples
Perfect CrystalCrystalline RegionAmorphous Region
13
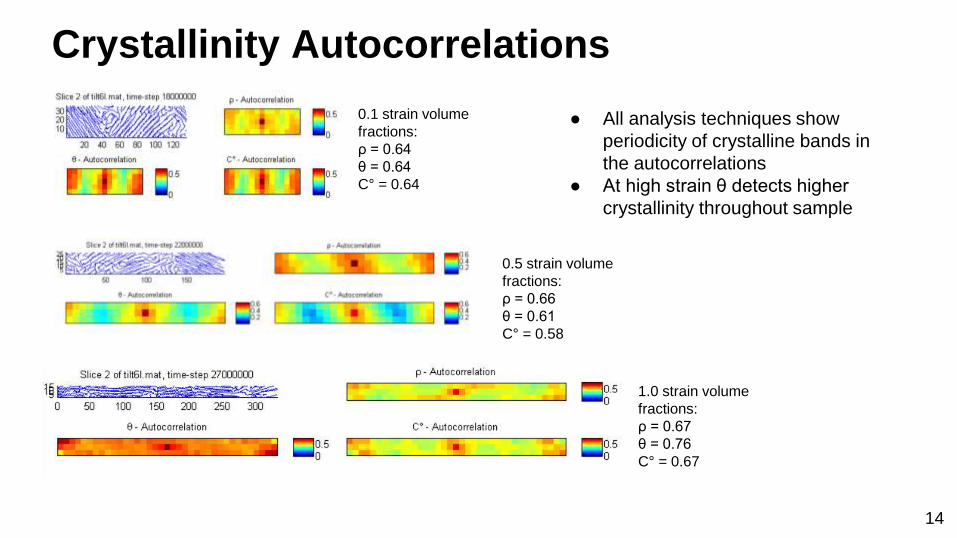
Crystallinity Autocorrelations
1.0 strain volume
fractions:
ρ = 0.67
θ = 0.76
C° = 0.67
0.1 strain volume
fractions:
ρ = 0.64
θ = 0.64
C° = 0.64
0.5 strain volume
fractions:
ρ = 0.66
θ = 0.61
C° = 0.58
● All analysis techniques show
periodicity of crystalline bands in
the autocorrelations
● At high strain θ detects higher
crystallinity throughout sample
14
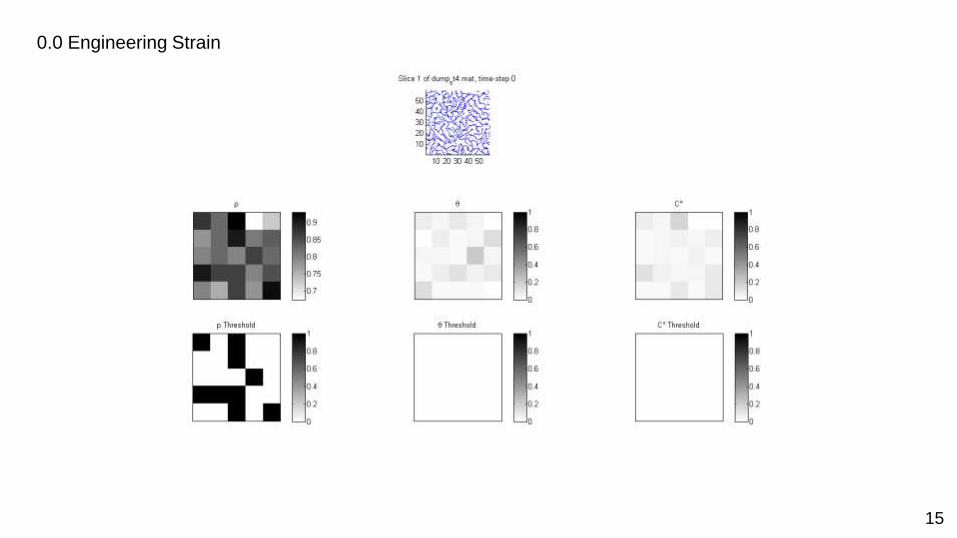
0.0 Engineering Strain
15
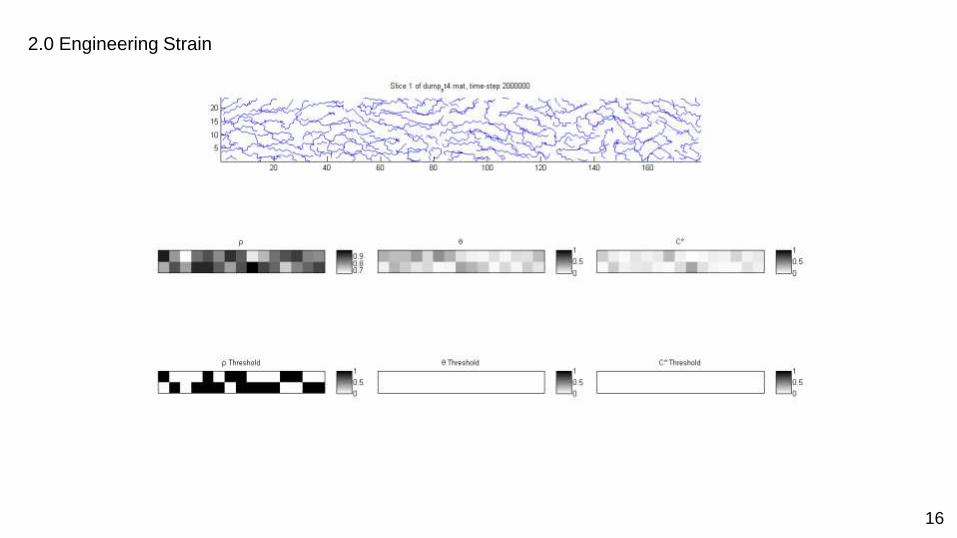
2.0 Engineering Strain
16
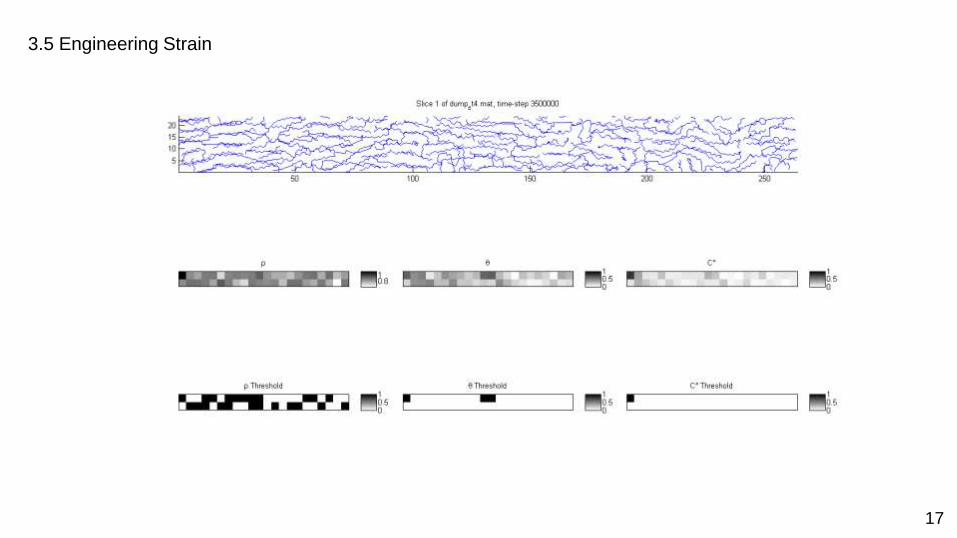
3.5 Engineering Strain
17
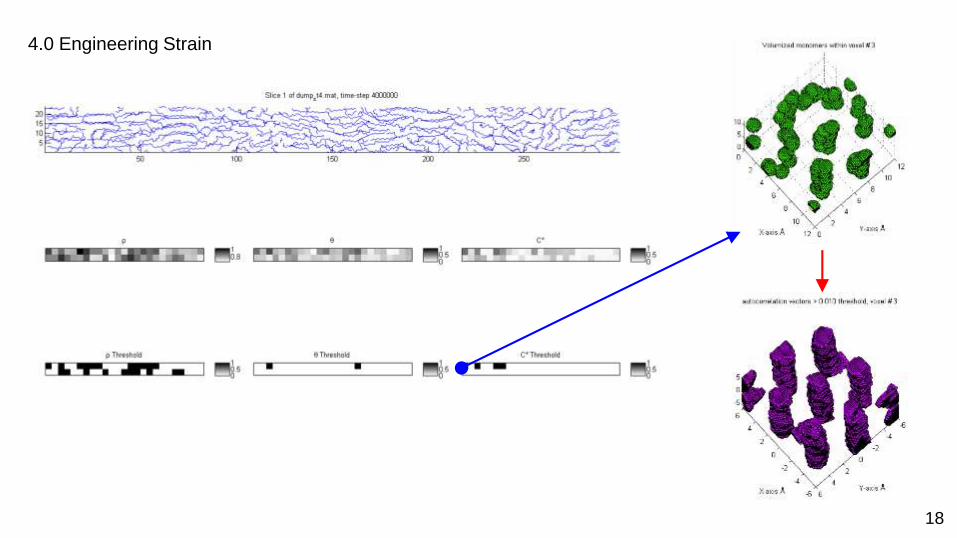
4.0 Engineering Strain
18