
Cryogenic Frostpoint Hygrometer (CFH) Instrument Handbook · DOE/SC-ARM-TR-210 Cryogenic Frostpoint...
31
DOE/SC-ARM-TR-210 Cryogenic Frostpoint Hygrometer (CFH) Instrument Handbook March 2018 M Stuefer T Gordon
Transcript of Cryogenic Frostpoint Hygrometer (CFH) Instrument Handbook · DOE/SC-ARM-TR-210 Cryogenic Frostpoint...
DOE/SC-ARM-TR-210
Cryogenic Frostpoint Hygrometer (CFH) Instrument Handbook
March 2018
M Stuefer T Gordon
DISCLAIMER
This report was prepared as an account of work sponsored by the U.S. Government. Neither the United States nor any agency thereof, nor any of their employees, makes any warranty, express or implied, or assumes any legal liability or responsibility for the accuracy, completeness, or usefulness of any information, apparatus, product, or process disclosed, or represents that its use would not infringe privately owned rights. Reference herein to any specific commercial product, process, or service by trade name, trademark, manufacturer, or otherwise, does not necessarily constitute or imply its endorsement, recommendation, or favoring by the U.S. Government or any agency thereof. The views and opinions of authors expressed herein do not necessarily state or reflect those of the U.S. Government or any agency thereof.
DOE/SC-ARM-TR-210
Cryogenic Frostpoint Hygrometer (CFH) Instrument Handbook M Stuefer T Gordon Both at University of Alaska, Fairbanks March 2018 Work supported by the U.S. Department of Energy, Office of Science, Office of Biological and Environmental Research

M Stuefer and T Gordon, March 2018, DOE/SC-ARM-TR-210
iii
Acronyms and Abbreviations
AIDA Aerosols Interaction and Dynamics in the Atmosphere ARM Atmospheric Radiation Measurement ASCII American Standard Code for Information Interchange CART Cloud and Radiation Testbed CFH cryogenic frostpoint hygrometer CMDL Climate Monitoring and Diagnostic Laboratory (NOAA) DOE U.S. Department of Energy DQR Data Quality Report FPH frostpoint hygrometer GMT Greenwich Mean Time GPS Global Positioning System IMet InterMet (International Met Systems) LED light-emitting diode MLS Microwave Limb Sounder NIST National Institute of Standards and Technology NOAA National Oceanic and Atmospheric Administration RFI radio frequency interference RH relative humidity USB Universal Serial Bus

M Stuefer and T Gordon, March 2018, DOE/SC-ARM-TR-210
iv
Contents
Acronyms and Abbreviations ...................................................................................................................... iii 1.0 General Overview ................................................................................................................................. 1 2.0 Mentor Contact Information ................................................................................................................. 1 3.0 Vendor/Developer Contact Information ............................................................................................... 1 4.0 Instrument Description ......................................................................................................................... 2 5.0 Measurements Taken ............................................................................................................................ 2 6.0 Links to Definitions and Relevant Information .................................................................................... 3
6.1 Data Object Description ............................................................................................................... 3 6.2 Data Ordering ............................................................................................................................... 4 6.3 Data Plots ..................................................................................................................................... 4 6.4 Data Quality ................................................................................................................................. 7 6.5 Instrument Mentor Monthly Summary......................................................................................... 7 6.6 Calibration Database .................................................................................................................... 7
7.0 Technical Specification ........................................................................................................................ 7 7.1 Units ............................................................................................................................................. 8 7.2 Range ............................................................................................................................................ 8 7.3 Accuracy ...................................................................................................................................... 9 7.4 Repeatability ................................................................................................................................ 9 7.5 Sensitivity ..................................................................................................................................... 9 7.6 Uncertainty ................................................................................................................................. 10 7.7 Input Voltage .............................................................................................................................. 11 7.8 Input Current .............................................................................................................................. 11 7.9 Input Values ............................................................................................................................... 11 7.10 Output Values ............................................................................................................................. 13
8.0 Instrument System Functional Diagram ............................................................................................. 13 9.0 Instrument/Measurement Theory........................................................................................................ 13 10.0 Setup and Operation of Instrument ..................................................................................................... 13 11.0 Software .............................................................................................................................................. 17 12.0 Calibration .......................................................................................................................................... 22 13.0 Maintenance........................................................................................................................................ 23 14.0 Safety .................................................................................................................................................. 23 15.0 Citable References .............................................................................................................................. 23
M Stuefer and T Gordon, March 2018, DOE/SC-ARM-TR-210
v
Figures
1 Frostpoint and ambient temperature, mixing ration, relative humidity, and saturation vapor pressure from the ARM diagnostic plot browser tool. ........................................................................... 5
2 ARM diagnostic plot browser figures depicting the paths of the CFH package. ................................... 6 3 Plot browser graphics for detection of potential data gaps, diagnostic temperatures, and CFH
voltage and signal information. .............................................................................................................. 6 4 Sketch of CFH instrument elements (from Vomel et al., 2007). .......................................................... 13 5 CFH electronic control circuit. ............................................................................................................. 14 6 CFH components including battery compartment and air-inlet tubes. ................................................. 15 7 CFH package combined with IMet radiosonde. ................................................................................... 16 8 The battery compartment for the CFH, with the battery state lights on the left. Right: The battery
compartment placed inside the foam box. ............................................................................................ 16 9 Attaching the air-inlet tubes with epoxy glue. ...................................................................................... 17 10 CFH setup variables. ............................................................................................................................ 18 11 CFH setup set optics window. .............................................................................................................. 19 12 Input flight name should be checked for the correct flight name, and F12 initiates the system
configuration procedure........................................................................................................................ 20 13 Additional parameters defining each specific CFH launch. ................................................................. 21 14 Continue selecting CFH and IMet variables. ....................................................................................... 21 15 Pouring the cooling liquid into the CFH. ............................................................................................. 23
Tables
1 CFH specification. .................................................................................................................................. 8 2 Contributions of different sources to the uncertainty of CFH measurements. ..................................... 10 3 DE1 metadata description file generated before and during each flight. ............................................. 12

M Stuefer and T Gordon, March 2018, DOE/SC-ARM-TR-210
1
1.0 General Overview The U.S. Department of Energy (DOE) Atmospheric Radiation Measurement (ARM) Climate Research Facility’s Cryogenic Frostpoint Hygrometer (CFH) is a small, balloon-borne instrument that provides highly accurate measurements of water vapor in the atmosphere. The CFH, although highly modified, is based upon the National Oceanic and Atmospheric Administration (NOAA)/Climate Monitoring and Diagnostic Laboratory (CMDL) frostpoint hygrometer (FPH) that has been flown in Boulder, Colorado, since 1980. The CFH has a significantly greater sensitivity to water vapor than standard radiosondes, as it can measure the frostpoint or dewpoint temperatures at an accuracy better than 0.2 K corresponding to water volume mixing ratios accuracies of only a few parts per million.
The main instrument part is a small mirror, which is cooled by a cryogen in order to be covered with a thin layer of water vapor condensate. A pair of photodiodes detects the condensation on the temperature-controlled mirror. The phase of the condensate is controlled by a force-freezing algorithm, allowing for clear interpretation of the dew point versus frostpoint.
The replacement of analog electronics with a microprocessor, a feedback controller, and thermistor calibration have led to improved accuracy and performance of the CFH over its predecessors. Further characteristics like reduced power consumption and low instrument weight made the CFH a successful instrument to perform in situ balloon-borne measurements of water vapor in the upper troposphere and lower stratosphere. CFH measurements are now used worldwide to validate radiosonde, satellite, and ground-based profiler measurements.
2.0 Mentor Contact Information Martin Stuefer Geophysical Institute University of Alaska, Fairbanks 2156 Koyukuk Drive Fairbanks, Alaska 99775-7320 Phone: (907) 474-6477 E-mail: [email protected]
3.0 Vendor/Developer Contact Information CFH Producer and Vendor:
EN-SCI Environmental Science 2545 Central Avenue Boulder, Colorado 80301 Phone: (720) 633-8774 Fax: (303) 440-1965 http://www.en-sci.com/

M Stuefer and T Gordon, March 2018, DOE/SC-ARM-TR-210
2
4.0 Instrument Description The Cryogenic Frostpoint Hygrometer (CFH), developed at the University of Colorado by Holger Vömel, provides accurate observations of tropospheric and stratospheric water vapor concentration profiles. The CFH measurement principle is based on the chilled-mirror principle, in which a small mirror is exposed to the atmosphere, and kept at a temperature representing the thermodynamic equilibrium between the vapor and condensed phase of water. The mirror is cooled (chilled) to the specific temperature at which a thin and constant layer of condensate appears on the mirror (Vömel et al., 2007). The temperature of the chilled mirror in this specific condition (of condensation) equals the frost or dew point temperature of the air passing by the mirror.
The temperature state of the mirror with the thin condensate is realized using a light-emitting diode (LED), which emits infrared light that is in turn reflected off of the mirror. A photodetector senses this reflected light, and the amount of reflected light inevitably varies with the formation of frost. The photodetector signal is then used to adjust the mirror temperature within this feedback loop so that the ambient frostpoint temperature is always maintained. The mirror is heated with a heater coil and cooled with cryogenic liquid (currently Trifluoromethane, or CHF3). The cryogenic liquid cools the mirror to between 30 and –85 ºC below any ambient temperature. A microcontroller initiates these mechanisms, allowing the mirror to be heated and cooled quickly so that its temperature reflects the current frost or dew point. From the mirror temperature, the amount of atmospheric water vapor may be derived.
The instrument weighs about 400 grams including batteries (but excluding the cryogen). The lightweight CFH design is ideal for balloon-borne applications; it can be launched with smaller balloons than previous sounding devices. The entire assembly is enclosed in an insulating foam box with only the 17- cm-long steel air inlet tubes extending above and below the foam 12 cm beyond in both directions. The extension of these steel tubes from the instrument body enables clean sampling of ambient air. Due to more simplified launch preparations compared to previous implementations, any skilled balloon operator can launch this instrument day or night. Mechanical shielding of sunlight is not necessary, as a phase-sensitive detector accomplishes this.
5.0 Measurements Taken The CFH measures the temperature of the chilled mirror, which is, while covered with the thin layer of condensate, a direct measure of the ambient frost or dewpoint temperature. The in situ frost or dewpoint profiles are converted to vapor concentrations (relative humidity) and mixing ratios using variations of the Clausius-Clapeyron equation. Vapor pressures are calculated using the Hyland Wexler equation for the CFH dewpoint conversion to saturation vapor pressure over liquid water, and the Goff Gratch equation for the CFH frostpoint conversion to saturation vapor pressure over ice.
Mirror measurements happen continuously at intervals of typically less than two seconds during the balloon flight between the surface and the stratosphere, and can be taken within ice- and liquid-phase clouds. The condensation on the chilled mirror is in equilibrium with the ambient water vapor in a particular parcel of air during a CFH launch, meaning that the mirror temperature is then equal to the ambient dew or frostpoint.
M Stuefer and T Gordon, March 2018, DOE/SC-ARM-TR-210
3
The CFH is designed to be combined with a radiosonde, which is used as a data transmitter. For the ARM Southern Great Plains (SGP) site, we use a combination of the CFH instrument with an InterMet iMet-1-RSB radiosonde (http://www.intermetsystems.com/products/imet-1-rsb), and include a Vaisala RS-92 radiosonde for reference comparison. A special rigging assembly places the CFH-iMet combination on one side of a wooden rigging pole, and the Vaisala RS-92 radiosonde to the other side at a distance of typically 1.5 meters. A replacement of the iMet radiosonde with a Vaisala RS-41 radiosonde is anticipated.
During flights, the CFH-radiosonde package collects essential meteorological and positional data, such as barometric altitude, ambient temperature, pressure, and Global Positioning System (GPS) location. See the following section (6.0) under Data Object Description for a full list of values collected.
6.0 Links to Definitions and Relevant Information
6.1 Data Object Description
The Strato software is where instrument operators will both enter parameters prior to flights, and receive real-time data file output. Data files generated by Strato have the filename xxnnnFLT.DAT for the instrument parameters, and xxnnnGPS.DAT for the GPS data. In both filenames, xx stands for the station code, and nnn is a three-digit sounding number. These files contain decoded and calculated parameters as a comma-delimited ASCII table with short headers (Vömel 2015).
The following data fields and their respective units are generated by Strato:
• HMS: Time of day as hr:mm:ss (pre-launch files only), reflects computer time
• Time (min): Time of soundings relative to the launch time, which is given in the header
• Frame: Data frame number, which starts at 0 from the time the radiosonde is powered
• Press (hPa): Pressure from the radiosonde pressure sensor
• Alt (km): Barometric altitude calculated from the radiosonde pressure, temperature, and humidity
• Temp (deg C): Ambient temperature recorded by the radiosonde, including a radiation correction
• Traw (deg C): Raw, uncorrected temperature recorded by the radiosonde
• Theta (K): Potential temperature
• RH (%): Relative humidity over liquid, measured by the radiosonde
• RS Bat (V): Battery voltage of the radiosonde
• TiMetI (deg C): Temperature of Intermet’s internal temperature sensor
• TiMetP (deg C): Temperature of temperature sensor near the Intermet’s pressure sensor
• TiMetU (deg C): Temperature of temperature sensor near the Intermet’s humidity sensor
• TFpV (deg C): Frostpoint temperature calculated from radiosonde RH using the Hyland and Wexler relation to calculate vapor pressure liquid, and the Goff Gratch to calculate vapor pressure/ice
M Stuefer and T Gordon, March 2018, DOE/SC-ARM-TR-210
4
• TFp Hyg (deg C): Frostpoint temperature measured by the CFH. This is the direct mirror temperature transmitted by the CFH.
• H20 Mr (ppmv): Mixing ratio calculated from the CFH frostpoint temperature. Vapor pressure is calculated using the Goff Gratch formula for saturated air. The Strato output does not yet determine the condensate phase, so the mixing ratio is calculated over ice for temperatures below 0 ºC, and over liquid condensate for temperatures above 0 ºC.
• FI: Flag indicating whether CFH frostpoint data should be used (1), or not (0)
• RH FP (%): Relative humidity/liquid calculated from the CFH frostpoint temperature
• Wind (m/s): Wind speed calculated from GPS location measurements
• Wind Dir (deg): Wind direction calculated from GPS location measurements
• GPS alt (km)
• GPS lat (deg)
• Cycle (%): Duty cycle of the CFH heater controller (not currently used)
• Batt (V): CFH battery voltage
• TP2 (V): CFH detector signal
• TOptic (deg C): CFH detector temperature
• RiseR (m/s): Rise rate of the balloon.
6.2 Data Ordering
Data may be ordered from the ARM Data Center via https://www.arm.gov/. CFH data can be located for ordering by manually sorting through categories of data, or through the search option where data can be filtered by instrument, measurements, location, and start and end date of interest.
6.3 Data Plots
Plots of ARM CFH sounding data will be produced after the launches and are available via the ARM Program Data Quality Diagnostic Plot Browser (http://plot.dmf.arm.gov/plotbrowser/). The diagnostic plots show CFH-measured as well as calculated frostpoint temperatures, ambient temperatures derived from the radiosonde, relative humidity, and mixing ratios during the ascending and descending paths of the launch package. Additional graphics have been developed to visualize the path from launch to the landing position, as well as diagnostic plots to quickly detect data gaps or low battery voltage.

M Stuefer and T Gordon, March 2018, DOE/SC-ARM-TR-210
5
Figure 1. Frostpoint and ambient temperature, mixing ration, relative humidity, and saturation vapor
pressure from the ARM diagnostic plot browser tool.

M Stuefer and T Gordon, March 2018, DOE/SC-ARM-TR-210
6
Figure 2. ARM diagnostic plot browser figures depicting the paths of the CFH package.
Figure 3. Plot browser graphics for detection of potential data gaps, diagnostic temperatures, and CFH
voltage and signal information.

M Stuefer and T Gordon, March 2018, DOE/SC-ARM-TR-210
7
6.4 Data Quality
Data Quality Reports (DQRs) contain information about what data has been flagged with qualifiers such as “questionable,” “unreliable,” or “missing.” These DQRs can be accessed via the ARM Data Quality Explorer. Or, a search for CFH data on the ARM Data Discovery browser will conveniently indicate any data which might have been marked as being questionable or unreliable with a color bar underneath the range of available dates.
Faulty frostpoint data are mostly caused by mirror contamination. The CFH’s Strato software has some built-in capabilities of first-order data quality evaluation. Within the flight data file (FLT.DAT) is a data quality flag. The header ‘FI’ stands for flag indicating, and a value of 1 indicates usable CFH frostpoint data, while a value of 0 indicates that data is not reliable.
6.5 Instrument Mentor Monthly Summary
There is typically only one CFH flight per month at SGP to date.
6.6 Calibration Database
The Strato software saves thermistor calibration coefficients (A, B, C, and D) within a *.DE1 extension file (Tab. 2).
7.0 Technical Specification The CFH design has been described in detail by Vömel et al. (2007, 2016). The main CFH piece is a small mirror. The mirror surface temperature is regulated to the thermodynamic equilibrium between the vapor phase of water and its condensed phase. This equilibrium directly relates to the dew- or frostpoint. The CFH measurement technique enables us to measure the amount of atmospheric water through an easier temperature measurement. A high-conductivity (oxygen-free, high-conductivity) copper-and-gold-plated finger piece and an individually calibrated (to a NIST-traceable standard) thermistor are attached to the mirror. The thermistor is glued into the mirror about 2 mm off center, and the finger piece extends into a foam compartment that is filled with the chilled Trifluormethane R23 cryogenic liquid during the flight. Typically the cryogen is initially cooled to -80ºC, and without heating, the mirror would adjust to the cryogen temperature. A heating coil connected to the finger piece increases the temperature of the chilled mirror in order to maintain the thin layer of condensate. The mirror temperature cannot surpass 40° C, preventing an accidental burnout of the mirror heater.
The frost or dew coverage is detected by a pair of optical phase-sensitive photodiodes that react to the LED infrared light. The two photodiodes are highly temperature sensitive, used in parallel with a second photodiode/LED pair, and are thermally connected to ensure temperature stabilization, as to eliminate drift in the baseline signal. They measure the bulk reflectivity of the mirror, and a feedback controller receives this signal from the photodiodes, initializing heating at a high frequency in order to maintain the mirror temperature at the ambient frostpoint. This temperature maintenance ensures that, in turn, the bulk reflectivity, and thus the condensate layer, remains constant.
M Stuefer and T Gordon, March 2018, DOE/SC-ARM-TR-210
8
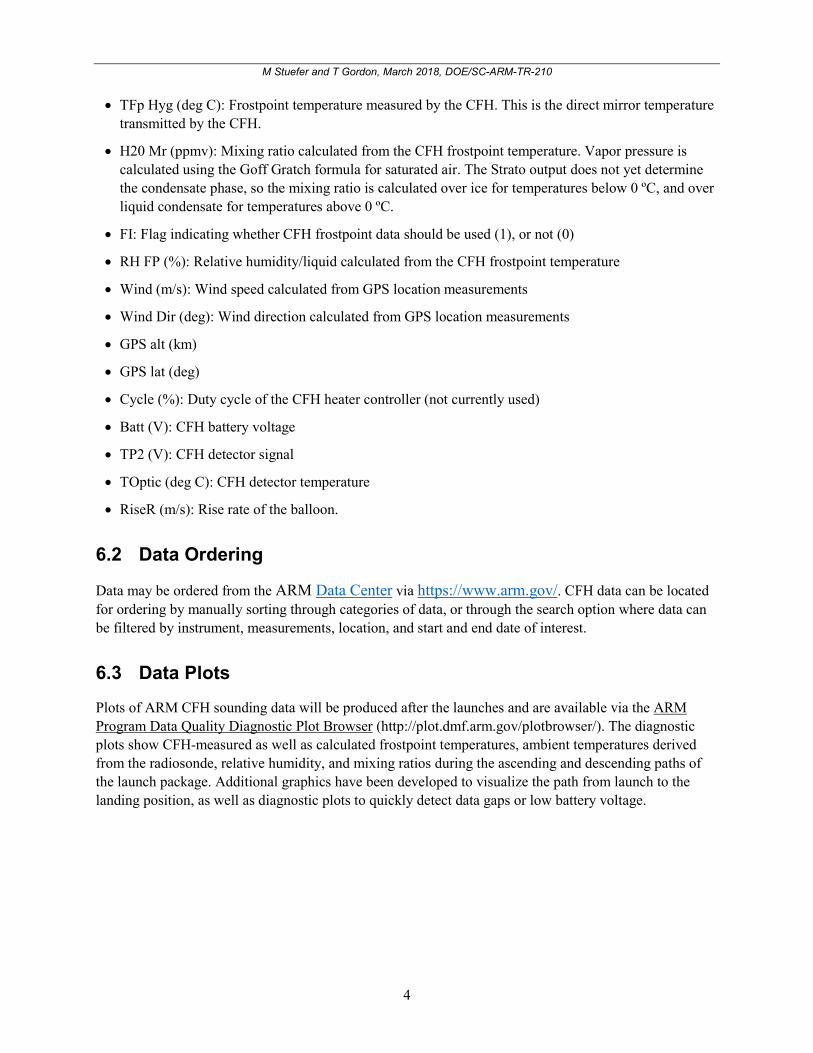
Table 1. CFH specification.
CFH weight (without cryogen) 400 g Mirror diameter 7 mm Mirror thickness 1.27 mm Max mirror temperature limit 40ºC Altitude range 0-30 km Dimensions (without tube) 6.5’W x
12’L x 5’H
7.1 Units • Pressure: hPa, mb • Frequency: MHz • Resistance: Ohms • Reflectivity (mirror): % • Total precipitable water: mm • Pump flow rate in seconds • Temperature: C (ambient and raw), K (potential temperature) • Time: minutes, seconds for computer time, sounding time • Altitude: km • Mass: grams • Relative humidity: % • Battery: V/voltage • Detector signal: V • Concentrations: ppmv (mixing ratio of ozone) • Current-µA/microamperes (background current), mA/milliamps • Wind speed: m/s • Wind direction: degrees • Thickness: mm (mirror thickness) • Diameter: mm (mirror diameter) • Uncertainty: K (mirror temperature measurements)
The full range of measurements by the CFH and accompanying instrumentation can be best gleaned from section 6.1, Data Object Description.
7.2 Range
The CFH measures dew- or frostpoint temperatures in all climates from the surface to the altitude of the balloon burst (typically around 30 km altitude), covering all of the troposphere, and the lower up to the middle stratosphere.
• Detection for dew or frostpoints: > + 25°C to < -80°C
• Mixing ratio detection: > 25000 ppmv to < 0.8 ppmv
• Vertical resolution: < ~50m (troposphere) to < ~100m (stratosphere)

M Stuefer and T Gordon, March 2018, DOE/SC-ARM-TR-210
9
The current state of the instrument’s technology makes the CFH particularly useful for process studies within the tropical upper troposphere and polar lower stratosphere.
7.3 Accuracy
The CFH is based on the old NOAA/CMDL frostpoint hygrometer (FPH), but new features and optimization of previous structures have improved the design and accuracy of water vapor measurements, particularly of the atmosphere between the surface and 25-30 km altitude in all climate regimes.
The use of a microprocessor instead of simple analog electronics is primarily responsible for this improved performance, as the microprocessor controller regulates the mirror temperature so as to keep the bulk reflectivity of the frost-covered mirror consistent. This consistency is achieved by the built-in controller code that applies the individual thermistor calibration to calculate mirror temperature, eliminating the risk of operator error in manual calculations.
Other contributing factors to improved accuracy of measurements include the optimized optical path that eliminates the possibility of influences of the mirror edge on the frost detection, and air inlet tubes that extend far enough from the instrumentation to prevent self-contamination. Unlike partially analog instrumentation, the CFH does not experience radio frequency interference (RFI) that may offset mirror temperature readings.
This improved accuracy of water vapor measurements has been demonstrated on both ascent and descent of the CFH in the reduction of cloud contamination effects. CFH water vapor measurements have been compared to the NOAA/CMDL hygrometer and the Russian Fluorescent Lyman Alpha Stratospheric Hygrometer, the NOAA/CSD frostpoint hygrometer, and the Harvard Lyman-alpha hygrometer (Vömel et al., 2007). In general, in situ chilled mirror instruments compared to each other well, and the developer points out the suitability of the CFH for validation of radiosondes, satellite measurements, process studies in the upper troposphere and lower stratosphere, and dehydration observations in the tropical upper atmosphere. Vömel et al. (2007) compared the CFH to the NOAA/CMDL frostpoint hygrometer and the Aura MLS instrument, and found excellent consistency. Observations made within clouds were found to be consistent with cloud physics, and values fall within measured uncertainties (2007).
7.4 Repeatability
The repeatability of CFH readings has been well demonstrated in dual CFH soundings at the German Weather Service site of Lindenberg, Germany (Vömel et al., 2016).
7.5 Sensitivity
The CFH measures frostpoint temperatures with highly sensitive thermistors. The measurements relate to water vapor sensitivities at the parts-per-million level. This makes the instrumentation exceptionally suitable for the stratosphere, which tends to be dehydrated relative to the troposphere.

M Stuefer and T Gordon, March 2018, DOE/SC-ARM-TR-210
10
7.6 Uncertainty
Uncertainties of water vapor measurements using the CFH have been quantified with both field data and laboratory observations (Vömel et al., 2016). Most of the uncertainty of CFH mirror temperature measurements is related to the stability of the feedback controller, which activates the cooling or heating of the CFH mirror. Systematic CFH errors were quantified to be less than 0.1 K, while total uncertainties are described to be better than 0.2 K under good conditions.
Table 2. Contributions of different sources to the uncertainty of CFH measurements.
Sources Uncertainty
Controller 0.1 K
Calibration 0.1 K
Frost-layer morphology 0.K*
Balloon and parachute outgassing 0.K**
Trace gas interference Negligible
*Frost-layer morphology might be a source of uncertainty due to unknown phase changes from supercooled water to ice. ** Uncertainties due to mirror contamination from outgassing effects are removed by visual data inspection.
Sources of CFH measurement uncertainties include the mirror temperature controller, temperature sensor calibration, bias due to variations in the manufacturing process, variations in the frost-layer morphology due to temperatures and mirror contamination causing supercooled water to freeze, outgassing by the balloon envelope and the parachute, and trace gas interference (Table 2).
Using dual CFH launches to compare the results of CFH instruments to each other, Vömel et al. (2016) showed that individual mirror temperature readings do not represent the equilibrium temperature between the gas phase and the condensed phase on the mirror. A condensate layer at its surface characterizes the mirror at the equilibrium. Mirror temperatures are recorded typically at intervals less than two seconds, which is faster than the time period needed for the mirror to cool and form a stable layer of condensate. As a result, the individual temperature readings are oscillating around the equilibrium frostpoint temperature. Laboratory measurements at the Aerosols Interaction and Dynamics in the Atmosphere (AIDA) test facility at the Karlsruhe Institute of Technology revealed that the time for the CFH to gain equilibrium at very low temperatures was faster than 20 seconds. Therefore, a mean mirror temperature averaged over a period of 10 seconds typically yields best results.
Uncertainties related to the calibration of the CFH thermistors have been derived by recalibration of thermistors, and comparing mirror temperature data from simultaneous CFH soundings. Laboratory tests indicated a variation of thermistors of less than 0.02 K; the variation depends on the temperature, with the smallest variations corresponding to lower temperatures. The standard deviation difference between temperatures from dual soundings was quantified with 0.11 K in the troposphere and 0.09 K in the stratosphere.

M Stuefer and T Gordon, March 2018, DOE/SC-ARM-TR-210
11
Other sources of uncertainties are relatively small, or are removed by analysis of the data. A measurement bias due to small manufacturing changes of thermistor locations on the mirror have been observed for older CFH models, and has been recently eliminated. Unreliable CFH data may also occur due to the mixed-phase contamination of the mirror, such as when supercooled water drops and ice both cover the surface. In order to reduce these adverse effects, the CFH controller is designed to force the condensate to freeze at temperatures of -15ºC, eliminating the liquid/ice ambiguity maintained by other chilled mirror hygrometers. Supercooled water is assumed to exist between 0ºC and -15ºC. Other mirror contamination sources causing inaccurate frostpoint reading at the mirror include water vapor outgassing effects at the balloon surface, strings, intake tubes, or the parachute changing the humidity of the immediate environment. These effects are especially evident for cases when the balloon passes through liquid water clouds, and can be eliminated during the post-processing by visual inspection of the data.
7.7 Input Voltage
The CFH has 12-Volt (V) batteries. The voltage typically drops to 11V under load without cryogen added. After adding cryogen, when the heater starts working, the battery may dip as low as 9V. Very short periods of 8V should not last more than a few seconds at a time.
The CFH detector signal (V) and CFH specular (V) are saved within the metadata (.DE1) file as the voltage at the time of the final reflectivity setting. These values are entered into Strato manually. If the detector signal falls below 2.5 V, the mirror heater will turn on and the mirror temperature will increase.
The battery voltage is tracked within the Strato program in the flight data files (see section 6.1, Data Object Description).
7.8 Input Current
The description metadata file (.DE1 file) contains all metadata relevant to the recorded data, including specular photocurrent (mA) and Bias photocurrent (mA). The specular photocurrent refers to the detector specular current and the Bias photocurrent refers to the detector bias current, both of which are exclusive to the NOAA frostpoint hygrometer. Additionally stored in the .del file is the background current (µA) used in processing.
7.9 Input Values
Input values describing CFH instrument-specific characteristics, flight location name, and values defined during the CFH setup process are typically saved to the DE1 extension metadata file (Vömel 2015). The description metadata file (.DE1) contains all the metadata relevant to the recorded data. Some inputs are entered before flights, and should not be manually edited. Most data are entered during the initial questionnaire during the startup of the Strato software. The DE1 file is populated during the flight (i.e., burst altitude, atmospheric pressure at burst altitude). An example of the DE1 data file is presented below:

M Stuefer and T Gordon, March 2018, DOE/SC-ARM-TR-210
12
Table 3. DE1 metadata description file generated before and during each flight.
NOAA/CMDL flight description file produced on November 3, 2016 at 19:17:31 strato version
9.53
Telemetry and data analysis software written by Holger Vömel
• Flight number = OK036 • Flight date = 03-11-2016 • Launch time = 11:19:52 • Date [GMT] = 03-11-2016 • Time [GMT] = 16:19:52 • Location = ARM/CART SGP, Oklahoma • Longitude = -97.4900 • Latitude = 36.6100 • Time stamp in raw data file = GMT • Computer to GPS delay (sec) = 45.8 • Launch altitude (km) = 0.313 • Surface pressure (mb) = 999999999999 • Surface temperature (deg) = 999999999999 • Surface humidity (%) = 999999999999 • Burst altitude (km) = 32.908 • Burst pressure (mb) = 7.460 • Mean rise rate to 100 hpa = 4.7 m/s • Instrument type = Water Vapor Sonde • A/D System = IMet • Radiosonde number = 0000000 • Radiosonde type = InterMet IMet1 RSB • Intermet humidity sensor = • External instrument 1 = CFH Water Vapor Sonde • IMet time out interval = 5 • Radiation correction = Yes • Radiation correction vers. = 1.0 • Hygrometer number = 2L5105 • CFH detector signal (V) = 2.7121 • CFH specular (V) = 4.267 • Reflectivity (%) = 88.00 • Amplifier offset (V) = 0.0000 • CFH serial number = 5105 • Code version = 6.440 • CAL A = 299431 • CAL B = 328131 • CAL C = 516101 • CAL D = 356999 • Detector signal = 2.71210 • Specular = 4.26735
M Stuefer and T Gordon, March 2018, DOE/SC-ARM-TR-210
13
• Reflectivity = 88.00 • Setpoint temperature = 37.90 • AD630 offset = 0.05000
7.10 Output Values
The Strato software generates flight output. Output is written to a binary file xxnnn.RAW file and the ASCII type files xxnnnFLT.DAT for the instrument parameters and xxnnnGPS.DAT for the GPS flightpath and derived wind data. A file xxnnn.MES includes a list of all Strato software activities and performance related to a certain CFH instrument launch (log file). All filenames are designated with xx as the station code (OK for SGP), and nnn is a three-digit sounding number (Vömel 2015).
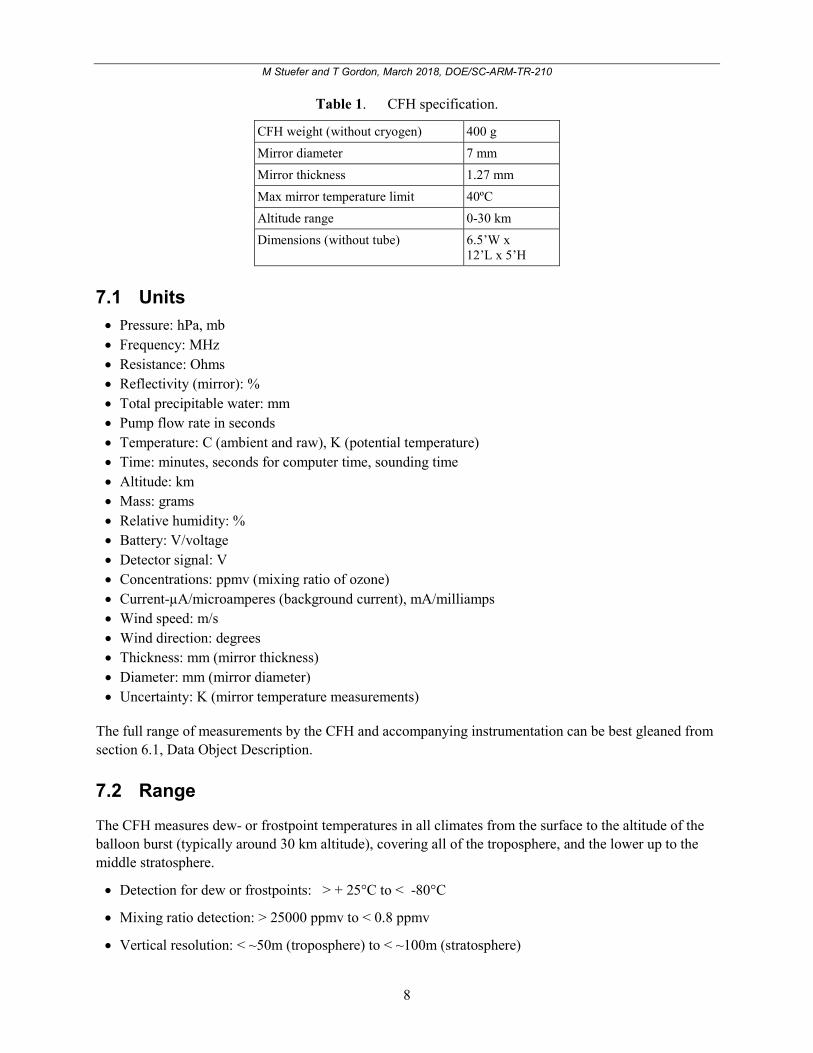
8.0 Instrument System Functional Diagram
Figure 4. Sketch of CFH instrument elements (from Vomel et al., 2007). The dashed lines indicate the
location of the vertical air inlet tubes. The drawing of these components is not to scale.
9.0 Instrument/Measurement Theory The CFH is designed to take advantage of the chilled mirror principle. Chapter 7 (Technical Specifications) describes the instrument theory.
10.0 Setup and Operation of Instrument The following hardware components are necessary for operating the CFH:
• USB cable, Type A to Mini 5-Pin Type B (for the IMet)

M Stuefer and T Gordon, March 2018, DOE/SC-ARM-TR-210
14
• CFH serial cable (for the Vaisala CFH)
• CFH mirror-cleaning supplies (cotton swabs and pure methanol)
• CFH setscrew driver (0.9 mm, or, 0.035” hex screwdriver).
There are two versions of the CFH: the 1L CFH (Vaisala) and the 2L CFH (Intermet). The difference between the two is how they connect to the computer. The 1L uses a special serial cable, while the 2L uses a USB cable. We use the 2L version of the CFH within ARM.
Figure 5. CFH electronic control circuit.
Following are flight directions for the CFH version 2L. Initially the CFH requires preparation with the setup and components of the CFH for a flight.
• CFH prepared according to CFH-setup. See software section (11).
• Battery compartment with 8 x 3V lithium CR123A batteries
• Data cable CFH-Ozon (ozone is not applicable for ARM SGPs)
• 1 pair of tubes with glue.

M Stuefer and T Gordon, March 2018, DOE/SC-ARM-TR-210
15
Figure 6. CFH components including battery compartment and air-inlet tubes.
The following components are necessary for the preparation of a CFH launch:
● Eight 3V lithium CR123A batteries and battery compartment
● Data cable to connect the CFH with the IMet radiosonde
● A pair of tubes with epoxy glue
● IMet with two 3V lithium batteries.
The CFH assembly includes the following steps:
1. Attach the tubes to the CFH with epoxy glue.
2. Insert batteries in the IMet radiosonde.
3. Use double-sided tape to attach the IMet to the opposite site of the CFH.
4. Insert batteries into the battery compartment, and check the batteries’ state. If two lights to the left of the battery openings are on, as pictured in Figure 8, the good condition of the batteries is confirmed.

M Stuefer and T Gordon, March 2018, DOE/SC-ARM-TR-210
16
Figure 7. CFH package combined with IMet radiosonde.
Figure 8. The battery compartment for the CFH, with the battery state lights on the left. Right: The
battery compartment placed inside the foam box.
5. The battery compartment may now be placed inside the foam box, and the battery cable should be guided through an opening in the foam box to the outside of the box. The battery holster should be secured with a piece of foam wedged between it and the wall of the foam box, as to avoid short-circuiting the circuit board (see Figure 8).
Prior to the final assembly of the CFH, perform the Strato software setup listed in the beginning of Section 11.0 (software), and then return to this section for the rest of the CFH setup instructions below.
6. Attach tubes into the CFH with glue.

M Stuefer and T Gordon, March 2018, DOE/SC-ARM-TR-210
17
Figure 9. Attaching the air-inlet tubes with epoxy glue.
To launch the CFH, hang the sonde, ensuring ventilation until a few moments before launch. Activate the CFH and the IMet.
Switch on the CFH (prior to filling the cooling liquid!).
Fill cooling liquid into a cup, and transfer it into the CFH slowly, close the opening carefully. The launch has to occur about 5-10 minute after inserting the cooling liquid. If there are delays, be sure to top off with more cooling liquid. The CFH must not be detached from the battery after inserting the cooling
liquid!
11.0 Software Two programs are required to perform the CFH setup (‘CFH.setup’) and to initiate and decode the telemetry data (‘Strato’).
First start CFH.setup. It will show either blank or previous CFH settings and a status window, which will show the communication log.
As soon as the CFH is connected to the computer and powered, it will send its settings to CFH.setup. The settings transferred are those from the last time the instrument has been powered. If all windows showing CFH settings stay with a white background, then the last time the instrument has been checked, all settings have been properly adjusted. If any of the indicators turns red, then the last time the instrument has been checked, it has not been properly adjusted and needs to be re-checked. The following information is compiled from the CFH manual (Vömel 2012).
The message ‘Check COM port or CFH Connection’ indicates that the serial port is not available. Please configure the appropriate serial port using the Properties menu. The message should not repeat if a valid serial port has been selected.
If there is no message after the CFH has been powered, try any of the following:
• Select File->New Instrument (or CTLR-n) to reset the COM port and the CFH.
M Stuefer and T Gordon, March 2018, DOE/SC-ARM-TR-210
18
• Check the COM port selection in the properties menu.
• Check the USB connection.
• Check the power supply to the CFH.
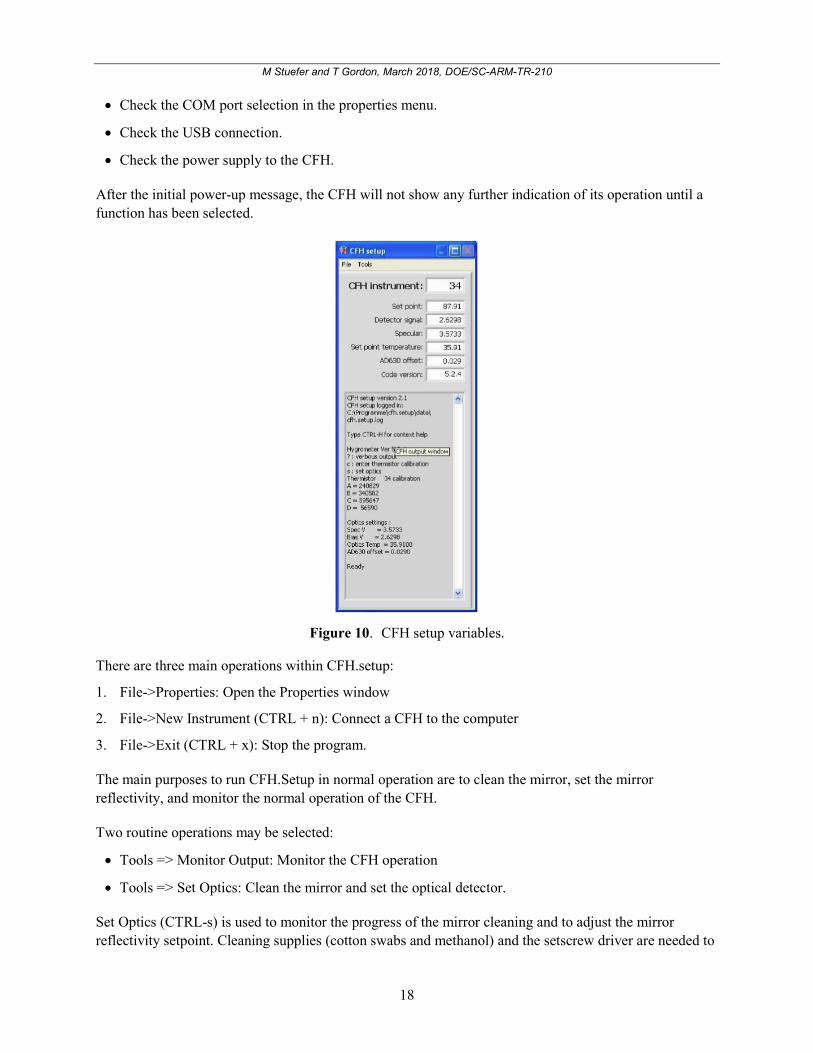
After the initial power-up message, the CFH will not show any further indication of its operation until a function has been selected.
Figure 10. CFH setup variables.
There are three main operations within CFH.setup:
1. File->Properties: Open the Properties window
2. File->New Instrument (CTRL + n): Connect a CFH to the computer
3. File->Exit (CTRL + x): Stop the program.
The main purposes to run CFH.Setup in normal operation are to clean the mirror, set the mirror reflectivity, and monitor the normal operation of the CFH.
Two routine operations may be selected:
• Tools => Monitor Output: Monitor the CFH operation
• Tools => Set Optics: Clean the mirror and set the optical detector.
Set Optics (CTRL-s) is used to monitor the progress of the mirror cleaning and to adjust the mirror reflectivity setpoint. Cleaning supplies (cotton swabs and methanol) and the setscrew driver are needed to
M Stuefer and T Gordon, March 2018, DOE/SC-ARM-TR-210
19
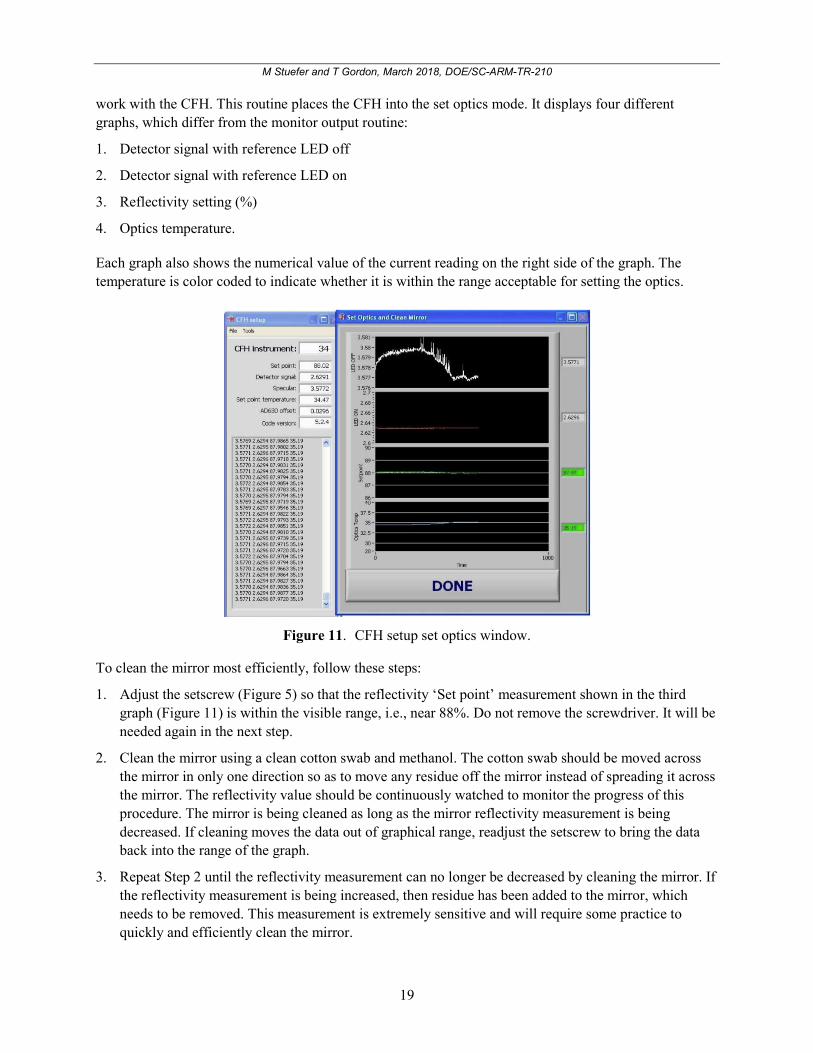
work with the CFH. This routine places the CFH into the set optics mode. It displays four different graphs, which differ from the monitor output routine:
1. Detector signal with reference LED off
2. Detector signal with reference LED on
3. Reflectivity setting (%)
4. Optics temperature.
Each graph also shows the numerical value of the current reading on the right side of the graph. The temperature is color coded to indicate whether it is within the range acceptable for setting the optics.
Figure 11. CFH setup set optics window.
To clean the mirror most efficiently, follow these steps:
1. Adjust the setscrew (Figure 5) so that the reflectivity ‘Set point’ measurement shown in the third graph (Figure 11) is within the visible range, i.e., near 88%. Do not remove the screwdriver. It will be needed again in the next step.
2. Clean the mirror using a clean cotton swab and methanol. The cotton swab should be moved across the mirror in only one direction so as to move any residue off the mirror instead of spreading it across the mirror. The reflectivity value should be continuously watched to monitor the progress of this procedure. The mirror is being cleaned as long as the mirror reflectivity measurement is being decreased. If cleaning moves the data out of graphical range, readjust the setscrew to bring the data back into the range of the graph.
3. Repeat Step 2 until the reflectivity measurement can no longer be decreased by cleaning the mirror. If the reflectivity measurement is being increased, then residue has been added to the mirror, which needs to be removed. This measurement is extremely sensitive and will require some practice to quickly and efficiently clean the mirror.

M Stuefer and T Gordon, March 2018, DOE/SC-ARM-TR-210
20
4. Once the mirror has been cleaned, i.e., the reflectivity measurement can no longer be lowered using the cotton swabs, turn the setscrew until the reflectivity measurement is within 88±0.1%. The screw has been set using Loctite and may be difficult to turn. If this so, then values between 85% and 90% are acceptable parameters. However, a note of this condition should be taken and added to the metadata for that sounding.
5. After the optics have been properly set, terminate this routine by pressing ‘DONE’. While setting of the reflectivity, the optics temperature should be between 34°C and 39°C. The proper range is indicated by the green color next to the graph.
The STRATO software is required to initiate and decode the telemetry during the CFH launches. STRATO requires the Microsoft Windows XP® operating system. STRATO records and analyzes telemetry data from small balloon-borne packages, and was written by Holger Vömel at the University of Colorado in collaboration with the water vapor and ozone group at NOAA/CMDL.
Figure 12. Input flight name should be checked for the correct flight name, and F12 initiates the system
configuration procedure.
Configuration of the Strato software according to the follow steps is necessary prior to full assembly of the CFH:
1. Open the STRATO software by clicking on STRATO.EXE.
2. Check for the correct flight name by ‘input flight name’ (i.e., for the ARM SGP Central Facility, enter OK + number of CFH launch). The standard flight name (xxnnn) contains two letters and three digits, using a code for the flight location as the first two letters.
3. Check the rest of the system configuration with F12.

M Stuefer and T Gordon, March 2018, DOE/SC-ARM-TR-210
21
Figure 13. Additional parameters defining each specific CFH launch.
Figure 14. Continue selecting CFH and IMet variables.
4. Enter the following variables by hand within STRATO.exe: • Read data serial/file: S, for serial
• Local time: Time
• Flight name: See Step 2 for a flight name example (a max. of five digits is allowed)
• Time zone: GMT + xx
• Pressure (hPa): Start value for surface pressure; pre-filled
• Temperature (deg C): Start value for surface temp.; pre-filled

M Stuefer and T Gordon, March 2018, DOE/SC-ARM-TR-210
22
• Humidity: Start value for surface humidity; pre-filled
Instrument type: Specifies the configuration of the balloon payload. i.e., 3 (water-ozone- sonde)
• Hygrometer number: 3L2515 (1 = RS80, 2 = IMet, 3 = Filter vor Linse). This is the serial number for the frostpoint instrument.
• CFH detector signal (V): 2.6122 (enter the detector signal measured after the mirror cleaning,
which should correspond to the same field in cfh.setup)
• Specular (V): 3.4390 (enter the specular voltage signal measured during the mirror cleaning, which should correspond to the same field in cfh.setup. This value refers to the higher voltage representing the clear mirror signal without reference.)
• Reflectivity (%) 88.05 (calculated value from detector signal and specular)
• AD630 offset: 0 (no AD after Code Version CFH 3.1)
• Number Solution: 11 (cont. number of used solution)
• Lab Temp: 22.6 (temperature of the lab, in case of volume flow measurement)
• Lab Humidity for Flow Rate Measurement: 52 (humidity of the lab, in case of volume flow measurement)
• Measured Flow Rate Correction: 0 (pre-filled)
• Intermet sonde : P20387 (Strato is asking for the serial number)
• Values Correct?: Y/N (Values can be changed/corrected if you select no— you will be taken to the beginning of the input questionnaire. Confirm entries with an ‘enter’ entry.)
12.0 Calibration Frostpoint hygrometers depend upon the accurate calibration of the mirror temperature measurement process. The calibration procedure using the CFH.setup program has been described in the previous Software section. The CFH calibration encompassed mirror cleaning while adjusting the mirror reflectivity setpoint. Calibration files are stored under the ‘C:\Programs\cfh.setup\data’ directory that is created by the initial run of CFH.setup.
• During flight preparation, a check of the CFH.setup window will show a red field for ‘CFH instrument’ if any of the instruments are missing calibration coefficients, or if there are out-of-range values. An instrument without calibration will not report a proper mirror temperature.
• The thermistor calibration file specifies all thermistor calibration constants. The default location is: C:\Program Files\cfh.setup\data\cal.4point.resistances.dat .
M Stuefer and T Gordon, March 2018, DOE/SC-ARM-TR-210
23
13.0 Maintenance CFH instruments are retrieved after each flight, and re-used. Typically little damage has been found to the CFH Styrofoam body because of the small instrument mass and the relatively low landing impact due to the parachute used during descent. CFH instrument maintenance includes a visual inspection for any fractures in the CFH housing and for cracks in the cooling-liquid compartment. In rare cases the foam housing needs to be rebuilt. Before re-use, the 17-cm-long steel air inlet tubes have to be carefully removed, the CFH mirror cleaned, and new tubes inserted with epoxy glue. The normal setup procedures (chapter 10) are applicable for used CFH instruments.
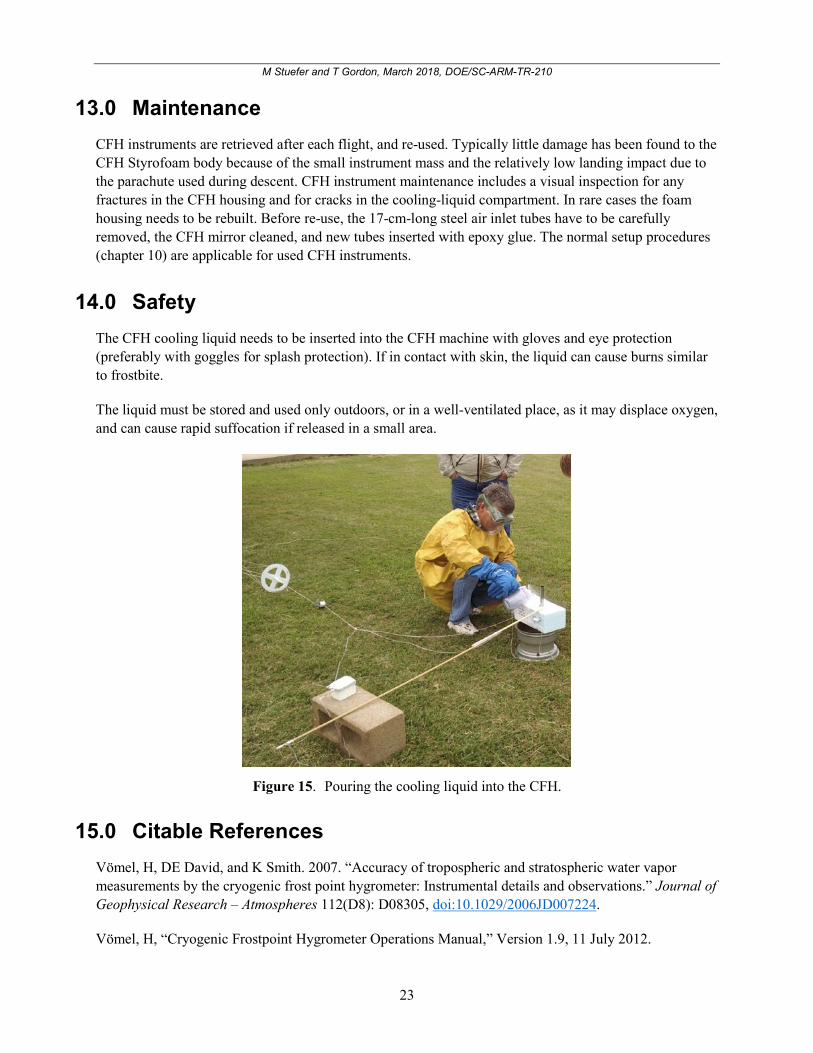
14.0 Safety The CFH cooling liquid needs to be inserted into the CFH machine with gloves and eye protection (preferably with goggles for splash protection). If in contact with skin, the liquid can cause burns similar to frostbite.
The liquid must be stored and used only outdoors, or in a well-ventilated place, as it may displace oxygen, and can cause rapid suffocation if released in a small area.
Figure 15. Pouring the cooling liquid into the CFH.
15.0 Citable References Vömel, H, DE David, and K Smith. 2007. “Accuracy of tropospheric and stratospheric water vapor measurements by the cryogenic frost point hygrometer: Instrumental details and observations.” Journal of
Geophysical Research – Atmospheres 112(D8): D08305, doi:10.1029/2006JD007224.
Vömel, H, “Cryogenic Frostpoint Hygrometer Operations Manual,” Version 1.9, 11 July 2012.

M Stuefer and T Gordon, March 2018, DOE/SC-ARM-TR-210
24
Vömel, H, “Strato/Balloon Data Output Guide,” Version 1.2, 14 October 2015.
Vömel, H, T Naebert, R Dirksen, and M Sommer, 2016. “An update on the uncertainties of water vapor measurements using cryogenic frost point hygrometers.” Atmospheric Measurement Techniques 9(8): 3755-3768, doi:10.5194/amt-9-3755-2016.