
Crustal structure in southern Tyrrhenian sea from seismic ...

Originally published as: Stankiewicz, J., Parsiegla, N., Ryberg, T., Gohl, K, Weckmann, U., Trumbull, R., Weber, M. (2008): Crustal Structure of the Southern Margin of the African Continent: Results from Geophysical Experiments. - Journal of Geophysical Research, 113, B10313 DOI: 10.1029/2008JB005612.
1
Crustal Structure of the Southern Margin of the African 1
Continent: Results from Geophysical Experiments. 2
3
J. Stankiewicz, N. Parsiegla, T. Ryberg, K. Gohl, U. Weckmann, R. Trumbull & M. Weber. 4
5
Abstract 6
A number of geophysical onshore and offshore experiments were carried out along a profile across the 7
southern margin of the African Plate in the framework of the Inkaba yeAfrica project. Refraction 8
seismic experiments show that Moho depth decreases rapidly from over 40 km inland to around 30 km 9
at the present coast, before gently thinning out towards the Agulhas-Falkland Fracture Zone, which 10
marks the transition zone between continental and oceanic crust. In the region of the abruptly 11
decreasing Moho depth, in the vicinity of the boundary between the Namaqua-Natal Mobile Belt and 12
the Cape Fold Belt, lower crustal P-wave velocities up to 7.4 km/s are observed. This is interpreted as 13
metabasic lithologies of Precambrian age in the Namaqua-Natal Mobile Belt, or mafic intrusions added 14
to the base of the crust by younger magmatism. The velocity model for the upper crust has excellent 15
resolution, and is consistent with the known geological record. A joint interpretation of the velocity 16
model with an electrical conductivity model, obtained from magnetotelluric studies, makes it possible 17
to correlate a high velocity anomaly north of the centre of the Beattie Magnetic Anomaly with a highly 18
resistive body. 19

2
20
1. Introduction 21
22
A number of features make southern Africa a key site for integrated geophysical and geological 23
research on continental accretion and break-up. Bounded to the south by the Agulhas-Falkland Fracture 24
Zone (AFFZ, Fig. 1), this region represents one of the world’s best examples of a sheared continental 25
margin which formed during break-up of Western Gondwana from about 130 Ma (Ben-Avraham et al., 26
1997). At the same time, a classic volcanic rifted margin was developing at the western margin of 27
South Africa. The deep crustal structures and physical properties on these two contrasting margin 28
types, and the nature of the continent-ocean transition across them, are key to understanding the 29
processes of continental break-up and passive margin development. The southern margin of Africa is 30
also of great interest because progressively older crustal provinces are crossed as one moves inboard 31
from the coast (Cape Fold Belt, Namaqua-Natal Mobile Belt, Kaapvaal Craton). The boundaries 32
between these crustal provinces are first-order features relating to continental assembly and information 33
on their 3-D geometry is largely lacking. Particularly important in this respect are the Beattie Magnetic 34
Anomaly and the Southern Cape Conductivity Belt (Fig. 1), which run roughly parallel to the boundary 35
of the Cape Fold Belt and Namaqua-Natal Belt, and are among the largest and strongest geophysical 36
anomalies on the African continent. Despite the nearly 100 years since their discovery, the geologic 37
nature of these anomalies is still a mystery. Finally, and superimposed on the crustal mosaic, is the 38
huge and economically important Karoo sedimentary basin of Triassic to Jurassic age and the 39
associated lavas and sills of the Karoo Large Igneous Province (LIP) of about 175-185 Ma age. 40
All of these aspects are addressed in a coordinated program of marine and terrestrial geophysical 41
experiments that has been carried out along the so-called Agulhas-Karoo Geoscience Transect 42
extending from the Agulhas Plateau across the sheared margin and inland as far as the Kaapvaal Craton 43
border (Fig. 1). Beginning in 2004, this work has been one of the main research targets of the Inkaba ye 44
Africa project (de Wit & Horsfield, 2006). Seismic experiments included wide angle refraction 45
(Stankiewicz et al., 2007), and near-vertical reflection (Lindeque et al., 2007) surveys across the Cape 46
Fold Belt and into the Karoo Basin, magnetotelluric profiles (partially coincident with the seismic 47
survey) across the Beattie Anomaly and Cape Conductivity Belt (Branch et al., 2007; Weckmann et al., 48
2007a,b), and offshore refraction and reflection seismics (Parsiegla et al., 2007, 2008). This paper 49
combines and jointly interprets these different data sets along the Western Karoo-Agulhas Profile. 50
51

3
2. Profile Setting 52
53
The northern part of the profile runs through the Karoo Basin (KB. Fig. 1). This retroarc foreland basin 54
is believed to have formed during the accretion of the palaeo-Pacific plate to the Gondwana plate 55
during the Late Carboniferous (Cole, 1992). The basin contains up to 12 km of Late Carboniferous to 56
Mid Jurassic sedimentary strata (Karoo Supergroup) dominated by shale, siltstone and sandstone 57
(Broquet, 1992; Cole, 1992; Cloetingh et al., 1992; Catuneanu et al., 1998). Cole (1992) and Cloetingh 58
et al. (1992) report a thickness of about 4600 m near the northern end of our profile. The Karoo 59
Supergroup is subdivided from the top downwards into the Beaufort, Ecca and Dwyka Groups. An 60
important marker horizon in the Karoo Basin is a series of deep water carbonaceous shales within the 61
Ecca Group (~40 m thick Whitehill and ~180 m thick Prince Albert Formations). In the southern part 62
of the basin along the geophysical profile, the Karoo strata are tightly folded with north-vergence 63
whereas deformation intensity decreases northward and strata have gentler dips. 64
To the south the Karoo Basin is terminated by the Cape Fold Belt (CFB, Fig. 1). This belt comprises a 65
thick sequence of Neoproterozoic to early Palaeozoic metasedimentary rocks (Cape Supergroup), 66
which were deposited in a marginal basin created by inversion of a Pan-African mobile belt (de Wit, 67
1992). The stratigraphy of the Cape Supergroup consists of a lower series up to ~3 km of 68
Neoproterozoic to Cambrian metasediments in local basal rift sequences (e.g., Kango Inlier, Barnett et 69
al., 1997), which are overlain by ~8 km Ordovician to Carboniferous clastic sediments and 70
orthoquartzites (Hälbich, 1983, 1993; Tankard et al., 1982; Broquet, 1992; Catuneanu et al., 1998). 71
Together with the lower units of the Karoo Basin (see above), the Cape Supergroup rocks were 72
deformed at ~250 Ma, with the formation of north-vergent asymmetric or overturned folds and thrust 73
faults (Hälbich, 1993; Hälbich & Swart, 1983). The dominant CFB thrusts are south dipping and may 74
coalesce into a common décollement (Hälbich, 1983, 1993; Newton 1992; Paton et al. 2006). Drill 75
cores discussed by Eglington & Armstrong (2003) show that some of the Cape Supergroup underlies 76
the Karoo Basin, but it is not known how far north the Cape Supergroup extends. 77
The Cape Supergroup, and farther north the KB, unconformably overlie the Namaqua-Natal Mobile 78
Belt (NNMB, Fig. 1). This Mesoproterozoic complex has accreted to the lithospheric core of the 79
Kaapvaal Craton, and experienced successive periods of extension and compression between 2.0 and 80
1.0 Ga (de Wit, 1992). During the Late Proterozoic / Early Cambrian, eroded material from uplifts in 81
the NNMB filled basins to the south, forming the Kango and Kaaimans Inliers (Hälbich, 1993). The 82
NNMB is a highly complex polymetamorphic province that constitutes three sub-provinces or terranes, 83

4
which were amalgamated and attached to the Archaean Kaapvaal Craton during the late 84
Mesoproterozoic (Robb et al., 1999; Eglington and Armstrong, 2003; Raith et al., 2003; Dewey et al., 85
2006; Eglington, 2006 and references therein). The age of peak metamorphism across all terranes was 86
1.02-1.04 Ga (Eglinton, 2006), and assemblages indicate upper amphibolite to granulite-facies 87
conditions with locally extensive generation of crustal melts now represented by megacrystic 88
orthogneisses. The structural history of the NNMB includes regional ductile deformation with refolded 89
recumbent folds, thrusting and listric shear zones that produced strong shallow to steeply- dipping 90
fabrics and regionally extensional shear zones. Interpretation of a seismic refraction profile across the 91
NNMB in the western Cape Province indicated crustal thickness of about 42 km and intermediate P-92
wave velocity of 6.2-6.9 km/s in the lower crust (Green and Durrheim, 1990). Similar results were 93
reported by Hirsch et al. (2008) from a combined interpretation and modelling of gravity and seismic 94
data along an offshore-onshore profile which crosses the Orange Basin off the western coast of 95
Southern Africa, and extends 100 km inland. The crustal thickness and lower-crustal P-wave velocity 96
values at the inland end of this profile are 36-38 km and 6.7 to 7.0 km/s, respectively. The eastern 97
exposures of the NNMB in KwaZulu-Natal comprise a number of litho-tectonic terranes dominated by 98
upper amphibolite to granulite- facies gneisses with occasional charnockites, separated by subvertical 99
ductile shear zones (Jacobs et al.1993; Jacobs and Thomas, 1994; Eglington, 2006; McCourt et al., 100
2006). 101
The profile crosses two major continental geophysical anomalies: the Beattie Magnetic Anomaly 102
(BMA), and the Southern Cape Conductive Belt (SCCB). Both features stretch for more than 1000 km 103
in a roughly east-west orientation (Fig. 1). The BMA, a positive anomaly, was first observed by Beattie 104
(1909). Following a magnetometer array study, Gough et al. (1973) concluded that a large body with 105
high electrical conductivity underlies the NNMB and parts of the KB. Gough (1973) interpreted this 106
Southern Cape Conductive Belt as the signature of a linear plume in the upper mantle. However, de 107
Beer et al. (1974) suggested that, due to their spatial coincidence, the two geophysical anomalies are 108
likely to have a common source, and that such a plume could not account for the BMA. de Beer & 109
Gough (1980) then used Curie isotherms to show that if a common source exists, it must be a crustal 110
feature. Pitts et al. (1992) suggested a sliver of serpentinised oceanic crust, 30 km broad and dipping 111
south from a depth of 7 to 30 km as the source. However, a recent magnetotelluric study by 112
Weckmann et al. (2007a) found no evidence for the existence of such an extensive high conductivity 113
body, which could be the source of the magnetic anomaly at the same time. 114
The offshore section of this western profile starts about 20 km off the coast and stretches over 400 km 115

5
south, past the Agulhas-Falkland Fracture Zone (AFFZ, Fig. 1). Between the AFFZ and the present 116
coast a network of basins, collectively referred to as the Outeniqua Basin (Fig. 1), is located (e.g. 117
Fouche et al., 1992, McMillan et al., 1997, Broad et al., 2006). This complex basin developed due to 118
extensional episodes in Oxfordian / Kimmeridgian and Valangian times exploiting the structural gain 119
of the underlying Cape Fold Belt (e.g. McMillan et al., 1997). The Outeniqua Basin is bounded to the 120
south by a marginal ridge, which was first described by Scrutton and du Plessis (1973) and renamed 121
into Diaz Marginal Ridge (DMR) by Ben-Avraham et al. (1997). While earlier studies (e.g. Scrutton & 122
du Plessis, 1973) describe it as a basement ridge, more recent studies by Parsiegla et al. (2007) suggest 123
a metasedimentary composition of this ridge. South of the DMR, the AFFZ, a large scale fracture zone, 124
is located. The magnetic signature of this fracture zone was first identified by Oguti (1964) south of 125
Africa. The AFFZ marks the southern boundary of the African continent (Talwani & Eldholm, 1973). 126
This sheared continental margin developed as a consequence of dextral strike-slip motion between 127
today’s African and South American continents during the Cretaceous break-up of Gondwana (e.g., 128
Barker, 1979; Rabinowitz & LaBrecque, 1979). During this shear process the originally juxtaposed 129
Southern Outeniqua and Falkland Plateau Basins were separated (e.g. Martin et al., 1981; Ben-130
Avraham et al., 1997) and the major faults of the Outeniqua Basin were bent (e.g. Ben-Avraham et al., 131
1993; Thomson, 1999; Parsiegla et al., 2007). 132
133
3. Seismic data acquisition 134
135
The wide angle seismic experiment was carried out in April-May 2005. The 240 km onshore part 136
(Stankiewicz et al., 2007) consisted of 13 shots (each 75-125 kg of explosives) fired from boreholes 20-137
30 metres deep (Fig. 1). Forty-eight stations (average spacing of ~5 km) each consisting of a GPS 138
synchronised electronic data logger (EDL) and a three-component seismic sensor were used to record 139
the data. The offshore part (AWI-20050100, Parsiegla et al., 2007) consisted of 20 four-component 140
(three component seismometer and a hydrophone component) ocean bottom seismometers (OBS) 141
deployed over 400 km profile length. Eight G-guns and one Bolt-airgun (volume of 96 l) were fired 142
every 60 seconds during cruise SO-182 of the RV Sonne. This gave a shot spacing of approximately 143
150 metres. As the onshore and offshore parts were carried out simultaneously, the airgun shots were 144
recorded by the land receivers, improving the profile's ray coverage, especially beneath the coast. Land 145
shots were not detected by OBSs. 146
147

6
4. Wide-Angle Seismic Data Processing 148
149
Figure 2 shows the high quality of the traces resulting from land shots, recorded by the land receivers. 150
The direct (refracted) P-wave arrival (Pg – red), as well the Moho reflection (PmP – blue) are clearly 151
seen. Examples of airgun shots picked up by land receivers are illustrated in Fig. 3, where, due to the 152
longer offsets, the P-waves refracted in the upper mantle (Pn) are also seen. The airguns produce much 153
less energy than the land shots, but because of their small spacing prominent arrivals can be easily 154
identified. Examples of airgun signals registered by the OBS can be seen in Fig. 4. All together, 24045 155
arrivals were manually picked (Table 1). Pick uncertainty was in the range of 0.05 – 0.25 seconds, 156
depending on the signal to noise ratio. 157
Two travel-time inversion techniques have been used in this study. Standard 2-dimensional 158
tomography involves dividing the cross section beneath the profile into rectangular cells. An initial 159
velocity model needs to be provided, and its values temporarily assigned to the cells. A simple one-160
dimensional model was used here. Synthetic travel times are then computed, and compared to real 161
(picked) ones. An iterative algorithm adjusts the individual values until an optimal model is reached. 162
This study uses the software package FAST (First Arrival Seismic Tomography), which was released 163
by Zelt & Barton (1998). This package is a modification of the algorithm developed by Vidale (1988) 164
to ensure a better detectability of high velocity contrasts. To minimize the influence of the starting 165
model, we have used an iterative approach developed by Ryberg et al. (2007), which repeats the 166
inversion 5 times, using increasingly smaller cell sizes. We have performed the inversion using vastly 167
different starting models, and found no significant differences in the resulting models. A ratio of 1:8 168
was used for the vertical-to-horizontal smoothing constraints. 169
The above technique was used to compute the velocity model for the upper crust beneath the land 170
section of the profile, as well as the northernmost 100 km of the offshore section. The final cell size 171
used was 2 km horizontal by 1 km vertical. For first-arrival tomography calculations it is important to 172
have individual rays crossing each other in every individual cell, so having airgun shots spaced in only 173
one direction from the receivers is not an optimal situation. For this reason only a small part of the 174
offshore section was used, with the purpose of improving the onshore ray coverage rather than trying to 175
compute a detailed offshore model. The resolving capabilities of the algorithm can be tested with 176
checkerboard tests, where checkerboard of alternate positive and negative velocity anomalies is added 177
to the originally computed velocity model. Synthetic travel times are then generated, and an inversion 178
is performed using these times. The inversion result is then subtracted from the initial model. If the 179

7
blocks can be observed in the final model, we can assume that a real feature corresponding to the 180
block's size, position and velocity perturbation would be resolved by our inversion algorithm, and 181
therefore an observed feature like that is likely to be real, and not an inversion artifact. 182
A disadvantage of FAST is that reflected phases cannot be incorporated in the model. For this reason, 183
the travel-time routine RAYINVR (Zelt & Smith, 1992) was used. In this program the 2-D velocity 184
model is defined in terms of layers. Velocity is specified at a number of nodes along the layer 185
boundaries, and a linear velocity gradient is assumed between nodes (both along boundaries, and with 186
depth). Rays may refract in a particular layer, reflect off any boundary, or travel as head waves along it. 187
As with FAST, model quality is determined by comparing synthetic travel times to the manually picked 188
real ones. Modelling is done as an iterative combination of forward modelling and inversion (Zelt & 189
Forsyth, 1994). The resolution of the velocity model depends (among other things) on the number of 190
layers defined, and the node density along them. The marine model of Parsiegla et al. (2007) was 191
computed using this package. Their model consists of 6 layers: a water layer, two sedimentary layers, 192
two crustal layers and the mantle. 193
To produce a starting velocity model for the joint onshore-offshore analysis of the entire profile, the 194
two separate models had to be merged. As a number of reflected phases are available, RAYINVR was 195
considered the more appropriate package to use. For this reason, the onshore FAST model needed to be 196
converted into a layered model, with layers matching the ones in the offshore model. The uppermost 197
sedimentary layer (marine sediments), and obviously the water layer, exist only in the offshore section, 198
so the onshore part consisted of 4 layers. The uppermost of these was a shallow (not exceeding 3 km) 199
zone with velocities typical for sedimentary rocks. The next 2 layers represented the crystalline crust. 200
In the starting model they were separated at a depth of 15 km, using velocities obtained from the FAST 201
at nodes spaced 20 km apart. The boundary between the 3rd and 4th layer was the Moho, set in the 202
starting model at 42 km (after Lindeque et al., 2007). The combined starting velocity model is then 203
iteratively updated, using forward and inverse modelling, until the calculated synthetic travel times 204
match the data as well as possible. While converting from FAST to RAYINVR decreased the 205
resolution of small-scale features in the onshore part, the two modelling techniques complement each 206
other, and our final results are better than what could be achieved using either of the techniques alone. 207
208
5. Results 209
210
5.1. Crustal features beneath the continent 211

8
The upper crust model computed with FAST using first arrivals of land shots (445 P-wave arrivals), as 212
well as airgun shots less that 100 km from coast (3351 P-wave arrivals), is shown in Fig. 5. The RMS 213
travel time residual was 0.045 seconds, and the chi-squared misfit parameter 2.60. Fig. 5 needs to be 214
viewed in conjunction with Fig. 6, which shows the checkerboard tests conducted on the model. These 215
tests confirm that the model is better resolved beneath the land, where features barely twice as wide as 216
the receiver spacing can be resolved in the upper 10 or 15 km. Large scale features, 40 km wide, can be 217
confidently resolved almost to the maximum ray penetration, even beneath the ocean. 218
The model in Fig. 5 is consistent with the model computed using only onshore shots (Stankiewicz et 219
al., 2007). However, the improved ray coverage increased the maximum depth of the model from less 220
than 30 km to almost 40 km, and many of the upper crustal features are better resolved. In the northern 221
half of the profile, the slow velocities (4.6 – 5.3 km/s, red and orange in Fig. 5) characterising the 222
Karoo Basin are clearly visible to depths not exceeding 5 km. Slightly faster (5.4 – 5.8 km/s, yellow 223
and pale green) velocities beneath indicate the relatively thin Cape Supergroup. The resolution of the 224
model does not clearly indicate the contact of the two Supergroups. The checkerboard tests indicate 225
that the thinning of the basin at profile length of 100 km is a real feature – this is consistent with our 226
earlier results (Stankiewicz et al., 2007), which suggested a blind Paleozoic Thrust Fault, which could 227
mark the northernmost deformation of the Cape Supergroup. The thickening of the basin at profile 228
length of approximately 130 km (also well within the resolving capability of the model) is consistent 229
with the large asymmetric syncline inferred from field observations (Cole, 1992). 230
Farther south, the geometry of the listric Kango Fault (KF) is resolved much more clearly than in the 231
earlier results (Stankiewicz et al., 2007). Near the surface (at ~170 km profile length) this fault marks 232
the northern edge of the Jurassic Uitenhage basin, characterised by very low velocities (~4.5 km/s). The 233
offshore section of the model is not well resolved, which was expected from the shot-receiver geometry 234
explained in the previous section. However, the very low velocities representing the sediment cover (< 235
5 km/s) are clearly seen to be significantly deeper than onshore. 236
237
5.2. Combined onshore-offshore model 238
The final RAYINVR model is shown in Fig. 7. The programme used 21,868 travel times (over 90 % of 239
the picks). The RMS travel time residual was 0.134 seconds, which is within the uncertainty bounds of 240
individual picks. The chi-squared misfit parameter was 1.74. Table 2 shows how these uncertainties 241
vary for different phases. A value greater than 1 for the chi-squared parameter means the small-scale 242
features of the model have not been resolved (Zelt & Forsyth, 1994), so we will concentrate our 243

9
discussion on the large-scale features. A likely explanation for a large value of chi-squared is the 244
presence of 3-D effects, in particular the fact that the onshore and offshore parts of the profile are not 245
perfectly aligned (Fig. 1). Examples of ray paths in the model are shown in Fig. 8. The relative ray 246
coverage available is shown in Fig. 9, with red areas indicating poor ray coverage. 247
In addition to the standard phases Pg and PmP, an unusual phase has been observed on the traces 248
recorded from the two southernmost shots (Px – Fig. 2). The amplitude of this phase is of similar order 249
of magnitude to the PmP. Furthermore, the phase is most prominent in the vertical component, so we 250
interpret it as P-waves reflected inside the crust. As a reflected phase, these travel times could not be 251
included in the FAST model, and the corresponding reflector location was derived with RAYINVR 252
using the floating reflector technique. The position of the reflector that best fits the observed travel 253
times was found to be between profile km 190 and 220, rising steeply southwards from a depth of 35 254
km to 23 km (Fig. 7). The steep landward dip of this reflector makes it impossible to detect reflections 255
of airgun shots off it, the same way the steeply rising Moho was invisible. 256
The most interesting feature of the joint model shown in Fig. 7 is the Moho discontinuity, clearly 257
visible as a high-velocity contrast. The Moho depth beneath the Karoo Basin is ~40 km, and slightly 258
deeper (~42 km) beneath the CFB. The crustal thickening beneath the CFB is consistent with receiver 259
function analyses (Harvey et al., 2001; Nguuri et al., 2001). However, the study by Nguuri et al. 260
(2001), while detecting the thickening, consistently locates the Moho approximately 5 km deeper than 261
reported here. This could be due to the fact that these authors use an average crustal velocity of 6.5 262
km/s. This value is typical for the Kaapvaal Craton at which their study was aimed, but is too high for 263
off craton analysis. Our results are much closer to those of Harvey et al. (2001), who subdivided the 264
crust into regions of different velocity at different depths. 265
South of the CFB the Moho depth becomes more shallow very abruptly, reaching 30 km at the present 266
coast. The depth is consistent with values obtained from an east-west reflection profile of Durrheim 267
(1987), which runs approximately 10 km south of the coast. Farther south the crust continues to thin, 268
albeit much more gradually, for another 250 km, underneath the Agulhas Bank, Outeniqua Basin and 269
the Diaz Marginal Ridge, until it reached the Agulhas-Falkland Fracture Zone (AFFZ). This fracture 270
zone marks the continent-ocean transition (COT). This transition to oceanic crust begins around profile 271
distance of 480 km, where the Moho depth of 20 km is reduced to 12 km over a little over 50 km 272
horizontal difference (Parsiegla et al., 2007). This is a typical length, as well as depth change, for the 273
transition at sheared margins (e.g., White et al., 1992; Bird, 2001). The depth of 11-12 km (i.e. 6-7 km 274
of crust under 5 km of ocean) is observed in the Agulhas Passage, where the southernmost 130 km of 275

10
the profile stretches. 276
277
6. Discussion 278
279
6.1. Crustal Features beneath the continent 280
Most of our shallow results are consistent with the results of the magnetotelluric profile (Weckmann et 281
al., 2007a) coinciding with the northern 140 km of the seismic line. These authors traced the highly 282
conductive Whitehill Formation (pyrite-rich black shales at the bottom of the Ecca Group) for virtually 283
the entire length of their profile, which correlates well with the geometry of the basin obtained with our 284
tomography. The accuracy of the Whitehill’s location in the MT depth section is confirmed by 285
excellent correlation with drill cores (Eglington & Armstrong, 2003; Branch et al., 2007). Weckmann 286
et al. (2007a) also observe an offset in the depth to the shales at the same location as our basement 287
thinning, and also suggest a south dipping thrust as a likely explanation. 288
There is also some correlation between the velocity model and the electrical conductivity image of 289
Weckmann et al. (2007a) for deeper features (Fig. 10). Our model shows a zone of anomalously high 290
velocity (~7 km/s) at a depth of ~15 km between profile km 60 and 90. The size of the body certainly 291
falls within the model’s resolving capability. The southern edge of this anomaly is in the vicinity of the 292
centre of the BMA. In the 2D image of the electrical conductivity distribution, a zone of high electrical 293
resistivity is found at the same location. To the north this zone is flanked by a large mid-crustal region 294
of stacked layers of high electrical conductivity, possibly imaging mineralisations in synforms, and, to 295
the south, by a narrow, southward dipping conductor at 7-15 km depth under the maximum of the 296
BMA. The top of this anomaly is exactly coincident with what a seismic reflection study (Lindeque et 297
al., 2007) called a “complex seismic reflectivity patch”. However, a comparison of magnetic models 298
explaining the magnetic response of the BMA with the electrical conductivity model clearly shows that 299
the electrical conductivity anomaly located beneath the centre of the BMA is too narrow to be a 300
possible source of the BMA (Weckmann et al, 2007b). Fig. 10 shows the two magnetic bodies outlined 301
by black lines, each with a magnetic susceptibility of 0.05 SI. Weckmann et al. (2007b) show that these 302
simple magnetic bodies would produce a response similar to the signature of the BMA. The bodies are 303
separated by a fault, which cuts through at the same inclination as the conductivity anomaly. The gap 304
(some 100 metres wide) representing the fault has an induced magnetic susceptibility of 0.0 SI, the 305
same value as the background susceptibility. The location of the fault correlates well (at least in the 306
upper 20 km) with the velocity contrast marking the northern edge of the synclinal low velocity zone 307

11
between 100 and 140 km along the profile, while the top of the northern body correlates very well with 308
both the high velocity anomaly and the zone of high resistivity north of the surface maximum of the 309
BMA (Weckmann et al., 2007a, Quesnel et al., 2008). 310
311
6.2. Combined onshore-offshore model 312
The geometry and seismic velocity structure derived from a joint interpretation of onshore and 313
offshore Vp tomography (Fig. 7) provides one of the best available geophysical images of a sheared 314
continental margin in cross-section. It also allows a detailed comparison with features from profiles 315
across the classic volcanic rifted margins on the western coast of South Africa. The most direct 316
comparison is with the seismic profile across the Orange Basin (Hirsch et al., 2008), because this 317
profile also extends oceanward from the Namaqua-Natal Mobile Belt. The sheared and volcanic margin 318
profiles are compared at the same scale on Figure 11. Both profiles show similar wedge-shaped 319
geometry and furthermore, the crustal thickness (Moho depth) does not reduce uniformly but stepwise, 320
with inflection points separating segments of rapid and gradual change. Comparing these segments in 321
turn, from the continental crust (A in Fig. 11) outward, we consider the following observations most 322
important: 323
• Both profiles begin at the landward end in the Namaqua-Natal Mobile Belt, in the case of the 324
Karoo-Agulhas profile this is covered by the Karoo sequence. The crustal thickness at this end 325
of both profiles is about 40 km, but there is a major difference in the seismic velocity structures 326
of the lower crust. The Karoo-Agulhas profile shows a zone up to 7 km thick with seismic 327
velocity above 7.0 km/s (maximum Vp = 7.4 km/s), whereas the basal velocity at the Springbok 328
profile does not exceed 6.8 km/s. The significance of the high velocity lower crust is discussed 329
in more detail below. The high-velocity zone on the Karoo-Agulhas profile is interrupted at 330
profile distance 120 km by a “keel” of material with intermediate velocity (green on Figs. 7, 331
11). The higher resolution of the upper crustal seismic image (Fig. 5) shows that this feature has 332
a complex shape that appears consistent with the north-vergent folds and thrust faults known in 333
the upper crust. 334
• Over much of the segment of stretched continental crust (B in Fig. 11) between continental 335
crust (segment A) and the steep decrease in Moho depth (segment C), the crustal thickness at 336
the Karoo-Agulhas profile is significantly greater at the Springbok profile. This is likely due to 337
the presence of the Cape Fold Belt, which is not intersected by the Springbok profile on the 338
west coast. 339

12
• The stretched crust shows a gradual and uniform thinning on the sheared Agulhas margin. The 340
lower crustal seismic velocity in this segment is also uniform, with Vp values of 6.5 to 7.0 km/s 341
that are in the same range as the lower crust observed in other parts of the NNMB (Green and 342
Durrheim, 1990; Durrheim and Moony, 1994; Hirsch et al., 2008). This is in marked contrast to 343
the corresponding segment on the Springbok VRM, which shows a down-warping of the lower 344
crust in the middle part of the segment. This "keel" has a higher seismic velocity (Vp > 7.0 345
km/s) than the lower crust elsewhere along the profile, and even the crust above the keel has a 346
higher velocity than at the same depth outside the keel region. High-velocity lower crust are 347
very common features at volcanic rifted margins and interpreted as underplated basaltic magma 348
that intruded and ponded at the crust-mantle boundary (Menzies et al., 2002). Hirsch et al. 349
(2008) showed that this interpretation is consistent with gravity modelling of the Springbok 350
profile and also noted that the high-velocity keel underlies a zone of seaward-dipping reflector 351
wedges in the upper crust, also characteristic features of volcanic rifted margins and interpreted 352
as submerged basalt flows on the foundering margin (Menzies et al., 2002). Note that if the 353
high-velocity keel on the Springbok profile is considered to be accretion of new crust by 354
magmatism, the geometry of the Springbok margin in this segment is very similar to that of the 355
Agulhas margin, with a uniform, moderate thinning (dashed line, Fig. 11). 356
• Both margins exhibit an abrupt rise of the Moho over about 50 km (segment C). In the case of 357
the Agulhas margin, the lower crust at this rise shows a higher seismic velocity than in the 358
"stretched" segment, with values of about 7 km/s. This represents the continent-ocean transition 359
across the sheared margin. For the Springbok profile this increase in seismic velocity at the 360
steep rise is not observed, because it is part of a much longer (~200 km) continent-ocean 361
transition zone. 362
• The oceanic crust (segment D) on both sections has the global average thickness of about 7 km 363
and a velocity structure that is also typical of oceanic crust worldwide. The post-rift 364
sedimentary cover on the oceanic crust at the Springbok profile is considerably thicker than at 365
the Agulhas profile because it crosses the Orange River Basin. 366
A number of theoretical and empirical models exist that link observed geometry and seismic properties 367
with the processes of rifting and magmatism at volcanic rifted margins (e.g., Menzies et al., 2002). It is 368
clear from their work that seaward-dipping reflector sequences in the upper crustal section land-ward of 369
the ocean-continent transition zone, and thick, high seismic-velocity lower crust (>7.0 km/s) 370
underneath the reflector sequences result from massive intrusion of breakup-related magma. Classic 371

13
examples of these features were documented from the Walvis Basin in Namibia by Bauer et al. (2000), 372
and Trumbull et al. (2002) showed that the thickness (20 km) and high Vp-values (7.2-7.4 km/s) of 373
underplated lower crust in NW Namibia require high mantle temperatures and active mantle upwelling, 374
consistent with the proximity to the Walvis Ridge and Paraná-Etendeka Large Igneous Province. The 375
volcanic rifted margin at the Orange River Basin (Springbok profile) is located some 1500 km south of 376
the Walvis Ridge and the underplated crustal body is considerably thinner and has a lower average Vp 377
velocity (Hirsch et al., 2008). Trumbull et al. (2007) found that dolerite dykes exposed along the coast 378
from NW Namibia to the Cape Province showed a systematic decrease in their maximum MgO 379
contents, both in whole-rock and in olivine, which is consistent with a waning plume influence from 380
north to south expressed in lower mantle potential temperature and less active upwelling. 381
On the sheared Agulhas margin, neither seaward-dipping reflectors nor high-velocity lower crust are 382
revealed by the geophysical surveys, nor is there geologic evidence for syn-rift magmatism onshore. 383
This margin can thus be considered as non-magmatic with respect to the time of breakup. There is, 384
however, seismic evidence of post-breakup magmatism on the profile. Seismic reflection sections in 385
the Agulhas Passage found signs of volcanic seamounts and intra-basement reflectors interpreted as 386
basaltic flows (Parsiegla et al., 2007). A late Cretaceous age of extensive volcanism (ca. 100 Ma) is 387
also suggested from seismic data from the Agulhas Plateau (Uenzelmann-Neben et al., 1999; Parsiegla 388
et al., 2008). 389
One feature of the Karoo-Agulhas profile that deserves further comment is the zone of high seismic 390
velocity (Vp> 7.0 km/s) in the lower crust inland of the coast (from profile km 150 to the coast). 391
Whereas the velocity of this zone is like that enountered in underplated lower crust at volcanic rifted 392
margins, the position of this zone in relation to the continental margin makes it unlikely to represent 393
breakup-related magmatism. Also, as mentioned above, there are no matching expressions of 394
magmatism in the upper crustal seismic data, or on land. Crustal rocks with P-wave velocities greater 395
than 7 km/s are most likely to represent mafic igneous rocks rich in olivine, or their metamorphosed 396
equivalents (amphibolites, mafic granulites). Seismic velocities of metabasic rocks are particularly high 397
if they are rich in garnet (e.g., Durrheim & Mooney, 1994; Christensen & Mooney, 1995). Gerignon et 398
al. (2004) discussed the likelihood of older high-pressure rocks (garnet granulite, eclogite) as an 399
explanation for high Vp lower crust on parts of the rifted Vøring Basin in the Norwegian Sea. 400
Considering the geologic setting of the Karoo-Agulhas profile, there are principally two possible 401
explanations for the high-velocity crust. Either it represents metabasic lithologies of Precambrian age in 402
the NNMB, or mafic intrusions added to the base of the crust by younger magmatism. The dominant 403

14
exposed lithologies of the high-grade unit in the NNMB (Namaqualand terrane) are intermediate to 404
felsic gneisses and meta-granitoids (Dewey et al., 2006). These authors suggested that the heat source 405
for granulite-grade metamorphism and crustal melting was “massive underplating” of mafic magmas at 406
around 1050 Ma. The evidence cited for this underplating was a seismic refraction study by Green & 407
Durrheim (1990), who reported lower crustal velocities of 6.6 – 6.9 km/s for the western Namqualand 408
crust. Similar values of 6.8 km/s were derived for the base of the crust in the NNMB at the landward 409
end of the Springbok profile (Hirsch et al., 2008). Even under the thick Kaapvaal Craton, seismic data 410
indicate a generally sharp transition from the Moho to crustal rocks with intermediate to felsic 411
properties (Durrheim & Mooney, 1994; Nair et al., 2006) and no evidence for widespread high-Vp 412
lower crust. Crustal xenoliths of garnet granulite are not uncommon in kimberlites from the NNMB 413
(Schmitz & Bowring, 2004), and thus some high-Vp material must be present in the crust, however the 414
seismic surveys so far undertaken indicate that such material cannot be a major component of the lower 415
crust. Therefore, although we do not rule out the possibility that the high-Vp zones at the base of the 416
crust in the Karoo-Agulhas profile are part of the Proteorozoic basement, all other studies of the 417
NNMB and cratonic crust failed to detect velocities above 6.9 km/s. 418
The alternative explanation for the high Vp values observed at the landward end of the Karoo-Agulhas 419
profile is that Phanerozoic magmatism added thick intrusions of gabbroic material in the lower crust. 420
This is of course the same scenario offered to explain the very common thick underplated crust at 421
volcanic rifted margins, and it is clear from many studies that appropriate volumes of material and bulk 422
seismic properties would fit the observations (7 km thickness, Vp = 7.0-7.4 km/s – see Fig. 7). From 423
the regional geology and location of the profile, the most likely candidate for producing extensive 424
mafic underplating is the mid-Jurassic Karoo-Ferrar-Chon Aike Large Igneous Province. This was one 425
of the major episodes of mafic magmatism on a global scale, and it is unlikely that the huge volumes of 426
magma represented by Karoo lavas, dykes and sill complexes could be emplaced at upper crustal levels 427
without an intrusive equivalent at depth. Unfortunately, the seismic experiments used in this study did 428
not produce enough S-wave information to allow calculation of Vp/Vs ratios which would provide 429
better lithologic discrimination, but from the available shape, location and Vp values of the lower 430
crustal zone we believe an origin from underplated magmas related to the Karoo LIP provides the best 431
explanation. 432
de Wit (2007) already noted the surprising lack of seismic evidence for mafic underplating of the 433
Karoo magmas, whereas such evidence is clear and abundant for the Paraná-Etendeka LIP on the 434
western margin. We argue from the results of this study that significant Karoo underplating did occur. 435

15
Its paucity in seismic studies under the craton probably relates to the deflecting action of the thick 436
Kaapvaal lithosphere. Why there is no seismic expression for underplating in the other surveys of the 437
NNMB surveys is less clear but it may be related to the fact those surveys were located farther west 438
than the Karoo-Agulhas profile whereas the locus of strongest Karoo magmatism is to the east, in the 439
Lebombo-Natal and Lesotho regions. 440
441
7. Summary 442
443
In this study we have used tomographic inversion of reflected and refracted travel times to construct a 444
P-wave velocity model along an off-onshore profile across the southern margin of Africa. The findings 445
are summarized in Fig. 12. A number of the model’s features agree with known geological record, and 446
are consistent with the results of the separate onshore (Stankiewicz et al., 2007) and offshore (Parsiegla 447
et al., 2007) analyses. These include the rough geometry of the Karoo and Cape Supergroups, the 448
presence of a blind Paleozoic Thrust Fault ~ 40 km north of the farthest Witteberg Group outcrop 449
which possibly marks the northern edge of deformation in the Cape Supergroup, and the geometry of 450
the Agulhas-Falkland Fracture Zone which marks the continent – ocean transition. 451
New findings of this study are: 452
• A high velocity anomaly north of the centre of the BMA is much better resolved than 453
previously. This feature is coincident with an extensive zone of high resistivity and a magnetic 454
body required to reproduce the magnetic signature of the BMA. 455
• A synclinal low velocity feature was identified in the Mesoproterozoic basement beneath the 456
front of the Cape Fold Belt, south of the above mentioned feature. The northern edge of this 457
feature correlates with the second magnetic body necessary to account for the BMA’s signature. 458
• A steep decrease in crustal thickness (from 40 to 30 km over lateral distance of 40 km) occurs 459
under the present coast. 460
• A zone of high velocity material is observed in the lower-most crust beneath the present coast. 461
This either represents metabasic lithologies of the Mesoproterozoic Namaqua-Natal 462
Metamorphic Complex, or intrusions of gabbroic material added to the base of the crust by 463
younger magmatism. 464
465
Acknowledgements 466
J.S. thanks the GeoForschungsZentrum Potsdam for providing a scholarship to conduct research in 467

16
Potsdam as part of the capacity building program of the Inkaba yeAfrica project. Equipment for the 468
onshore experiments was provided by the Geophysical Instrument Pool, Potsdam. We thank the 469
seismic and MT field teams, as well as the farmers who granted us access to their land. Many thanks go 470
to the captain, the crew and the scientific participants of the RV Sonne cruise SO-182. We are grateful 471
to Ernst Flüh of IfM-GEOMAR for lending us OBS systems. The SO-182 cruise (project AISTEK-I) 472
and N.P.’s position was funded by the German Bundesministerium für Bildung und Forschung 473
(BMBF) under contract no. 03G0182A. The German Academic Exchange Service (DAAD) funded a 474
one month research visit of N.P. to the University of Cape Town (South Africa). We thank Maarten de 475
Wit for his continuous involvement in the project, as well as Klaus Bauer and Oliver Ritter for many 476
discussions. The manuscript benefited from constructive reviews by Ray Durrheim and an anonymous 477
reviewer. This is Inkaba ye Africa publication 29. 478
479
References 480
481 Barker, P.F. (1979). The history of ridge-crest offset at the Falkland-Agulhas Fracture Zone from a 482 small-circle geophysical profile. Geophysical Journal of the Royal Astronomical Society, 59, 131-145. 483 484 Barnett, W., Armstrong, R & de Wit, M.J. (1997). Stratigraphy of the upper Neoproterozoic Kango and 485 lower Paleozoic Table Mountain groups of the Cape fold belt revisited. South African Journal of 486 Geology, 100, 237-250. 487 488 Bauer, K., Neben, S., Schreckenberger, B., Emmermann, R., Hinz, K., Fechner, N., Gohl, K., Schulze, 489 A., Trumbull, R.B. & Weber, K. (2000). Deep structure of the Namibia continental margin as derived 490 from integrated geophysical studies. Journal of Geophysical Research, 105, B11, 25,829-25,853. 491 492 Beattie, J.C. (1909). Report of a magnetic survey of South Africa. Royal Society of London 493 Publication, Cambridge University Press, London. 494 495 Ben-Avraham, Z., Hartnady, C.J.H. & Malan, J.A. (1993). Early tectonic extension between the 496 Agulhas Bank and the Falkland Plateau due to the rotation of the Lafonia microplate. Earth Planet. Sci. 497 Lett., 117, 43-58. 498 499 Ben-Avraham, Z., Hartnady, C.J.H. & Kitchin, K.A. (1997). Structure and tectonics of the Agulhas-500 Falkland fracture zone. Tectonophysics, 282, 83-98. 501 502 Bird, D. (2001). Shear margins: Continent-ocean transform and fracture zone boundaries. The Leading 503 Edge, 20(2), 150-159. 504 505 Branch, T., Ritter, O., Weckmann, U., Sachsenhofer, R.F. & Schilling, F. (2007). The Whitehill 506 Formation – a high conductivity marker horizon in the Karoo Basin. South African Journal of Geology, 507 110 (2/3), 465-476 508
17
509 Broad, D.S., Jungslager, E.H.A., McLachlan, I.R. & Roux, J. (2006). Geology of the offshore 510 Mesozoic basins. In: The Geology of South Africa, 553-571, (ed: Johnson, M. R., Anhaeusser, C. R. & 511 Thomas, R. J.) Geological Society of South Africa/Council for Geoscience, Pretoria. 512 513 Broquet, C.A.M. (1992). The sedimentary record of the Cape Supergroup: a review. In: Inversion 514 Tectonics of the Cape Fold Belt, Karoo and Cretaceous Basins of Southern Africa, 159-183 (ed: de 515 Wit, M.J. & Ransome, I.G.D.), Balkema, Rotterdam. 516 517 Catuneanu, O., Hancox, P.J. & Rubidge, B.S. (1998). Reciprocal flexural behaviour and contrasting 518 stratigraphies: a new basin development model for the Karoo retroarc foreland system, South Africa. 519 Basin Research, 10, 417-439. 520 521 Christensen, N.I. & Mooney, W.D. (1995) Seismic velocity structure and composition of the 522 continental crust: A global view. Journal of Geophysical Research, 100, 9761-9788. 523 524 Cloetingh, S., Lankreijer, A., de Wit, M.J. & Martinez, I. (1992). Subsidence history analyses and 525 forward modelling of the Cape and Karoo Supergroups. In: Inversion tectonics of the Cape Fold Belt, 526 Karoo and Cretaceous basins of Southern Africa, 239-248 (ed: de Wit, M.J & Ransome, I.G.D.), 527 Balkema, Rotterdam. 528 529 Cole, D.I. (1992). Evolution and development of the Karoo Basin. In: Inversion Tectonics of the Cape 530 Fold Belt, Karoo and Cretaceous Basins of Southern Africa, 87-99 (ed: de Wit, M.J. & Ransome, 531 I.G.D.), Balkema, Rotterdam. 532 533 de Beer, J.H. & Gough, D.I. (1980). Conductive structures in southernmost Africa: A magnetometer 534 array study. Geophysical Journal of the Royal Astronomical Society, 63, 479-495. 535 536 de Beer, J.H., Van Zyl, J.S.V. & Bahnemann, F.K. (1974). Plate tectonic origin for the Cape Fold Belt? 537 Nature, 252, 675-676. 538 539 Dewey, J.F., Robb, L. & van Schalkwyk, L. (2006). Did Bushmanland extensionally unroof 540 Namaqualand. Precambrian Research, 150, 173-182. 541 542 de Wit, M.J. (1992). The Cape Fold Belt: A Challenge for an integrated approach to inversion 543 tectonics. In: Inversion Tectonics of the Cape Fold Belt, Karoo and Cretaceous Basins of Southern 544 Africa, 3-12 (ed: de Wit, M.J. & Ransome, I.G.D.), Balkema, Rotterdam. 545 546 de Wit, M.J. (2007). The Kalahari Epeirogeny and climate change: differentiating cause and effect 547 from core to space. South African Journal of Geology, 110 (2/3), 367-392. 548 549 de Wit, M.J. & Horsfield, B. (2006). Inkaba yeAfrica Project surveys sector of Earth from core to 550 space. EOS, 87, 11. 551 552 Durrheim, R.J. (1987). Seismic reflection and refraction studies of the deep structure of the Agulhas 553 Bank. Geophysical Journal of the Royal Astronomical Society, 89, 395-398. 554 555 Durrheim, R. J. & W. D. Mooney (1994). Evolution of the Precambrian lithosphere: Seismological and 556

18
geochemical constraints. Journal Geophysical Research, 99(B8), 15,359–15,374. 557 558 Eglington, B.M. (2006). Evolution of the Namaqua-Natal Belt, southern Africa – A geochronological 559 and isotope geochemical review. Journal of African Earth Sciences, 46, 93-111. 560 561 Eglington, B.M. & Armstrong, R.A. (2003). Geochronological and isotopic constraints on the 562 Mesoproterozoic Namaqua-Natal Belt: evidence from deep borehole intersections in South Africa. 563 Precambrian Research, 125, 179-189. 564 565 Fouche, J., Bate, K.J. & van der Merwe, R. (1992). Plate tectonic setting of the Mesozoic Basins, 566 southern offshore, South Africa: A review. In: Inversion Tectonics of the Cape Fold Belt, Karoo and 567 Cretaceous Basins of Southern Africa, 27-32 (ed: de Wit, M.J & Ransome, I.G.D.), Balkema, 568 Rotterdam. 569 570 Gernigon, L., Ringenbach, J-C., Planke, S. & Le Gall, B. (2004). Deep structures and breakup along 571 volcanic rifted margins: insights from integrated studies along the outer Vøring Basin (Norway). 572 Marine and Petroleum Geology, 21, 363–372. 573 574 Gough, D.I. (1973). Possible linear plume under southernmost Africa. Nature Physical Science, 245, 575 93-94. 576 577 Gough, D.I., de Beer, J.H. & Van Zyl, J.S.V. (1973). A magnetometer array study in southern Africa. 578 Geophysical Journal of the Royal Astronomical Society, 34, 421-433. 579 580 Green, R.W.E. & Durrheim, R.J. (1990). A Seismic Refraction Investigation of the Namaqualand 581 Metamorphic Complex, South Africa. Journal of Geophysical Research, 95, B12, 19,927-19,932. 582 583 Hälbich, I.W. (1983). A tectogenesis of the Cape Fold Belt (CFB). In: Geodynamics of the Cape Fold 584 Belt, 165-175 (ed: Söhnge, A.P.G. & Hälbich, I.W.), Special publication of the Geological Society of 585 South Africa. 586 587 Hälbich, I.W. (1993). The Cape Fold Belt – Agulhas Bank Transect across the Gondwana Suture in 588 Southern Africa. American Geophysical Union Special Publication, 202, 18pp. 589 590 Harvey, J.D., de Wit, M.J., Stankiewicz, J. & Doucoure, C.M. (2001). Structural variations of the crust 591 in the Southwestern Cape, deduced from seismic receiver functions. South African Journal of Geology, 592 104, 231-242. 593 594 Hirsch, K.K., Bauer, K., Scheck-Wenderoth, M. (2008) Deep structure of the western South African 595 passive margin-results of a combined approach of seismic, gravity and isostatic investigations. 596 Tectonophysics, doi: 10.1016/j.tecto.2008.04.028. 597 598 Jacobs, J. & Thomas, R.J. (1994). Oblique collision at 1.1 Ga along the southern margin of the 599 Kaapvaal continent, SE Africa. Geol Rundsch, 83, 322-333 600 601 Jacobs, J., Thomas, R.J. & Weber, K., (1993). Accretion and indentation tectonics at the southern edge 602 of the Kaapvaal craton during the Kibaran (Grenville) orogeny. Geology, 21, 203-206. 603 604

19
Lindeque, A. S., Ryberg, T., Stankiewicz, J., Weber, M. & de Wit, M. J. (2007). Deep Crustal Seismic 605 Reflection Experiment Across the Southern Karoo Basin, South Africa. South African Journal of 606 Geology, 110 (2/3), 419-438.. 607 608 Martin, A.K., Hartnady, C.J.H. & Goodland, S.W. (1981). A revised fit of South America and South 609 Central Africa. Earth Planet. Sci. Lett., 75, 293-305. 610 611 McCourt, S., Armstrong, R.A., Grantham, G.H. & Thomas, R.J. (2006). Geology and evolution of the 612 Natal Belt, South Africa. Journal of African Earth Sciences, 46, 71-92 613 614 McMillan, I.K., Brink, G.I., Broad, D.S. & Maier, J.J. (1997). Late Mesozoic Basins Off the South 615 Coast of South Africa. In: African Basins, 319-376, (ed: R.C. Selley). Elsevier Science Amsterdam. 616 617 Menzies, M.A., Klemperer, S.L., Ebinger, C.J., Baker, J. (2002). Characteristics of volcanic rifted 618 margins. In: Volcanic Rifted Margins, 1-14 (ed: Menzies, M.A., Klemperer, S.L., Ebinger, C.J. & 619 Baker, J.) GSA Special Paper 362. 620 621 Nair, S.K., Gao, S.S., Liu, K.H. & Silver, P.G. (2006) Southern Africa crustal evolution and 622 composition: constraints from receiver function studies. Journal of Geophysical Research, 111, 623 B02304, doi: 10.1029/2005JB003802. 624 625 Newton, A.R. (1992). Thrusting on the northern margin of the Cape Fold Belt, near Laingsburg. In: 626 Inversion Tectonics of the Cape Fold Belt, Karoo and Cretaceous Basins of Southern Africa, 193-196 627 (ed: de Wit, M.J & Ransome, I.G.D.), Balkema, Rotterdam. 628 629 Nguuri, T.K., Gore, J., James, D.E., Webb, S.J., Wright, C, Zengeni, T.G. & Gwavava, O. (2001). 630 Crustal structure beneath southern Africa and its implications for the formation and evolution of the 631 Kaapvaal and Zimbabwe cratons. Geophysical Research Letters, 28, 2501-2504. 632 633 Oguti, J. (1964). Geomagnetic anomaly around the continental shelf margin southern offshore of 634 Africa. Journal of Geomagnetism and Geoelectricity, 16, 65-57. 635 636 Parsiegla, N., Gohl, K. & Uenzelmann-Neben, G. (2007). Deep crustal structure of the sheared South 637 African continental margin: first results of the Agulhas-Karoo Geoscience Transect. South African 638 Journal of Geology, 110 (2/3), 393-406. 639 640 Parsiegla, N., Gohl, K. & Uenzelmann-Neben, G. (2008). The Agulhas Plateau: Structure and evolution 641 of a Large Igneous Province. Geophysical Journal International, 174, 336-350, doi:310.1111.j.1365-642 1246X.2008.03808.x. 643 644 Paton, D.A., Macdonald, D.I.M. & Underhill, J.R. (2006). Applicability of thin or thick skinned 645 structural models in a region of multiple inversion episodes; southern South Africa. Journal of 646 Structural Geology, 28, 1933-1947. 647 648 Pitts, B., Maher, M., de Beer, J.H. & Gough, D.I. (1992). Interpretation of magnetic, gravity and 649 magnetotelluric data across the Cape Fold Belt and Karoo Basin. In: Inversion Tectonics of the Cape 650 Fold Belt, Karoo and Cretaceous Basins of Southern Africa, 33-45 (ed: de Wit, M.J & Ransome, 651 I.G.D.), Balkema, Rotterdam. 652
20
653 Quesnel, Y., Weckmann, U., Ritter, O., Stankiewicz, J., Lesur, V., Mandea, M., Langlais, B., Sotin, C., 654 Galdeano, A. (2008). Local Modelling of the Beattie Magnetic Anomaly in South Africa. 655 Tectonophysics, under review. 656 657 Rabinowitz, P.D. & LaBrecque, J. (1979). The Mesozoic South Atlantic Ocean and Evolution of Its 658 Continental Margins. Journal of Geophysical Research, 84, B11, 5973-6002. 659 660 Raith, J.G., Cornell, D.H., Frimmel, H.E. & de Beer, C.H. (2003). New insights into the geology of the 661 Namaqua tectonic province, South Africa, from ion probe dating of detrital and metamorphic zircons. 662 Journal of Geology, 111, 347-366. 663 664 Robb, L.J., Armstrong, R.A. & Waters, D.J. (1999). The history of granulite-facies metamorphism and 665 crustal growth from single zircon U-Pb geochronology: Namaqualand, South Africa. Journal of 666 Petrology, 40, 1747–1770. 667 668 Ryberg, T., Weber, M., Garfunkel, Z. & Bartov, Y. (2007). The shallow velocity structure across the 669 Dead Sea Transform fault, Arava Valley, from seismic data. Journal of Geophysical Research, 112, 670 B08307, doi:10.1029/2006JB004563. 671 672 Schmitz, M.D. & Bowring, S.A. (2004) Lower crustal granulite formation during Mesoproterozoic 673 Namaqua-Natal collisional orogenesis, southern Africa. South African Journal of Geology, 107, 261-674 284. 675 676 Scrutton, R.A. (1979). On sheared passive continental margins. Tectonophysics, 59, 293-305. 677 678 Scrutton, R.A. & du Plessis, A. (1973). Possible Marginal Fracture Ridge south of South Africa, 679 Nature, 242, 180-182. 680 681 Stankiewicz, J., Ryberg, T., Schulze, A., Lindeque, A. S., Weber, M. & de Wit, M.J. (2007). Initial 682 Results from Wide-Angle Seismic Refraction Lines in the Southern Cape. South African Journal of 683 Geology, 110 (2/3), 407-418. 684 685 Talwani, M. & Eldholm, O. (1973). The boundary between continental and oceanic basement at the 686 margin of rifted continents. Nature, 241, 325-330. 687 688 Tankard, A.J., Jackson, M.P.A., Eriksson, K.A., Hobday, D.K., Hunter, D.R. & Minter, W.E.L. (1982). 689 Crustal Evolution of Southern Africa. Springer-Verlag, New York. 690 691 Thomson, K. (1999). Role of the continental break-up, mantle plume development and fault activation 692 in the evolution of the Gamtoos Basin, South Africa. Marine and Petroleum Geology, 16, 409-429. 693 694 Trumbull, R.B., Sobolev, S.V. and Bauer, K. (2002) Petrophysical modelling of high seismic velocity 695 crust at the Namibian volcanic margin. In: Menzies, M.A., Klemperer, S.L., Ebinger, C.J. and Baker, J. 696 (Eds.) Volcanic Rifted Margins GSA Special Paper 362, p. 221-230. 697 698 Trumbull, R.B., Reid, D.L., De Beer, C.H. & Romer, R.L. (2007). Magmatism and continental breakup 699 at the west margin of southern Africa: A geochemical comparison of dolerite dikes from NW Namibia 700
21
and the Western Cape. South African Journal of Geology, 110 (2/3), 477-502. 701 702 Uenzelmann-Neben, G., Gohl, K., Ehrhardt, A. & Seargent, M. (1999). Agulhas Plateau, SW Indian 703 Ocean: New Evidence for Excessive Volcanism. Geophysical Research Letters, 26(13), 1941-1944. 704 705 Vidale, J.E. (1988). Finite-difference calculation of travel times. Bulletin of the Seismological Society 706 of America, 78(6), 2062-2076. 707 708 Weckmann, U., Ritter, O., Jung, A., Branch, T. & de Wit, M.J. (2007a). Magnetotelluric measurements 709 across the Beattie magnetic anomaly and the Southern Cape Conductive Belt, South Africa. Journal of 710 Geophysical Research, 112, B05416, doi:10.1029/2005JB003975. 711 712 Weckmann, U., Jung, A., Branch, T. & Ritter, O. (2007b). Comparison of electrical conductivity 713 structures and 2D magnetic modelling along two profiles crossing the Beattie Magnetic Anomaly, 714 South Africa. South African Journal of Geology, 110 (2/3), 449-464. 715 716 White, R.S., McKenzie, D. & O’Nions, R.K. (1992). Oceanic Crustal Thickness From Seismic 717 Measurements and Rare Earth Element Inversions. Journal of Geophysical Research, 97, B13, 19,683-718 19,715. 719 720 Zelt, C.A. & Barton, P.J. (1998). Three-dimensional seismic refraction tomography: A comparison of 721 two methods applied to data from the Faeroe Basin. Journal of Geophysical Research, 103, B4, 7187-722 7210. 723 724 Zelt, C.A. & Forsyth, D.A. (1994). Modelling wide-angle seismic data for crustal structure: 725 Southeastern Grenville Province. Journal of Geophysical Research, 99, B6, 11687-11704. 726 727 Zelt, C.A. & Smith, R.B. (1992). Seismic traveltime inversion for 2-D crustal velocity structure. 728 Geophysical Journal International, 108, 16-34. 729
730

22
730 Table 1: Number of picked arrival times 731
732
phase Air Gun – OBS Air Gun – EDL Land Shot – EDL Σ
Crustal Refraction 2329 5030 445 7804
Mantle Refraction 225 13861 0 14086
Moho Reflection 642 1028 132 1802
Intracrustal Reflection 332 0 21 353
Σ 3528 19919 598 24045
733
734
735
Table 2: Model quality for different phases 736
737
phase rms Χ2
Crustal Refraction 0.132 1.70
Mantle Refraction 0.132 1.70
Moho Reflection 0.161 2.40
Intracrustal Reflection 0.173 0.88
Σ 0.134 1.74
738
739
23
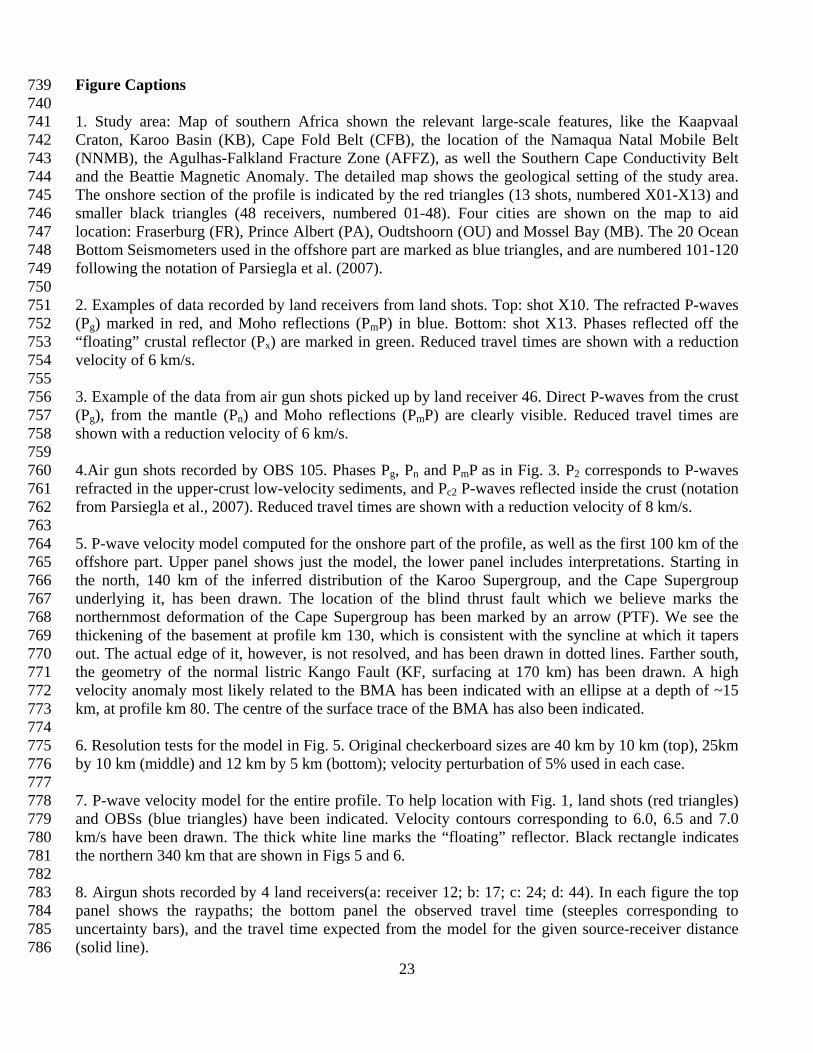
Figure Captions 739 740 1. Study area: Map of southern Africa shown the relevant large-scale features, like the Kaapvaal 741 Craton, Karoo Basin (KB), Cape Fold Belt (CFB), the location of the Namaqua Natal Mobile Belt 742 (NNMB), the Agulhas-Falkland Fracture Zone (AFFZ), as well the Southern Cape Conductivity Belt 743 and the Beattie Magnetic Anomaly. The detailed map shows the geological setting of the study area. 744 The onshore section of the profile is indicated by the red triangles (13 shots, numbered X01-X13) and 745 smaller black triangles (48 receivers, numbered 01-48). Four cities are shown on the map to aid 746 location: Fraserburg (FR), Prince Albert (PA), Oudtshoorn (OU) and Mossel Bay (MB). The 20 Ocean 747 Bottom Seismometers used in the offshore part are marked as blue triangles, and are numbered 101-120 748 following the notation of Parsiegla et al. (2007). 749 750 2. Examples of data recorded by land receivers from land shots. Top: shot X10. The refracted P-waves 751 (Pg) marked in red, and Moho reflections (PmP) in blue. Bottom: shot X13. Phases reflected off the 752 “floating” crustal reflector (Px) are marked in green. Reduced travel times are shown with a reduction 753 velocity of 6 km/s. 754 755 3. Example of the data from air gun shots picked up by land receiver 46. Direct P-waves from the crust 756 (Pg), from the mantle (Pn) and Moho reflections (PmP) are clearly visible. Reduced travel times are 757 shown with a reduction velocity of 6 km/s. 758 759 4.Air gun shots recorded by OBS 105. Phases Pg, Pn and PmP as in Fig. 3. P2 corresponds to P-waves 760 refracted in the upper-crust low-velocity sediments, and Pc2 P-waves reflected inside the crust (notation 761 from Parsiegla et al., 2007). Reduced travel times are shown with a reduction velocity of 8 km/s. 762 763 5. P-wave velocity model computed for the onshore part of the profile, as well as the first 100 km of the 764 offshore part. Upper panel shows just the model, the lower panel includes interpretations. Starting in 765 the north, 140 km of the inferred distribution of the Karoo Supergroup, and the Cape Supergroup 766 underlying it, has been drawn. The location of the blind thrust fault which we believe marks the 767 northernmost deformation of the Cape Supergroup has been marked by an arrow (PTF). We see the 768 thickening of the basement at profile km 130, which is consistent with the syncline at which it tapers 769 out. The actual edge of it, however, is not resolved, and has been drawn in dotted lines. Farther south, 770 the geometry of the normal listric Kango Fault (KF, surfacing at 170 km) has been drawn. A high 771 velocity anomaly most likely related to the BMA has been indicated with an ellipse at a depth of ~15 772 km, at profile km 80. The centre of the surface trace of the BMA has also been indicated. 773 774 6. Resolution tests for the model in Fig. 5. Original checkerboard sizes are 40 km by 10 km (top), 25km 775 by 10 km (middle) and 12 km by 5 km (bottom); velocity perturbation of 5% used in each case. 776 777 7. P-wave velocity model for the entire profile. To help location with Fig. 1, land shots (red triangles) 778 and OBSs (blue triangles) have been indicated. Velocity contours corresponding to 6.0, 6.5 and 7.0 779 km/s have been drawn. The thick white line marks the “floating” reflector. Black rectangle indicates 780 the northern 340 km that are shown in Figs 5 and 6. 781 782 8. Airgun shots recorded by 4 land receivers(a: receiver 12; b: 17; c: 24; d: 44). In each figure the top 783 panel shows the raypaths; the bottom panel the observed travel time (steeples corresponding to 784 uncertainty bars), and the travel time expected from the model for the given source-receiver distance 785 (solid line). 786

24
787 9. Ray coverage for the model presented in Fig. 7. A logarithmic scale of number of rays crossing each 788 2 km by 1 km cell highlights regions of relatively high or low coverage. 789 790 10. Top panel: Surface magnetic field (red line) along the profile, compared to the modeled magnetic 791 signature of two magnetic bodies intersected by a few 100 m wide non-magnetic region (Weckmann et 792 al., 2007b). Middle panel: the two magnetic bodies drawn over the MT depth section of Weckmann et 793 al. (2007a). Lower panel: the magnetic bodies drawn over the northern 180 km of the P-wave velocity 794 model shown in Fig. 5. Vertical dashed lines across all three panels project the locations of the maxima 795 of the BMA onto the depth sections. 796 797 11. P-wave velocity model comparison between the Springbok profile on the western coast of South 798 Africa (top panel, after Hirsch et al., 2008), and this study (bottom panel). Based on Moho geometry, 799 four segments of the crust can be distinguished in both profiles: thick continental (A), stretched 800 gradually thinning (B), steeply thinning (C), and thin oceanic crust (D). 801 802 12. The combined onshore/offshore profile, showing the summary of the findings of this study. To the 803 north the Karoo and Cape Supergroups taper out in an asymmetric syncline. The division between 804 Upper and Middle/Lower Crust roughly follows the P-wave velocity of 6.5 km/s contour. Near its most 805 shallow point, the high velocity anomaly most likely is related to the BMA is found in the Middle 806 Crust. Immediately south a large synclinal feature was identified in the Upper Crust. In the Lower 807 Crust high velocity material has been observed on top of the steeply rising Moho, as was a reflector 808 roughly parallel to the Moho. Offshore the layer of sediments can be seen, as is the structure of the 809 AFFZ, which separates continental from oceanic crust. 810


![Crustal structure of the Java margin from seismic ...eprints.uni-kiel.de/3071/1/jgrb12868.pdf[1] Seismic investigations across the convergent Sunda margin off Indonesia provide a detailed](https://static.fdocuments.in/doc/165x107/5d52bf3788c993383f8b6c3a/crustal-structure-of-the-java-margin-from-seismic-1-seismic-investigations.jpg)


