
Crucian Carp – Cloning and Characterization of the NMDA ...
63
Cloning, in silico characterization and phylogenetic analysis of the NMDA receptor in crucian carp Cand. Scient. Thesis by Dag Are Steenhoff Hov Supervisors: Göran E. Nilsson Stian Ellefsen Programme for Physiology Department of Molecular Biosciences Faculty of mathematics and natural sciences UNIVERSITY OF OSLO
Transcript of Crucian Carp – Cloning and Characterization of the NMDA ...
Cloning, in silico characterization and phylogenetic analysis of the
NMDA receptor in crucian carp
Cand. Scient. Thesis by Dag Are Steenhoff Hov
Supervisors: Göran E. Nilsson
Stian Ellefsen
Programme for Physiology Department of Molecular Biosciences
Faculty of mathematics and natural sciences UNIVERSITY OF OSLO

Acknowledgements Lykken er et hovedfag! Aller først vil jeg si tusen takk til min hovedveileder, Göran, for at du aldri helt ga opp håpet. Jeg er takknemlig for at du fikk tid til å lese gjennom oppgaven. Du er en kunnskapsrik, lun og god person og med ditt om noe svenske, men inkluderende vesen har jeg alltid følt at det var greit med én øl til. Takk for du har gjort alle i utgangspunktet faglige Klubban- og vintermøter og Drøbak-kurs til festlige affærer med spontane innfall av nakenbading og badstu. Det er alltid like trivelig å kore deg gjennom ’Wild Rover’! Soppturer med påfølgende gourmet-tango på kjøkkenet ditt forblir uforglemmelige. Min medveileder, gode kamerat og molekylærbiologiske støtte(s)pi(l)lar, Stian, som gjerne er tre ønsker på en gang: En overraskende morsom og leken kar som liker sjokoladeis. Skrive kan han også. Takk for det du har lært meg og tida du har brukt på meg. Dette er bare begynnelsen. Det sies at man ikke kan velge sine foreldre. Slik kjennes det litt med gruppa vår også. Det måtte bli fysiologi og den litt egenrådige og nokså fanoksiske karpefisken karuss. Hyggelige mennesker, kake- og pubmøter tror jeg har bidratt vel så mye til min trivsel. Takk til alle sammen. Også takk til lunsjgjenger med Guro som samlingspunkt. Hold ut, Guro! Takk, Helene, for at du tok deg tid til å lese korrektur helt på tampen. Stine bør også få navnet sitt på trykk for at hun tar meg med på skumle ting én gang i året. Kristine synger, baker og kan også noen lure triks i Word, takk for hjelp! Takk til Miriam og Kjetil og resten av studentene her inne som også gjør bukhulen vår så trivelig! Ellers takk til alle på avdelinga som har vært med på å gjøre tiden min her som hovedfagsstudent så bra. På program for generell fysiologi har vi høy tetthet av kunnskap, julebord, hytteturer og vårfester og jeg kan bare være fornøyd for å ha valgt meg hit. Takk til familien min som har støttet meg og ventet i spenning, fra rundt 1250 km lenger nord og omtrent 50 km lenger sør. Og takk til pappa som har gjort en kjempejobb med å være pappa helt oppe fra Lofoten. Min kjære, søte, tolmodige Kristin. Nå er det over! Etter at du fant meg og jeg fant deg og vi fant oss en leilighet sammen, har det nok blitt lettere å leve litt mer vanlig. Akkurat nok mer vanlig til å bli ferdig med et hovedfag. Men ikke mer vanlig enn at vi kan dra på tur til fine steder og dykke litt og se på fine fisker eller gå opp på et fjell og se på fin utsikt, når det passer seg sånn. Takk for at du holder ut med meg! Nå kommer jeg hjem til deg og tomatene våre på Teisen! Nå blir det du og jeg! Oslo, den 29. juni 2007
2

Abstract The crucian carp survives anoxia with the brain turned on. In such a state it is crucial to
lower energy expenditures. This can be achieved by lowering the permeability of
ionotropic receptors such as the N-metyl-D-aspartate receptor (NMDAR). We
hypothesized that the crucian carp NMDAR possess properties important for anoxic
tolerance. This thesis reports the full-length cloning of the NR1 subunit, as well as ESTs
for NR2A-D and NR3A in crucian carp. Phylogenetic analyses supported the identity of
all subunits, and suggested the finding of two closely related paralogs for NR1, NR2A
and NR2D. These paralogs provide evidence for a recent genomic duplication event in
the crucian carp lineage. Protein analyses of NR1 revealed no obvious adaptations
important for anoxic survival. All key properties were conserved. However, a novel
splice cassette, ‘NTSG’, was found in the N-terminal. This was predicted to represent a
functional N-glycosylation site. Real-time RT PCR primers were designed for
assessments of gene expression.
3

Abbreviations aa Amino acid al Apteronotus leptorhynchus (knifefish) AMPA alpha-amino-3-hydroxy-5-methyl-4-isoazolepropionic acid ap Anas platyrhynchos (duck) ATP Adenosine Triphosphate BLAST Basic Local Alignment Search Tool bp Base pairs C1 C-terminal alternative splice cassette in NMDAR subunit NR1, 37 aa C1’ C-terminal alternative splice cassette in NMDAR subunit NR1, 19 aa C1’’ C-terminal alternative splice cassette in NMDAR subunit NR1, 9 aa C2 C-terminal alternative splice cassette in NMDAR subunit NR1, 38 aa C2’ C-terminal alternative splice cassette in NMDAR subunit NR1, 22 aa cc Carassius carassius (crucian carp) cDNA Complementary DNA CDS Coding Domain Sequence CNS Central Nervous System dr Danio rerio (zebrafish) ER Endoplasmatic Reticulum EST Expressed Sequence Tag gg Gallus gallus (chicken) GSP Gene Specific Primer hpf Hours postfertilization hs Homo sapiens (human) mm Mus musculus (mouse) N1 N-terminal alternative splice cassette in NMDAR subunit NR1, 21 aa NMDA N-metyl-D-aspartate OD Optical Density RACE Rapid Amplification of cDNA Ends rn Rattus norvegicus (rat) rRNA Ribosomal RNA RT PCR Reverse Transcriptase Polymerase Chain Reaction TM Trans Membrane tn Tetraodon nigroviridis (spotted green pufferfish) tr Takifugu rubripes (japanese pufferfish) ts Trachemys scripta (red-eared slider turtle) WGD Whole Genome Duplications xl Xenopus laevis (African clawed frog)
4

Table of Contents
ACKNOWLEDGEMENTS ....................................................................................2
ABSTRACT ..........................................................................................................3
ABBREVIATIONS ................................................................................................4
1 INTRODUCTION ...............................................................................................7
1.1 The Problem of Anoxia ...........................................................................................................................7
1.2 The Anoxia Tolerant Crucian Carp Solves the Problem .....................................................................8
1.3 The NMDA Receptor.............................................................................................................................10
1.4 Anoxia Tolerance in Fish – Evolutionary Perspective........................................................................14
1.5 Aim..........................................................................................................................................................18
2 MATERIALS AND METHODS ........................................................................19
2.1 Animals...................................................................................................................................................19
2.2 Isolation of mRNA.................................................................................................................................19
2.3 Primer Design to Obtain Gene Specific Clones...................................................................................19
2.4 Full-length Cloning by RACE ..............................................................................................................21 2.4.1 cDNA Library..................................................................................................................................21 2.4.2 GeneRacer™ Primer Design............................................................................................................21 2.4.3 PCR Reaction Conditions for the GeneRacer™ Procedure .............................................................22
2.5 Cloning ...................................................................................................................................................23
2.6 Sequencing .............................................................................................................................................24
2.7 Aligning Sequences................................................................................................................................25
2.8 Protein Sequence and Structure Features ...........................................................................................25
2.9 Phylogenetic Analysis ............................................................................................................................25
2.10 Primer Design for Real-Time RT PCR..............................................................................................26
3 RESULTS ........................................................................................................27
3.1 NMDAR Subunit Sequences.................................................................................................................27
3.2 Crucian Carp NR1 Structure and Special Features ...........................................................................28
5

3.3 Phylogenetics Analysis ..........................................................................................................................32
4 DISCUSSION...................................................................................................36
4.1 PCR Optimization .................................................................................................................................36
4.2 NMDAR Subunit Sequences.................................................................................................................37 4.2.1 Primer Design ..................................................................................................................................37 4.2.2 Crucian Carp Paralogs .....................................................................................................................38
4.3 Crucian Carp NR1 Subunit Structure and Function .........................................................................39 4.3.1 The N-terminal and C-terminal Splice Cassettes .............................................................................39 4.3.2 The NTSG Cassette .........................................................................................................................40
4.4 Gene Expression in Crucian Carp NMDAR Genes............................................................................42
4.5 Phylogenetic Considerations.................................................................................................................44
5 CONCLUSION.................................................................................................46
APPENDICES.....................................................................................................47
APPENDIX I........................................................................................................48
GenBank Accession Numbers for NMDAR Genes ...................................................................................48
APPENDIX II.......................................................................................................49
Reagents, equipment and software ............................................................................................................49 Reagents....................................................................................................................................................49 Equipment.................................................................................................................................................50 Software....................................................................................................................................................51
APPENDIX III......................................................................................................52
Crucian carp sequences ..............................................................................................................................52
REFERENCES ...................................................................................................59
6

Introduction
1 Introduction Vertebrates depend on oxygen to survive, and most species will experience cell death
after minutes of anoxia. Brain tissue is particularly sensitive and vast resources are put
into finding ways to minimize damage caused by oxygen loss. Notably, this challenge has
already been solved by nature. Several vertebrate species have evolved ways to survive
hours and months without oxygen. Examples are the epaulette shark (Hemiscyllium
ocellatum), the frogs (Rana sp), several species of freshwater turtles (genus’ Chrysemys
and Trachemys) and cyprinid fish of the genera Carassius (goldfish, Carassius auratus;
crucian carp, Carassius carassius). Some of these species, like red-eared slider turtle
(Trachemys scripta) and crucian carp, survive anoxia for months at temperatures close to
0 °C. While the turtle enters a comatose state, the crucian carp stays conscious and
somewhat mobile (Lutz et al., 2003).
1.1 The Problem of Anoxia
In animals, a lack of oxygen will halt mitochondrial electron transport, whereupon
glycolysis will be the only route for ATP production. This reduces ATP yield obtained
per mole glucose from 36 moles to 2 moles, resulting in ATP demands exceeding ATP
production, and eventually ATP-depletion. In turn, this impedes all energy demanding
processes, such as ion-pumping through the Na+- K+-ATPase. In normoxia, this
particular ATPase maintains the membrane potential by sending Na+-ions out of the cell
and K+-ions into the cell. When this function is halted during anoxia, K+ accumulates in
the extracellular fluid, eventually leading to depolarization of cells such as neurons. This
involves movement of Ca2+ and Na+ down their electrochemical gradient into the
neurons. In the brain, this process will result in release of neurotransmitters, such as
glutamate, further increasing the rate of depolarization. The increasing cytoplasmic
calcium concentration will set off a number of cellular processes that kills the cell. For
review on ischemic cell death in neurons, see Lipton (1999).
Glutamate is the main excitatory neurotransmitter in vertebrate central nervous systems
(CNS). It is known to activate ionotropic receptors such as the N-methyl-D-aspartate
7

Introduction
(NMDA) receptor. Excessive amounts of extracellular glutamate have been shown to
result in neurotoxic events. This has been proposed to be mainly effected by prolonged
opening of NMDARs and the resulting inlet of Ca2+ (Szatkowski and Attwell, 1994).
Further details on the NMDAR will be given later.
1.2 The Anoxia Tolerant Crucian Carp Solves the Problem
The crucian carp is a fresh water fish that lives in lakes as well as small and shallow
ponds in North Europe. During winter these ponds are covered by thick layers of ice and
snow, blocking out oxygen and sunlight. Thus, no new oxygen will diffuse into the water
and no photosynthetic activity will occur. The result is often a depletion of the dissolved
oxygen and an anoxic environment. There are two strategies that can promote survival in
such an environment. The first is to up-regulate glycolysis and increase the consumption
of glucose. This has been shown to occur in crucian carp, which up-regulates key
glycolytic enzymes like fructose 2.6-bisphosphate (Storey, 1987). The second strategy is
to lower the energy expenditure, and meet the reduced rate of ATP production. The
crucian carp has been shown to do so in several ways, such as by reducing swimming
activity by 25-50 % (Nilsson et al., 1993), and by becoming completely blind (Johansson
et al., 1997). However, when vertebrates manage to balance anoxic energy consumption
with anoxic energy production, they are faced with yet another problem: acidification.
The end-product of glycolysis is lactate, and plasma levels of this acid, along with H+,
will rapidly increase to lethal levels unless it is eliminated. Crucian carp has evolved a
peculiar solution to this problem. It transforms lactate, via pyruvate and acetaldehyde,
into ethanol that can diffuse across the gill surface into the ambient water (Johnston and
Bernard, 1983). This mechanism is also found in the bitterling (Rhodeus amareus)
(Wissing and Zebe, 1988) and in the closely related goldfish (Shoubridge and
Hochachka, 1980). For an overview, see Figure 1. Freshwater turtles have evolved a very
different strategy. They do not get rid of their lactate, but they buffer its detrimental
effects with their Ca2CO3-containing shells (Jackson, 2000). Hence, their blood is
essentially limed.
8
Introduction
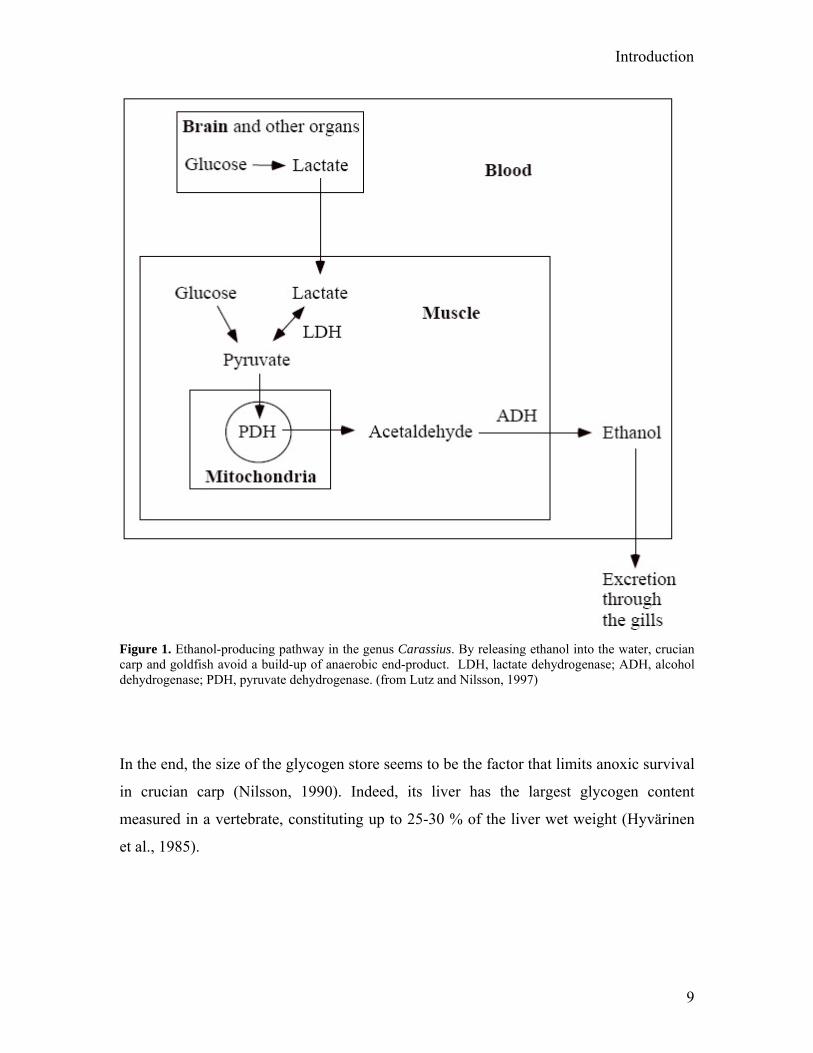
Figure 1. Ethanol-producing pathway in the genus Carassius. By releasing ethanol into the water, crucian carp and goldfish avoid a build-up of anaerobic end-product. LDH, lactate dehydrogenase; ADH, alcohol dehydrogenase; PDH, pyruvate dehydrogenase. (from Lutz and Nilsson, 1997)
In the end, the size of the glycogen store seems to be the factor that limits anoxic survival
in crucian carp (Nilsson, 1990). Indeed, its liver has the largest glycogen content
measured in a vertebrate, constituting up to 25-30 % of the liver wet weight (Hyvärinen
et al., 1985).
9

Introduction
1.3 The NMDA Receptor
Since the discovery of glutamate’s ability to excite spinal neurons in domesticated cat
(Curtis et al., 1959), there has been extensive efforts to characterize the nature of
glutamate receptors (for review, see Chen and Wyllie, 2006; Cull-Candy et al., 2001;
Cull-Candy and Leszkiewicz, 2004; Dingledine et al., 1999; Hollmann and Heinemann,
1994). The glutamate receptors divide into two main categories, the metabotropic and the
ionotropic. Metabotropic glutamate receptors mediate their signal via G-proteins and
other intracellular signaling pathways. They have several functions and are important
modulators of ionotropic glutamate receptors (for review see Conn and Pin (1997)). The
ionotropic glutamate receptors open an ion channel that gates Ca2+ and/or Na+ into the
neuron and excites the cell. Intracellular Ca2+ will bind various components of the cell to
modify synapse behaviour and plasticity. Ionotropic glutamate receptors are divided into
three groups based on specific agonists that bind and open the channels: NMDA
receptors, alpha-amino-3-hydroxy-5-methyl-4-isoazolepropionic acid (AMPA) receptors
and 2-carboxy-3-carboxymethyl-4-isopropenylpyrrolidine (kainate) receptors.
The NMDAR has been ascribed an important role in long term potentiation (LTP)
(Nicoll, 2003) and neurotoxicity (Szatkowski and Attwell, 1994) and has been
particularly well studied. It has a quite complex action, and its opening requires
coincident binding of glutamate and glycine, as well as depolarization of the membrane.
The latter is important to remove a Mg2+ residue that blocks the ion pore at resting
potential. In addition, the receptor is modulated by Zn2+, polyamines, H+ and other extra-
and intracellular factors as described in several reviews (Cull-Candy et al., 2001;
Dingledine et al., 1999; Hollmann and Heinemann, 1994).
The NMDAR gene family consists of three sub-families; NR1, NR2 and NR3.
Functional NMDARs are made up of two NR1 subunits and two NR2 subunits (Cull-
Candy et al., 2001), which are thus believed to have a tetrameric structure (Premkumar
and Auerbach, 1997). The NR3 have been reported to co-occur with functional
NR1/NR2 receptors, probably instead of one of the NR2 subunits (Al-Hallaq et al., 2002).
The first member of the NMDAR gene family, NR1, was cloned in 1991-1992 in mouse
10

Introduction
and rat and was found to consist of one subunit (Moriyoshi et al., 1991; Yamazaki et al.,
1992). NR1 diversity is still possible through alternative splicing of exons 5
(extracellular N-terminal), 21 and 22 (intracellular C-terminal), giving a total of 8
functional splice variants (McBain and Mayer, 1994). These splice variants give
NMDARs with different structural, physiological and pharmacological properties (Zukin
and Bennett, 1995). The NR2 sub-family was cloned in 1992-1993 in mouse and rat and
consist of four subunits; NR2A (Meguro et al., 1992; Monyer et al., 1992), NR2B
(Kutsuwada et al., 1992; Monyer et al., 1992), NR2C (Kutsuwada et al., 1992; Monyer et
al., 1992) and NR2D (Ikeda et al., 1992; Ishii et al., 1993). The NR2 subunits share only
15-20 % homology with NR1, but are highly homologous (50-70 %) to each other (Ishii
et al., 1993). All NR2 subunits except NR2A have splice variants. The NR3 sub-family
was cloned in the years 1995-2002 in mouse, rat and human and consists of two subunits;
NR3A, (Andersson et al., 2001; Ciabarra et al., 1995; Sucher et al., 1995) and NR3B
(Andersson et al., 2001; Chatterton et al., 2002; Nishi et al., 2001). The NR3 subunits
share approximately 50 % amino acid identity and around 27 % with NR1 and NR2
subunits (Ciabarra et al., 1995).
The two NR2 subunits present in functional NMDARs can exist either as homodimers or
heterodimers. While NR1 subunits possess the glycine binding site, NR2 subunits
possess the glutamate binding site. The properties of NMDARs are largely dependent
upon the NR2 composition. Receptors comprising NR1/NR2A and NR1/NR2B have high
Ca2+ conductance with a high sensitivity to block by Mg2+, whereas receptors comprising
NR1/NR2C and NR1/NR2D have low Ca2+ conductance with a lower sensitivity to
extracellular Mg2+. The time from channel opening to channel closing (deactivation
time) is depending on what NR2 subunit present in the receptor and spans from
milliseconds with NR2A included, to minutes caused by the NR2D subunit. The
inclusion of the NR2B or NR2C subunits results in about the same deactivation time
which is a bit longer than that of NR2A (Dingledine et al., 1999). The different NR2
subunits show different levels of expression in rat brain, with the following expression
profile in adult rat brain tissue; NR2B > NR2A > NR2D = NR2C (Goebel and Poosch,
1999) (See also Figure 11). The relative occurrence of NR2 subunits is not rigid and
11

Introduction
changes during an organism’s development. The NR2D is expressed prenatally mainly in
the midbrain and reaches a peak at postnatal day 7 and from there decreases until adult
levels. These types of changes has been observed to alter the properties of NMDARs,
such as conductance, deactivation kinetics and the strength of Mg2+ block (Monyer et al.,
1994).
NR3A and NR3B possess putative glycine binding sites that are similar to that of NR1
(Chatterton et al., 2002). Still, their functional role in NMDAR biology is unclear.
However, some cues have been found to suggest a role. Firstly, they form excitatory
glycine receptors when co-expressed with NR1 in Xenopus oocytes. These receptors can
not be biologically abundant, and they do not react to glutamate or NMDA. They are
permeable to cations, except Ca2+, and do not possess a Mg2+ block (Chatterton et al.,
2002). Secondly, NR3 has been reported to influence the number of NMDARs found on
the neuron surface and also decrease Ca2+ permeability of NR1/NR2 receptors (Perez-
Otano et al., 2001). Additionally, co-immunoprecipitation studies suggest that NR1, NR2
and NR3 subunits exist as receptor complexes (Al-Hallaq et al., 2002). Thus, NR3
subunits may play a role in the modulation of functional NMDARs.
The NMDAR subunits have more or less the same structure as the other ionotropic
glutamate receptors (review by McFeeters and Oswald, 2004). They have an
extracellular N-terminal domain, followed by an S1 segment that takes part in the ligand
binding domain. They also have a transmembrane (TM) segment, TM1, preceding the
pore-forming P-element. The P-element enters the membrane from the cytosolic side,
makes a turn within the membrane and returns to cytosol. After a subsequent TM
segment TM3, an extracellular domain makes up the remainder of the ligand binding
domain, the S2 segment. This part of the protein enters the membrane from the outside
and becomes TM4, before it ends in a large intracellular C-terminal domain. The overall
structure of the NR1 subunit is more or less the same between knifefish (Apteronotus
leptorhynchus) and rat, and only the C-terminal domain shows significant differences,
especially when it comes to alternative splicing. The nomenclature used for the
alternative splice cassettes and TM regions in this thesis are summarized in Figure 2.
12
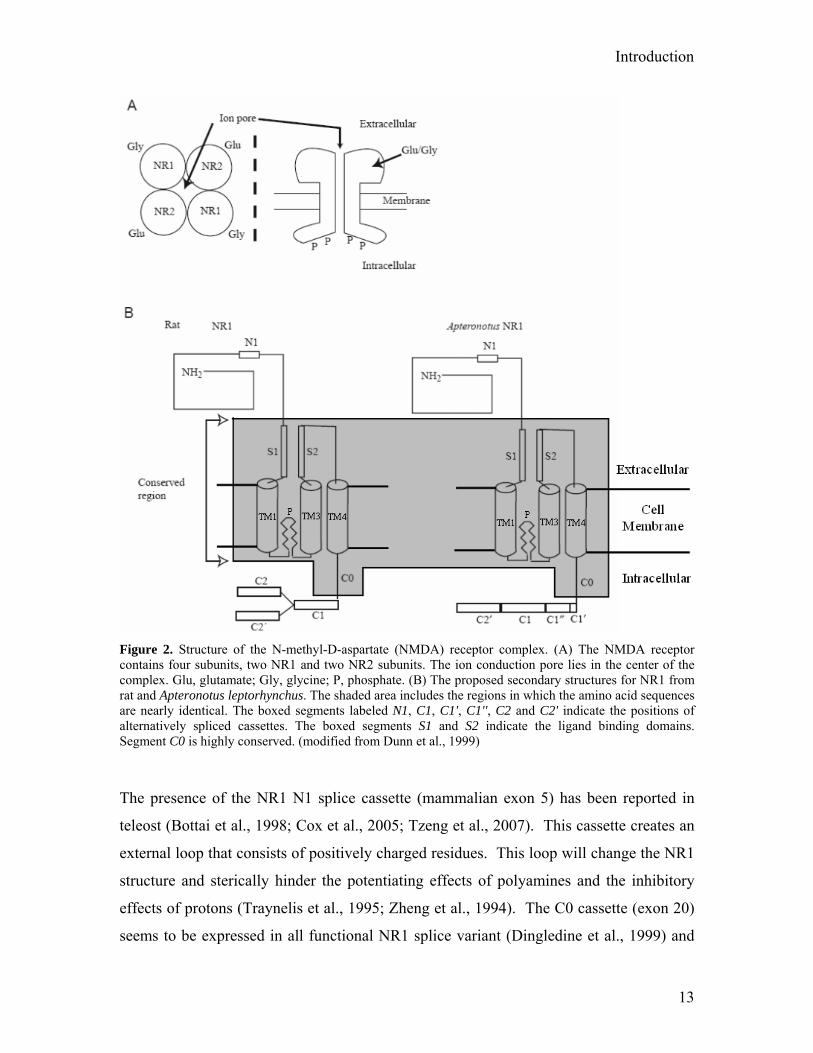
Introduction
Figure 2. Structure of the N-methyl-D-aspartate (NMDA) receptor complex. (A) The NMDA receptor contains four subunits, two NR1 and two NR2 subunits. The ion conduction pore lies in the center of the complex. Glu, glutamate; Gly, glycine; P, phosphate. (B) The proposed secondary structures for NR1 from rat and Apteronotus leptorhynchus. The shaded area includes the regions in which the amino acid sequences are nearly identical. The boxed segments labeled N1, C1, C1', C1'', C2 and C2' indicate the positions of alternatively spliced cassettes. The boxed segments S1 and S2 indicate the ligand binding domains. Segment C0 is highly conserved. (modified from Dunn et al., 1999)
The presence of the NR1 N1 splice cassette (mammalian exon 5) has been reported in
teleost (Bottai et al., 1998; Cox et al., 2005; Tzeng et al., 2007). This cassette creates an
external loop that consists of positively charged residues. This loop will change the NR1
structure and sterically hinder the potentiating effects of polyamines and the inhibitory
effects of protons (Traynelis et al., 1995; Zheng et al., 1994). The C0 cassette (exon 20)
seems to be expressed in all functional NR1 splice variant (Dingledine et al., 1999) and
13
Introduction
comprise a binding site for calmodulin. In the presence of Ca2+, calmodulin has been
found to desensitize NMDARs (Ehlers et al., 1996). The C1 cassette (exon 21) is often
included as a part of teleost NR1 transcripts. This is also case for the teleost specific C1’
and C1’’ cassettes. Further, the C2 cassette (5’ portion of mammalian exon 22) has not
been reported to be expressed in teleost NR1, but the C2’ cassette (alternative stop codon
of mammalian exon 22) seems to be present in all teleost NR1 variants (Bottai et al.,
1998; Cox et al., 2005; Tzeng et al., 2007).
In mammals, the most commonly expressed NR1 splice variants include both the C1 and
the C2 cassette. A large pool of this variant has been found intracellularly, presumably in
the endoplasmatic reticulum (ER) (Chazot and Stephenson, 1997). C1 contains an ER
retention signal (RXR, where X can not be an acidic amino acid). However, this signal
can be masked by NR2 subunits or by postsynaptic density (PSD) family proteins. PSD
proteins bind to the PDZ domain ‘STVV’, which is found on the C2’ cassette. Splice
variants expressing the C2’ cassette or lacking the C1 cassette, are able to leave the ER
and reach the cell surface without binding to NR2 subunits. For review on early events in
glutamate receptor trafficking, see Vandenberghe and Bredt (2004).
Studies of the anoxia tolerance of western painted turtles (Chrysemys picta),have
revealed that the opening probability of NMDARs is reduced by 65 % after one hour of
anoxia (Buck and Bickler, 1998). Without this reduction, anoxic turtle neurons will die
within hours. Further, NMDAR surface expression has been shown to be lowered in
western painted turtles after 3-21 days in anoxia (Bickler et al., 2000).
1.4 Anoxia Tolerance in Fish – Evolutionary Perspective
Fish share a common ancestor with all vertebrates. Studies have shown that two whole
genome duplications (WGDs) probably occurred early in vertebrate evolution. The
organisms in a diploid (2N) population then doubles their number of similar
chromosomes, tetraploidization (4N), creating a copy set of every gene (paralogs), and
slowly returns to the state of diploidy, rediploidization. The resulting increase in the
number of genes from the WGDs made the advanced body form of vertebrates possible
(Sidow, 1996). Indeed, there has been proposed to be a direct relationship between gene
14

Introduction
copy number and species diversity (Amores et al., 1998). Further, the evolutionary time
span from non-vertebrates, such as cephalochordate amphioxus (Amphioxus lanceolatus),
to the more complex vertebrates, such as cartilaginous fish, is relatively short and
supports the positive effect of a possible WGD (see Figure 3).
Figure 3. Phylogenetic relationships among extant deuterostome classes and phyla. (The exact branching order of lampreys and hagfish is a matter of debate.) Note that the time span in which the advanced vertebrate body plan evolved - between the divergence of amphioxus and cartilaginous fish - is relatively short. Known phylogenies such as this one are essential for inferring duplications in gene families and other evolutionary events. (from Sidow, 1996)
Yet another WGD event has been reported early in the ray-finned fish lineage after the
divergence from tetrapods (the 1-2-4-8 hypothesis, Figure 4) (Meyer and Schartl, 1999).
This suggestion is supported by the presence of hundreds of duplicated genes in
pufferfishes (Takifugu rubripes, Tetraodon nigroviridis) and zebrafish (Danio rerio).
These genes have been reported to be co-orthologous to single-copy tetrapod genes
(Taylor et al., 2003). Analyses of sequence divergence between these paralogs suggests
that these genes were duplicated between 300-450 million years ago (Taylor et al., 2001).
This duplication is proposed to have happened after the divergence of sturgeons and may
have given the species-richness of the teleost lineage. This is an extremely diverse group
of vertebrates, and with more than 23500 species, the ray-finned fishes represent more
15
Introduction
than 95 % of all living fish species and about 50 % of all extant vertebrate species. More
than 99.8 % of ray-finned fishes belong to the teleosts. Examples of non-teleost ray-
finned fishes are the bichirs and sturgeons (Figure 4) (for review on biodiversity in teleost
fish, see Volff, 2005). Many teleost lineages, like the atlantic salmon (Salmo salar) and
rainbow trout (Oncorhynchus mykiss) or the genus Carassius (crucian carp and goldfish),
have experienced yet another WGD leading to an even more complex genomic
arrangement (Leggatt and Iwama, 2003). Organisms in the genus Carassius are today
indeed found to be tetraploids (Raicu et al., 1981).
Figure 4. The fish lineage. Origin of fish pictures: Manfred Schartl and Christoph Winkler (medaka, zebrafish, platyfish and Tetraodon), Erwin Schraml (African cichlid), John F Scarola (rainbow trout and Atlantic salmon), Suzanne L and Joseph T Collins (channel catfish), Bernd Ueberschaer (Nile tilapia), Konrad Schmidt (three spined stickleback) and Greg Elgar (Torafugu). (from Volff, 2005)
Force et al. (1999) the duplication-degeneration-complementation (DDC) model to
explain the fates of duplicated genes. The model defines three potential courses of
events; (i) mutations in regulatory elements prevents gene copies from being expressed,
and they end up as a pseudogenes (nonfunctionalization), (ii) degenerative mutations
occur in one copy of a gene, but not in the other, and make both copies necessary to
preserve ancestral functions (subfunctionalization) and (iii) positive mutation creates new
functions in one copy of a gene, and gives preservation of the functions of the non-
16

Introduction
mutated copy to retain ancestral functions (neofunctionalization). Further, the model of
conservation of paralogs by dosage effect is presented. If higher survival rates are
obtained by increasing the number of gene copies of a specific gene, then both paralogs
resulting from a duplication will be preserved.
Water holds much less oxygen than air (10 ml/L water compared to 210 ml/L air at 0 °C)
and the diffusion rate in water is only 1/10000 of that in air. As a result, oxygen may be
rapidly depleted in water and new oxygen will only slowly return. This makes fish likely
to experience hypoxia in their habitats, especially in stagnant waters with high degrees of
biomass and little supply of photons. Thus, aquatic habitats will often favour organisms
possessing features to handle periods of decreased oxygen supply. Several examples of
this can be mentioned. The crucian carp lives in small ponds that may become anoxic
during winter time, when ice and snow blocks oxygen synthesis/access. The epaulette
shark is a marine example of fish that has adapted to severe hypoxia occurring at shallow
coral reef platforms. The low tide at night brings oxygen levels down to 20 % due to the
respiration of coral and coral-living organisms (Nilsson and Renshaw, 2004). Also, the
Amazon water bodies become hypoxic and even anoxic in periods of the year, whereupon
many species have been found to change morphology and metabolism to meet the
challenge (Val et al., 1998).
17

Introduction
1.5 Aim
Due to its high energy demands, the brain is possibly the most anoxia sensitive organ.
When the NMDARs are opened, they will challenge the membrane potential and cause
the intracellular level of Ca2+ to rise. At low levels of ATP, the process of membrane
repolarization is prolonged and intracellular calcium levels might raise to critical
concentrations potentially leading to cell death.
Due to the key role that NMDARs play in the mammalian brain, one may expect that the
structure of these receptors is different in anoxia tolerant vertebrates.
The aim of this thesis is to examine the sequence of key components of the NMDAR,
with emphasis on the ubiquitous NR1 subunit in crucian carp brain, as well as
participating in examining the relative expression of different NMDAR subunits in this
species. Also, phylogenetic analysis will assist in the identification of the nature of the
components as well as pointing out close relatives to compare function. Possibly,
differences in the structure and composition of NMDARs could be involved in the anoxia
survival strategy of the crucian carp.
18

Material and Methods
2 Materials and Methods
2.1 Animals
The crucian carp where captured in May 2003 from Tjernsrud pond in Oslo, Norway.
The fish were kept in 750-litre tanks supplied with aerated, declorinated tap water. The
light conditions where 12 h light / 12 h darkness. The fish were fed daily with
commercial carp food.
Crucian carp were killed by a sharp blow to the head, followed by cutting the spinal cord.
The brain was rapidly sampled and snap-frozen in liquid nitrogen. It was stored at -80 °C
until used.
2.2 Isolation of mRNA
Brain tissue was homogenized on ice in a glass homogenizer (Duall by Kontes) using
Genoprep Direct mRNA kit. The concentration of the mRNA was assessed by measuring
optical density (OD) of 1/10 dilutions of mRNA at 260 nm, using GeneQuant
spectrophotometer (Amersham Pharmacia Biotech). RNA integrity was assessed by
analyzing three µl (~600 ng) of mRNA on a 1 % agarose denaturing gel. Well-defined
28S and 18S rRNA bands indicated non-degraded RNA. All procedures were carried out
according to manufacturer’s protocol.
2.3 Primer Design to Obtain Gene Specific Clones
At the start of the project cDNA for most of the subunits of the NMDAR had not been
cloned in any fish species (except for NR1 and NR2B). Thus, it was necessary to design
primers based on cDNA from more distantly related vertebrates, as well as from
sequences from genomic fish databases, to obtain full-length sequences of ccNR1, and
expressed sequence tags (ESTs) of ccNR2A-D and ccNR3A. cDNA sequences were
obtained from the NCBI web resource (http://www.ncbi.nlm.nih.gov/), while the genomic
fish databases used were the FUGU BLAST server (http://fugu.biology.qmul.ac.uk/blast/)
for Takifugu and the Ensemble server (http://www.ensembl.org/Danio_rerio/blastview)
for zebrafish (Danio rerio). In these genomic databases sequences for fish genes were
19

Material and Methods
located by blasting analogous rat sequences. Secondary to these BLAST searches,
tentative gene sequences were retrieved from the genomic sequences using GENSCAN
(http://genes.mit.edu/GENSCAN.html).
Available cDNA vertebrate sequences and fish sequences were aligned using ClustalX
(Thompson et al., 1997) (ftp://ftp-igbmc.u-strasbg.fr/pub/ClustalX/) and analyzed using
GeneDoc (Nicholas and Nicholas, 1997) (http://www.nrbsc.org/gfx/genedoc/index.html).
All sequences are listed in Appendix II.
To be able to specifically clone the different subunits of the NMDAR, particular care had
to be put in to alignment analyses and subsequent primer design. The degree of sequence
conservation between the different NMDAR genes is high, particularly in the TM region
and in between NR2 subunits (see Figure 2). To be able to clone each of the different
subunits it was therefore necessary to use primers that matched areas outside TM
domains. More specifically, primer syntheses were aimed at 5’ ends of the genes. These
regions were less conserved and allowed us to 1) construct primers that could specifically
distinguish the different subunits, and 2) obtain sequences that were well-suited for
phylogenetic analyses. The primers were designed to anneal to areas without known
alternative splice cassettes. Further, primers were aimed at areas of the 5’ ends of each
gene that displayed the highest degree of sequence conservation across different species.
Additionally, primers were aimed at areas that were different in between different
NMDAR subunits (to avoid cloning the “wrong” subunit). Primers were made using the
Primer3 software (http://frodo.wi.mit.edu/cgi-bin/primer3/primer3_www.cgi) and were
ordered from Invitrogen. Primers used to clone NMDARs in crucian carp are summarized
in Table 1.
20

Material and Methods
Table 1. GeneRacer™ PCR Primers for Gene Specific Clones
Gene a Forward primer 5’ 3’ (bp Ref. to GenBank Accession Number, CDS Segment)
Reverse primer 5’ 3’ (bp ref. to GenBank Accession Number, CDS Segment)
GenBank Accession Number b
ccNR1 GTTCACCTGGTGGCTGATG (1474-1492) GGTCCAGCACCAGGAAGG (2023-2006) Al, AF060557
ccNR2A AGTACGACTGGCACATCTTCTC (491-512) AATATCAATGCAGAACCCCTTG (1389-1368) Mm, NM_008170
ccNR2B AGCTGAAGAAGCTGCAGAGC (656-675) TTGCTGCGAGACACCATAAC (1631-1612) Mm, NM_008171
ccNR2C GTACAACTGGGGCAACTTTGTG (477-498) TGGCAGGATCAACACTCTCTAC (1267-1246) Mm, D10694
ccNR2D GAGGTGCTGGAGGAGTACGA (520-539) CATAACGCTGATGCCTGTCT (1652-1633) Mm, NM_008172
ccNR3A AAGACATGAACTTTGAGTTTGACC (1766-1789) TCTTCCATTCGTAGAGAGTGAGG (2095-2073) Hs, AF416558
a cc = Carassius carassius b Al = Apteronotus leptorhynchus, Mm = Mus musculus, Hs = Homo sapiens
Throughout this thesis, the NMDAR subunit genes for the crucian carp will be referred to
as ccNR1, ccNR2A, ccNR2B, ccNR2C, ccNR2D and ccNR3A.
2.4 Full-length Cloning by RACE
2.4.1 cDNA Library RACE (Rapid Amplification of cDNA Ends) was utilized to obtain the full-length
sequence of ccNR1. RACE cDNA was made from ~1000 ng mRNA from crucian carp
brain tissue using GeneRacer™ (Invitrogen). All procedures were carried out according
to manufacturer’s protocol.
2.4.2 GeneRacer™ Primer Design GeneRacer™ is based on the use of GeneRacer™ specific primers that anneal to the ends
of the RACE cDNA, as well as gene specific primers (GSPs). The GSPs were designed
using the Primer3 resource and according to the GeneRacer™ protocol. All primers were
set to have melting temperatures around 70 °C, and they were set to have a GC-clamp.
The 5’ GSP was constructed together with the GeneRacer™ 5’ Primer as forward primer,
and the 3’ GSP was made with the GeneRacer™ 3’ Primer as reverse primer. Synthesis
of the nested gene specific primers (GSPN) followed the same procedure. See Table 2
for all ccNR1 GeneRacer™ GSPs and GSPNs. Primers were synthesized by Invitrogen.
21

Material and Methods
Table 2. PCR GeneRacer™ Gene Specific Primers (GSPs) for the ccNR1 Subunit
Primer Name a Melting temp. in °C
Sequence 5’ 3’ Bp ref. to Knifefish NR1, GenBank AF060557 (CDS part)
ccNR1 GSP 5’R1 72.2 ATAGCAAAGCCAGCCCACACCATTCC 1970-1945 ccNR1 GSP 3’F1 72.6 AGCTCCTGGGTGGCCTTGCTGATATG 1559-1584 ccNR1 GSPN 3’F2 70.1 CGTTGCACCCTTGACAATCAACAATG 1587-1612 a R=Reverse; F=Forward, cc = Carassius carassius
2.4.3 PCR Reaction Conditions for the GeneRacer™ Procedure PCR was performed on a Mastercycler gradient (Eppendorf) using 1 µl 1/5 and 1/50
dilutions of cDNA from crucian carp brain tissue. Amplified products were analyzed on a
1 % agarose gel containing ethidium bromide (EtBr). All procedures were carried out
according to manufacturer’s protocol.
The 5’ and 3’ ends of the ccNR1 gene are rather long. According to the length of the
knifefish NR1 mRNA and the corresponding placement of the primers, the 5’ end would
be close to 2000 bp and the 3’ end would be about 2500 bp. This makes PCR
amplification difficult, and calls for testing of different variants of reaction parameters
such as Taq polymerases, PCR programs and primers. Firstly, two different Taq
polymerases were used in this thesis, Platinum® Taq DNA Polymerase High Fidelity
(Invitrogen) and Advantage 2 Polymerase mix with the BD TITANIUM™ Taq
polymerase (BD Sciences Clonetech). Secondly, PCR programs were based on
recommendations given in the GeneRacer™ protocol, and the length of the elongation
step (polymerase action) was calculated individually for each gene. These calculations
were based on sequence alignments (as previously described), where 1 kb template was
estimated to require 1 minute of polymerase action. Thirdly, four sets of primers were
synthesized and tested for each of the cDNA ends of ccNR1. Primers that provided
positive results and were used for cloning are summarized in Table 1.
RACE cloning of the 5’ end of ccNR1 was achieved using Platinum Taq DNA
Polymerase High Fidelity. The following PCR program was used: 1) 2 min at 94 °C, 2)
30 sec at 94 °C, 3) 3 min at 72 °C 4) repeat 2-3 5x, 5) 30 sec at 94 °C, 6) 3 min at 70 °C,
22
Material and Methods
7) repeat 5-6 5x, 8) 30 sec at 94 °C, 9) 30 sec at 65 °C, 10) 3 min at 72 °C, 11) repeat 8-
10 25x, 12) 10 min at 72 °C, 13) hold at 4 °C.
Cloning of the 3’ end of ccNR1 was achieved using Advantage 2 Polymerase mix.
According to the supplier, this polymerase mix is particularly efficient in amplifying long
and troublesome cDNA fragments, and should give amplification of fragments as large as
20 kb. The following PCR program was used for the initial PCR reaction (non-nested): 1)
1 min at 95 °C, 2) 30 sec at 95 °C, 3) 8 min at 72 °C 4) repeat 2-3 5x, 5) 30 sec at 95 °C,
6) 8 min at 70 °C, 7) repeat 5-6 5x, 8) 30 sec at 95 °C, 9) 8 min at 68 °C, 10) repeat 8-9
25x, 11) 10 min at 72 °C, 13) hold at 4 °C. Additionally, nested PCR was necessary to
achieve amplification of the 3’ end of ccNR1. This was done using 1 µl 1/100 dilutions of
the initial PCR reaction, and using the following PCR program: 1) 1 min at 95 °C, 2) 30
sec at 95 °C, 3) 30 sec at 72 °C, 4) 3.5 min at 72 °C, 5) repeat 2-4 5x, 6) 30 sec at 95 °C,
7) 30 sec at 70 °C, 8) 3.5 min at 72 °C, 9) repeat 6-8 5x, 10) 30 sec at 95 °C, 11) 30 sec at
68 °C, 12) 3.5 min at 72 °C, 13) repeat 10-12 25x, 14) 10 min at 72 °C 15) hold at 4 °C.
2.5 Cloning
PCR reactions that only contained PCR products of expected sizes were ligated directly
into p-GEM®-T-Easy Vector (Promega). In PCR reactions that contained bands of
unexpected size, the desired bands were purified from their respective gels using
Wizard® SV Gel and PCR Clean-Up Systems (Promega). These PCR fragments were
then ligated into p-GEM®-T-Easy Vector (Promega). Subsequent to ligation, vectors
were transformed into electro competent bacteria (Escherichia coli) (Invitrogen) using a
specialized electroporation cuvette placed in a Gene Pulser™ electroporation machine
(BioRad). The Gene Pulser™ was set to 25 µF capacitance, 1.3 kV and a 200 Ω
resistance. To identify bacteria containing plasmids with insert, the bacteria were grown
on agar plates containing 0.1 mg/ml ampicillin (Sigma), 100 µl IPTG (100 mM) and 20
µl X-gal (50 ng/µl) (Promega). This gives positive selection for ampicillin-resistance and
negative selection against β-galactosidase activity. White colonies were thus expected to
contain plasmids with inserts, and the sizes of these inserts were assessed using Platinum
Taq PCR (with plasmid specific primers; T7 and SP6). After investigating these PCR
23

Material and Methods
reactions on a 1 % agarose gel, colonies with correct inserts were incubated in LB
medium containing 0.1 mg/ml ampicillin over night. Plasmid DNA from 10 positive
colonies were then extracted using Wizard® PlusSV Minipreps DNA purification system
(Promega). Plasmid DNA yields were determined by OD260 measurements, and 450 ng
of plasmid DNA was sent for sequencing (using M13F+R primers).
2.6 Sequencing
Plasmids were sequenced at the MegaBACE lab, Department of Biology and Molecular
Biosciences, Centre for Ecological and Evolutionary Synthesis (CEES), University of
Oslo, Norway. During the sequencing part of this thesis, the MegaBACE lab was
experiencing problems with the stability of the sequencing facility. Consequencely, only
short sequences (300-600 bp) were obtained. To be able to cover the rather large ccNR1
mRNA, this resulted in two extra rounds of sequencing of both the 5’ and the 3’ end
clones. Primers used for these reactions were designed using Primer3 and synthesized by
Invitrogen. They are summarized in Table 3. These primers had melting temperatures
~50 °C to match the sequencing reaction conditions at the MegaBACE facility.
Table 3. Extra Sequencing Primers for the ccNR1 Subunit
Primer name a Melt. temp. in °C
Sequence 5’ 3’ Bp ref. to knifefish NR1, GenBank AF060557 (CDS part)
ccNR1 5’F1 b 51.2 GAACCAAGTGTACGGAAG 138-155 ccNR1 5’R6 d 50.4 CTGTAATGAGCATATTTTCTG 1106-1086 ccNR1 5’F2 d 54.7 TCTCTGCCAGTGAGGAAG 713-730 ccNR1 5’R5 b 49.6 TAGTTAGTCCCTGGTATTTG 1666-1647 ccNR1 3’F5 c 52.0 CACGTAGTTTTTCAGCAAG 1919-1937 ccNR1 3’F6 e 50.4 CTCACCTTTGAGAATATGG 2470-2488 ccNR1 3’R2 e 51.4 CACACTTATAGGGGATTTTC 3882-3863 rel. to cc ‘ATG’ ccNR1 3’R1 c 50.6 CATCTTAGTCATCTGCAATC 4354-4335 rel. to cc ‘ATG’ a The ‘F’ and ‘R’ in the primer names means ‘Forward’ and ‘Reverse’, respectively. cc= Carassius carassius b These primers were involved in the second round of sequencing (nested sequencing) on the cloned 5’ cDNA template. c These primers were involved in the second round of sequencing (nested sequencing) on the cloned 3’ cDNA template. d These primers were involved in the third round of sequencing (nested nested sequencing) on the cloned 5’ cDNA template. e These primers were involved in the third round of sequencing (nested nested sequencing) on the cloned 3’ cDNA template.
24

Material and Methods
2.7 Aligning Sequences
After sequencing by MegaBACE, the raw sequences were examined to assess their
quality. This was performed in BioEdit (Hall, 1999). After removing the clearly biased
sequences, multiple alignments were performed using ClustalX. Consensus sequences
were made using GeneDoc.
2.8 Protein Sequence and Structure Features
The full length NR1 amino acid sequence was deduced by translating the ccNR1 mRNA
using GeneDoc software. To be able to assess protein properties, the ccNR1 protein
sequence was aligned with rat, knifefish and zebrafish NR1 using ClustalX and GeneDoc.
The TM topology was also supported by analyzing the ccNR1 through the web server
TMHMM Server v2.0 (http://www.cbs.dtu.dk/services/TMHMM-2.0/). The signal
peptide sequence (SS) was identified using the freely available SignalP 3.0 web server
(http://www.cbs.dtu.dk/services/SignalP/), and N-glycosylation and phosphorylation sites
were predicted using the Prosite server (release 20.13) (http://expasy.org/prosite/), the
NetPhos 2.0 server (http://www.cbs.dtu.dk/services/NetPhos/) and the NetPhosK 1.0
Server (http://www.cbs.dtu.dk/services/NetPhosK/). A 3D structure of the ccNR1 ligand
binding domain was generated using DeepView (http://au.expasy.org/spdbv/), which in
turn used the crystal structure of rat NR1 (Protein Data Bank ID 1PB7) as template.
2.9 Phylogenetic Analysis
440-600 bp regions of crucian carp NMDAR mRNA were aligned with sequences from
other vertebrates using ClustalX. The accession numbers for NMDAR genes used are
summarized in Appendix II. BLAST searches in available zebrafish databases (see
section 2.3) identified two paralogs of NR1, as well as two paralogs of all NR2 subunits.
These were included in the phylogenetic analyses. GeneDoc were used to create files
compatible with phylogenetic analyses calculated and bootstrapped using the neighbor-
joining method through the non-profit software Phylip
(http://bioweb.pasteur.fr/seqanal/phylogeny/phylip-uk.html). Unrooted phylogenetic
25
Material and Methods
diagrams were made using freely available software Treeview
(http://taxonomy.zoology.gla.ac.uk/rod/treeview.html)
2.10 Primer Design for Real-Time RT PCR
For future gene expression analyses of crucian carp NMDAR subunits, sets of real-time
RT PCR primers were made, see Table 4. These primers were made using the
LightCycler Probe Design Software (version 1.0, Roche), and designed to specifically
amplify each of the different subunits. Amplicon sizes were set to 200-300 bp. The
primers were synthesized by Invitrogen.
Table 4. LightCycler Primers for Real-Time RT PCR
Gene a Forward primer 5’ 3’ (bp Ref. to GenBank Accession Number, CDS Segment)
Reverse primer 5’ 3’ (bp ref. to GenBank Accession Number, CDS Segment)
Product size
GenBank Accession Number b
ccNR1 TATGATCGTTGCACCCT (1581-1597) GTAAAGCATCACCGCC (1782-1767) 202 bp Al, AF060557 ccNR2A AAGGTCGGATACCTGA (929-944) ATGTCCCCAAATGAGTT (1196-1180) 268 bp Mm, NM_008170 ccNR2B AAGGCTTCTGTATCGAC (1373-1389) CTATGAAGGGCACGGA (1591-1576) 219 bp Mm, NM_008171 ccNR2C GGATTCATTCCCGATGG (922-947) ATACAGGGTATCGCATCT (1159-1142) 238 bp Mm, D10694 ccNR2D CGTTCAATAATGAGGGC (1091-1107) CACGGAGTCCCTAATG (1346-1331) 256 bp Mm, NM_008172 ccNR3A ACGGGAAATATGGAGC (1805-1820) CATGGACCAGTGCAAC (2031-2016) 227 bp Hs, AF416558 a cc = Carassius carassius b Al = Apteronotus leptorhynchus, Mm = Mus musculus, Hs = Homo sapiens
26
Results
3 Results
3.1 NMDAR Subunit Sequences
The full-length mRNA sequence of ccNR1 and ESTs of ccNR2A-D and ccNR3A were
found, as described in Materials and Methods (see Appendix IV for sequences).
Two paralogs were found for ccNR1, ccNR2A and ccNR2D subunits. Because of the
close relationship with the zebrafish NMDAR subunits, the sub-naming of the crucian
carp subunits and paralogs were determined based on the closest zebrafish paralog
according to the phylogenetic analysis in Figure 6 and 7, e.g., for the ccNR1 subunit, the
phylogenetically closest zebrafish paralog would be the drNR1.1 and the subsequent
naming for the crucian carp subunit would be ccNR1.1. For cucian carp NMDAR
paralogs, an extra sub-level of naming was applied and the zebrafish relative naming
resulted in the names: ccNR1.1.1, ccNR1.1.2, ccNR2A.1.1, ccNR2A.1.2, ccNR2B.1,
ccNR2C.1, ccNR2D.1.1 and ccNR2D.1.2. When comparing the sequences of both
paralogs of a crucian carp NMDAR subunit with another subunit, there will be made an
average and the naming will step up one level, e.g., comparing other sequences with the
sequences for the ccNR2D.1.1 and ccNR2D.1.2 paralogs, they will collectively be
referred to as ccNR2D.1.
Nucleotide sequences of the two ccNR1.1 paralogs diverged by 3.3 %, with 48 out of
1453 nucleotides being different. This area stretched from amino acid 61 to 545. Of the
48 nucleotide mutations, only two resulted in changes of the amino acid composition. The
first, threonine (T) serine (S) was seen in position 96, and the second, methionine (M)
threonine (T), was seen in position 433. The N1 and C2’ cassettes were found in both
ccNR1.1 paralogs (see Figure 5 in section 3.2 for positions in the protein). Whereas, a
novel splice cassette, consisting of the amino acids ‘NTSG’, was found in the ccNR1.1.1
paralog (Figure 5, box at position 464-467). Nucleotide sequences of the two ccNR2A.1
paralogs diverged by 6.6 %, with 37 out of 559 nucleotides being different. This brought
along 14 differences in between amino acid sequences and the area aligns with amino
27

Results
acid 238-424 in ccNR1.1.1. Finally, the two paralogs of ccNR2D.1 also diverged by 6.6
%, with 47 out of 1094 nucleotides being different. This brought along 9 differences in
between amino acid sequences and compares to the amino acid area 172-536 in
ccNR1.1.1.
It was not possible to use the nucleotide sequence to determine which type of NR3
subunit that had been cloned, as the sequence is located in a highly conserved area of
NR3A and NR3B. However, using the amino acid sequence provided evidence for it
being NR3A (see details in section 3.3).
Ranging from amino acid 244 to 426, ccNR1.1 displayed 33-39 % nucleotide homology
to the different ccNR2 subunits, and ranging from amino acids 497 to 595, ccNR1.1
displayed 32 % nucleotide homology to the ccNR3A subunit. In between ccNR2 subunits
the homology was 44-58 % measuring in the amino acid region 244 to 426 in ccNR1.1.1.
Further, in the same area (ccNR1.1.1 amino acid 244 to 426) the ccNR1.1 subunit
showed 72-84 % homology to other vertebrate NR1 subunits (these vertebrates can be
found in Figure 7). Finally, the sequences defining the ccNR2 phylogenetic analysis
(matching area ccNR1.1.1 amino acid 244 to 469), ccNR2A.1, ccNR2B.1, ccNR2C.1 and
ccNR2D.1 showed 60-90 %, 56-78 %, 59-90 % and 50-90 % homology to their
respective vertebrate NR2 subunits (these vertebrates can be found in the phylogenetic
tree for the NR2 subunits in Figure 8).
3.2 Crucian Carp NR1 Structure and Special Features
The deduced ccNR1.1 subunit protein sequence can be found in Appendix IV and is
represented by the most abundantly expressed paralog, ccNR1.1.1, as determined by the
existence in 8 out of 12 clones. Figure 5 shows an alignment of ccNR1.1.1 with rat,
zebrafish and knifefish NR1. It displays a high degree of conservation in the TM
domains, TM1-TM4, the pore-forming element, P, and the glycine binding areas S1 and
S2 (black bars). The black arrow points to known ligand binding residues (for review on
the NR1 structural domains, see Chen and Wyllie 2006). The high degree of similarity in
TM domains between ccNR1.1.1 and knifefish NR1 suggests similar NR1 topologies in
28

Results
these two species. This was supported by the TMHMM Server (v2.0) (prediction of TM
helices in proteins). The TM helices were predicted to span the amino acids 581-600,
655-677 and 835-857 starting outside the cell and ending inside. The putative channel
gating segment ‘SYTANLAAF’ at the N-terminal of TM3 was found to be highly
conserved between fish and mammals. Four phosphorylation sites were suggested by the
phosphorylation prediction servers NetPhos 2.0, NetPhosK 1.0 and Prosite and 10
positions for N-glycosylation were found with the Prosite scan server. All sequences used
in the alignment contained the N1, C0 and C2’ splice cassettes, whereas only zebrafish
and knifefish contained the C1 and C1’ cassettes, and knifefish alone contained the C1’’
cassette. One N-glycosylation site, ‘NTSG’ at ccNR1.1.1 amino acid 464-467, was not
found in other available vertebrate sequences.
29

Results
Figure 5. Amino acid comparisons of crucian carp (cc) ccNR1.1.1 with rat (rn) NR1, zebrafish (dr) NR1 and knifefish (al) NR1. Residues identical to ccNR1.1 are indicated by a dot (.) and deletions/gaps are indicated by a hyphen (-). Amino acid positions are found to the right and above the alignment, and sequence names are found to the left. The signal sequence (SS) is found at the start of the ccNR1.1 sequence, and TM1, TM2 and TM4 indicate the putative transmembrane segments. P represents the proposed ion pore, while S1 and S2 represent glycine ligand binding segments. Known glycine ligand binding residues are indicated by black arrows. N-glycosylation sites and phosphorylation sites are pointed out by black squares and black circles, respectively. An asterisk (*) is found above the Mg2+ binding asparagine residue in the pore element. N1, C1, C1', C1'' and C2' splice cassettes are indicated. The 'NTSG' cassette found in crucian carp is represented by a box (residues 464-467). Areas with black triangles are recognized by the PSD95 protein, and the area with grey triangles indicates an ER retention signal.
30

Results
The crystal structure of the rat NR1 ligand binding domain (Protein Data Bank ID 1PB7)
was utilized to determine the 3D (tertiary) structure of corresponding regions of crucian
carp ccNR1.1.1 and zebrafish NR1 paralogs (Figure 6). All amino acids that were found
to be different between crucian carp and zebrafish were located outside the glycine-
binding structure. The ‘NTSG’ cassette was contained in an unresolved part of the rat
NR1 crystal structure.
Figure 6. 3D (tertiary) structure of N-terminal glycine binding extracellular domain of the ccNR1.1.1 subunit. The rat NR1 crystal structure (Protein Data Bank ID 1PB7) was used as template. In the white region, that spans the S1 segment in Figure 5, the mutations were assessed in two zebrafish NR1 paralogs and the crucian carp ccNR1.1.1 paralog. All differences in this part of the protein were located on the surface of the structure and are presumably not affecting the binding of glycine (fragment in blue). Green β-sheet/coil indicate sequences entering and leaving transmembrane regions. Red β-sheet/coil indicate sequences entering and leaving the splice cassette, ‘NTSG’, reported in crucian carp. Aligning, imaging and colouring were made with the DeepView software. cc = Carassius carassius, dr = Danio rerio
31

Results
3.3 Phylogenetics Analysis
ESTs for all NMDAR subunits were obtained from Trachemys scripta, using primers
meant for cloning of the same genes in crucian carp. This was performed by others at our
research group. These sequences were included in phylogentic analyses whenever they
overlapped with crucian carp sequences.
Figure 7 shows an unrooted phylogenetic tree, placing the two ccNR1.1 paralogs,
ccNR1.1.1 and ccNR1.1.2, in an evolutionary context together with the zebrafish
drNR1.1 and other teleosts. This tree was made by aligning sequences as defined by
nucleotides 1025-1623 of knifefish NR1. This was the only region containing both of the
ccNR1.1 paralogs overlapping with the two paralogs in zebrafish. The colouring of
Figure 7 corresponds with the colouring of Figure 6.
Figure 7. Phylogenetic tree for NMDAR subunit NR1. Species included are al = Apteronotus leptorhynchus, ap = Anas platyrhynchus, cc = Carassius carassius, dr = Danio rerio, gg = Gallus gallus, hs = Homo sapiens, mm = Mus musculus, rn = Rattus norvegicus, tr = Takifugu rubripes, xl = Xenopus laevis. The sub-numbering of the subunits for cc and dr is referring to paralogs found in the organism. The colours correspond to the colouring of Figure 6. The tree is based on the alignment of the alNR1 mRNA CDS area 1025-1623 (GenBank AF060557), which was generated using ClustalX. The phylogenetic relations were calculated and bootstrapped using the neighbor-joining method. The numbers at branch points are the bootstrap values from 1000 iterations.
32

Results
Figure 8 shows an unrooted phylogenetic tree, placing the ccNR2A.1-D.1 subunits in an
evolutionary context. The identity of the different ccNR2 subunits was confirmed as they
were positioned among equal subunits in the tree. This tree was made by aligning
sequences as defined by nucleotides 850-1403 of knifefish NR2B. This was the only
gene region containing sequences for all ccNR2 subunits.
Figure 8. Phylogenetic tree for NMDAR subunits NR2A-D. Species included are al = Apteronotus leptorhynchus, cc = Carassius carassius, dr = Danio rerio, gg = Gallus gallus, rn = Rattus norvegicus, ts = Trachemys scripta. The sub-numbering of cc and dr subunits refers to different paralogs. The tree is based on an alignment defined by nucleotides 850-1403 of knifefish NR2B, and was generated using ClustalX. The phylogenetic relations were calculated and bootstrapped using the neighbor-joining method. The numbers at branch points are the bootstrap values from 1000 iterations.
33
Results
The NMDAR subunits NR3A and NR3B were only available for human, mouse and rat at
the time of primer synthesis and phylogenetic analyses in this thesis. Therefore, no
phylogenetic tree for the NR3 family is shown. However, alignments were made defined
by nucleotides 1790-2072 of rat NR3A (GenBank AF073379). These alignments revealed
that the obtained ccNR3A EST (283 nucleotides) displayed varying similarity to
vertebrate NR3A and NR3B, e.g. 73 % homology to rat NR3A and 75 % homology to rat
NR3B was found. Based on these nucleotide comparisons it was not possible to define
ccNR3 to be NR3A or NR3B. The area was equally conserved between the two.
Therefore, to confirm that the ccNR3A subunit had been cloned, a BLAST search was
executed on deduced amino acid sequence. The 93 resulting amino acids showed 86-100
% similarity to vertebrate NR3A, while it showed 77-81 % similarity to the vertebrate
NR3B. More specifically, the 93 deduced ccNR3A amino acids were 87 % homologous
to rat NR3A and 81 % homologous to rat NR3B.
Finally, Figure 9 shows an unrooted phylogenetic tree to place the crucian carp ccNR1.1
and ccNR2 subunits in an evolutionary relationship to each other. The crucian carp
paralogs available were grouped together and the ccNR2 subunits sharing features
(NR2A/NR2B and NR2C/NR2D, review by Dingledine et al., 1999) also displayed
proximity.
34

Results
Figure 9. Phylogenetic tree for crucian carp NMDAR subunit ccNR1.1 and ccNR2A.1-D.1. cc = Carassius carassius. The sub-numbering of the ccNR1.1, ccNR2A.1 and ccNR2D.1 subunits is referring to paralogs found in the organism. In addition, all subunits are numbered to reflect the evolutionary closest zebrafish paralog, see Figure 7 and 8. The colour corresponds to the colouring of Figure 6 and 7. The tree is based on the nucleotide alignment of the subunits in the area of the ccNR1.1.1 protein amino acid 244 to 426. It was generated using the output of a ClustalX multiple alignment and was calculated and bootstrapped using the neighbor-joining method. The numbers at branch points are the bootstrap values from 1000 iterations.
35
Discussion
4 Discussion This thesis reports the cloning and sequencing of the full-length NMDAR subunit
ccNR1.1 mRNA and of ESTs of the subunits ccNR2A.1-D.1 and ccNR3A. The ccNR1.1
sequence and its features have been assessed and phylogenetic trees for all subunits have
been computed. This was done to confirm their identity and to place them in an
evolutionary context. Further, sets of real-time RT PCR primers were made for all
subunits. These primers will enable future analyses of mRNA expression in normoxic and
anoxic crucian carp.
4.1 PCR Optimization
RACE PCR on the ccNR1.1 subunit proved to be difficult, particularly in its 3’ end. To
obtain functional assays, it was therefore necessary to optimize different reaction
parameters, like Taq polymerases, PCR programs and primers.
In the 3’ end this implied the use of a different Taq polymerase, since the Platinum® Taq
seemed to be operating close to its limits. The Advantage 2 polymerase mix was used, as
this polymerase mix is supposed to be particularly useful for difficult templates. In
addition to containing the modified and more robust BD TITANIUM™ Taq polymerase,
it contains a proof reading enzyme, and is reported by the manufacturer to amplify DNA
templates as large as 20 kb.
The fact that a different Taq polymerase had to be used to achieve successful 3’ RACE of
ccNR1.1 might have to do with the quality of the primers. In the GeneRacer™ protocol
the linker-specific primers (GeneRacer™ 5’ and 3’ primers) were listed as having melting
temperatures between 72 and 78 °C. When this was calculated using the Primer3
software, these primers were assigned melting temperatures ranging from 65 and 69 °C.
Further, GSP RACE primers were designed using Primer3, and they were given Primer3
calculated melting temperatures ranging from 70 to 72 °C (Table 2). Thus, there was a
large discrepancy in melting temperatures between GeneRacer™ primers and GSPs. This
was not discovered until late in course of the project, and brought along large variations
36

Discussion
in melting temperature (~4.4°C) within every single primer pair. The basis of touchdown
PCR is to start out with annealing temperatures similar to those of primer melting
temperatures, and to gradually lower it to get a more efficient amplification as PCR
products are accumulating (Don et al., 1991). Primers with different melting temperatures
will require different annealing temperatures, and the closer the melting temperatures of a
primer pair, the larger their potential of success. Thus, the primers used for 3’ RACE of
ccNR1.1 were far from ideal.
4.2 NMDAR Subunit Sequences
There are greater sequence similarities in between ccNR2 subunits than between ccNR2
and ccNR1.1 (Figure 9) or ccNR3A. All ccNR2 ESTs were obtained in the 5’ end (N-
terminal) of the gene. This was done to be able to distinguish between them in PCR
reactions and to enable phylogenetic analyses.
4.2.1 Primer Design
Primers designed for EST cloning of ccNR1.1, resulted in an amplicon containing the
ligand binding loop S1, the pore element P and the transmembrane segment TM3 (Figure
2). The primers where placed in highly conserved regions. These turned out to represent
β-plate and α-helix structures (data not shown). These structures are considered
important for protein function and tend to be conserved across species (Sitbon and
Pietrokovski, 2007). Positions for primers were Primers for EST cloning of ccNR3A
were aimed toward the membrane pore element P, the transmembrane TM3 and part of
the ligand binding loop S2. These ccNR3A elements are highly conserved between
species, as well as between ccNR3 subunits, especially on the nucleotide level (see Figure
2 and Figure 5, section 3). Thus, the ccNR3A identity could not be verified via
nucleotide BLAST, and could only be determined via amino acid BLAST. Further, the
highly conserved sequence excluded accurate assessment of NR3 phylogenetics. This
would have been possible, had the ccNR3A EST been retrieved from the less conserved
pre-transmembrane region (as was done for ccNR2A.1-D.1).
37

Discussion
4.2.2 Crucian Carp Paralogs
The two paralogs found for ccNR1.1, ccNR2A.1 and ccNR2D.1 displayed DNA mutation
rates of 3.3 %, 8.3 % and 8.1 %, respectively. These mutations affected the amino acid
sequence with a rate (functional mutation rate) of 0 %, 36 % and 14.3 %. The sequences
investigated were located to analogous regions of the 5’ ends (ccNR1.1.1 amino acid area
238-381, Figure 5). The DNA mutation rates tell us that the ccNR2A.1 and ccNR2B.1
genes are mutating twice as fast as the ccNR1.1 gene. Speculatively, mutations in the
ccNR1 gene may produce dysfunctional proteins that are selected against. The functional
mutation rates reflect this possibility, as no amino acid changes are seen in the ccNR1.1
protein. This indicates the need for uniform and stable NR1 function. In the light of the
dose-model proposed by Force et al. (1999), both ccNR1 paralogs might be needed to
cover the demand for NR1 subunits. Thus, both copies must retain their functionality.
Further, the high amino acid mutation rates of NR2A.1 and NR2B.1 indicate that
functional changes in this region of ccNR2 proteins are not detrimental for their function.
Indeed, for ccNR2A every third mutation ends in changes in amino acid composition.
The high amino acid mutation rate may be due to two factors. Firstly, the mutations may
not affect protein function. Secondly, the mutations may occur in a part of the protein
where functional changes are allowed.
In accordance with the DDC model by Force et al. (1999) the paralogs of ccNR2A.1 and
ccNR2D.1 might have become subfunctionalized or neofunctionalized. The wider
variety of NMDAR subunits in crucian carp could reflect a need for seasonal change in
subunit composition. Indeed, in another cyprinid, the zebrafish, the expression of
NMDAR subunit paralogs have been proven to vary during the course of embryonic CNS
development. While the zebrafish paralog NR1.1 mRNA is found in the brain, retina and
spinal cord 24 hours postfertilization (hpf), the NR1.2 is expressed only in the brain and
detected 48 hpf. The NR2 paralogs displayed a much more diversified expression: both
NR2A paralogs were expressed in the brain 48 hpf, no NR2B or NR2C paralog could be
detected embryonically and while the NR2D.1 was expressed in the forebrain, retina and
spinal cord 24 hpf, the NR2D.2 was only found in the retina (Cox et al., 2005). The
regional expression of the ccNR2A.1 and ccNR2D.1 paralogs in crucian carp remains to
38

Discussion
be assessed, along with the confirmation of the existence and expression of paralogs for
ccNR2B and ccNR2C.
Another analysis performed of the two ccNR1.1 paralogs revealed 48 nucleotide
mutations within the 5’ region of the gene (amino acid 60-545 in Figure 5). These
mutations resulted in 2 differences in amino acid composition (amino acid 96 and 433).
In general, the amino acids are conserved in these two local regions of the gene (Figure
5). This implies a functionally important segment where amino acid transitions would be
undesired to preserve protein function. However, interestingly, the two residues also
differ between the other species compared in Figure 5. Taken together, the transitions
between the two crucian carp ccNR1.1 paralogs would not likely alter the paralogs’
function.
4.3 Crucian Carp NR1 Subunit Structure and Function
4.3.1 The N-terminal and C-terminal Splice Cassettes
The multiple alignment shown in Figure 5 shows the high degree of NR1 protein
conservation between crucian carp, rat, zebrafish and knifefish. All four species express
NR1 with the alternative splice cassette N1 and the alternative C-terminal splice cassette
C2’. The ccNR1 N1 cassette shows 90-95 % similarity to the zebrafish and knifefish N1
cassette, and 86 % similarity to the rat N1 cassette. The amino acids that differ tend to
retain the physical properties of the protein. Thus, the overall hydrophilic profile of N1 is
preserved in crucian carp, as the positively charged residues in ccNR1 position
189,190,191,204,205 and 208 are retained. Its function as a modulator of polyamine
potentiation and proton inhibition (Zheng et al., 1994) do not seem to change. Further, the
N1 cassette was not present in all clones obtained from crucian carp, leaving the crucian
carp with the ability of varying how NMDARs will be influenced by protons and
polyamines.
The C0 cassette is found immediately after TM4 and is present in all known splice variant
of the NR1 (Dingledine et al., 1999) (see Figure 5). The C0 cassette is known to host one
of the two calmodulin binding sites positioned in the NR1 C-terminal. These function to
39
Discussion
desensitize the NMDAR in the presence of Ca2+ (Ehlers et al., 1996). Only one amino
acid differed in this cassette compared to rat and zebrafish, suggesting that the function of
inhibition by calmodulin is preserved in crucian carp.
The C2 cassette of the NR1 C-terminal remains to be found in teleosts. However, the
alternatively spliced C2’ cassette, the C1 cassette and the teleost specific C1’ and C1’’
cassettes have been found to be expressed (Bottai et al., 1998; Cox et al., 2005; Tzeng et
al., 2007). The C2’ cassette includes a binding site for the PSD95 protein with the motif
‘STVV’ (see Figure 5). This has been proposed to link the NMDAR to the post-synaptic
density for correct location at the synapse (Kornau et al., 1995). The motif is completely
conserved between crucian carp and the other species in the alignment. Thus, ccNR1.1.1
is likely to bind PSD95. Further, this motif is needed to mask the ER retention signal
‘RRR’ present in the C1 cassette (Standley et al., 2000) (pointed out by the grey triangles
in Figure 5). Whether or not the C1 cassette and the teleost specific cassettes C1’ and
C1’’ are expressed in crucian carp, remains to be investigated.
4.3.2 The NTSG Cassette
Figure 5 and 6 reports a new ‘NTSG’ cassette in crucian carp not reported to be
expressed in other species. This sequence is predicted by the Prosite scan server to
function as an N-glycosylation site, together with nine other sites in the protein. These
nine sites were found to be conserved between rat, zebrafish, knifefish and crucian carp,
indicating important roles. N-glycosylation might serve to assist the proper folding of a
protein, but it may also function as anchor points for extracellular molecules. For
ionotropic glutamate receptors this type of glycosylation has been observed to influence
ligand binding activity, receptor physiology, susceptibility to allosteric modulation and
sometimes trafficking to and from the membrane of the receptor (Standley and Baudry,
2000). In Figure 6 the ‘NTSG’ cassette of crucian carp aligns with an unresolved
extracellular part of the rat NR1 crystal structure. The fact that it has not been resolved
indicates that it represents a ‘loose’ part of the structure, and indicates that it is situated
on the surface of the protein. The former means that the sequence is not stable as it is, and
makes it a likely candidate for interaction with other molecules. The latter makes it very
40

Discussion
likely for the ‘NTSG’ to be N-glycosylated. Indeed, this cassette is inserted in a cysteine-
rich NR1 region, loop 1, ascribed important roles in subunit assembly and in the allosteric
coupling of NR1 glycine binding and NR2 glutamate binding (Furukawa and Gouaux,
2003).
After using the nucleotide version of the ‘NTSG’ region to search genomic sequence
databases, analogs were found in zebrafish and Takifugu. While, 100 % conservation
was found between crucian carp and zebrafish, less conservation was found between
crucian carp and Takifugu. In Takifugu the sequence does not make up an N-
glycosylation site. Further, the sequences surrounding the NTSG site were well conserved
across crucian carp, zebrafish and Takifugu, especially on the level of amino acid (Figure
10). The ‘NTSG’ cassette could not be found in other organisms. Thus, the ‘NTSG’
cassette seems to be teleost specific and it is very well conserved between crucian carp
and zebrafish. Like crucian carp, the zebrafish, and many cyprinids, has been found to
cope with relatively severe hypoxic conditions (Rees et al., 2001; Roesner et al., 2006),
and this N-glycosylation site could speculatively play a neuroprotective role in the
adaptation of the NMDAR to life with little or no oxygen.
41

Discussion
Figure 10. Multiple alignments of teleost NMDAR subunit NR1 'NTSG' site related to the box in Figure 5. Sequence names are found to the left. cc = Carassius carassius, dr = Danio rerio, tr = Takifugu rubripes. Sequences for zebrafish and Takifugu were found in public sequence databases. The alignments were prepared using ClustalX. Colouring and translation to amino acids were generated using GeneDoc. (A) Multiple alignment of nucleotides spanning the 'NTSG' site (box) for crucian carp, zebrafish and Takifugu. (B) Multiple alignment of the deduced amino acids spanning the 'NTSG' site (box) for crucian carp, zebrafish and Takifugu. Residues identical to the crucian carp sequence are denoted as dots '.'.
All amino acid differences occurring in ccNR1.1 or drNR1 sequences in Figure 6 are
situated on the surface of the protein structure. They do not seem to affect the glycine
ligand binding pocket.
4.4 Gene Expression in Crucian Carp NMDAR Genes
The NR2 subunit composition of NMDARs changes during development in the vertebrate
brain. In rat, NR2B and NR2D are highly expressed prenatally, while NR2A and NR2C
are first detected near birth (Monyer et al., 1994). Controlling this subunit switch is
clearly important, as different NR2 subunits differ in their sensitivity to Mg2+ block, in
their glycine sensitivity and in their deactivation time.
The real-time RT PCR primers (see Table 4) were used by others at our research group to
measure gene expression levels of NMDAR subunits in crucian carp brain tissue. The
NR2 subunit composition is of particular interest, since it is an important determinant of
42

Discussion
receptor property. This composition is shown in Figure 11, and indicates that crucian carp
brain tissue has a high expression of ccNR2B.1 and ccNR2D.1 (amounting to 48.1 % and
32.4 % of the overall NR2 expression), and a low expression of NR2A.1 and NR2C.1
(amounting to 12.5 % and 7 %). In an experiment measuring mRNA levels of NR1,
NR2A, NR2B, NR2C, NR2D and NR3A in different rat brain regions, NR1 expression
was found to be about 4 times higher than the combined expression of NR2A-D and
NR3A (Goebel and Poosch, 1999). The NR2 data of that experiment was used to
calculate relative NR2 subunit abundances in rat brain (Figure 11). Compared to their
relative expression in the crucian carp brain, rat NR2 subunits seem to display a more
evenly divided expression.
Figure 11. % composition of NMDAR subunit NR2A-D mRNAs in normoxic crucian carp and rat brain. Measurement for crucian carp was performed using real-time RT PCR with primers from Table 4, n=6. Data for rat brain was extracted from Goebel and Poosch (1999).
43
Discussion
The high expression levels of ccNR2B and ccNR2D resembles that seen in the neonatal
rat brain (Monyer et al., 1994). They are relatively diverse in function, whereas NR2B
has a high conductance, a high sensitivity to extracellular Mg2+ and a relatively short
deactivation time, the NR2D has a low conductance, a low sensitivity to extracellular
Mg2+ and an exceptionally long deactivation time (Dingledine et al., 1999). A study
comparing the expression levels of NMDAR subunits in the developing zebrafish nervous
system 24-96 hours after fertilization (Cox et al., 2005), detected high levels of NR2A
and NR2D and somewhat lower levels of NR2B. Hence, that study agrees with the low
levels of NR2C mRNA and the high levels of NR2D mRNA reported in the crucian carp
brain.
Remembering that the crucian carp is a tetraploid organism (Raicu et al., 1981), the
cloning effort of this study probably missed out on more paralogs than it successfully
cloned. Thus, the NR2A-D expression profile presented for crucian carp brain in Figure
11 can only be tentative.
4.5 Phylogenetic Considerations
The crucian carp has proven useful in studying the phenomenon of anoxia tolerance.
What seems to be the major advantage for this fish when experiencing anoxia is the
ability to transform excess lactate into ethanol excreted over the gills (Figure 1), a feature
shared with the goldfish, another species in the genus Carassius. Additional features,
like the general metabolic depression, the large liver glycogen storage and the
upregulation of glycolytic enzymes to run the anaerobic break down of glucose, have
enabled these animals to stay conscious and mobile during months of anoxia (Lutz et al.,
2003).
WGD events have been hypothesized to increase the number of genes in a lineage
(Amores et al., 1998), such as the two WGDs early in vertebrate evolution (Sidow, 1996)
and the WGD occurring in ray-finned fish just after their divergence from tetrapods (1-2-
4-8 hypothesis, Meyer and Schartl, 1999). Two paralogs were detected for the NMDAR
subunits ccNR1, ccNR2A and ccNR2D in crucian carp. These probably origin from a
44
Discussion
recent WGD in their evolutionary lineage (Raicu et al., 1981). This WGD would increase
the number of genes and make diversity even greater. Indeed, four AMPA receptor
subunits have been characterized in mammals (Song and Huganir, 2002), eight have been
found in zebrafish, and so far our research group has cloned 12 different subunits in
crucian carp. This supports a possible 1-2-4-8-16 hypothesis for crucian carp. A similar
scenario must be expected for NMDARs, where a total of four paralogs must be expected
for each subunit in crucian carp. Indeed, in zebrafish two paralogs have been identified
for each of the genes NR1 and NR2A-D (Figure 7 and 8). The phylogenetic trees in
Figure 7 and 8 indicate that these paralogs diverged early in teleost evolution, probably
originating from the WGD common to all ray-finned fish (Meyer and Schartl, 1999). The
increased diversity come about by such duplications might have played an important role
in the evolvement of their anoxia tolerance.
Finally, Figure 9 shows ccNR1.1 and ccNR2A.1-D.1 presented in the same phylogenetic
tree. The shared branching points shown by ccNR2A.1 and ccNR2B.1, and by ccNR2C.1
and ccNR2D.1 reflect the functional relationship between the genes (Dingledine et al.,
1999). The ccNR1.1 branch leaves the tree between ccNR2C.1 and ccNR2D.1, and not
as could have been expected, between ccNR2A.1/ccNR2B.1 and ccNR2C.1/ccNR2D.1.
The latter was seen in a zebrafish study by Cox et al. (2005). While the evolutionary
analyses of the Cox-study were based on full-length sequences, the analyses of this thesis
were based on 500-600 nucleotides. Most likely, the shorter sequences used in this thesis
caused the unexpected divergence. Nevertheless, this region proved useful to separately
outline the phylogeny of the NR1 and NR2 families.
As previously reported, NMDAR subunits were cloned from red-eared sliders using
primers synthesized in this project. These sequences did not always overlap with crucian
carp sequences, and with the exeption of NR2A, they could not be included in the
phylogenetic analyses presented in Figures 7-8.
45

Conclusion
5 Conclusion Crucian carp NMDAR subunit sequences group together with analogous subunits from
other vertebrates. It can therefore be concluded that the obtained sequences are NR1,
NR2A, NR2B, NR2C and NR2D. The identity of the NR3 family protein was found
based on an amino acid BLAST search, and was concluded to be NR3A. Further, two
closely related paralogs of the subunits ccNR1, ccNR2A and ccNR2D were identified.
This provides evidence for the WGD that has been hypothesized to have taken place in
the crucian carp lineage after its divergence from the zebrafish lineage.
The full-length ccNR1 sequence does not display any unique features that could be
expected to give this fish a clear advantage in anoxia. Sequence elements representing
key functions of the NR1 subunit are well conserved. The alternative cassette ‘NTSG’
introduced by crucian carp is found in an unresolved, but active area of the rat NR1
protein, and probably function as a N-glycosylation site. This site is probably
glycosylated in vivo, and may modify NMDAR function, possibly making the receptor
better adapted to anoxic conditions.
NR2 subunit composition in crucian carp brain resembles that of embryonic rat brain,
where NR2B and NR2D are the major subunits.
46

Appendices
Appendices
Appendix I GenBank Accession Numbers for NMDAR Genes Appendix II Reagents, equipment and software Appendix III Sequences
47

Appendices
Appendix I
GenBank Accession Numbers for NMDAR Genes Gene Organism GenBank Accession Number NR1 Human (Homo sapiens) NM_000832 NR1 Mouse (Mus musculus) BC039157 NR1 Rat (Rattus norvegicus) U08268 NR1 (C1 and C3) b Duck (Anas platyrhynchus) D83352 NR1 (C1 and C3) b Chicken (Gallus gallus) NM_206979 NR1 African clawed frog (Xenopus laevis) X94156 NR1 (C1’ and C1’’)a Knifefish (Apteronotus leptorhynchus) AF060557 NR1, variant 1 Tetraodon (Tetraodon nigroviridis) c
NR1, variant 2 Tetraodon c
NR1, variant 1 (C1’) a Zebrafish (Danio rerio) c NR1, variant 2 Zebrafish c
NR2A Human NM_000833 NR2A Mouse NM_008170 NR2A Rat NM_012573 NR2A Takifugu (Takifugu rubripes) d NR2A variant 1 Zebrafish c NR2A variant 2 Zebrafish XM_686662 NR2B Human NM_000834 NR2B Mouse NM_008171 NR2B Rat NM_012574 NR2B Knifefish AY166701 NR2B Takifugu d NR2B variant 1 Zebrafish XM_683366 NR2B variant 2 Zebrafish XR_030014 NR2C Human NM_000835 NR2C Mouse D10694 NR2C Rat NM_012575 NR2C Tetraodon CAG02237 NR2C variant 1 Zebrafish c NR2C variant 2 Zebrafish c NR2D Human NM_000836 NR2D Mouse NM_008172 NR2D Rat NM_022797 NR2D Takifugu d NR2D variant 1 Zebrafish XM_691632 NR2D variant 2 Zebrafish XM_001334685 NR3A Human AF416558 NR3A Mouse AK044171 NR3A Rat AF073379 NR3B Human NM_138690 NR3B Mouse AF396649 NR3B Rat NM_133308 a For more information on the fish specific C-terminal spleice cassettes C1’ and C1’’, see (Bottai et al., 1998) b The avian ‘C3’ splice cassette is called the ‘C-terminal variant’ in (Kurosawa et al., 1994). c Gene found by performing BLAST search on Ensembl. The genomic sequences found there, were then scanned by GENSCAN to get the exons comprising the gene. d Gene found by performing BLAST search on the FUGU server
48

Appendices
Appendix II
Reagents, equipment and software
Reagents
Laboratory kit Kit Name Manufacturer
BD Advantage™ 2 PCR Kit, 639206 BD Biosciences Clontech
GeneRacer™ Core Kit, L1502-01, Version J Invitrogen
Genoprep Direct mRNA kit, G316.200 GenoVision
p-GEM®-T Easy Vector Systems, TM042 Promega
Taq Polymerase Kit, 10966-034 Invitrogen
Wizard Plus SV Minipreps DNA Purification
System, TB225
Promega
Chemicals Product, catalog number Manufacturer
Agarose, SeaKem®, 50004 Cambrex
Ampicillin (D[-]-α-Aminobenzylpenicillin),
A-9518
Sigma
DEPC (dietyl pyrokarbonat), SD5758 Sigma
DNaseI, D-5307, with 10x Reaction Buffer,
R6273
Sigma
dNTP-mix, 10297-018 Invitrogen
Electro competent bacteria E. coli DH5α
strain
Invitrogen
Etidium Bromide, 443922U BDH-Electron
SOC medium, 15544-034 Invitrogen
Superscript II Reverse Transcriptase, 18080-
(085)
Invitrogen
49

Appendices
Equipment Product, catalog number / model Manufacturer
Duall glass homogenizer Kontes
Electroporation cuvette, BTX-610 GeneIronics Inc.
Gene Pulser™ Electroporation machine BioRad
Eppendorf centrifuge, 5417R Eppendorf
Finnpipettes, 0,5-10 µl, U23386; 2-20 µl,
T27033; 20-200 µl, T27388; 100-1000 µl,
T28301
Thermo Labsystems
Mastercycler gradient, 5331 Eppendorf
Spectrophotometer, GeneQuant pro Amersham Pharmacia Biotech
50

Appendices
Software Software, version URL/author BioEdit Sequence Alignment Editor, 7.0.5.3 http://www.mbio.ncsu.edu/BioEdit/page2.html
© 1997-2005 by Tom Hall BLAST (Basic Local Alignment Search Tool) http://www.ncbi.nlm.nih.gov/BLAST/ClustalX, 1.83, April 2003 ftp://ftp-igbmc.u-strasbg.fr/pub/ClustalX/DeepView/Swiss-PdbViewer, v3.7 http://au.expasy.org/spdbv/ © 1995-2001 by
Nicolas Guex, Manuel Peitsch, Torsten Schwede and Alexandre Diemand.
GeneDoc Multiple Sequence Alignment Editor & Shading Utility, 2.6.002
http://www.nrbsc.org/gfx/genedoc/index.html© 2000 by Karl Nicholas
GENSCAN http://genes.mit.edu/GENSCAN.html© 1997-2005 Christopher Burge
LightCycler Probe Design Software, version 1.0 Roche Diagnostics NetPhos, version 2.0 http://www.cbs.dtu.dk/services/NetPhos/
Center for Biological Sequence Analysis, Technical University of Denmark
NetPhosK Server, version 1.0 http://www.cbs.dtu.dk/services/NetPhosK/ Center for Biological Sequence Analysis, Technical University of Denmark
Phylip, (Phylogeny Inference Package) version 3.6
http://bioweb.pasteur.fr/seqanal/phylogeny/phylip-uk.html © 1986-2004 University of Washington by Joe Felsenstein
Primer3 (Primer Design Software) http://frodo.wi.mit.edu/cgi-bin/primer3/primer3_www.cgi© 2004 Whitehead Institute for Biomedical Research by Steve Rozen and Helen Skaletsky
Prosite server, release 20.13 http://expasy.org/prosite/ ExPASy Proteomics Server, Swiss Institute of Bioinformatics
SignalP, version 3.0 (Improved prediction of signal peptides)
http://www.cbs.dtu.dk/services/SignalP/ Center for Biological Sequence Analysis, Technical University of Denmark
TMHMM Server, version 2.0 http://www.cbs.dtu.dk/services/TMHMM-2.0/ Center for Biological Sequence Analysis, Technical University of Denmark
TreeView, 1.6.6 http://taxonomy.zoology.gla.ac.uk/rod/treeview.html© 1997 by Roderic D. M. Page
51

Appendices
Appendix III
Crucian carp sequences
ccNR1 protein sequence deduced from the mRNA, 905 amino acids MRLLLLAALFSCSCVRGGCEPKIVNIGAVLSQKRYEQVFKDAVAQANQVYGRD
KFKLTAISVTHKANAIQMALSVCEDLISSQVYAILVSHPPQSTDHLTPTPVSYTAG
FYRIPVVGLTTRMSIYSDKSIHLSFLRTVPPYSHQAHVWFDMMREFRWNHIILIVS
DDHEGRAAQKRLETLLEERETKNKKRNYENQDQLSFDNKRGPKAEKVLQFNQE
TNLTALLLEAKELEARVIILSASEEDAAAVYKTARFLNMTGSGYVWLVGEREMS
GKALSEAPDGLIGLQLINGKNESAHISDAVAVVAQSIQELFEKENITEPPRGCVGN
TNIWKTGPLFKRVLMSSKYPEGLTGRVEFNDDGDRKYAHYSILNYQKSRLLQVG
IYNGTQVVMNKQKKIIWPGGETERPRGFQMSTRLKIVTIHQEPFVYVKPTMLDGT
CKEEYTPNGVLIKKVICTGPNETIPGNTSGRPTVPQCCYGFCVDLLIKLAMTMNFT
YEVHLVADGKFGTQERVNNSNKKEWNGMMGELLGGLADMIVAPLTINNERAQ
YIEFSKPFKYQGLTILVKKEIPRSTLDSFMQPFQSTLWLLVGLSVHVVAVMLYLL
DRFSPFGRFKVNSEEEEEDALTLSSAMWFSWGVLLNSGIGEGAPRSFSARILGMV
WAGFAMIIVASYTANLAAFLVLDRPEERITGINDPMLRNPSDKFIYATVKQSSVDI
YFRRQVELSTMYRHMEKHNYESAAEAIQAVRDNKLHAFIWDSAVLEFEASQKC
DLVTTGGLFFRSGFGIGMRKDSPWKQNVSLAILSSHENGFMEDLDKTWVRYQEC
DSMSNAPATLTFENMAGVFMLVAGGIAAGIFLIFIEIAYKRHKDARGKQMQLAF
AAVNVWRKNLQQFPPTDITGQLNLSDPSVSTVV
ccNR1 mRNA, 4955 bp – CDS from bp 335-3049 marked in blue and real-time RT PCR product highlighted in red GAGACGCATCACTGATTTTCTGCTGCCAGCTTTCATGCAATATGCGACTTCCT
TGCTCTGCCTGTCTGCAGCCTGACTTAACAGTGGGAATTAAGAGAAAGGCTG
CAGTGAATGCCGCTTCTCTCAGATGCCATCGCCTAGTTGAACCGGGCACCATG
AACAAATCGCCGCAGTGTGTGTGAATTTCGTACCTGGGATATTTTTAAAGTCT
AAAACTGCCACACTGGACATTGCTTTCATTCTTAACAAGCGAATAGCTCAAA
CAAGAGCCTCCGGCAGCACTAAGAAGGGAGGTCACTGGCACTCTCCGTGCGC
TCTTCTGGCCCTCCACACGATGCGTCTGCTTCTGCTGGCCGCGTTGTTCTCCTG
52
Appendices
CTCCTGCGTGCGGGGCGGCTGCGAGCCCAAGATTGTGAACATCGGGGCCGTC
CTGAGCCAGAAGAGATACGAGCAGGTGTTCAAGGATGCGGTCGCTCAGGCG
AACCAAGTGTACGGAAGGGATAAATTCAAGTTGACCGCCATCTCTGTCACTC
ACAAAGCTAATGCGATTCAGATGGCACTGTCTGTGTGTGAGGATCTCATTTCC
AGTCAGGTGTATGCCATCCTGGTGAGCCATCCACCACAGTCCACTGACCATCT
GACGCCCACTCCGGTCTCCTACACCGCAGGGTTTTACCGAATACCTGTAGTAG
GGCTTACCACCAGGATGTCCATTTACTCAGACAAGAGCATCCATCTCTCATTC
CTCCGCACAGTGCCACCCTATTCCCACCAGGCACATGTGTGGTTTGACATGAT
GCGGGAGTTCCGCTGGAATCACATCATCCTAATCGTCAGCGATGACCATGAA
GGCAGAGCGGCACAAAAAAGACTAGAAACCCTTCTGGAGGAGAGAGAGACC
AAGAATAAAAAAAGGAACTATGAAAACCAAGACCAACTGTCCTTTGACAAC
AAGAGAGGACCTAAGGCCGAGAAAGTGCTTCAATTCAACCAAGAGACTAAC
TTAACTGCCCTGCTTCTGGAGGCCAAAGAGCTGGAGGCCCGAGTGATCATTC
TCTCTGCCAGTGAGGAAGATGCAGCCGCCGTGTACAAAACAGCACGCTTCCT
CAACATGACAGGCTCAGGCTATGTATGGCTGGTCGGGGAGCGTGAGATGTCC
GGTAAAGCTTTGAGCGAGGCCCCTGATGGGCTGATTGGCCTCCAGCTCATCA
ATGGCAAGAATGAATCGGCGCACATCAGTGATGCCGTTGCTGTCGTAGCCCA
GTCCATCCAAGAGCTCTTTGAGAAAGAGAACATCACAGAACCTCCAAGGGGC
TGCGTGGGCAATACCAACATCTGGAAGACCGGGCCACTTTTTAAAAGGGTAC
TGATGTCTTCCAAGTACCCAGAGGGCCTAACAGGACGCGTTGAGTTCAATGA
TGACGGTGACAGAAAATATGCTCATTACAGCATTCTCAACTACCAGAAGAGC
AGACTGCTTCAAGTCGGCATTTACAATGGAACACAAGTGGTGATGAATAAAC
AGAAGAAGATTATTTGGCCTGGAGGTGAAACAGAAAGACCGAGAGGATTCC
AGATGTCTACTCGATTAAAGATAGTGACCATTCATCAGGAACCCTTTGTGTAT
GTGAAGCCAACTATGCTGGACGGGACCTGCAAGGAAGAGTACACACCTAATG
GAGTCTTAATTAAAAAGGTGATCTGCACTGGACCAAATGAGACCATCCCAGG
TAACACATCAGGACGCCCAACTGTTCCACAATGTTGCTATGGATTTTGCGTTG
ACCTTCTGATCAAATTGGCAATGACCATGAACTTCACCTATGAAGTACACCTG
GTGGCAGATGGGAAATTCGGAACACAAGAAAGGGTAAATAACAGTAACAAG
AAGGAATGGAACGGTATGATGGGTGAGCTCCTGGGTGGCCTTGCTGATATGA
TCGTTGCACCCTTGACAATCAACAATGAACGAGCCCAGTATATAGAATTCTCC
53

Appendices
AAGCCTTTCAAATACCAGGGACTAACTATCCTTGTGAAAAAGGAAATTCCTC
GCAGTACACTGGACTCATTCATGCAGCCATTCCAAAGTACACTGTGGCTACTG
GTGGGTTTGTCGGTACATGTGGTGGCGGTGATGCTTTACCTACTAGACCGGTT
CAGCCCTTTTGGAAGGTTTAAAGTAAACAGTGAAGAAGAAGAGGAGGATGC
CCTCACCTTATCTTCAGCTATGTGGTTTTCCTGGGGTGTCTTGTTGAACTCTGG
AATTGGAGAAGGTGCCCCACGTAGTTTTTCAGCAAGAATTTTGGGAATGGTG
TGGGCTGGCTTTGCTATGATTATAGTAGCATCCTATACTGCCAACCTGGCTGC
CTTCCTGGTGTTGGACCGGCCTGAGGAGCGCATCACCGGCATCAATGACCCA
ATGCTAAGGAACCCATCAGACAAGTTCATCTATGCCACAGTGAAGCAAAGTT
CAGTGGATATTTACTTCCGGCGACAAGTTGAGCTGAGCACCATGTACCGCCA
CATGGAGAAGCACAACTACGAAAGCGCCGCTGAAGCCATCCAGGCTGTCCGG
GACAACAAGCTGCATGCTTTCATCTGGGACTCTGCGGTGCTGGAGTTTGAAG
CCTCGCAGAAGTGCGACCTGGTGACCACGGGAGGGCTGTTTTTCCGTTCGGG
CTTTGGCATAGGCATGCGCAAGGACAGCCCCTGGAAACAGAATGTGTCCCTG
GCTATTCTCAGTTCCCATGAGAATGGCTTCATGGAGGACCTAGATAAAACCT
GGGTGAGATACCAGGAGTGTGACTCAATGAGCAATGCCCCAGCCACACTCAC
CTTTGAGAATATGGCAGGTGTCTTCATGCTAGTTGCTGGAGGCATTGCAGCAG
GAATCTTCCTCATCTTCATTGAGATTGCATATAAGCGCCATAAAGACGCCCGC
GGGAAGCAGATGCAGCTAGCCTTTGCGGCCGTCAACGTTTGGAGGAAGAACC
TACAGCAATTCCCACCCACAGACATTACGGGCCAACTCAACTTGTCCGACCC
GTCTGTCAGCACGGTGGTGTGAGGCAGAGAAAGAGGGAGAGTTTAACATAA
AGACAGGCTCATTCTTTAGAGACAAACAAGATGGAACTAGAGAGGAGCATTG
TAGAACCAATCATCTGGACGATGGATCCATCATGGACGAGAACTACTGAGCC
ATTTCACCTTTATGAAGAGCCAGTGGAACCTGTTGGGACTTGATGGTGGACG
GCAGGGGATAGCATGCACTGGAGCACTGCGAACACACAAACCATATAAACA
CATAAACACATACACCTTCATAGCTTGATGCTAAAATAGTATACACTATCATT
CCATCCACCAGAACAACTTCTGAATTAATAATTTATGATTATGTAGAAATATT
TCTTATTAGTATTATCCAAGTACTTATTCTTATGTTGATTAAGTGGTTTAAGTA
TTGTACAGTATAATTTAGAACAAAGAACAAAACTTTTACATGTCTCAAGGCC
AATTCTAAGGCCAGTATTTAGAGAATTAACTAGTTGTATAAGATTAATTATAG
TCATCATTTATATATGATATTTATCTTCTATACATTTTTTATTGTTTTACTTGCT
54
Appendices
TTCTGTTCATTGTTTTTCATTCTTTGTCTATATGATCTATAAAGCGAAAAGTCA
GCCAGTCAAGCACATTATCTGCGCTATTTCAATTATCATTATCTTTCATATTCT
AAAATCTCTTTACATATAATATGCATGCAAATTTGTCCCTGAAAGTTTAAGGA
CAAGAAAAAGTATACAGTTAAAATGTTTGATTTAAGATGTGGCTTACTGTAC
ATCAGTTAATTGCAAACTCTCCTTCAAACTCAACTGTTCTTCCTCTTTAAAGTT
CTGACCCAGTCGTTCTCAACTTCAGTCTGAAGGGTGCATCAAGGGGCCGAGT
TTTTTCATCCAACTAGCACTTGGTGTCTCATGCAAAATCATCTCTGTGTGTCGT
CCCCACAGACAACCTCAGAGACCTTTTGCATGAGAAAACCCCAAGTGTGCCC
ATTTATTTTTGACATTGGTGCTGTAGTTTCGTATACACCTATTAGTTGGATGGA
AAAAACTTGCCCGTTCCCAAGTTCTGGGGTTGAGAATCATAAATAAAAGCTG
TACAAATAAGGACTGCTTACTGTAAATGTTCATTTAATGCTATTTATATGACC
CATGGAAAATCCCCTATAAGTGTGATCACCTATAGCACTTTAATGTGAATCTG
TCGGAAGCTATATGCATATGGAAATTATGCAATTTGCCAAATGGTTGATTGTA
ATACTCATACTTGATATGAAAATGCACATTTGAGAATGCGAAATATATTATAT
GTTAATGTCAGCCGTTTGTTTTTTAACAAAACACTCCTTTTGTAGTTTTCTTAT
TTCAAAAGATTTAGACATATTTGTTTCTGATATATATTAGAGTTAAACTGTGT
CAAATTAGTGCATACCACATATATCTTCAGTTTACTACTATTAAGTTACACTA
CTTTAGGTTTTAGTCTTTTAAAACTGACAGGTGTACAGTATGTTTTTTCTCATT
GCTTGAGTCAATGAATGTGGTTTGTACTTAAGAAGAACTATGTATTATATCTG
ATTTCAGGGC-
ATGTAAACACTGAATTCAGTTTATGTTGCCTGGACTGCTAGATTGCAGATGAC
TAAGATGTTGANNNNNNNNNAGGAGTGTTTTTATGAGAAACTGTCACACTGT
TAATACCACACAAACACAATCGGATAAATTACATCACATACAGTAACACACA
TATCCTGAGCATATCCTAAGTGTTACATCATGTTTCAGTTAATTTTAGATATTT
CTCCAAATGAACAAATGTTTGCATTTTGAGAAAAATATATAGAAATAACATT
TATGTTTGCCAATAAATTTGTGCCATGTAAGTTACATACAACAAAAAAAAAA
AAAAAAAAAAAA
ccNR2A, EST, 757 bp, real-time RT PCR product highlighted in red ACGACTGGCACATCTTCTCGGTGGTCACCACCAAGTTCCCAGGTTTCCAGGAG
TTCATAGCCACCATTCGCGTCACGGTGGACCACAGCTTCATTCGTTGGGACCT
55

Appendices
TCAGAGCGTAGTGACGCTGGATGGCGTTGGCGAACCTGAGGACCGTGCCCAC
GTGCAGCTTAAACGCATCCAGTCACCCGTCATCCTCCTCTACTGCTCCAAGGA
CGAAGCGGCATTGGTTATGGAGGAAGCCCGTTCACTAGGGCTCACCGGGGCT
GGCTTTGTGTGGATTGTTCCTGGTCTGACGACAGGAAATCTTGAACAAATCCC
AGAAGCCTTTCCGACTGGGATGATATCTGTGGTGTACGACGAATGGGATTAT
CCCCTGGAGACGCGTGTGCACGACGCTGTGGGAATTATCAGTTCTGCAGCCG
CTGCCATGTTCAGAGAGGAAGGTCGGATACCTGATGGAACGGCTAGCTGCCA
CAGCCAATCAGAGAAGCCGGAAGTGCCGCCAAGTGCTCTGCGAAGATATATG
ATGGGAGTCAGTCTAGGAGGTAGAGATTATTCATTCATGGACGATGGCTACC
AAGTCAATCCCAAGCTGGTCGTCATTGTTCTGAACACACAGAGGGAATGGGA
GAAGATGGGACGATGGGAAAACCACACGTTGAAGTTGAAGTTTCCAGTTTGG
CCACGTTATAACTCATTTGGGGACATGGACGCTGATGAGAACCACTTGAGCA
TTGTGACTCTAGAGGAAAGACCCTT
ccNR2B, EST, 968 bp, real-time RT PCR product highlighted in red AAGAAGCTGCAGAGCCCCGTCATCCTGCTCTACTCCACCAAAGAGGAGGCCA
ACATCATCTTCCAGGTGGCACACTCTGTGGGCCTGACGGGCTACGGCTACAC
CTGGATCGCCCCGTCTCTGGTGGCAGGAGACGCCGACCACATCCCGGCCGAG
TTCCCCACAGGCATGATCTCAGTGTCGTACGACGAGTGGGATTACGGTCTGG
AGGCACGCGTTCGTGACGGTGTGGCTGTGATCGCCTCGGCCACCTCCACCAT
GATGATAGAACGAGGGCCACACACACTGCTCAAGTCTGAGTGCCACGGGGCC
CCGGACAAGAAGAGCCCCATCAGCAACGAGGTGCTCAGGTATCTGATGAACG
TGACGTTCGAGGGCCGGAATCTCTCCTTCAGTGAGGACGGCTATCAGATGCA
CCCCAAACTGGTGATCATCCTGCTGAACAAGGACAGACAGTGGGACAGAGTG
GGTAAGTGGGAGAACGGCTCTCTGTCGATGAAGTTTCACGTGTGGCCGCGGT
TCGAGCTCTACTCTGGGACGGAGAGCCGAGAGGACGATCATCTGTCCATCGT
GACGCTGGAGGAGGCTCCGTTCGTGATGGTGGAGGACGTGGATCCACTCAGC
GGCACCTGCATGAGGAACACGGTTCCCTGCCGCAAGCAGCTCAAAACACTGA
ATAAGACGGGGGATTCTGGCATCTACATCAAGCGCTGCTGTAAAGGCTTCTG
TATCGACATCCTGAAGAAGATCGCCAAGTCTGTGAAGTTCACCTACGACCTTT
ATCTGGTCACCAATGGCAAACACGGCAAGAAGATCAACGGCACATGGAATG
56
Appendices
GGATGGTGGGAGAGGTGGTGCTGAAGAACGCTCACATGGCTGTTGGCTCGCT
GACCATCAATGAGGAGAGGTCAGAGGTCATTGATTTCTCCGTGCCCTTCATA
GAGACAGGCATCAGTGTTATGGTGTCTCGCAG
ccNR2C, EST, 788 bp, real-time RT PCR product highlighted in red GTACAACTGGGGCAACTTTGTGGTGATCACCAGCTTGTATCCCGGCTACGAG
ACCTTCTTGGACTACATCCGCTCCTTCACAGACACCAGCTACTTCCTGTGGGA
GCTGCGGGATGTGCTGAGCTTTGAGATGTCTGTGGGGGCCAATGACATCCGC
ACAAGAAGACTACTACAGCAGGTGGACTCGCAGGTATACCTAGTGTACTGTT
CCCATGAGGAGGCACAGTACTTGTTCAGGATGGCCTCTGATGTGGGGCTTCT
AGGGCCCGGATACATCTGGGTCATCCCCAGCCTGGCTGTGGGGAACCCTGAA
GTGTCCCCTCCTGACAGTTTCCCTGTGGGCGTCATCAGTATTATCACAGACCG
CTGGAGGAAAACACTGCGCCAGAGGGTTCGGGAAGGAGTCGCAGTCATAGT
AAAAGGGGTGCACAGCTTTTATAAGAACAGAGGATTCATTCCCGATGGTCAC
AGTGACTGCAATAGTCCTGTCAAATCGTACGCCAACAATTCTCTCTTCAGGCA
TATGCTAAATGTGTCATGGGAGCATAAGGACCTCTCCTTCAACACTGATGGCT
ATCTCACCAATCCTTCCATGGTGATCATTGCTTTGGATCGAGAGAGACACTGG
GACAAGGTAGGAAGCTACGAGGGAGGGATTCTGCAGATGCGATACCCTGTAT
GGCCCCGTTACGGCAGCTTCCTGGAGCCCGTGTCTGACAACCGGCACCTGAC
TGTGGCCACGCTGGAGGAGAGGCCTTTTGTCATCGTAGAGAGTGTTGATCCT
GCCA
ccNR2D, EST, 1132 bp, real-time RT PCR product highlighted in red TTGAGGTGCTGGAGGAGTACGATTGGACGGCCTTCTCGGTGGTGTCCACACG
TCACCATGGCTACCAGGACTTCCTGTCAGTAGTGGAAGGTTTGACCGACGGG
TCATTCATCGGCTGGGAGAAGAAGAGCGTAGTGATGTTGAATTTAACCGATG
ACCCAGGAGGAGCACGTGCACGACGGCTACTGAAAGAGAATGAAGCACAGG
TGCGGTTGTTGTACTGCTCTCAAGAGGAAGCAGAACAGGTGTTCCACGCTGC
TTGGGCAGCTGGTCAGGCCAGTGCCTCTCACATATGGTTCGCGGTGGGTCCG
GCTCTGTCAGAGCTGGGCCTGACCGGACTTCCCAATCGACTGTTTGCGGTCAG
ACCGCAGGGCTGGAGGGACGAACCCCGCCGTCGTATCGCCCGTGGGGTGTCC
ATCCTTACCCATGGAGCGGTCGCGTTGCGGAAAGACTATGGAGCCACTGGAG
57

Appendices
GCCCTCACTTTGTCACTAACTGCCAGACAGAAGGCAACGGAACACAGAGGAT
TCGCGGTAGAATGAAGTATTTCAGTAACATCACACTCGGTGGGCGGGACTAT
TCGTTCAATAATGAGGGCTACCTGGCCAACCCCTTTCTGGATGTCATCTCCTA
CACGTCTGGGAGTGGCTGGGAAGACGTGGGATGGTGGGAGAACGGGGTGTT
ACGTCTGAGGTATCCTGCTTGGTCTAGATATAGCCCCTTCCTGCAGCCGCCCG
ATGATGCTCAGCACCTGAGGGTCGTGACCCTGGAGGAGCGGNCCTTCGTTAT
CGTGGAGCTAGCAGACCCTTCCTCTGGAACCTGCATTAGGGACTCCGTGCCAT
GCAGACGGCCTCTCAATGCCAGTGCACTTCAAGAAGGGGTGGCACCTATGAA
ACAGTGCTGCAAAGGATTCTGCATCGACATCCTTAAGCGACTGGCCAGAATT
GTCGGCTTTACCTATGACCTCTACTTGGTGACCAATGGGAAACATGGAAAAA
AGATTGATGGAGTTTGGAACGGGATGGTGGGAGAGGTTGTGTACAAGCGGGC
AGACATGGCGATCGGCTCTCTCACTATCAACGAGGAGAGGTCAGAGGTCGTG
GACTTCTCTGTGCCCTTTGTGGAGACAGGCATCAGCGTT
ccNR3A, EST, 283 bp, real-time RT PCR product highlighted in red TGTACATAGTTGGGGACGGGAAATATGGAGCTGTCAAGGGTGGACAGTGGAC
AGGGTTGGTGGGTGACCTGCTGAGCGGGGTGGCCGATATGGCTGTTACCAGC
TTCAGCATCAATTCAGCTCGCAGTAAAGTGATTGACTTCACCAGCCCGTTCTT
TTCCACGAGTTTGGGCATACTTGTGCGCAGTAAGGACACGGCGGCACCAATC
GGAGCGTTCATGTGGCCGTTGCACTGGTCCATGTGGATGGGCATCTTTGTGGC
GCTGCACATCACAGCGCTCTT
58

References
References Al-Hallaq, R. A., Jarabek, B. R., Fu, Z., Vicini, S., Wolfe, B. B. and Yasuda, R. P. (2002). Association of NR3A with the N-methyl-D-aspartate receptor NR1 and NR2 subunits. Mol Pharmacol 62, 1119-27. Amores, A., Force, A., Yan, Y. L., Joly, L., Amemiya, C., Fritz, A., Ho, R. K., Langeland, J., Prince, V., Wang, Y. L. et al. (1998). Zebrafish hox clusters and vertebrate genome evolution. Science 282, 1711-4. Andersson, O., Stenqvist, A., Attersand, A. and von Euler, G. (2001). Nucleotide sequence, genomic organization, and chromosomal localization of genes encoding the human NMDA receptor subunits NR3A and NR3B. Genomics 78, 178-84. Bickler, P. E., Donohoe, P. H. and Buck, L. T. (2000). Hypoxia-induced silencing of NMDA receptors in turtle neurons. J Neurosci 20, 3522-8. Bottai, D., Maler, L. and Dunn, R. J. (1998). Alternative RNA splicing of the NMDA receptor NR1 mRNA in the neurons of the teleost electrosensory system. J Neurosci 18, 5191-202. Buck, L. T. and Bickler, P. E. (1998). Adenosine and anoxia reduce N-methyl-D-aspartate receptor open probability in turtle cerebrocortex. J Exp Biol 201 ( Pt 2), 289-97. Chatterton, J. E., Awobuluyi, M., Premkumar, L. S., Takahashi, H., Talantova, M., Shin, Y., Cui, J., Tu, S., Sevarino, K. A., Nakanishi, N. et al. (2002). Excitatory glycine receptors containing the NR3 family of NMDA receptor subunits. Nature 415, 793-8. Chazot, P. L. and Stephenson, F. A. (1997). Biochemical evidence for the existence of a pool of unassembled C2 exon-containing NR1 subunits of the mammalian forebrain NMDA receptor. J Neurochem 68, 507-16. Chen, P. E. and Wyllie, D. J. (2006). Pharmacological insights obtained from structure-function studies of ionotropic glutamate receptors. Br J Pharmacol 147, 839-53. Ciabarra, A. M., Sullivan, J. M., Gahn, L. G., Pecht, G., Heinemann, S. and Sevarino, K. A. (1995). Cloning and characterization of chi-1: a developmentally regulated member of a novel class of the ionotropic glutamate receptor family. J Neurosci 15, 6498-508. Conn, P. J. and Pin, J. P. (1997). Pharmacology and functions of metabotropic glutamate receptors. Annu Rev Pharmacol Toxicol 37, 205-37. Cox, J. A., Kucenas, S. and Voigt, M. M. (2005). Molecular characterization and embryonic expression of the family of N-methyl-D-aspartate receptor subunit genes in the zebrafish. Developmental Dynamics 234, 756-766. Cull-Candy, S., Brickley, S. and Farrant, M. (2001). NMDA receptor subunits: diversity, development and disease. Curr Opin Neurobiol 11, 327-35. Cull-Candy, S. G. and Leszkiewicz, D. N. (2004). Role of distinct NMDA receptor subtypes at central synapses. Sci STKE 2004, re16. Curtis, D. R., Phillis, J. W. and Watkins, J. C. (1959). Chemical excitation of spinal neurones. Nature 183, 611-2. Dingledine, R., Borges, K., Bowie, D. and Traynelis, S. F. (1999). The glutamate receptor ion channels. Pharmacol Rev 51, 7-61.
59
References
Don, R. H., Cox, P. T., Wainwright, B. J., Baker, K. and Mattick, J. S. (1991). Touchdown Pcr to Circumvent Spurious Priming During Gene Amplification. Nucleic Acids Res 19, 4008-4008. Ehlers, M. D., Zhang, S., Bernhadt, J. P. and Huganir, R. L. (1996). Inactivation of NMDA receptors by direct interaction of calmodulin with the NR1 subunit. Cell 84, 745-55. Force, A., Lynch, M., Pickett, F. B., Amores, A., Yan, Y. L. and Postlethwait, J. (1999). Preservation of duplicate genes by complementary, degenerative mutations. Genetics 151, 1531-45. Furukawa, H. and Gouaux, E. (2003). Mechanisms of activation, inhibition and specificity: crystal structures of the NMDA receptor NR1 ligand-binding core. Embo J 22, 2873-85. Goebel, D. J. and Poosch, M. S. (1999). NMDA receptor subunit gene expression in the rat brain: a quantitative analysis of endogenous mRNA levels of NR1Com, NR2A, NR2B, NR2C, NR2D and NR3A. Brain Res Mol Brain Res 69, 164-70. Hall, T. A. (1999). BioEdit: a user-friendly biological sequence alignment editor and analysis program for Windows 95/98/NT. Nucl. Acids. Symp. Ser. 41, 95-98. Hollmann, M. and Heinemann, S. (1994). Cloned glutamate receptors. Annu Rev Neurosci 17, 31-108. Hyvärinen, H., Holopainen, I. J. and Piironen, J. (1985). Anaerobic wintering of crucian carp (Carassius carassius L.) - 1. Annual dynamics of glycogen reserves in nature. Comp Biochem Physiol A 82A, 797-803. Ikeda, K., Nagasawa, M., Mori, H., Araki, K., Sakimura, K., Watanabe, M., Inoue, Y. and Mishina, M. (1992). Cloning and expression of the epsilon 4 subunit of the NMDA receptor channel. FEBS Lett 313, 34-8. Ishii, T., Moriyoshi, K., Sugihara, H., Sakurada, K., Kadotani, H., Yokoi, M., Akazawa, C., Shigemoto, R., Mizuno, N., Masu, M. et al. (1993). Molecular characterization of the family of the N-methyl-D-aspartate receptor subunits. J Biol Chem 268, 2836-43. Jackson, D. C. (2000). How a Turtle's Shell Helps It Survive Prolonged Anoxic Acidosis. News Physiol Sci 15, 181-185. Johansson, D., Nilsson, G. E. and Doving, K. B. (1997). Anoxic depression of light-evoked potentials in retina and optic tectum of crucian carp. Neurosci Lett 237, 73-6. Johnston, I. A. and Bernard, L. M. (1983). Utilization of the ethanol pathway in carp following exposure to anoxia. J Exp Biol 104, 73-78. Kornau, H. C., Schenker, L. T., Kennedy, M. B. and Seeburg, P. H. (1995). Domain Interaction between Nmda Receptor Subunits and the Postsynaptic Density Protein Psd-95. Science 269, 1737-1740. Kurosawa, N., Kondo, K., Kimura, N., Ikeda, T. and Tsukada, Y. (1994). Molecular cloning and characterization of avian N-methyl-D-aspartate receptor type 1 (NMDA-R1) gene. Neurochem Res 19, 575-80. Kutsuwada, T., Kashiwabuchi, N., Mori, H., Sakimura, K., Kushiya, E., Araki, K., Meguro, H., Masaki, H., Kumanishi, T., Arakawa, M. et al. (1992). Molecular diversity of the NMDA receptor channel. Nature 358, 36-41.
60

References
Leggatt, R. A. and Iwama, G. K. (2003). Occurrence of polyploidy in the fishes. Reviews in Fish Biology and Fisheries 13, 237-246. Lipton, P. (1999). Ischemic cell death in brain neurons. Physiol Rev 79, 1431-568. Lutz, P. L., Nilsson, G. E. and Prentice, H. (2003). The Brain Without Oxygen: Causes of Failure - Molecular and Physiological Mechanisms for Survival. Dordrecht, The Netherlands: Kluwer Academic Publishers. McBain, C. J. and Mayer, M. L. (1994). N-methyl-D-aspartic acid receptor structure and function. Physiol Rev 74, 723-60. McFeeters, R. L. and Oswald, R. E. (2004). Emerging structural explanations of ionotropic glutamate receptor function. Faseb J 18, 428-38. Meguro, H., Mori, H., Araki, K., Kushiya, E., Kutsuwada, T., Yamazaki, M., Kumanishi, T., Arakawa, M., Sakimura, K. and Mishina, M. (1992). Functional characterization of a heteromeric NMDA receptor channel expressed from cloned cDNAs. Nature 357, 70-4. Meyer, A. and Schartl, M. (1999). Gene and genome duplications in vertebrates: the one-to-four (-to-eight in fish) rule and the evolution of novel gene functions. Curr Opin Cell Biol 11, 699-704. Monyer, H., Burnashev, N., Laurie, D. J., Sakmann, B. and Seeburg, P. H. (1994). Developmental and regional expression in the rat brain and functional properties of four NMDA receptors. Neuron 12, 529-40. Monyer, H., Sprengel, R., Schoepfer, R., Herb, A., Higuchi, M., Lomeli, H., Burnashev, N., Sakmann, B. and Seeburg, P. H. (1992). Heteromeric NMDA receptors: molecular and functional distinction of subtypes. Science 256, 1217-21. Moriyoshi, K., Masu, M., Ishii, T., Shigemoto, R., Mizuno, N. and Nakanishi, S. (1991). Molecular cloning and characterization of the rat NMDA receptor. Nature 354, 31-7. Nicholas, K. B. and Nicholas, H. B. J. (1997). GeneDoc: a tool for editing and annotating multiple sequence alignments. Nicoll, R. A. (2003). Expression mechanisms underlying long-term potentiation: a postsynaptic view. Philos Trans R Soc Lond B Biol Sci 358, 721-6. Nilsson, G. E. (1990). Long-term anoxia in crucian carp: changes in the levels of amino acid and monoamine neurotransmitters in the brain, catecholamines in chromaffin tissue, and liver glycogen. J Exp Biol 150, 295-320. Nilsson, G. E. and Renshaw, G. M. (2004). Hypoxic survival strategies in two fishes: extreme anoxia tolerance in the North European crucian carp and natural hypoxic preconditioning in a coral-reef shark. J Exp Biol 207, 3131-9. Nilsson, G. E., Rosén, P. and Johansson, D. (1993). Anoxic depression of spontaneous locomotor activity in crucian carp quantified by a computer imaging technique. J Exp Biol, 153-162. Nishi, M., Hinds, H., Lu, H. P., Kawata, M. and Hayashi, Y. (2001). Motoneuron-specific expression of NR3B, a novel NMDA-type glutamate receptor subunit that works in a dominant-negative manner. J Neurosci 21, RC185. Perez-Otano, I., Schulteis, C. T., Contractor, A., Lipton, S. A., Trimmer, J. S., Sucher, N. J. and Heinemann, S. F. (2001). Assembly with the NR1 subunit is
61

References
required for surface expression of NR3A-containing NMDA receptors. J Neurosci 21, 1228-37. Premkumar, L. S. and Auerbach, A. (1997). Stoichiometry of recombinant N-methyl-D-aspartate receptor channels inferred from single-channel current patterns. J Gen Physiol 110, 485-502. Raicu, P., Taisescu, E. and Banarescu, P. (1981). Carassius-Carassius and Carassius-Auratus, a Pair of Diploid and Tetraploid Representative Species (Pisces, Cyprinidae). Cytologia 46, 233-240. Rees, B. B., Sudradjat, F. A. and Love, J. W. (2001). Acclimation to hypoxia increases survival time of zebrafish, Danio rerio, during lethal hypoxia. J Exp Zool 289, 266-72. Roesner, A., Hankeln, T. and Burmester, T. (2006). Hypoxia induces a complex response of globin expression in zebrafish (Danio rerio). J Exp Biol 209, 2129-37. Shoubridge, E. A. and Hochachka, P. W. (1980). Ethanol: novel end product of vertebrate anaerobic metabolism. Science 209, 308-9. Sidow, A. (1996). Gen(om)e duplications in the evolution of early vertebrates. Curr Opin Genet Dev 6, 715-22. Sitbon, E. and Pietrokovski, S. (2007). Occurrence of protein structure elements in conserved sequence regions. BMC Struct Biol 7, 3. Song, I. and Huganir, R. L. (2002). Regulation of AMPA receptors during synaptic plasticity. Trends Neurosci 25, 578-588. Standley, S. and Baudry, M. (2000). The role of glycosylation in ionotropic glutamate receptor ligand binding, function, and trafficking. Cell Mol Life Sci 57, 1508-16. Standley, S., Roche, K. W., McCallum, J., Sans, N. and Wenthold, R. J. (2000). PDZ domain suppression of an ER retention signal in NMDA receptor NR1 splice variants. Neuron 28, 887-98. Storey, K. B. (1987). Tissue-specific controls on carbohydrate catabolism during anoxia in goldfish. Physiological Zoology 60, 601-607. Sucher, N. J., Akbarian, S., Chi, C. L., Leclerc, C. L., Awobuluyi, M., Deitcher, D. L., Wu, M. K., Yuan, J. P., Jones, E. G. and Lipton, S. A. (1995). Developmental and regional expression pattern of a novel NMDA receptor-like subunit (NMDAR-L) in the rodent brain. J Neurosci 15, 6509-20. Szatkowski, M. and Attwell, D. (1994). Triggering and execution of neuronal death in brain ischaemia: two phases of glutamate release by different mechanisms. Trends Neurosci 17, 359-65. Taylor, J. S., Braasch, I., Frickey, T., Meyer, A. and Van de Peer, Y. (2003). Genome duplication, a trait shared by 22000 species of ray-finned fish. Genome Res 13, 382-90. Taylor, J. S., Van de Peer, Y., Braasch, I. and Meyer, A. (2001). Comparative genomics provides evidence for an ancient genome duplication event in fish. Philos Trans R Soc Lond B Biol Sci 356, 1661-79. Thompson, J. D., Gibson, T. J., Plewniak, F., Jeanmougin, F. and Higgins, D. G. (1997). The CLUSTAL_X windows interface: flexible strategies for multiple sequence alignment aided by quality analysis tools. Nucleic Acids Res 25, 4876-82.
62

References
Traynelis, S. F., Hartley, M. and Heinemann, S. F. (1995). Control of proton sensitivity of the NMDA receptor by RNA splicing and polyamines. Science 268, 873-6. Tzeng, D. W., Lin, M. H., Chen, B. Y., Chen, Y. C., Chang, Y. C. and Chow, W. Y. (2007). Molecular and functional studies of tilapia (Oreochromis mossambicus) NMDA receptor NR1 subunits. Comp Biochem Physiol B Biochem Mol Biol 146, 402-11. Val, A. L., Silva, M. N. P. and Almeida-Val, V. M. F. (1998). Hypoxia adaptation in fish of the Amazon: a never-ending task. South African Journal of Zoology 33, 107-114. Vandenberghe, W. and Bredt, D. S. (2004). Early events in glutamate receptor trafficking. Curr Opin Cell Biol 16, 134-9. Volff, J. N. (2005). Genome evolution and biodiversity in teleost fish. Heredity 94, 280-94. Wissing, J. and Zebe, E. (1988). The Anaerobic Metabolism of the Bitterling Rhodeus-Amarus (Cyprinidae, Teleostei). Comparative Biochemistry and Physiology B-Biochemistry & Molecular Biology 89, 299-303. Yamazaki, M., Mori, H., Araki, K., Mori, K. J. and Mishina, M. (1992). Cloning, expression and modulation of a mouse NMDA receptor subunit. FEBS Lett 300, 39-45. Zheng, X., Zhang, L., Durand, G. M., Bennett, M. V. and Zukin, R. S. (1994). Mutagenesis rescues spermine and Zn2+ potentiation of recombinant NMDA receptors. Neuron 12, 811-8. Zukin, R. S. and Bennett, M. V. (1995). Alternatively spliced isoforms of the NMDARI receptor subunit. Trends Neurosci 18, 306-13.
63


![APRIL 1, 2014 WELCOME TO CARP @ [UNIV] “CARP America” .](https://static.fdocuments.in/doc/165x107/56649ea45503460f94ba8f44/april-1-2014-welcome-to-carp-univ-carp-america-wwwcarplifeorg.jpg)