CRS Report for Congress - National Agricultural Law...
44
Congressional Research Service ˜ The Library of Congress CRS Report for Congress Received through the CRS Web Order Code RL32677 Energy Use in Agriculture: Background and Issues November 19, 2004 Randy Schnepf Specialist in Agricultural Policy Resources, Science, and Industry Division
-
Upload
truongdang -
Category
Documents
-
view
241 -
download
1
Transcript of CRS Report for Congress - National Agricultural Law...

Congressional Research Service ˜ The Library of Congress
CRS Report for CongressReceived through the CRS Web
Order Code RL32677
Energy Use in Agriculture: Background and Issues
November 19, 2004
Randy SchnepfSpecialist in Agricultural Policy
Resources, Science, and Industry Division

Energy Use in Agriculture: Background and Issues
Summary
Agriculture requires energy as an important input to production. Agricultureuses energy directly as fuel or electricity to operate machinery and equipment, to heator cool buildings, and for lighting on the farm, and indirectly in the fertilizers andchemicals produced off the farm. In 2002, the U.S. agricultural sector used anestimated 1.7 quadrillion Btu of energy from both direct (1.1 quadrillion Btu) andindirect (0.6 quadrillion Btu) sources. However, agriculture’s total use of energy islow relative to other U.S. producing sectors. In 2002, agriculture’s share of total U.S.direct energy consumption was about 1%. Agriculture’s shares of nitrogen andpesticide use — two of the major indirect agricultural uses identified by the U.S.Dept of Agriculture (USDA) — are signficantly higher at about 56% and 67%,respectively.
U.S. farm production — whether for crop or animal products — has becomeincreasingly mechanized and requires timely energy supplies at particular stages ofthe production cycle to achieve optimum yields. Energy’s share of agriculturalproduction expenses varies widely by activity, production practice, and locality.Since the late 1970s, total agricultural use of energy has fallen by about 28%, as aresult of efficiency gains related to improved machinery, equipment, and productionpractices. Despite these efficiency gains, total energy costs of $28.8 billion in 2003represented 14.4% (5.2% direct and 9.3% indirect) of annual production expenses of$198.9 billion. As a result, unexpected changes in energy prices or availability cansubstantially alter farm net revenues, particularly for major field crop production.
High fuel and fertilizer prices in 2004, and increasing energy import dependencefor petroleum fuels and nitrogen fertilizers has led to concerns about the impact thiswould have on agriculture. High natural gas prices have already contributed to asubstantial reduction in U.S. nitrogen fertilizer production capacity — over a 23%decline from 1998 through 2003. In the short run, price- or supply-related disruptionsto agriculture’s energy supplies could result in unanticipated shifts in the productionof major crop and livestock products, with subsequent effects on farm incomes andrural economies. In the long run, a sustained rise in energy prices may have seriousconsequences on energy-intensive industries like agriculture by reducing profitabilityand driving resources away from the sector.
This report provides information relevant to the U.S. agricultural sector onenergy use, emerging issues, and related legislation. It will be updated as eventswarrant.
Contents
Introduction . . . . . . . . . . . . . . . . . . . . . . . . . . . . . . . . . . . . . . . . . . . . . . . . . . . . . . 1
Farm Energy Consumption Overview . . . . . . . . . . . . . . . . . . . . . . . . . . . . . . . . . . 2Agriculture as a Share of U.S. Energy Use . . . . . . . . . . . . . . . . . . . . . . . . . . 2Agriculture Sector Energy Use by Source . . . . . . . . . . . . . . . . . . . . . . . . . . . 5Energy’s Share of Agricultural Production Costs . . . . . . . . . . . . . . . . . . . . . 8Agricultural Energy Use by Activity . . . . . . . . . . . . . . . . . . . . . . . . . . . . . . 17Agricultural Energy Use by Region . . . . . . . . . . . . . . . . . . . . . . . . . . . . . . . 22
Agricultural Energy Use Issues . . . . . . . . . . . . . . . . . . . . . . . . . . . . . . . . . . . . . . 24Volatile, Rising Energy Prices . . . . . . . . . . . . . . . . . . . . . . . . . . . . . . . . . . . 24Declining U.S. Fertilizer Production Capacity . . . . . . . . . . . . . . . . . . . . . . 26Farm Income and Energy Prices . . . . . . . . . . . . . . . . . . . . . . . . . . . . . . . . . 28Food Price Effects? . . . . . . . . . . . . . . . . . . . . . . . . . . . . . . . . . . . . . . . . . . . 30Conclusions . . . . . . . . . . . . . . . . . . . . . . . . . . . . . . . . . . . . . . . . . . . . . . . . . 31
Public Laws and Bills Affecting Energy Use by Agriculture . . . . . . . . . . . . . . . 32
Appendix Tables . . . . . . . . . . . . . . . . . . . . . . . . . . . . . . . . . . . . . . . . . . . . . . . . . 34
List of Figures
Figure 1. In 2002, Agriculture Accounted for 1% of Total U.S. Direct Energy Use . . . . . . . . . . . . . . . . . . . . . . . . . . . . . . . . . . . . 4
Figure 2. U.S. Farm Energy Use by Source, 2002 . . . . . . . . . . . . . . . . . . . . . . . . 5Figure 3. Energy Use on U.S. Farms, Direct vs. Indirect, 1965 to 2002 . . . . . . . . 6Figure 4. Composition of Energy Use in U.S. Agriculture, 1965 to 2002 . . . . . . 7Figure 5. Direct Energy Use (DEU) and Output, 1965-99 . . . . . . . . . . . . . . . . . . . 8Figure 6. Indirect Energy Use (IEU) and Output, 1965-99 . . . . . . . . . . . . . . . . . . 8Figure 7. Direct vs. Indirect Energy Cost Shares on U.S. Farms, 1965 to 2002 . 11Figure 8. Energy Cost Shares by Source on U.S. Farms, 1965-2003 . . . . . . . . . 11Figure 9. U.S. Commercial Fertilizer Use, 1965-2002 . . . . . . . . . . . . . . . . . . . . 12Figure 10. U.S. Nitrogen Fertilizer Use, 1989- 2003 . . . . . . . . . . . . . . . . . . . . . . 12Figure 11. Anhydrous Ammonia and Natural Gas Prices . . . . . . . . . . . . . . . . . . 14Figure 12. Nitrogen Fertilizer Prices . . . . . . . . . . . . . . . . . . . . . . . . . . . . . . . . . . 14Figure 13. Phosphate, Potash, and Nitrogen Prices . . . . . . . . . . . . . . . . . . . . . . . 14Figure 14. Fruits and Vegetables Apply More Nitrogen... . . . . . . . . . . . . . . . . . 15Figure 15. ...But Major Field Crops Harvest More Area . . . . . . . . . . . . . . . . . . . 15Figure 16. Corn and Wheat Dominate Nitrogen Use . . . . . . . . . . . . . . . . . . . . . 15Figure 17. USDA Prices-Paid Index for Major Farm Production Inputs . . . . . . 16Figure 18. U.S. Farm Production Expenditure Regions . . . . . . . . . . . . . . . . . . . 22Figure 19. Natural Gas vs. Crude Oil, Monthly Prices, January 1976 to
July 2004 . . . . . . . . . . . . . . . . . . . . . . . . . . . . . . . . . . . . . . . . . . . . . . . . . . . 25Figure 20. U.S. Farm Fuel vs. Crude Oil Annual Prices, 1973-2003 . . . . . . . . . 30Figure 21. Distribution of a Dollar Spent on Food, 2000 . . . . . . . . . . . . . . . . . . 31
List of Tables
Table 1. Energy Uses in Agricultural Production . . . . . . . . . . . . . . . . . . . . . . . . . 3Table 2. U.S. Farm Production Expenditures, 1998-2003 . . . . . . . . . . . . . . . . . . 9Table 3. Farm Energy Costs (Value and Share) by Activity, 2002 . . . . . . . . . . . 17Table 4. Irrigated Area and Share by Activity, 2002 . . . . . . . . . . . . . . . . . . . . . . 19Table 5. Agricultural Production Expenditures for Energy by Major Crop,
U.S. Average for 2003 . . . . . . . . . . . . . . . . . . . . . . . . . . . . . . . . . . . . . . . . . 20Table 6. Fuel Price Changes, 2003 to 2004 . . . . . . . . . . . . . . . . . . . . . . . . . . . . . 28Table A1. Btu Conversion Chart . . . . . . . . . . . . . . . . . . . . . . . . . . . . . . . . . . . . . 34Table A2. U.S. Farm Energy Costs in Production, by Activity, 2002 . . . . . . . . . 35Table A3. Energy Cost Shares of Total Production Costs, by Activity, 2002 . . . 36Table A4. U.S. Energy Cost Shares by Activity, 2002 . . . . . . . . . . . . . . . . . . . . 37Table A5. U.S. Farm Energy Costs in Production, by Region, 2003 . . . . . . . . . . 38Table A6. Energy Cost Shares of Total Production Costs, by Region, 2003 . . . . 39Table A7. Regional Shares of U.S. Energy Costs by Type, 2003 . . . . . . . . . . . . 40

Energy Use in Agriculture: Background and Issues
Introduction
Agriculture, as a production-oriented sector, requires energy as an importantinput to production. U.S. farm production — whether for crop or animal products— has become increasingly mechanized and requires timely energy supplies atparticular stages of the production cycle to achieve optimum yields.
Several key points that emerge from this report are:
! agriculture is reliant on the timely availability of energy, but hasbeen reducing its overall rate of energy consumption;
! U.S. agriculture consumes energy both directly as fuel or electricityto power farm activities, and indirectly in the fertilizers andchemicals produced off farm;
! energy’s share of agricultural production expenses varies widely byactivity, production practice, and locality;
! at the farm level, direct energy costs are a significant, albeitrelatively small component of total production expenses in mostactivities and production processes;
! when combined with indirect energy expenses, total energy costs canplay a much larger role in farm net revenues, particularly for majorfield crop production; and
! energy price changes have implications for agricultural choices ofcrop and activity mix, and cultivation methods, as well as irrigationand post-harvest strategies.
This report provides background on the relationship between energy andagriculture in the United States. The first section provides background informationon current and historical energy use in the U.S. agricultural sector and how this fitsinto the national energy-use picture. Energy’s role in agriculture’s overall coststructure is detailed both for present circumstances and for changes over time.Finally, this section examines how agriculture’s energy-use pattern varies acrossactivities and regions.

CRS-2
1 See CRS Report RL30758, Alternative Transportation Fuels and Vehicles: Energy,Environment, and Development Issues, for a description and cost comparison of the majorfuels natural gas, LP gas or propane, and electricity, and the alternative fuels biodiesel,ethanol, and methanol.2 USDA, Economic Research Service (ERS), Agricultural Resources and EnvironmentalIndicators, Agricultural Handbook No. 705, December 1994, p. 106.3 See Appendix, “What Is a Btu?” for a definition.4 John Miranowski, “Energy Consumption in U.S. Agriculture,” presentation at USDAconference on Agriculture as a Producer and Consumer of Energy, June 24, 2004; hereafterreferred to as Miranowski (2004). Conference proceedings are available at [http://www.farmfoundation.org/projects/03-35EnergyConferencepresentations.htm].
Farm Energy Consumption Overview
At the farm level, energy use is classified as either direct or indirect. Directenergy use in agriculture is primarily petroleum-based fuels to operate cars, pickups,and trucks as well as machinery for preparing fields, planting and harvesting crops,applying chemicals, and transporting inputs and outputs to and from market.1 Naturalgas, liquid propane, and electricity also are used to power crop dryers and irrigationequipment. Electricity is used largely for lighting, heating, and cooling in homes andbarns. Dairies also require electricity for operating milking systems, cooling milk,and supplying hot water for sanitation. (See Table 1 for a listing of various directand indirect energy uses by agriculture.) In addition, oils and lubricants are neededfor all types of farm machinery.
Indirect energy is consumed off the farm for manufacturing fertilizers andpesticides. Because of measurement difficulties, energy used to produce other inputsfor agriculture, such as farm machinery and equipment, is not included in USDA’sdefinition of indirect energy.2
Agriculture as a Share of U.S. Energy Use
Direct Energy Use. In 2002, the U.S. agricultural sector (encompassing bothcrops and livestock production) used an estimated 1.1 quadrillion Btu3 of total directenergy.4 This represents slightly more than 1% of total U.S. energy consumption of98 quadrillion Btu in 2002. (See Figure 1.) In comparison, the non-agriculturalcomponent of the industrial sector is estimated to have used 31.4 quadrillion Btu(32%), while the transportation sector used 26.5 quadrillion Btu (27%).
As a result of its small share, significant changes in direct energy consumptionby the U.S. agricultural sector are unlikely to have major implications for the overallsupply and demand for energy in the United States. However, within the agriculturalsector, changes in the supply and demand of energy can have significant implicationsfor the profitability of U.S. agriculture as well as the mix of output and managementpractices.

CRS-3
Table 1. Energy Uses in Agricultural Production
Direct Use of Energy Fuel
Operating farm machinery and large trucks: - field work (tractors, combines, mowers, balers, etc.) - input purchase and deliveries (large trucks)
Diesel fuel
Operating small vehicles (cars and pickup trucks): - farm management activities
Gasoline
Operating small equipment: - Irrigation equipment - Drying of grain or fruit - Ginning cotton - Curing tobacco - Heating for frost protection in groves and orchards - Crop flamers - Heating/cooling of cattle barn, pig or poultry brooder, greenhouse, stock tanks, etc. - Animal waste treatment - Standby generators
Diesel fuel Natural Gas (NG)LP Gas (LP)Electricity (E)
General farm overhead - Lighting for houses, sheds, and barns - Power for farm household appliances
Electricity
Custom operations - Field work (e.g., combining) - Drying - Other
Diesel, Gasoline,NG, LP, E
Marketing - Transportation: elevator to terminal, processor, or port - Elevating
Diesel Gasoline
Indirect Use of Energy Fuel
Fertilizer - Nitrogen-based (NG is 75% to 90% of cost of prod.) - Phosphate (NG is 15% to 30% of cost of prod.) - Potash (NG is 15% of cost of prod.)
Natural Gas (NG)
Pesticides (insecticides, herbicides, fungicides) Petroleum or NG
Source: Assembled by CRS from various sources.

CRS-4
5 Formerly the General Accounting Office.6 GAO, Natural Gas: Domestic Nitrogen Fertilizer Production Depends on Natural GasAvailability and Prices, GAO-03-1148, Sept. 2003, p. 4.7 U.S. EPA, Pesticide Industry Sales and Usage: 2000 and 2001 Market Estimates, May2004, p.6.
Figure 1. In 2002, Agriculture Accounted for 1% of Total U.S. Direct Energy Use
Indirect Energy Use. In contrast to direct energy, agriculture’s share of twoimportant indirect energy uses — fertilizer and pesticide use — is signficantly higher.According to the Government Accountability Office (GAO),5 in 2002 agricultureaccounted for about 56% (12 million out of about 21.4 million metric tons) of totalU.S. nitrogen use.6 Nitrogen fertilizer is the principal fertilizer used by the U.S.agricultural sector. (See the section “Fertilizer Production Costs” later in this reportfor more information.) Data on agriculture’s share of phosphorous and potashfertilizer use was not readily available.
In addition, the U.S. Environmental Protection Agency (EPA) estimates thatU.S. agriculture accounted for 67% of expenditures on pesticides in the United Statesin 2001 (the year for which data was most recently available).7
Although direct use of natural gas by agriculture is the smallest of any majorenergy source (see Figure 2), its importance is magnified by an indirect linkage withfertilizers, particularly nitrogenous fertilizers. Natural gas is the major feedstock ofnitrogenous fertilizers and represents as much as 90% of the cost of production ofanhydrous ammonia — the primary ingredient for most nitrogen fertilizers.Similarly, but to a smaller extent, natural gas is a significant cost component in the

CRS-5
8 LP (liquified petroleum) gas is the generic name for commercial propane and commercialbutane gases.9 Miranowski (2004).
Figure 2. U.S. Farm Energy Use by Source, 2002
production of both phosphate (15% to 30% of production costs) and potash (15%)fertilizers.
If fertilizers and pesticides were divided into their natural gas and petroleumcomponents, the total direct and indirect consumption of natural gas would amountto over 26% of total energy consumption in the agricultural sector.
Agriculture Sector Energy Use by Source
Of the estimated 1.7 quadrillion Btu of total energy used by the U.S. agriculturalsector in 2002, 65% (1.1 quadrillion Btu) was consumed as direct energy (electricity,gasoline, diesel, LP gas,8 and natural gas), compared with 35% (0.6 quadrillion Btu)consumed as indirect energy (fertilizers and pesticides).
Total Energy Use by Agriculture Has Declined Over Time.Agricultural energy use peaked at 2.4 quadrillion Btu in 1978.9 The oil price shocksof the late 1970s and early 1980s forced the agricultural sector to become moreenergy efficient. Since the late 1970s, the direct use of energy by agriculture hasdeclined by 26%, while the energy used to produce fertilizers and pesticides hasdeclined by 31%. (See Figure 3.) Switching from gasoline-powered to more fuel-efficient diesel-powered engines, adopting conservation tillage practices (which tend

CRS-6
10 USDA, ERS, Agricultural Resources and Environmental Indicators, AgriculturalHandbook No. 705, December 1994, p. 108.11 See Table A1 for gasoline-equivalent prices.12 USDA, ERS, Agricultural Resources and Environmental Indicators, 1996-97,Agricultural handbook No. 712, July 1997, p. 145.
Figure 3. Energy Use on U.S. Farms, Direct vs. Indirect, 1965 to 2002
to use less energy), changing to larger multifunction machines, and creating newmethods of crop drying and irrigation contributed to this decline in energy use.10
Composition of Energy Use Has Shifted Over Time. Gasoline’srelative share as a source of farm energy has declined substantially over the past fourdecades, falling from a 41% share in 1965 to about a 9% share in 2002. (SeeFigure 4.) The direct use of natural gas and LP gas also experienced a decline inshare, falling from a combined 15% to 8%. In contrast, diesel fuel and electricityboth gained substantially, rising from 13% and 6% shares respectively in 1965 to27% and 21% shares in 2002.
The shift away from gasoline-powered machinery toward diesel-poweredmachinery underlies the rise of diesel and decline of gasoline. Diesel is betterperforming than gasoline in terms of miles per gallon and miles per Btu. Diesel fuelalso tends to be significantly cheaper on a gasoline-equivalent basis.11 The overalldecline in total direct energy use also reflects an important decline in the stock ofagricultural machinery, equipment, and motor vehicles that has occurred since totalfarm machinery inventories peaked in 1979.12 Capital depreciation exceeded capitalexpenditure in every year from 1980 through the mid-1990s.
The capital depletion was due to several factors including, first, increasedmachine efficiency and, second, shifts away from conventional tillage practices

CRS-7
13 Ibid., pp. 149-150.
Figure 4. Composition of Energy Use in U.S. Agriculture, 1965 to 2002
(which required working the soil many times prior to planting) toward reduced andno-till practices (which require fewer passes over the soil and, therefore, less fuelconsumption). In addition, conservation tillage practices have helped to conserve soilmoisture and nutrients (lowering the need for commercial fertilizers) and to prolongthe useful life of tractors and equipment.
Since 1965 fertilizer and pesticide use have exhibited a disjointed pattern as ashare of energy source for U.S. agriculture, rising from a combined 25% share in1965 to slightly above a 46% share in 1986, then declining to a 35% share by 2002.Increasing use of precision farming (i.e., computerized equipment that allows precisequantity and placement of inputs such as fertilizers and pesticides), conservationtillage, and crop residue management have all contributed to lower fertilizer volumeswithout sacrificing yield gains.13 Plantings of genetically engineered crops such asBt corn and Bt cotton, which require fewer pesticide applications, also havecontributed to a reduced pesticide volume. In addition, improved pesticide productsand expanded use of crop scouting services have contributed to lower pesticidevolumes while maintaining or improving the level of pest control.
Efficiency Gains in Farm Energy Use. The large declines in agriculturalsector use of direct and indirect energy sources since the late 1970s has not come atthe expense of lower output. Agriculture appears to have made dramatic efficiencygains in energy use. The gains are measured by sharply declining energy-use per unitof output indices for both direct and indirect energy categories.
Since 1980, direct energy use (DEU) per unit of output has fallen almostcontinuously while total agricultural sector output has risen steadily (see Figure 5).Indirect energy use (IEU) per unit of output has also tracked downward, but with

CRS-8
Figure 5. Direct Energy Use (DEU) and Output, 1965-99
Figure 6. Indirect Energy Use (IEU) and Output, 1965-99
more variability than direct energy use (see Figure 6). Both direct and indirectenergy use per unit of output appear to have plateaued somewhat in the 1990s.
Energy’s Share of Agricultural Production Costs
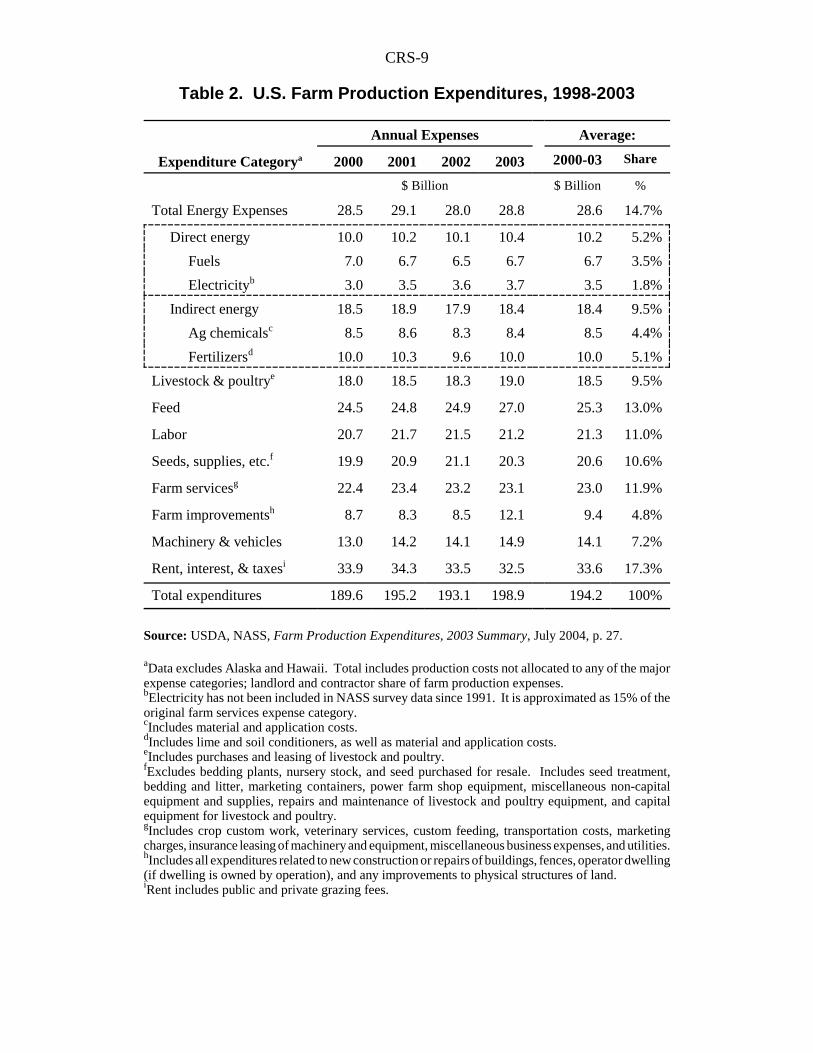
Producers are slowly gaining more options for responding to energy pricechanges, but in the short term most energy price increases still translate into lowerfarm income. During the 2000-2003 period, U.S. farmers spent an annual averageof nearly $194 billion on total production expenses (see Table 2). Of this total,nearly 15%, or an estimated $28.8 billion, was for energy expenses. Energy’s shareof annual farm production expenses varies from year to year with changes in plantedacres, the crop and livestock mix, and relative energy prices.
CRS-9
Table 2. U.S. Farm Production Expenditures, 1998-2003
Expenditure Categorya
Annual Expenses Average:
2000 2001 2002 2003 2000-03 Share
$ Billion $ Billion %
Total Energy Expenses 28.5 29.1 28.0 28.8 28.6 14.7%
Direct energy 10.0 10.2 10.1 10.4 10.2 5.2%
Fuels 7.0 6.7 6.5 6.7 6.7 3.5%
Electricityb 3.0 3.5 3.6 3.7 3.5 1.8%
Indirect energy 18.5 18.9 17.9 18.4 18.4 9.5%
Ag chemicalsc 8.5 8.6 8.3 8.4 8.5 4.4%
Fertilizersd 10.0 10.3 9.6 10.0 10.0 5.1%
Livestock & poultrye 18.0 18.5 18.3 19.0 18.5 9.5%
Feed 24.5 24.8 24.9 27.0 25.3 13.0%
Labor 20.7 21.7 21.5 21.2 21.3 11.0%
Seeds, supplies, etc.f 19.9 20.9 21.1 20.3 20.6 10.6%
Farm servicesg 22.4 23.4 23.2 23.1 23.0 11.9%
Farm improvementsh 8.7 8.3 8.5 12.1 9.4 4.8%
Machinery & vehicles 13.0 14.2 14.1 14.9 14.1 7.2%
Rent, interest, & taxesi 33.9 34.3 33.5 32.5 33.6 17.3%
Total expenditures 189.6 195.2 193.1 198.9 194.2 100%
Source: USDA, NASS, Farm Production Expenditures, 2003 Summary, July 2004, p. 27.
aData excludes Alaska and Hawaii. Total includes production costs not allocated to any of the majorexpense categories; landlord and contractor share of farm production expenses.bElectricity has not been included in NASS survey data since 1991. It is approximated as 15% of theoriginal farm services expense category.cIncludes material and application costs.dIncludes lime and soil conditioners, as well as material and application costs.eIncludes purchases and leasing of livestock and poultry.fExcludes bedding plants, nursery stock, and seed purchased for resale. Includes seed treatment,bedding and litter, marketing containers, power farm shop equipment, miscellaneous non-capitalequipment and supplies, repairs and maintenance of livestock and poultry equipment, and capitalequipment for livestock and poultry.gIncludes crop custom work, veterinary services, custom feeding, transportation costs, marketingcharges, insurance leasing of machinery and equipment, miscellaneous business expenses, and utilities.hIncludes all expenditures related to new construction or repairs of buildings, fences, operator dwelling(if dwelling is owned by operation), and any improvements to physical structures of land.iRent includes public and private grazing fees.

CRS-10
14 USDA, Economic Research Service, Agricultural Outlook, AO-1, June 1975, p. 9.15 Fertilizer use and energy costs are discussed in more detail in the following section,entitled “Fertilizer Production Costs.”
Direct Energy Costs. Demand for refined petroleum products such as dieselfuel, gasoline, and LP gas in agricultural production is determined mainly by thenumber of acres planted and harvested, weather conditions, and the prices for thevarious types of energy. Because the majority of energy used in the United States(and the world) is derived from either petroleum-based sources — such as gasoline,diesel, and LP gas — or natural gas, their prices tend to move together. This limitsthe success of switching among fuel sources to reduce energy costs.
During the 1960s and 1970s, direct energy costs (for inputs such as petroleumproducts and electricity) varied substantially as a share of total farm costs, rangingfrom 4% to 8% (see Figure 7). However, since the mid-1990s direct energy’s shareof total farm costs has averaged about 5%.
Electricity’s share of production costs grew from about 0.7% in the mid-1970sto 1.9% by 1989, and has held fairly steady ever since as technological efficiencygains in electricity use have essentially offset price rises (see Figure 8). In contrast,fuel costs have declined as a share of production costs, falling from a 6.4% share in1981 to average 3.3% since 1994, due in large part to efficiency improvements infarm machinery, as well as adoption of no- or minimum-tillage cultivation practices.
Indirect Energy Costs. Indirect energy costs (for fertilizers and pesticides)have shown considerable variability over the past 40 years, ranging between 8% and12% of total farm production expenses. The most notable cost-share movementoccurred in 1974, when indirect energy costs experienced a sharp upward spike dueto a jump in fertilizer prices. In 1971, USDA’s Economic Stabilization Program hadfrozen U.S. fertilizer prices at the producer level.14 These price controls wereremoved on October 25, 1973, and resulted in a rapid rise in U.S. fertilizer prices andexpenditures. Since 1996, indirect energy’s share of total farm costs has trendeddownward to about a 9% share in 2003.15
Agricultural Chemical Costs. Pesticides comprise the majority ofagricultural chemical expenditures. Pesticides are commonly broken out into threemajor types — herbicides, insecticides, and fungicides. Defoliants, used primarilyby cotton in the United States, are another major agricultural chemical grouping.
Pesticide’s share of farm production expenses has grown significantly from lessthan a 1% share prior to 1960 to a high of nearly 5% in 1998. The cost share increasethat occurred through 1980 was attributable both to increased total use and to risingper-unit costs, while the increase in cost share between 1980 and 1998 was duealmost solely to higher per-unit prices paid. The total pounds of active ingredientsof farm chemicals applied to crops rose steadily from early 1960 until about 1980,after which total pounds applied remained relatively unchanged. However, qualityimprovements in the mix of pesticide ingredients, their ability to kill selected targetpests, and the increasing ability of farmers to better target pesticide applications havecontinued through the 1990s. These and other quality improvements have limited

CRS-11
Figure 7. Direct vs. Indirect Energy Cost Shares on U.S. Farms, 1965 to 2002
Figure 8. Energy Cost Shares by Source on U.S. Farms, 1965-2003
growth in usage rates since 1980, but have contributed to increases in per-unit pricespaid through the mid-1990s.
Fertilizer Production Costs. In 2002, fertilizer expenditures accounted forabout 5% of agricultural production expenses. However, they were the single largestoutlay among farm energy expenditures, with a 34% share of the $28 billion of totalenergy expenses in 2002. That same year, fertilizer also represented the largest singlesource of farm energy (measured in Btu’s), with a 29% share.
CRS-12
Figure 9. U.S. Commercial Fertilizer Use, 1965-2002
Figure 10. U.S. Nitrogen Fertilizer Use, 1989- 2003
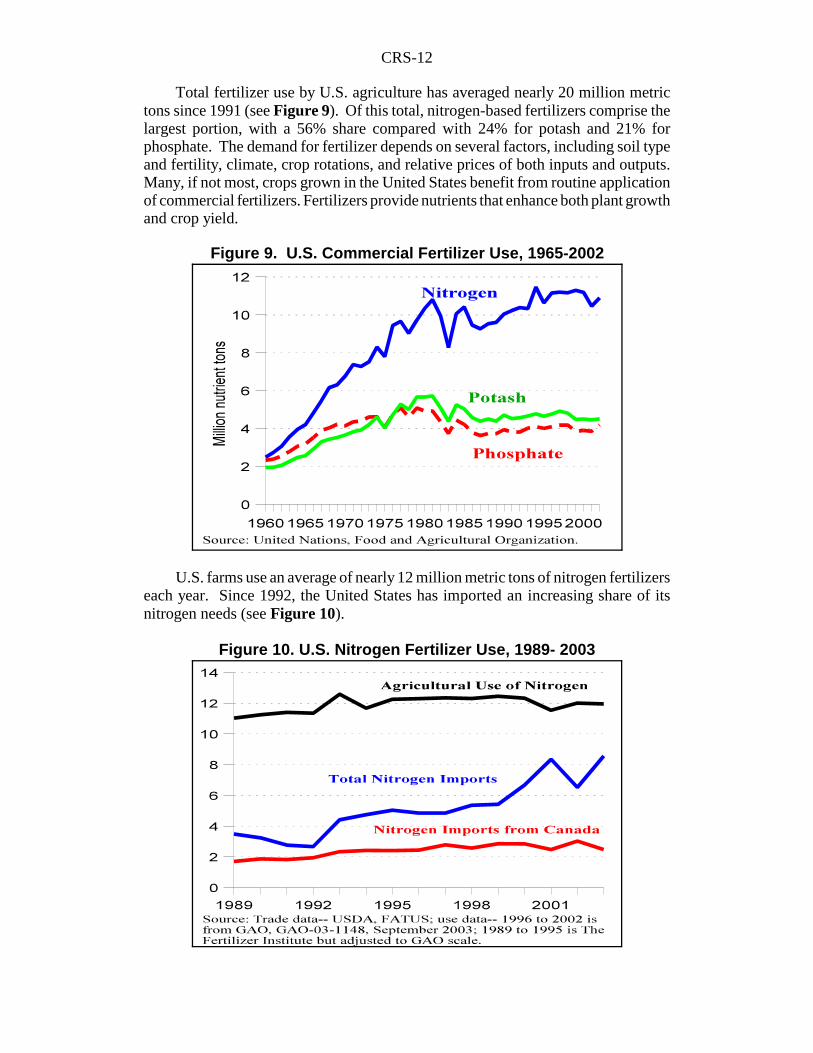
Total fertilizer use by U.S. agriculture has averaged nearly 20 million metrictons since 1991 (see Figure 9). Of this total, nitrogen-based fertilizers comprise thelargest portion, with a 56% share compared with 24% for potash and 21% forphosphate. The demand for fertilizer depends on several factors, including soil typeand fertility, climate, crop rotations, and relative prices of both inputs and outputs.Many, if not most, crops grown in the United States benefit from routine applicationof commercial fertilizers. Fertilizers provide nutrients that enhance both plant growthand crop yield.
U.S. farms use an average of nearly 12 million metric tons of nitrogen fertilizerseach year. Since 1992, the United States has imported an increasing share of itsnitrogen needs (see Figure 10).

CRS-13
16 The Fertilizer Institute, available at [http://www.tfi.org/].
Canada is the traditional source for most U.S. nitrogen imports (accounting forabout 40% of total imports since 1989).16 However, since 2000 the United States hasincreased the share of nitrogen imports from other sources, particularly from MiddleEastern countries such as Bahrain, Egypt, Kuwait, Qatar, and Saudi Arabia, but alsofrom Bulgaria, China, Russia, Poland, Romania, Netherlands, Norway, Ukraine,Trinidad and Tobago, and Venezuela.
Fertilizer Prices are Linked to Natural Gas Prices. U.S. fertilizerproduction is closely linked to energy availability, particularly natural gas. Naturalgas is the key ingredient in the production of anhydrous ammonia. Anhydrousammonia is used directly as a nitrogen fertilizer and as the basic building block forproducing most other forms of nitrogen fertilizers (e.g., urea, ammonium nitrate, andnitrogen solutions). Natural gas also is used as a process gas in the manufacture ofthese other nitrogenous fertilizers from anhydrous ammonia. As a result, natural gasaccounts for 75% to 90% of costs of production for nitrogen fertilizers. In addition,natural gas is an important input in the production of diammonium ormonoammonium phosphates (accounting for 15% to 30% of production costs), andpotash (accounting for as much as 15% of the production cost).
Because fertilizer prices are closely linked to natural gas prices throughanhydrous ammonia, these prices move in tandem as anhydrous ammonia pricesfollow natural gas prices, while the prices of other nitrogen fertilizers in turn followanhydrous ammonia’s price (see Figures 11 and 12.) Phosphate and potash pricesare less closely linked to natural gas than are prices for nitrogen fertilizers (seeFigure 13).
Higher fertilizer prices encourage two potential responses: (1) lower fertilizerapplication rates on the current farm planting mix; or (2) the planting and productionof crops that are less dependent on fertilizer. Although nitrogen fertilizer applicationrates tend to be higher for various fruit and vegetable crops, field crops are plantedon dramatically larger areas (see Figures 14 and 15). As a result, total fertilizerusage is highest for those crops that are planted to the greatest area — corn andwheat, with rice, cotton, and sorghum trailing far behind (see Figure 16).

CRS-14
Figure 11. Anhydrous Ammonia and Natural Gas Prices
Figure 12. Nitrogen Fertilizer Prices
Figure 13. Phosphate, Potash, and Nitrogen Prices

CRS-15
0 50 100 150 200 250
PotatoesT omatoes*
GrapesOranges
GrapefruitSweet corn*
CornRice
TobaccoPeaches
CottonSorghum
Snap beans*Wheat
SunflowerPeanuts
Soybean
L b s p e r a c re
N it ro g e n F e r t il iz e r A p p lic a t io n R a te s
* F o r p r o c e s s in g . S o u r c e : T h e F e r t i l iz e r I n s t . F r o m N A S S , U S D A ; d a ta f o r m o st y e a r s is fr o m 1 9 9 8 o r 1 9 9 9 .
Figure 14. Fruits and Vegetables Apply More Nitrogen...
0 10,000 20,000 30,000 40,000 50,000 60,000 70,000 80,000 90,000
PotatoesTomatoes*
GrapesOranges
GrapefruitSweet corn*
CornRice
TobaccoPeaches
CottonSorghum
Snap beans*Wheat
SunflowerPeanuts
Soybean
1 ,0 0 0 a c re s
U .S . A re a H a r v e s te d b y C ro p in 1 9 9 9
* F o r p r o c e s s in g . S o u r c e : T h e F e r t i l iz e r I n s t . F r o m N A S S , U S D A ; d a ta f o r m o st y e a r s is fr o m 1 9 9 8 o r 1 9 9 9 .
Figure 15. ...But Major Field Crops Harvest More Area
0 1,000 2,000 3,000 4,000 5,000 6,000
PotatoesTomatoes*
GrapesOranges
GrapefruitSweet corn*
CornRice
TobaccoPeaches
CottonSorghum
Snap beans*Wheat
SunflowerPeanuts
Soybean
1 ,0 0 0 to n s
T o ta l N itro g e n F e r t i liz e r U s e b y C ro p
* F o r p r o c e s s in g . S o u r c e : T h e F e r t i l iz e r I n s t . F r o m N A S S , U S D A ; d a ta f o r m o st y e a r s is fr o m 1 9 9 8 o r 1 9 9 9 .
Figure 16. Corn and Wheat Dominate Nitrogen Use
CRS-16
Figure 17. USDA Prices-Paid Index for Major Farm Production Inputs
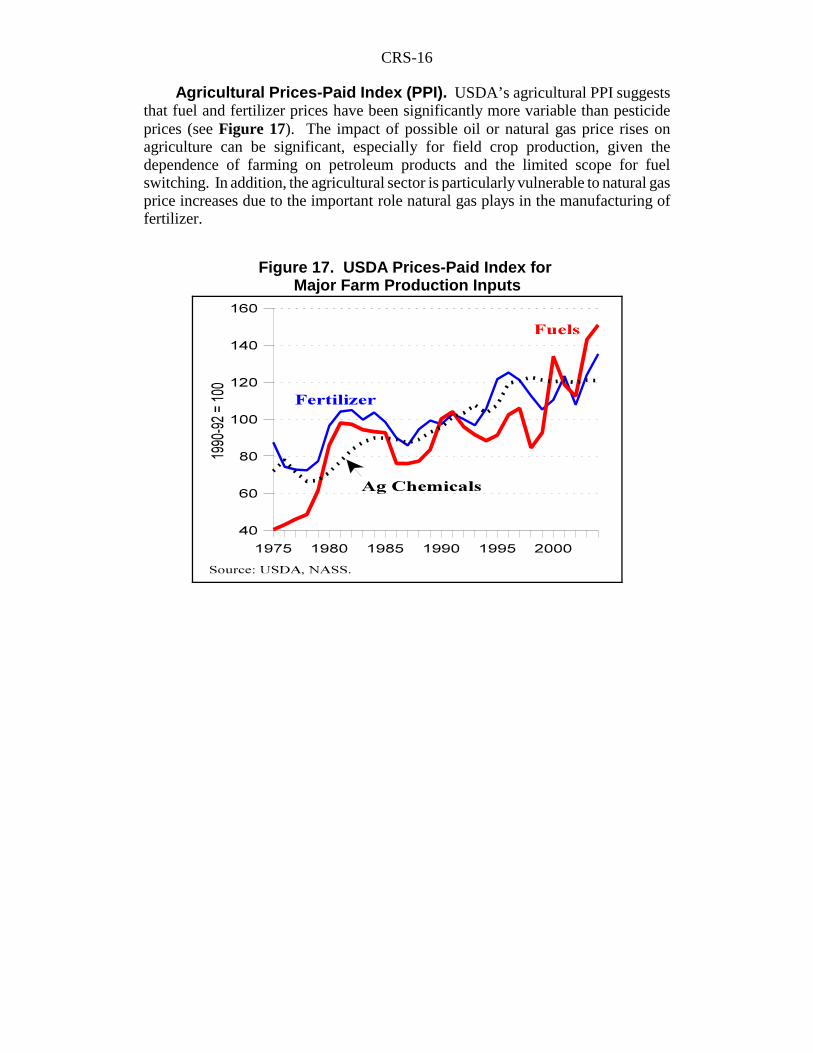
Agricultural Prices-Paid Index (PPI). USDA’s agricultural PPI suggeststhat fuel and fertilizer prices have been significantly more variable than pesticideprices (see Figure 17). The impact of possible oil or natural gas price rises onagriculture can be significant, especially for field crop production, given thedependence of farming on petroleum products and the limited scope for fuelswitching. In addition, the agricultural sector is particularly vulnerable to natural gasprice increases due to the important role natural gas plays in the manufacturing offertilizer.

CRS-17
17 For more detail on types of energy expenditures across various crop and livestockactivities, see Appendix Tables A2-A4 at the end of this report.
Agricultural Energy Use by Activity
Total production expenses and the relative importance of energy costs varygreatly both by production activity and by region. Although there are many kinds offarm operations performed by the different farm types, nearly all mechanized fieldwork, as well as marketing and management activities, involve machinery (such astractors and harvesters) as well as trucks and cars that are dependent on petroleumfuels. Grain dryers and irrigation equipment are often more versatile in that they canbe powered by petroleum fuels, natural gas, or electricity, while electricity is theprimary source of power for lighting, heating, and cooling in homes, barns, and otherfarm buildings.
Table 3. Farm Energy Costs (Value and Share) by Activity, 2002
ActivitiesaTotal Costs of
Production(COP)
TotalEnergyCosts
Energy Share of
COP
Share of TotalU.S. Farm
Energy Costsby Activity
———— $ million———— % %
Crop Activities 80,343 18,364 22.9 76.4
Major Field Crops 50,091 13,627 27.2 56.7
Vegetable & Fruits 19,737 3,759 19.0 15.6
Greenhouse & nurseryb 10,514 979 9.3 4.1
Livestock Activities 95,857 5,701 5.9 23.7
Beef cattle ranching 20,038 2,323 11.6 9.7
Aquaculture & other 5,617 445 7.9 1.9
Dairy cattle & milk prod. 18,451 1,241 6.7 5.2
Hog & pig farming 11,312 526 4.6 2.2
Poultry & egg prod. 17,649 534 3.0 2.2
Cattle feedlots 22,143 577 2.6 2.4
United States 173,199 24,036 13.7 100.0
Source: USDA, NASS, 2002 Census of Agriculture.
aActivities are organized by North American Industry Classification Ssytem (NAICS), see “AppendixA” of 2002 Census of Agriculture for details; available at [http://www.nass.usda.gov/census/census02/volume1/us/index1.htm].bIncludes floriculture.
Table 3 provides details from the 2002 Agricultural Census on energy costs, aswell as the total production expenses by major agricultural production activity in theUnited States.17 Clearly, those farm activities where energy costs play a larger roleare more likely to see profits squeezed by rising energy costs.

CRS-18
According to census data, energy expenses in agricultural production in 2002were $24 billion, composed of $18.4 billion on crops and $5.7 billion on livestockproduction. Energy costs represented nearly 14% of total U.S. agricultural productioncosts. In terms of energy’s share of costs within each major production activity, 23%of crop production expenses were attributable to energy costs, compared with only6% for livestock production outlays. The higher the share of total production costsaccounted for by energy, the more sensitive a production activity is to energy priceor supply fluctuations.
Major Field Crops. Major field crop production traditionally requires severalpasses over the field, either with a tractor pulling some type of equipment involvedin field preparation, planting, cultivation, fertilizer and chemical applications, orharvesting, or with a specialized machine that may perform one or more of thesefunctions. Fuel consumption depends on the fuel efficiency of the particular machineinvolved, the number of passes over the field (determined largely by the tillagepractice employed), and the size of the field. Indirect energy use in the form ofpesticides and fertilizers varies widely across crops and regions depending onweather and soil conditions as well as production practices.
A significant portion of U.S. field crop production is irrigated each year,requiring further energy to operate the pumping equipment. In 2002, approximately55.3 million acres, or nearly 13% of the 434.2 million acres of cropland — for allfield, forage, vegetable, and tree crops — were irrigated (see Table 4). The use ofirrigation varies from year to year based on weather and soil moisture condition. Forexample, in 1997 nearly 16% (67.8 million acres) of the 425.2 million acres of totalcropland were irrigated. Also, irrigation use can vary substantially based on the cropgrown — 100% of the 1997 rice crop was irrigated compared with only about 6% ofwheat production.
Once harvested, most field crops require additional types of energy-related on-farm processing before being sold. Harvested crops with a high moisture contentgenerally undergo drying to meet storage and processing requirements. Other crops,such as cotton and tobacco, require other types of energy outlays. Cotton must beginned to separate the lint from seeds and foreign matter. Tobacco has to be cured— a process of heating and drying to develop and preserve the potential quality,flavor, and aroma of tobacco — before it can undergo processing into cigarettes orother products.
According to the 2002 Agricultural Census (see Table 3), the highly aggregatecategory of “major field crops” was the largest agricultural energy user — both intotal outlays at $13.6 billion and as a share of production costs at 27%. Furthermore,“major field crop” energy expenses accounted for 29% of the total energy costsexpended by U.S. agriculture.

CRS-19
Table 4. Irrigated Area and Share by Activity, 2002
CropTotal
Cropland Irrigated AreaIrrigated
Share
Commodity Groups 1,000 acres 1,000 acres %
Fruit & tree nuts 6,790 4,585 67.5
Vegetable & melons 8,639 4,975 57.6
Cotton 14,590 4,766 32.7
Greenhouse & nurseryd 2,497 743 29.7
Other cropse 54,176 8,850 16.3
Cattle feedlots 11,505 1,379 12.0
Oilseed & grain 204,555 19,473 9.5
Beef cattle ranching 89,838 7,771 8.6
Dairy cattle & milk prod. 19,231 1,379 7.2
Tobacco 3,576 112 3.1
U.S. Total 434,165 55,311 12.7
Individual Crops
Rice 3,198 3,198 100.0
Orchards 5,330 4,374 82.1
Potatoes 1,266 1,033 81.6
Vegetables 3,433 2,360 68.7
Sugar cane (for sugar) 978 497 50.8
Peanuts 1,223 463 37.8
Upland cotton 12,224 4,570 37.4
Sugar beets (for sugar) 1,366 472 34.5
Alfalfa hay 22,638 6,809 30.1
Tobacco 429 97 22.7
Forage 64,041 10,280 16.0
Corn for grain 68,231 9,710 14.2
Soybeans 72,400 5,460 7.5
Wheat for grain 45,520 2,910 6.4
Source: USDA, NASS, Agricultural Census, 2002.

CRS-20
Production expenditure data for 2003 from the Agricultural ResourceManagement Survey (ARMS) as reported by the Economic Research Service (ERS)of USDA suggests that there is considerable variation within the “oilseed and grain”category (see Table 5). According to ERS agricultural production cost estimates,energy costs represent about 29% to 30% of total production expenses of rice, barley,and peanuts, but only 14% of total production expenses of soybeans. For three of thefour most extensively planted field crops in the United States — corn, wheat, andcotton (soybeans being the exception) — energy costs represented 22% to 27% oftotal production costs. As a result, year-to-year crop selection and profitability arepotentially more sensitive to energy price and supply fluctuations for major U.S.program crops than otherwise indicated by the aggregate “major field crop”aggregation of Table 3.
Table 5. Agricultural Production Expenditures for Energy by Major Crop, U.S. Average for 2003
CropArea
Planted
TotalProduction
Costs
TotalEnergyCosts
DirectEnergyCosts
Indirect Energy Costs
Chem-icals
Fert-ilizers Total
1,000 ac ———————————$ per acre————————————
Rice 3,022 614.37 187.11 73.78 59.02 54.31 113.33
Sorghum 9,420 217.74 62.47 32.74 11.56 18.17 29.73
Peanuts 1,344 689.19 196.84 48.52 99.82 48.50 148.32
Corn 78,736 349.78 92.67 23.06 26.20 43.41 69.61
Barley 5,299 200.93 49.17 16.23 9.81 23.13 32.94
Cotton, all 13,479 545.25 130.44 38.59 55.94 35.91 91.85
Sugar beets 1,365 872.29 204.42 50.58 96.39 57.45 153.84
Wheat, all 61,700 191.41 41.07 10.98 6.95 23.14 30.09
Oats 4,601 156.03 27.00 7.85 1.87 17.28 19.15
Soybeans 73,404 238.49 33.04 8.73 16.92 7.39 24.31
Share of Total Production Costs —————————percent —————————
Rice 100.0 30.5 12.0 9.6 8.8 18.4
Sorghum 100.0 28.7 15.0 5.3 8.3 13.7
Peanuts 100.0 28.6 7.0 14.5 7.0 21.5
Corn 100.0 26.5 6.6 7.5 12.4 19.9
Barley 100.0 24.5 8.1 4.9 11.5 16.4
Cotton, all 100.0 23.9 7.1 10.3 6.6 16.8
Sugar beets 100.0 23.4 5.8 11.1 6.6 17.6
Wheat, all 100.0 21.5 5.7 3.6 12.1 15.7
Oats 100.0 17.3 5.0 1.2 11.1 12.3
Soybeans 100.0 13.9 3.7 7.1 3.1 10.2
Source: USDA, NASS, Acreage, June 30, 2003; and USDA, ERS, “U.S. Cost and Return Estimates;”retrieved from [http://www.ers.usda.gov/data/costandreturns/testpick.htm] on Oct. 1, 2004.

CRS-21
Vegetables and Fruit. Fruit and vegetable production activities vary widely,from highly mechanized production with minimal labor input to labor-intensive withlow levels of mechanization. Irrigation is also used widely in vegetable and fruitproduction (see Table 4), and chemicals and fertilizers are traditionally an importantpart of the production process (see Figure 14). In some citrus and other fruit growingareas, field heaters or windmills are used to minimize the potential effects of freezingtemperatures. In 2002, “vegetable and melon” energy costs of $2.0 billion accountedfor 22% of their total production expenses (see Table A2). In contrast, “fruit and treenut” energy costs of $1.7 billion represented 17% of total production expenses.
Greenhouse, Nursery, and Floriculture. Energy-using activities — suchas temperature regulation, plant disease and insect control, fertilization, and timelywatering — comprised less than 10% of total production costs in greenhouse,nursery, and floriculture production.
Beef Cattle Ranching. Pasture management and marketing activities are theprimary energy-using activities involved in cow-calf and other cattle grazingoperations. In several locations, pasture management involves irrigation, fertilization,and weed control. Energy costs accounted for about 12% of total beef cattle ranchingexpenses in 2002. Despite its low share of total production costs, cattle ranchingaccounts for a substantial share (nearly 12%) of national agriculture-related energyconsumption — including over 15% of fuel expenses and 10% of fertilizer costs usedby U.S. agriculture in 2002. The significant energy share is explained by the vastacreage involved in beef cattle ranching in the United States (nearly 420 millionacres) and the large number of animals marketed to feedlots or slaughter houses eachyear (in 2003, 18.4 million head of cattle and calves were slaughtered, while 11.8million head were on feed as of July 1, 2004).
Aquaculture Production. Aquaculture production includes fish farming ofmajor fish species — catfish, salmon, etc. — as well as of shrimp and mussels.Energy needs vary with production processes and species, but can involve specializedbreeding tanks as well as grow-out tanks for fingerlings. Temperature and watercontrol, as well as lighting, are prime users of electricity. Aquaculture is groupedwith “other animal production activities” in the 2002 agricultural census. Together,this composite category had energy costs of $445 million, representing nearly 8% oftotal production expenses.
Dairy Cattle and Milk Production. Dairy operations require electricity foroperating milking systems, cooling milk, and supplying hot water for sanitation.Pasture management, feeding operations, and marketing activities also consumeenergy directly and indirectly. Total energy costs of $1.2 billion for dairy and milkproduction in 2002 accounted for less than 7% of their total production expenses.
Cattle Feedlots. Feedlot operations use energy to furnish feed and water toanimals, to manage animal waste, and to market animals to packing plants and otherslaughter houses. However, feedlot energy expenses of $2.3 billion in 2002accounted for less than 3% of total production costs. Purchasing feeder stock andfeedstuffs dominated cost outlays.
CRS-22
18 USDA, NASS, Farm Production Expenditures, 2003 Summary, July 2004.19 NASS’s survey data includes direct responses on farm use of fuel, agricultural chemicals,and fertilizer. Farm electricity use is approximated as 15% of farm services outlays whichincludes operating irrigation equipment and farm utilities.
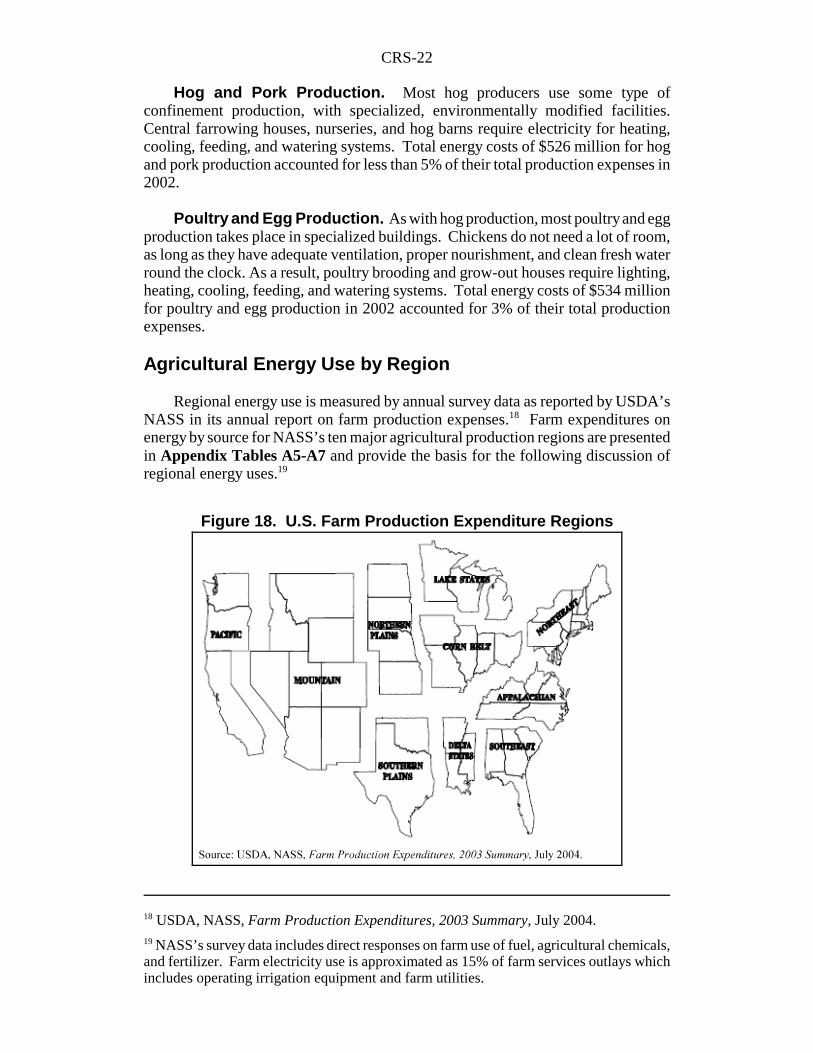
Figure 18. U.S. Farm Production Expenditure Regions
Hog and Pork Production. Most hog producers use some type ofconfinement production, with specialized, environmentally modified facilities.Central farrowing houses, nurseries, and hog barns require electricity for heating,cooling, feeding, and watering systems. Total energy costs of $526 million for hogand pork production accounted for less than 5% of their total production expenses in2002.
Poultry and Egg Production. As with hog production, most poultry and eggproduction takes place in specialized buildings. Chickens do not need a lot of room,as long as they have adequate ventilation, proper nourishment, and clean fresh waterround the clock. As a result, poultry brooding and grow-out houses require lighting,heating, cooling, feeding, and watering systems. Total energy costs of $534 millionfor poultry and egg production in 2002 accounted for 3% of their total productionexpenses.
Agricultural Energy Use by Region
Regional energy use is measured by annual survey data as reported by USDA’sNASS in its annual report on farm production expenses.18 Farm expenditures onenergy by source for NASS’s ten major agricultural production regions are presentedin Appendix Tables A5-A7 and provide the basis for the following discussion ofregional energy uses.19

CRS-23
The Corn Belt (Illinois, Indiana, Iowa, Missouri, and Ohio), with its extensivearea planted to corn and soybeans, is the dominant agricultural energy-using region,with a total energy bill of $6.5 billion and accounting for 22% of total U.S.agricultural energy costs in 2002. However, nearly 75% ($4.7 billion) of the CornBelt’s energy costs are in the form of indirect energy expenditures. The Corn Beltis the leading consumer of fertilizers and agricultural chemicals, with national cost-shares of 27% and 24%, respectively. Also noteworthy is the Corn Belt’s nation-leading share (25%) of LP gas expenditures for agricultural production — usedextensively for crop drying.
In contrast, the Pacific region (Washington, Oregon, and California) — whichplaced second in terms of total agricultural energy costs at $4.2 billion — relied farmore heavily on direct fuels (43% of total energy costs in the Pacific region). Inparticular, the Pacific dominated national electricity expenditures in agriculturalproduction, with nearly $1 billion in outlays in 2002 (accounting for 25% of nationalelectricity costs in agricultural production).
Both diesel and total fuel costs are highest in the regions with the largest plantedcrop area — the Corn Belt with 84.4 million acres and the Northern Plains (Kansas,Nebraska, North Dakota, South Dakota) with 81.8 million acres. Irrigation of fieldcrops (another important source of energy demand) is most prevalent in the SouthernPlains, Delta, Mountain, and Pacific regions, but may be found to some degreethroughout major growing areas.

CRS-24
20 Dept. of Energy (DOE), Energy Information Agency (EIA), Annual Energy Outlook 2004with Projections to 2025, available at [http://www.eia.doe.gov/oiaf/aeo/gas.html].Depending on low- and high-oil price assumptions, the projected petroleum import share for2025 ranges from 65% to 75% of consumption.21 OECD Europe consists of Austria, Belgium, the Czech Republic, Denmark, Finland,France, Germany, Greece, Hungary, Iceland, Ireland, Italy, Luxembourg, the Netherlands,Norway, Poland, Portugal, Spain, Sweden, Switzerland, Turkey, and the United Kingdom.22 DOE, EIA, International Petroleum Information.23 See CRS Report RL31608, The Effects of Oil Shocks on the Economy: A Review of theEmpirical Evidence, for information on global oil shocks and their potential consequencesto the U.S. economy.24 See CRS Report RS20727, Energy Independence: Would it Free the United States FromOil Price Shocks? for a discussion of energy independence and its potential consequenceson the U.S. economy.
Agricultural Energy Use Issues
Volatile, Rising Energy Prices
Import Dependency. U.S. petroleum import dependency has been growingsteadily over the past four decades. In 1970, U.S. petroleum imports accounted for22% of domestic consumption; by 2003 the import share had grown to over 55% andis projected to reach 70% by 2025.20 This problem is not unique to the United States,but is increasingly a problem for “Western industrial countries.” For example, Japanand OECD Europe (excluding the United Kingdom)21 are also heavily dependent onimported oil as a share of domestic consumption, with 100% and 66% shares,respectively, in 2004.22
Because the United States depends on international sources for so much of itsenergy needs, U.S. energy prices reflect international market conditions, particularlycrude oil supplies. This heavy import dependence renders the United Statesvulnerable to unexpected price movements and supply disruptions in internationalenergy markets. Agriculture appears particularly vulnerable to energy price increasesthrough both petroleum and natural gas markets, as well as fertilizer markets.
During the last three decades of the 20th century, the United States has beensubjected to four major oil price shocks — 1973-1974, following the Arab OilEmbargo of that same period; 1979-1980, following the Iranian crisis of 1979; 1990-1991, following the Persian Gulf war; and 1999-2000 resulting from unexpectedlystrong global demand and tight supplies.23 Some analysts have argued that reducingU.S. energy dependence on foreign sources might alleviate some or much of theenergy price volatility, but that it would likely be associated with a relatively higherprice level.24
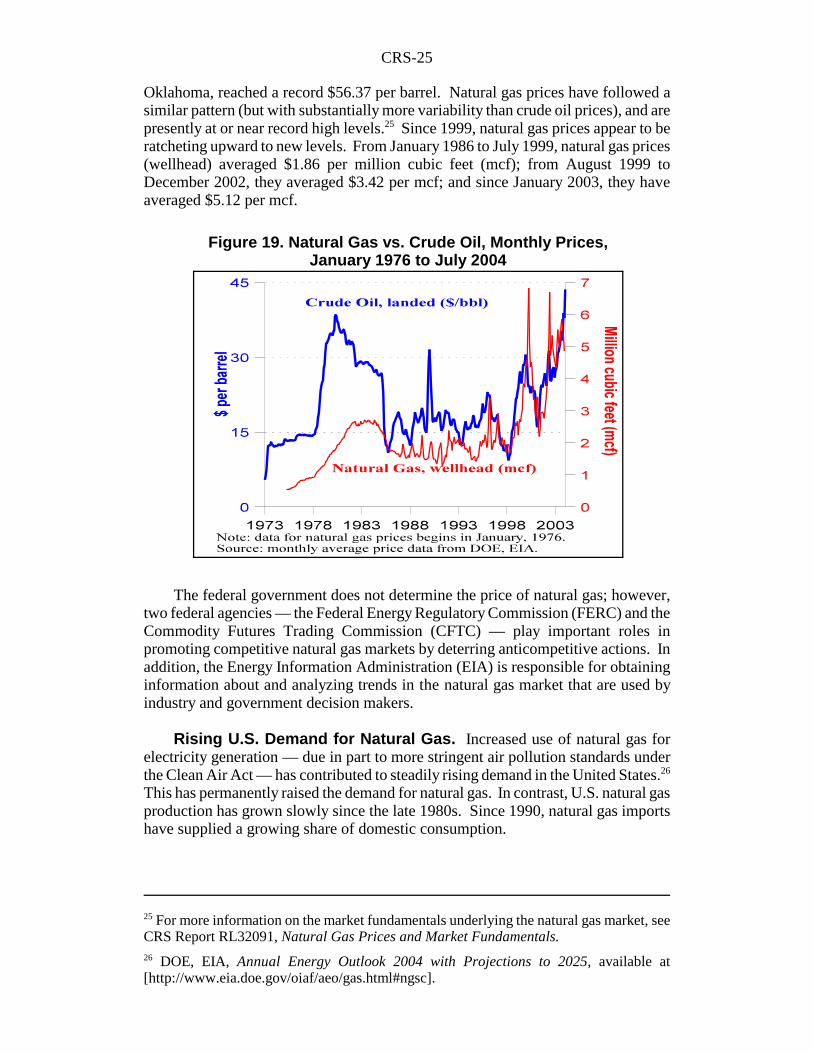
In the past two years, global markets have seen monthly average crude oil pricessurge first to over $31 per barrel in February 2003 (the highest price since 1981), thento a record $43.60 per barrel in October 2004 (see Figure 19). On October 26, thedaily spot market price (FOB) for West Texas Intermediate crude oil at Cushing,
CRS-25
25 For more information on the market fundamentals underlying the natural gas market, seeCRS Report RL32091, Natural Gas Prices and Market Fundamentals.26 DOE, EIA, Annual Energy Outlook 2004 with Projections to 2025, available at[http://www.eia.doe.gov/oiaf/aeo/gas.html#ngsc].
Figure 19. Natural Gas vs. Crude Oil, Monthly Prices,January 1976 to July 2004
Oklahoma, reached a record $56.37 per barrel. Natural gas prices have followed asimilar pattern (but with substantially more variability than crude oil prices), and arepresently at or near record high levels.25 Since 1999, natural gas prices appear to beratcheting upward to new levels. From January 1986 to July 1999, natural gas prices(wellhead) averaged $1.86 per million cubic feet (mcf); from August 1999 toDecember 2002, they averaged $3.42 per mcf; and since January 2003, they haveaveraged $5.12 per mcf.
The federal government does not determine the price of natural gas; however,two federal agencies — the Federal Energy Regulatory Commission (FERC) and theCommodity Futures Trading Commission (CFTC) — play important roles inpromoting competitive natural gas markets by deterring anticompetitive actions. Inaddition, the Energy Information Administration (EIA) is responsible for obtaininginformation about and analyzing trends in the natural gas market that are used byindustry and government decision makers.
Rising U.S. Demand for Natural Gas. Increased use of natural gas forelectricity generation — due in part to more stringent air pollution standards underthe Clean Air Act — has contributed to steadily rising demand in the United States.26
This has permanently raised the demand for natural gas. In contrast, U.S. natural gasproduction has grown slowly since the late 1980s. Since 1990, natural gas importshave supplied a growing share of domestic consumption.

CRS-26
27 For more information, see CRS Report RL32386, Liquefied Natural Gas (LNG) in U.S.Energy Policy: Issues and Implications.28 GAO, Natural Gas: Domestic Nitrogen Fertilizer Production Depends on Natural GasAvailability and Prices, GAO-03-1148, Sept. 2003, p. 4.29 Ibid.
Certain infrastructure constraints limit access to international supplies of naturalgas. First, most natural gas is transported via pipeline. Lack of pipeline access limitsthe viability of offshore natural gas production in the Gulf of Mexico, where suppliesare relatively abundant. Additionally, the pipeline requirement limits access tointernational supplies other than from neighboring Canada and Mexico. Second, thealternative to pipeline transport of natural gas is liquefication into liquefied naturalgas (LNG), where transportation is more feasible. However, costly infrastructurerequirements for production, transportation, and importation, as well as local safetyconcerns, limit LNG accessibility.27
The tightening U.S. supply situation, and increasing dependence on imports, hascontributed to higher natural gas prices, with immediate implications for farm fueland fertilizer costs, as well as for U.S. fertilizer production.
Declining U.S. Fertilizer Production Capacity
According to the GAO, total U.S. nitrogen consumption in 2002 was about 21.4million short tons, of which agriculture used about 12 million tons (or 56%).28 TheU.S. manufacturing sector used over 9 million tons of nitrogen for industrial purposessuch as promoting bacterial growth in waste treatment plants, making plastics, andas a refrigerant.
Fertilizer production, especially nitrogenous fertilizers, is very energy intensive.As mentioned earlier, natural gas accounts for a substantial portion (75% to 90%) ofnitrogen fertilizer production costs, either directly as a feedstock or indirectly as afuel to generate the electricity needed in production. U.S. fertilizer manufacturers areat a competitive disadvantage when domestic natural gas prices rise. Natural gasprices in foreign countries with major nitrogen production capabilities tend to be wellbelow U.S. prices. For example, in early 2001, when U.S. prices for natural gas wereabout $5 per million Btu, the price of gas in the Middle East was 60¢ per million Btu;40¢ in North Africa; 70¢ in Russia; and 50¢ in Venezuela.29
As with natural gas, the federal government does not set or control prices fornitrogen fertilizer. Furthermore, nitrogen fertilizer products imported from othercountries are generally not subject to U.S. trade restrictions such as quotas or tariffs.
U.S. fertilizer manufacturers can respond to periodic natural gas price spikes byclosing plants temporarily, and resuming production when prices drop again. Buthigher prices sustained over the long run likely result in permanent loss of domesticproduction capacity. In recent years, high domestic natural gas prices have resultedin the idling and/or closing of a significant share of U.S. nitrogen productioncapacity. In 1998, U.S. ammonia plant production capacity was 21.4 million tons.
CRS-27
30 The Fertilizer Institute, North American Fertilizer Capacity, August 2003. Historicalclosings between 1998/99 and 2003/04 obtained in personal correspondence with C.F.Industries in April 2004. The fertilizer marketing year ends June 30.31 Fertilizer industry position is from personal conversations with Glen Buckley, C.F.Industries, Long Grove, IL; for details on the AFBF energy position, see [http://www.fb.org/issues/backgrd/energy04.pdf].32 For examples, see the policy positions on clean energy espoused by the Sierra Club at[http://www.sierraclub.org/environment/], the Natural Resources Defense Council at [http://www.nrdc.org/], and the U.S. Public Interest Research Group at [http://www.uspirg.org/].33 For more information on energy efficiency issues, see CRS Report IB10020, EnergyEfficiency: Budget, Oil Conservation, and Electricity Conservation Issues. For informationon the NPC and its report on natural gas policy, refer to [http://www.npc.org/].
From 1998/99 to 2003/04, 3.5 million tons of ammonia plant production capacitywas closed and another 1.5 million tons was idled, leaving 16.3 million tons (76.5%)of active production capacity.30 Declining nitrogen production suggests that eithernitrogen use must fall or nitrogen imports must increase.
Advocates for the U.S. fertilizer industry — supported by the American FarmBureau Federation (AFBF) — argue for changes in U.S. laws and regulations thatwould either encourage increases in the supply of natural gas, or that woulddiscourage natural gas demand for power generation.31 They suggest that increasedaccess to federal lands that are currently off-limits to drilling and greater taxincentives for drilling could bolster domestic natural gas production. Alternately,they contend that relaxing environmental restrictions on coal plants, extending orexpediting nuclear and hydro licenses, promoting use of clean coal technology, andprohibiting or taxing the use of natural gas as a fuel in power generating permitscould all reduce domestic demand for natural gas as an energy source for powergeneration. However, a broad range of environmentalist organizations, renewableenergy advocates, and urban pollution control groups decry these suggestions.32
In September 2003, the National Petroleum Council (NPC) produced a report,Balancing Natural Gas Policy, that examined the policy options to address theproblem of high natural gas prices. The report recognized the likelihood of continuedhigh natural gas prices “for years to come,” and concluded, among other options, thatenergy conservation and greater energy efficiency would have the biggest immediatepotential to hold down prices.33
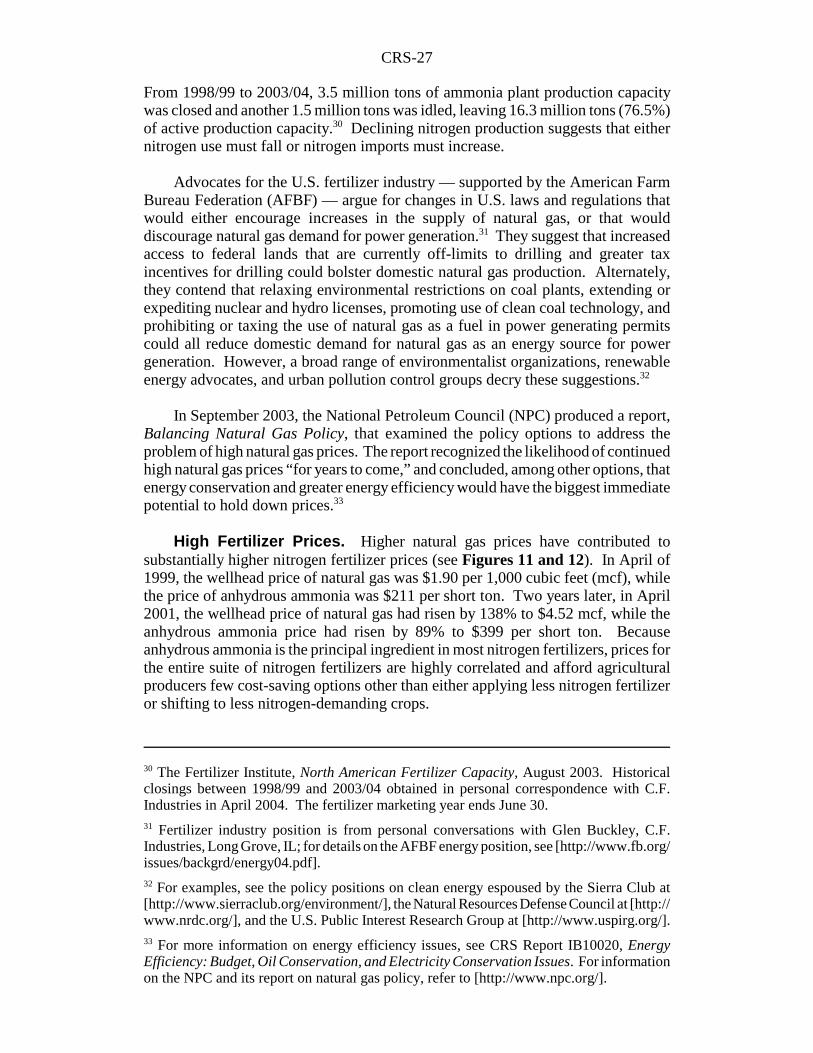
High Fertilizer Prices. Higher natural gas prices have contributed tosubstantially higher nitrogen fertilizer prices (see Figures 11 and 12). In April of1999, the wellhead price of natural gas was $1.90 per 1,000 cubic feet (mcf), whilethe price of anhydrous ammonia was $211 per short ton. Two years later, in April2001, the wellhead price of natural gas had risen by 138% to $4.52 mcf, while theanhydrous ammonia price had risen by 89% to $399 per short ton. Becauseanhydrous ammonia is the principal ingredient in most nitrogen fertilizers, prices forthe entire suite of nitrogen fertilizers are highly correlated and afford agriculturalproducers few cost-saving options other than either applying less nitrogen fertilizeror shifting to less nitrogen-demanding crops.

CRS-28
34 GAO, Natural Gas: Domestic Nitrogen Fertilizer Production Depends on Natural GasAvailability and Prices, GAO-03-1148, Sept. 2003, p. 3.35 Ibid., p. 1.36 USDA, ERS, “Farm Income and Costs: Farm Sector Income,” February 6, 2004; availableat [http://www.ers.usda.gov/briefing/FarmIncome/nationalestimates.htm].
Fertilizer Supply Shortages? The nexus of sharply higher natural gas andfertilizer prices and declining domestic fertilizer production capacity came to a headin 2001 when, according to GAO, the U.S. fertilizer industry experienced a 25%decline in nitrogen production. However, GAO contends that the domestic supplyof nitrogen fertilizer “was adequate to meet farmers’ demand” due to two offsettingfactors: first, U.S. nitrogen imports increased 43%; and second, farm use of nitrogenfertilizer declined by 7%.34 Although these market adjustments served to keep supplyand demand in balance, they did so at sharply higher fertilizer price levels.According to fertilizer industry officials, although natural gas and fertilizer pricessubsided in 2002, their return to high levels in 2003 (see Figure 11) threaten to“irreversibly cripple” the U.S. fertilizer industry.35
Farm Income and Energy Prices
In February 2004, USDA projected U.S. net cash farm income at $55.9 billion.36
However, since the initial forecast was made, the outlook for crop and livestockprices has eroded substantially due to record crop projections and falling commodityprices, while the outlook for production expenses has risen due to higher energy andfertilizer prices (see Table 6).
Table 6. Fuel Price Changes, 2003 to 2004Fuel Unit Period 2003 2004 Change
— $/unit — %
Natural Gas mcfa April 1.88 5.20 177
Gasoline gallon April-Oct. 1.61 1.96 21
Diesel fuel gallon April-Oct. 1.47 1.80 23
Producer Prices Paid Index 1990-92 = 100 %
Fuel April-Oct. 133.9 161.8 21
Fertilizer April-Oct. 125.0 136.8 10
Chemicals April-Oct. 121.0 120.8 0
Source: DOE, EIA, for fuel prices at [http://www.eia.doe.gov]; and USDA, NASS, AgriculturalPrices, various issues for producer prices paid index at [http://www.nass.usda.gov].
amcf = 1,000 cubic feet.
Natural gas prices (wellhead) were running 177% above previous year levels,while national retail gasoline prices were 21% higher, diesel prices were 23% higher;and USDA’s prices paid index (PPI) for fuels and fertilizer were 21% and 10%

CRS-29
37 Calculated by applying hypothetical price changes to data projections provided by USDA,ERS, 2004 Farm Income Forecast, available at [http://www.ers.usda.gov/Briefing/FarmIncome/nationalestimates.htm].38 In 2002, 37% of the area planted to the top 22 crops (281.6 million acres) was cultivatedunder some type of conservation tillage, according to the Conservation TechnologyInformation Center at [http://www.ctic.purdue.edu/CTIC/CTIC.html].
higher, respectively, from a year earlier. The agricultural chemicals PPI showed noyear-to-year change.
What do these energy price changes mean for farm incomes? Becauseindividual farmers are “price-takers” and lack the capacity to quickly pass on highercosts through the food marketing chain, net farm income likely would be reduced inthe short term by the equivalent amount of any rise in production expenses.Assuming composite fuel (natural gas, gasoline, diesel, etc.) and electricity prices are21% higher, fertilizer prices are about 10% higher, and pesticide prices areunchanged (in accordance with the USDA PPI), then total energy costs would beabout $3.6 billion (or 8.4%) higher in 2004 than originally projected.37 Assumingroughly similar energy usage rates, this would represent a direct reduction from netcash income. However, the higher fuel costs would likely ripple through severalother production expenditure categories such as marketing costs and custom services,further cutting into the agricultural sector’s net returns. The bottom line is that theagricultural sector will likely feel the pinch of higher energy prices directly in theform of substantially lower net cash income than originally projected in 2004. Iffarmers perceive the energy price changes as likely to persist into 2005, thensubstantial crop and activity mix changes are likely to ensue.
Price Responsiveness to Energy Price Changes. Higher natural gasprices increase farm energy costs directly through higher fuel costs, and indirectlythrough higher fertilizer and pesticide costs. How agricultural producers respond toenergy price changes depends on both the time frame under consideration (i.e., withinseason versus across seasons) and the producer’s expectation of whether the pricechange is only temporary or will persist into the future.
If producers perceive an energy price change as temporary (lasting only for thecurrent crop season), their response may be limited to some small-scale efforts toeconomize on fuel use, perhaps by switching to fuel-saving cultivation methods (suchas minimum or no-till production),38 by applying smaller volumes of fertilizers andpesticides per acre than originally planned, or by switching between fuels (such asfrom natural gas to propane) if meaningful price differences exist. However, in theshort run (within a single growing season), once crops have been planted and majorinputs (such as fertilizers, pesticides, and fuels) have been purchased, a producer’sresponse to energy and fertilizer cost increases may be fairly limited.
If an energy price change is perceived as permanent, a producer is more likelyto adjust the farm’s activity mix and production practices from one season to the nextto compensate for the new revenue-cost structure.

CRS-30
39 Miranowski (2004).
Figure 20. U.S. Farm Fuel vs. Crude Oil Annual Prices,1973-2003
Economic studies have attempted to measure year-to-year producerresponsiveness to changes in prices. In the aggregate, studies suggest that a 10% risein fuel prices is associated with about a 6% decline in use.39 Fertilizer and pesticideuse are also negatively related to changes in their prices. A 10% rise in pricesinduces a 6.6% decrease in fertilizer use and a 5.3% decline in pesticide use. As withenergy use, changes in fertilizer and pesticide use may be obtained by switching toless intensive production methods, or to crops that use fewer inputs. However, theability for a producer to implement such changes is greatly diminished once a cropis planted and the production strategy has been set in motion. Instead, producers tendto respond to input price changes by altering their crop and activity mix from seasonto season. As a result, unexpected within-season price changes can have unavoidableimpacts on farm income.
Prices of Most Fuel Sources Tend to Move Together. Demand forrefined petroleum products in agricultural production is determined mainly by thenumber of acres planted and harvested, the production practice used to produce thecrops, weather conditions, and the relative prices for the various types of energy.Because the majority of energy used in the United States (and the world) is derivedfrom petroleum-based sources — gasoline, diesel, LP gas, and natural gas — theirprices tend to move together. This limits the success of switching among fuelsources to reduce energy costs (see Figure 20).
Food Price Effects?
A sustained increase in energy prices could be translated into higher food pricesfor consumers. Energy use adds to food production costs and consumer food pricesbeyond the farm gate in three stages: (1) food manufactured with energy-intensive

CRS-31
Figure 21. Distribution of a Dollar Spent on Food, 2000
technologies, (2) transportation of food products to regional markets in climatecontrolled cargo containers, and (3) storage and distribution of food items inenvironmentally controlled facilities. Food retailers are likely to use considerablymore energy than the average retailer to control the environment for perishable foodproducts around the clock, according to ERS.
ERS estimates that 3.5% of the cost of food is attributable to energy expenses,and 4% is attributable to transportation expenses (see Figure 21). (The energy billincludes only the costs of electricity, natural gas, and other fuels used in foodprocessing, wholesaling, retailing, and food-service establishments. Transportationfuel costs, except for those incurred for food wholesaling, are excluded.)
Farmers receive 19¢ for every $1 of consumer expenditures on food. Thismeans that 81¢ of the consumer food dollar is attributable to the marketers of food.These food processors, transporters, wholesalers, and retailers have a greatercapability than farmers for passing on their higher energy costs through theproduction-marketing system, and eventually to the consumer.
Source: “Food Marketing and Price Spreads: USDA Marketing Bill,” ERS, USDA, available at[http://www.ers.usda.gov/Briefing/FoodPriceSpreads/bill/].
Conclusions
Agriculture uses a small proportion of the nation’s energy. However, direct andindrect energy inputs are critical to agricultural production. Higher and unstableenergy prices can make agriculture unprofitable. As a result, agriculture may haveto find ways to become more energy independent.
CRS-32
40 USDA, 2002 Farm Bill, Title IX — Energy, online information available at [http://www.usda.gov/farmbill/energy_fb.html]. For more information see CRS Report RL31271, EnergyProvisions of the Farm Bill: Comparison of the New Law with Previous Law and House andSenate Bills.41 For more information, see State and Federal Incentives and Laws, at DOE’s AlternativeFuels Data Center, at [http://www.eere.energy.gov/afdc/laws/incen_laws.html].42 DOE, EIA, Table 1.2, “Energy Production by Source, 1949-2003,” and Table 1.3, “TotalU.S. Energy Consumption by Source.”43 For the status of pending energy legislation and additional related bill contents, see CRSIssue Brief IB10116, Energy Policy: The Continuing Debate and Omnibus EnergyLegislation, at [http://www.congress.gov/erp/ib/pdf/IB10116.pdf]. For a discussion of thetax provisions in the bills, see CRS Issue Brief IB10054, Energy Tax Policy.44 For more information, see CRS Report RL32204, Omnibus Energy Legislation:Comparison of Non-Tax Provisions in the H.R. 6 Conference Report and S. 2095; and CRSReport RL32078, Omnibus Energy Legislation: Comparison of Major Provisions in House-and Senate-Passed Versions of H.R. 6, Plus S. 14.
Public Laws and Bills Affecting Energy Use by Agriculture
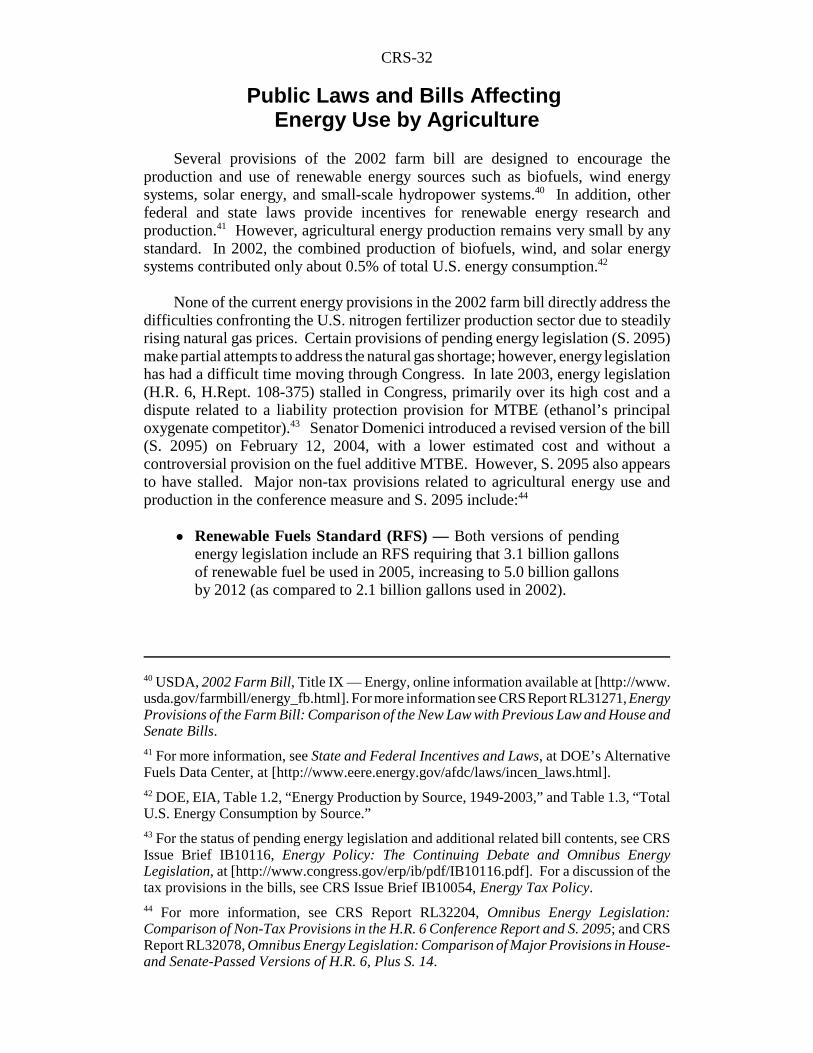
Several provisions of the 2002 farm bill are designed to encourage theproduction and use of renewable energy sources such as biofuels, wind energysystems, solar energy, and small-scale hydropower systems.40 In addition, otherfederal and state laws provide incentives for renewable energy research andproduction.41 However, agricultural energy production remains very small by anystandard. In 2002, the combined production of biofuels, wind, and solar energysystems contributed only about 0.5% of total U.S. energy consumption.42
None of the current energy provisions in the 2002 farm bill directly address thedifficulties confronting the U.S. nitrogen fertilizer production sector due to steadilyrising natural gas prices. Certain provisions of pending energy legislation (S. 2095)make partial attempts to address the natural gas shortage; however, energy legislationhas had a difficult time moving through Congress. In late 2003, energy legislation(H.R. 6, H.Rept. 108-375) stalled in Congress, primarily over its high cost and adispute related to a liability protection provision for MTBE (ethanol’s principaloxygenate competitor).43 Senator Domenici introduced a revised version of the bill(S. 2095) on February 12, 2004, with a lower estimated cost and without acontroversial provision on the fuel additive MTBE. However, S. 2095 also appearsto have stalled. Major non-tax provisions related to agricultural energy use andproduction in the conference measure and S. 2095 include:44
! Renewable Fuels Standard (RFS) — Both versions of pendingenergy legislation include an RFS requiring that 3.1 billion gallonsof renewable fuel be used in 2005, increasing to 5.0 billion gallonsby 2012 (as compared to 2.1 billion gallons used in 2002).

CRS-33
! Alaska Gas Pipeline — Alaska’s North Slope currently holds 30trillion cubic feet of undeveloped proven natural gas reserves, about18% of total U.S. reserves (or a little less than one-and-a-half yearsof U.S. consumption at current rates). Both bills presume a publicneed for the gas and would provide $18 billion in loan guarantees forconstruction of a natural gas pipeline from Alaska to Alberta, whereit would connect to the existing midwestern pipeline system.
! Energy Efficiency Standards — New statutory efficiency standardswould be established for several consumer and commercial productsand appliances. For certain other products and appliances, DOEwould be empowered to set new standards. For motor vehicles,funding would be authorized for the National Highway TrafficSafety Administration (NHTSA) to set Corporate Average FuelEconomy (CAFÉ) levels as provided in current law.
! Energy Production on Federal Lands — To encourage productionon federal lands, royalty reductions would be provided for marginaloil and gas wells on public lands and the outer continental shelf.Provisions are also included to increase access to federal lands byenergy projects — such as drilling activities, electric transmissionlines, and gas pipelines.
It is noteworthy that neither bill includes a provision for a Renewable EnergyPortfolio Standard (RPS). An RPS aims to encourage electricity production fromrenewable energy resources such as from wind energy systems.

CRS-34
45 The material for this appendix is taken from “What is a Btu?,” Agricultural Resources andEnvironmental Indicators, Agr. Handbook No. 705, Economic Research Service, USDA,December 1994.
Appendix Tables
What Is a Btu?45 A Btu (British thermal unit) is a measure of the heat contentof a fuel and indicates the amount of energy contained in the fuel. Because energysources vary by form (gas, liquid, or solid) and energy content, the use of Btu’sallows the adding of various types of energy using a common benchmark (see TableA1).
Table A1. Btu Conversion Chart
Fuel type UnitBtu’s per
unit GEGaAverage Price:
$ per GEGb
Direct Energy Types
Gasoline(conventional) gallon 125,071 Btu 1.00 $1.99
Ethanold gallon 76,000 Btu 0.61 na
Ethanol (E85) gallon 83,361 Btu 0.67 $2.52 - $2.99
Diesel fuel gallon 138,690 Btu 1.11 $1.54
Biodiesel (B20) gallon 138,690 Btu 1.11 $1.56 - $1.90
Natural Gasc 1,000 cubic foot 1,030 Btu 0.88 $1.16 - $1.75
LP gas or Propane gallon 91,333 Btu 0.73 $1.92 - $3.08
Electricity kilowatt-hour 3,413 Btu na na
Indirect Energy Types
Pesticides pound 97,914 Btu na na
Nitrogen pound 25,095 Btu na na
Phosphate pound 5,609 Btu na na
Potash pound 4,741 Btu na naSource: Conversion rates for petroleum-based fuels and electricity are from the DOE, Monthly EnergyReview, August 2004. Conversion rates for nitrogen, phosphate, potash, and pesticides are fromMahadev Bhat, Burton English, Anthony Turhollow, and Hezron Nyangito, Energy in SyntheticFertilizers and Pesticides: Revisited, Research Report # ORNL/Sub/90-99732/2, Oak Ridge NationalLaboratory, Oak Ridge, Tennessee, Jan. 1995.
na = not applicable.a GEG = gasoline equivalent gallon. The GEG allows for comparison across different forms — gas,liquid, kilowatt, etc. It is derived from the Btu content by first converting each fuel’s units to gallons;then dividing each fuel’s Btu unit rate by gasoline’s Btu unit rate of 125,000; finally multiplying eachfuel’s volume by the resulting ratio.b Prices are for mid-June 2004. The retail price per gallon has been converted to price per GEG units.DOE, The Alternative Fuel Price Report, June 29, 2004.c Converted to gallons as 4.62 million Btu per barrel or 110,000 Btu per gallon.d Net heat content used here. Gross heat content is 84,262 Btu per barrel.

CRS-35
Table A2. U.S. Farm Energy Costs in Production, by Activity, 2002
Activitiesa
Cropland
TotalProduction
Costs
TotalEnergyCosts
Direct Energy Costs Indirect Energy Costs
Fuel &oils
Util-itiesb
TotalDirect
Chem-icals
Fert-ilizersc
TotalIndirect
1,000 ac. —————————————— $ million —————————————
Crop Activities 294,822 80,343 18,364 3,996 2,630 6,625 6,648 7,722 14,371
Oilseed & grain 204,555 35,584 9,824 1,963 753 2,716 3,179 4,683 7,862
Vegetable & melons 8,639 9,184 2,011 359 408 766 869 784 1,653
Fruit & tree nuts 6,790 10,553 1,747 302 491 793 924 521 1,446
Cotton 14,590 3,513 1,259 215 125 340 656 388 1,044
Greenhouse & nurseryd 2,497 10,514 979 394 381 775 237 348 585
Tobacco 3,576 1,280 356 96 37 133 109 151 260
Other cropse 54,175 9,715 2,188 667 435 1,102 674 847 1,521
Livestock Activities 139,343 95,857 5,701 2,681 2,243 4,923 992 2,028 3,021
Beef cattle ranching 89,838 20,038 2,323 1,029 527 1,556 314 980 1,294
Dairy cattle & milk prod. 11,505 18,451 1,241 488 625 1,113 267 486 753
Cattle feedlots 19,231 22,143 577 231 147 378 125 220 346
Poultry & egg prod. 3,020 17,649 534 411 451 862 60 63 123
Hog & pig farming 6,288 11,312 526 215 244 458 156 156 312
Aquaculture & other 7,991 5,617 445 267 226 493 66 112 178
Sheep & goat farming 1,470 647 55 40 23 63 4 11 15
United States 434,165 173,199 24,036 6,675 4,875 11,550 7,609 9,751 17,360Source: USDA, NASS, 2002 Census of Agriculture.
a Activities are organized by North American Industry Classification Ssytem (NAICS), see “Appendix A” of 2002 Census of Agriculture for details;available at [http://www.nass.usda.gov/census/census02/volume1/us/index1.htm].b Includes electricity, telephone charges, internet fees, and water purchased in 2002.c Includes lime and soil conditioners.d Includes floriculture. e Includes hay, sugar cane, sugar beets, and all other crops.

CRS-36
Table A3. Energy Cost Shares of Total Production Costs, by Activity, 2002
ActivitiesaTotal
ProductionCosts
TotalEnergyCosts
Direct Energy Costs Indirect Energy Costs
Fuel &oils
Util-itiesb
TotalDirect
Chem-icals
Fert-ilizersc
TotalIndirect
——————————————————— Percent ———————————————————
Crop Activities 100% 22.9 5.0 3.3 8.2 8.3 9.6 17.9
Oilseed & grain 100% 27.6 5.5 2.1 7.6 8.9 13.2 22.1
Vegetable & melons 100% 21.9 3.9 4.4 8.3 9.5 8.5 18.0
Fruit & tree nuts 100% 16.6 2.9 4.7 7.5 8.8 4.9 13.7
Cotton 100% 35.8 6.1 3.6 9.7 18.7 11.0 29.7
Greenhouse & nurseryd 100% 9.3 3.7 3.6 7.4 2.3 3.3 5.6
Tobacco 100% 27.8 7.5 2.9 10.4 8.5 11.8 20.3
Other cropse 100% 22.5 6.9 4.5 11.3 6.9 8.7 15.7
Livestock Activities 100% 5.9 2.8 2.3 5.1 1.0 2.1 3.2
Beef cattle ranching 100% 11.6 5.1 2.6 7.8 1.6 4.9 6.5
Dairy cattle & milk prod. 100% 6.7 2.6 3.4 6.0 1.4 2.6 4.1
Cattle feedlots 100% 2.6 1.0 0.7 1.7 0.6 1.0 1.6
Poultry & egg prod. 100% 3.0 2.3 2.6 4.9 0.3 0.4 0.7
Hog & pig farming 100% 4.6 1.9 2.2 4.0 1.4 1.4 2.8
Aquaculture & other 100% 7.9 4.8 4.0 8.8 1.2 2.0 3.2
Sheep & goat farming 100% 8.5 6.2 3.6 9.7 0.6 1.7 2.3
United States 100% 13.7 3.8 2.8 6.6 4.3 5.5 9.9
Source: USDA, NASS, 2002 Census of Agriculture.
a Activities are organized by North American Industry Classification Ssytem (NAICS), see “Appendix A” of 2002 Census of Agriculture for details;available at [http://www.nass.usda.gov/census/census02/volume1/us/index1.htm].b Includes electricity, telephone charges, internet fees, and water purchased in 2002.c Includes lime and soil conditioners.d Includes floriculture. e Includes hay, sugar cane, sugar beets, and all other crops.
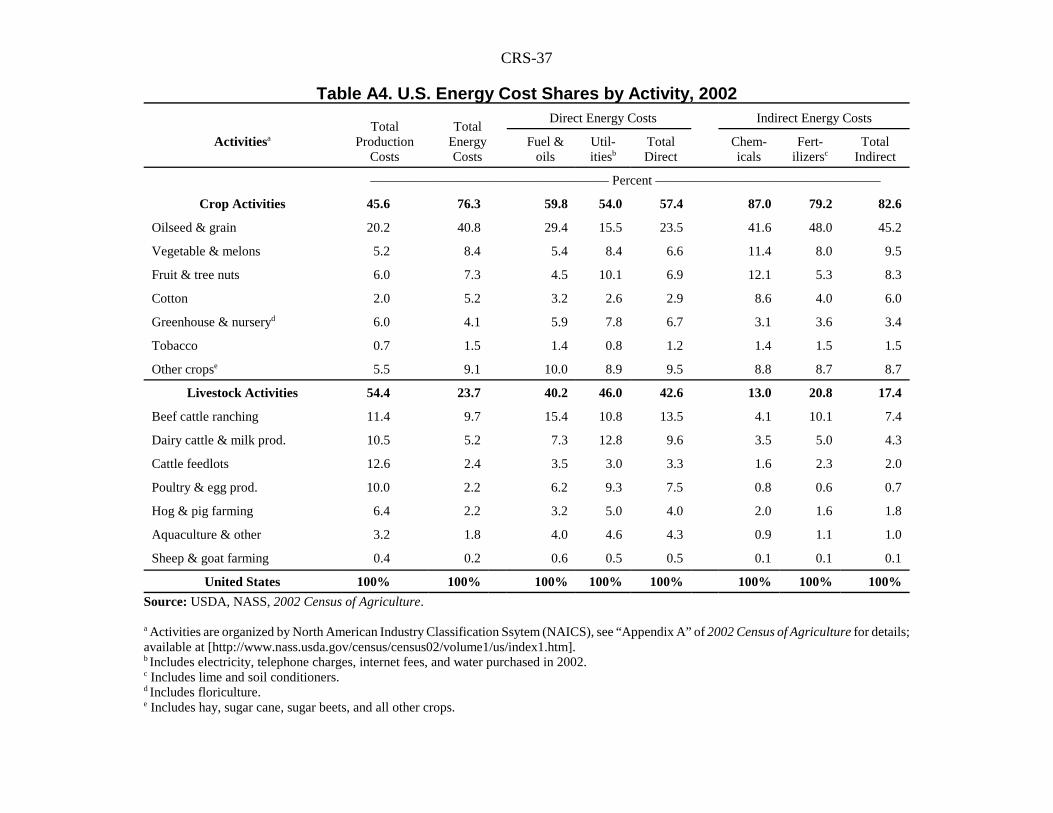
CRS-37
Table A4. U.S. Energy Cost Shares by Activity, 2002
ActivitiesaTotal
ProductionCosts
TotalEnergyCosts
Direct Energy Costs Indirect Energy Costs
Fuel &oils
Util-itiesb
TotalDirect
Chem-icals
Fert-ilizersc
TotalIndirect
—————————————————— Percent —————————————————
Crop Activities 45.6 76.3 59.8 54.0 57.4 87.0 79.2 82.6
Oilseed & grain 20.2 40.8 29.4 15.5 23.5 41.6 48.0 45.2
Vegetable & melons 5.2 8.4 5.4 8.4 6.6 11.4 8.0 9.5
Fruit & tree nuts 6.0 7.3 4.5 10.1 6.9 12.1 5.3 8.3
Cotton 2.0 5.2 3.2 2.6 2.9 8.6 4.0 6.0
Greenhouse & nurseryd 6.0 4.1 5.9 7.8 6.7 3.1 3.6 3.4
Tobacco 0.7 1.5 1.4 0.8 1.2 1.4 1.5 1.5
Other cropse 5.5 9.1 10.0 8.9 9.5 8.8 8.7 8.7
Livestock Activities 54.4 23.7 40.2 46.0 42.6 13.0 20.8 17.4
Beef cattle ranching 11.4 9.7 15.4 10.8 13.5 4.1 10.1 7.4
Dairy cattle & milk prod. 10.5 5.2 7.3 12.8 9.6 3.5 5.0 4.3
Cattle feedlots 12.6 2.4 3.5 3.0 3.3 1.6 2.3 2.0
Poultry & egg prod. 10.0 2.2 6.2 9.3 7.5 0.8 0.6 0.7
Hog & pig farming 6.4 2.2 3.2 5.0 4.0 2.0 1.6 1.8
Aquaculture & other 3.2 1.8 4.0 4.6 4.3 0.9 1.1 1.0
Sheep & goat farming 0.4 0.2 0.6 0.5 0.5 0.1 0.1 0.1
United States 100% 100% 100% 100% 100% 100% 100% 100%
Source: USDA, NASS, 2002 Census of Agriculture.
a Activities are organized by North American Industry Classification Ssytem (NAICS), see “Appendix A” of 2002 Census of Agriculture for details;available at [http://www.nass.usda.gov/census/census02/volume1/us/index1.htm].b Includes electricity, telephone charges, internet fees, and water purchased in 2002.c Includes lime and soil conditioners.d Includes floriculture. e Includes hay, sugar cane, sugar beets, and all other crops.

CRS-38
Table A5. U.S. Farm Energy Costs in Production, by Region, 2003
RegionsaArea
Planted
TotalProd-uctionCosts
TotalEnergyCosts
Direct Energy Costs Indirect Energy Costs
Diesel GasLPGas
OtherFuelb
TotalFuels
Elec-tricityc
TotalDirect
Chem-icals
Fert-ilizers
TotalIndirect
1,000 ac ———————————————————— $ million ————————————————————
Corn Belt 84,425 35,810 6,362 564 230 225 71 1,090 542 1,632 2,030 2,700 4,730
Pacific 11,014 32,300 4,173 395 246 54 105 800 983 1,783 1,280 1,110 2,390
No. Plains 81,844 26,070 4,076 603 247 81 99 1,030 416 1,446 1,200 1,430 2,630
Lake States 35,022 19,290 2,987 373 139 134 44 690 347 1,037 880 1,070 1,950
So. Plains 34,904 17,170 2,308 388 213 43 106 750 368 1,118 430 760 1,190
Appalachian 16,164 16,250 2,074 235 171 92 32 530 294 824 510 740 1,250
Mountain 24,902 16,510 1,994 291 202 54 23 570 344 914 440 640 1,080
Southeast 8,472 12,850 1,965 172 97 111 29 409 276 685 570 710 1,280
Delta 15,761 9,850 1,844 251 90 78 21 440 204 644 710 490 1,200
Northeast 12,650 12,800 1,289 158 125 48 59 390 249 639 300 350 650
U.S. Total 325,158 198,900 29,069 3,430 1,760 920 589 6,699 4,020 10,719 8,350 10,000 18,350
Source: Area data is for major crops: USDA, NASS, Acreage, June 30, 2004. Farm production expenses data: USDA, NASS, Farm ProductionExpenditures, 2003 Summary, July 2004.
a The 14 regions consist of the following states: Northeast: CT, DE, ME, MD, MA, NH, NJ, NY, PA, RI, VT; Lake States: MI, MN, WI; Corn Belt:IL, IN, IA, MO, OH; Northern Plains: KS, NE, ND, SD; Appalachian: KY, NC, TN, VA, WV; Southeast: AL, FL, GA, SC; Delta: AR, LA, MS;Southern Plains: OK, TX; Mountain: AZ, CO, ID, MT, NV, NM, UT, WY; and Pacific: CA, OR, WA.b Other fuels includes natural gas, coal, fuel oil, kerosene, wood, etc.c Electricity is approximated as 15% of farm services expenses.

CRS-39
Table A6. Energy Cost Shares of Total Production Costs, by Region, 2003
Regionsa
TotalProduction
Costs
TotalEnergyCosts
Direct Energy Costs Indirect Energy Costs
Diesel GasLPGas
OtherFuelb
TotalFuels
Elec-tricityc
TotalDirect
Chem-icals
Fert-ilizers
TotalIndirect
——————————————————————— Percent —————————————————————
Corn Belt 100% 17.8 1.6 0.6 0.6 0.2 3.0 1.5 4.6 5.7 7.5 13.2
Pacific 100% 12.9 1.2 0.8 0.2 0.3 2.5 3.0 5.5 4.0 3.4 7.4
No. Plains 100% 15.6 2.3 0.9 0.3 0.4 4.0 1.6 5.5 4.6 5.5 10.1
Lake States 100% 15.5 1.9 0.7 0.7 0.2 3.6 1.8 5.4 4.6 5.5 10.1
So. Plains 100% 13.4 2.3 1.2 0.3 0.6 4.4 2.1 6.5 2.5 4.4 6.9
Appalachian 100% 12.8 1.4 1.1 0.6 0.2 3.3 1.8 5.1 3.1 4.6 7.7
Mountain 100% 12.1 1.8 1.2 0.3 0.1 3.5 2.1 5.5 2.7 3.9 6.5
Southeast 100% 15.3 1.3 0.8 0.9 0.2 3.2 2.1 5.3 4.4 5.5 10.0
Delta 100% 18.7 2.5 0.9 0.8 0.2 4.5 2.1 6.5 7.2 5.0 12.2
Northeast 100% 10.1 1.2 1.0 0.4 0.5 3.0 1.9 5.0 2.3 2.7 5.1
U.S. Total 100% 14.6 1.7 0.9 0.5 0.3 3.4 2.0 5.4 4.2 5.0 9.2
Source: Area data is for major crops: USDA, NASS, Acreage, June 30, 2004. Farm production expenses data: USDA, NASS, Farm ProductionExpenditures, 2003 Summary, July 2004.
a The 14 regions consist of the following states: Northeast: CT, DE, ME, MD, MA, NH, NJ, NY, PA, RI, VT; Lake States: MI, MN, WI; Corn Belt:IL, IN, IA, MO, OH; Northern Plains: KS, NE, ND, SD; Appalachian: KY, NC, TN, VA, WV; Southeast: AL, FL, GA, SC; Delta: AR, LA, MS;Southern Plains: OK, TX; Mountain: AZ, CO, ID, MT, NV, NM, UT, WY; and Pacific: CA, OR, WA.b Other fuels includes natural gas, coal, fuel oil, kerosene, wood, etc.c Electricity is approximated as 15% of farm services expenses.

CRS-40
Table A7. Regional Shares of U.S. Energy Costs by Type, 2003
Regionsa
TotalProd-uctionCosts
TotalEnergyCosts
Direct Energy Costs Indirect Energy Costs
Diesel GasLPGas
OtherFuelb
TotalFuels
Elec-tricityc
TotalDirect
Chem-icals
Fert-ilizers
TotalIndirect
—————————————————————— Percent ——————————————————————
Corn Belt 18.0 21.9 16.4 13.1 24.5 12.1 16.3 13.5 15.2 24.3 27.0 25.8
Pacific 16.2 14.4 11.5 14.0 5.9 17.8 11.9 24.5 16.6 15.3 11.1 13.0
No. Plains 13.1 14.0 17.6 14.0 8.8 16.8 15.4 10.3 13.5 14.4 14.3 14.3
Lake States 9.7 10.3 10.9 7.9 14.6 7.5 10.3 8.6 9.7 10.5 10.7 10.6
So. Plains 8.6 7.9 11.3 12.1 4.7 18.0 11.2 9.1 10.4 5.1 7.6 6.5
Appalachian 8.2 7.1 6.9 9.7 10.0 5.4 7.9 7.3 7.7 6.1 7.4 6.8
Mountain 8.3 6.9 8.5 11.5 5.9 3.9 8.5 8.5 8.5 5.3 6.4 5.9
Southeast 6.5 6.8 5.0 5.5 12.1 4.9 6.1 6.9 6.4 6.8 7.1 7.0
Delta 5.0 6.3 7.3 5.1 8.5 3.6 6.6 5.1 6.0 8.5 4.9 6.5
Northeast 6.4 4.4 4.6 7.1 5.2 10.0 5.8 6.2 6.0 3.6 3.5 3.5
U.S. Total 100% 100% 100% 100% 100% 100% 100% 100% 100% 100% 100% 100%
Source: Area data is for major crops: USDA, NASS, Acreage, June 30, 2004. Farm production expenses data: USDA, NASS, Farm ProductionExpenditures, 2003 Summary, July 2004.
a The 14 regions consist of the following states: Northeast: CT, DE, ME, MD, MA, NH, NJ, NY, PA, RI, VT; Lake States: MI, MN, WI; Corn Belt:IL, IN, IA, MO, OH; Northern Plains: KS, NE, ND, SD; Appalachian: KY, NC, TN, VA, WV; Southeast: AL, FL, GA, SC; Delta: AR, LA, MS;Southern Plains: OK, TX; Mountain: AZ, CO, ID, MT, NV, NM, UT, WY; and Pacific: CA, OR, WA.b Other fuels includes natural gas, coal, fuel oil, kerosene, wood, etc.c Electricity is approximated as 15% of farm services expenses.