CRS Report for Congress - DTIC · CRS Report for Congress Received through the CRS Web Order Code...
37
Congressional Research Service ˜ The Library of Congress CRS Report for Congress Received through the CRS Web Order Code RL33434 Science, Technology, Engineering, and Mathematics (STEM) Education Issues and Legislative Options Updated July 26, 2006 Jeffrey J. Kuenzi Analyst in Social Legislation Domestic Social Policy Division Christine M. Matthews Specialist in Science and Technology Policy Resources, Science, and Industry Division Bonnie F. Mangan Information Research Specialist Domestic Social Policy Division
Transcript of CRS Report for Congress - DTIC · CRS Report for Congress Received through the CRS Web Order Code...

Congressional Research Service ˜ The Library of Congress
CRS Report for CongressReceived through the CRS Web
Order Code RL33434
Science, Technology, Engineering, andMathematics (STEM) Education Issues
and Legislative Options
Updated July 26, 2006
Jeffrey J. KuenziAnalyst in Social Legislation
Domestic Social Policy Division
Christine M. MatthewsSpecialist in Science and Technology Policy
Resources, Science, and Industry Division
Bonnie F. ManganInformation Research SpecialistDomestic Social Policy Division

Report Documentation Page Form ApprovedOMB No. 0704-0188
Public reporting burden for the collection of information is estimated to average 1 hour per response, including the time for reviewing instructions, searching existing data sources, gathering andmaintaining the data needed, and completing and reviewing the collection of information. Send comments regarding this burden estimate or any other aspect of this collection of information,including suggestions for reducing this burden, to Washington Headquarters Services, Directorate for Information Operations and Reports, 1215 Jefferson Davis Highway, Suite 1204, ArlingtonVA 22202-4302. Respondents should be aware that notwithstanding any other provision of law, no person shall be subject to a penalty for failing to comply with a collection of information if itdoes not display a currently valid OMB control number.
1. REPORT DATE 26 JUL 2006 2. REPORT TYPE
3. DATES COVERED 00-00-2006 to 00-00-2006
4. TITLE AND SUBTITLE Science, Technology, Engineering, and Mathematics (STEM) EducationIssues and Legislative Options
5a. CONTRACT NUMBER
5b. GRANT NUMBER
5c. PROGRAM ELEMENT NUMBER
6. AUTHOR(S) 5d. PROJECT NUMBER
5e. TASK NUMBER
5f. WORK UNIT NUMBER
7. PERFORMING ORGANIZATION NAME(S) AND ADDRESS(ES) Congressional Research Service, The Library of Congress,101Independence Avenue, SE,Washington,DC,20540-7500
8. PERFORMING ORGANIZATIONREPORT NUMBER
9. SPONSORING/MONITORING AGENCY NAME(S) AND ADDRESS(ES) 10. SPONSOR/MONITOR’S ACRONYM(S)
11. SPONSOR/MONITOR’S REPORT NUMBER(S)
12. DISTRIBUTION/AVAILABILITY STATEMENT Approved for public release; distribution unlimited
13. SUPPLEMENTARY NOTES
14. ABSTRACT
15. SUBJECT TERMS
16. SECURITY CLASSIFICATION OF: 17. LIMITATION OF ABSTRACT Same as
Report (SAR)
18. NUMBEROF PAGES
36
19a. NAME OFRESPONSIBLE PERSON
a. REPORT unclassified
b. ABSTRACT unclassified
c. THIS PAGE unclassified
Standard Form 298 (Rev. 8-98) Prescribed by ANSI Std Z39-18

Science, Technology, Engineering, and Mathematics(STEM) Education Issues and Legislative Options
Summary
There is growing concern that the United States is not preparing a sufficientnumber of students, teachers, and practitioners in the areas of science, technology,engineering, and mathematics (STEM). A large majority of secondary schoolstudents fail to reach proficiency in math and science, and many are taught byteachers lacking adequate subject matter knowledge.
When compared to other nations, the math and science achievement of U.S.pupils and the rate of STEM degree attainment appear inconsistent with a nationconsidered the world leader in scientific innovation. In a recent internationalassessment of 15-year-old students, the U.S. ranked 28th in math literacy and 24th inscience literacy. Moreover, the U.S. ranks 20th among all nations in the proportionof 24-year-olds who earn degrees in natural science or engineering.
A recent study by the Government Accountability Office found that 207 distinctfederal STEM education programs were appropriated nearly $3 billion in FY2004.Nearly three-quarters of those funds and nearly half of the STEM programs were intwo agencies — the National Institutes of Health and the National ScienceFoundation. Still, the study concluded that these programs are highly decentralizedand require better coordination.
Several pieces of legislation have been introduced in the 109th Congress thataddress U.S. economic competitiveness in general and support STEM education inparticular. These proposals are designed to improve output from the STEMeducational pipeline at all levels, and are drawn from several recommendationsoffered by the scientific and business communities.
The objective of this report is to provide a useful context for these legislativeproposals. To achieve this, the report first presents data on the state of STEMeducation and then examines the federal role in promoting STEM education. Thereport concludes with a discussion of selected legislative options currently beingconsidered to improve STEM education. The report will be updated as significantlegislative actions occur.
Contents
Introduction . . . . . . . . . . . . . . . . . . . . . . . . . . . . . . . . . . . . . . . . . . . . . . . . . . . . . . 1
STEM Education in the United States . . . . . . . . . . . . . . . . . . . . . . . . . . . . . . . . . . 3Elementary and Secondary Education . . . . . . . . . . . . . . . . . . . . . . . . . . . . . . 3
Assessments of Math and Science Knowledge . . . . . . . . . . . . . . . . . . . 3U.S. Students Compared to Students in Other Nations . . . . . . . . . . . . . 5
Math and Science Teacher Quality . . . . . . . . . . . . . . . . . . . . . . . . . . . . . . . . 9Postsecondary Education . . . . . . . . . . . . . . . . . . . . . . . . . . . . . . . . . . . . . . . 10
STEM Degrees Awarded in the United States . . . . . . . . . . . . . . . . . . . 10U.S. Degrees Awarded to Foreign Students . . . . . . . . . . . . . . . . . . . . 14International Postsecondary Educational Attainment . . . . . . . . . . . . . 14International Comparisons in STEM Education . . . . . . . . . . . . . . . . . 16
Federal Programs that Promote STEM Education . . . . . . . . . . . . . . . . . . . . . . . . 18Government Accountability Office Study . . . . . . . . . . . . . . . . . . . . . . . . . . 18Description of Selected Federal STEM Programs . . . . . . . . . . . . . . . . . . . . 19
NIH National Research Service Awards . . . . . . . . . . . . . . . . . . . . . . . 19NSF Graduate Research Fellowships . . . . . . . . . . . . . . . . . . . . . . . . . . 20NSF Mathematics and Science Partnerships . . . . . . . . . . . . . . . . . . . . 21NSF Research Experiences for Undergraduates . . . . . . . . . . . . . . . . . 22NASA Minority University Research Education Program . . . . . . . . . 23ED Mathematics and Science Partnerships . . . . . . . . . . . . . . . . . . . . . 23
Proposals to Improve STEM Education . . . . . . . . . . . . . . . . . . . . . . . . . . . . . . . . 24Recommendations by the Scientific Community . . . . . . . . . . . . . . . . . . . . . 25Legislation in the 109th Congress . . . . . . . . . . . . . . . . . . . . . . . . . . . . . . . . . 26
Secondary School Math and Science Preparation . . . . . . . . . . . . . . . . 27Recruiting and Retaining New STEM Teachers . . . . . . . . . . . . . . . . . 27Upgrading the STEM Skills of Current Teachers . . . . . . . . . . . . . . . . 28Increase STEM Baccalaureate Degree Attainment . . . . . . . . . . . . . . . 29Graduate Research and Early-Career Scholarship . . . . . . . . . . . . . . . . 30Federal Program Coordination . . . . . . . . . . . . . . . . . . . . . . . . . . . . . . . 32
List of Figures
Figure 1. Percentages of Students Scoring Basic and Proficient in Math, Selected Years: 1990-2005 . . . . . . . . . . . . . . . . . . . . . . 4
Figure 2. STEM Degrees Awarded, 1970-2003 . . . . . . . . . . . . . . . . . . . . . . . . . 13Figure 3. Population 15 Years Old or Older With
Tertiary Education by Country, 1980 and 2000 . . . . . . . . . . . . . . . . . . . . . . 16

List of Tables
Table 1. TIMSS Scores by Grade and Country/Jurisdiction, 2003 . . . . . . . . . . . . 6Table 2. PISA Math and Science Scores, 2003 . . . . . . . . . . . . . . . . . . . . . . . . . . . 8Table 3. Percentage of Middle and High School Teachers
Lacking a Major or Minor in Subject Taught, 1999-2000 . . . . . . . . . . . . . . 10Table 4. Degrees Conferred by Degree-Granting Institutions
by Academic Level and Field of Study, 2002-2003 . . . . . . . . . . . . . . . . . . . 12Table 5. Field of First University Degree, by Selected Region
and Country, 2002 or the Most Recent Year Available . . . . . . . . . . . . . . . . 17

1 In 2005 and early 2006, at least six major reports were released by highly respected U.S.academic, scientific, and business organizations on the need to improve science andmathematics education: The Education Commission of the States, Keeping AmericaCompetitive: Five Strategies To Improve Mathematics and Science Education, July 2005;The Association of American Universities, National Defense Education and InnovationInitiative, Meeting America’s Economic and Security Challenges in the 21st Century,January 2006; The National Academy of Sciences, Committee on Science, Engineering, andPublic Policy, Rising Above the Gathering Storm: Energizing and Employing America fora Brighter Economic Future, February 2006; The National Summit on Competitiveness,Statement of the National Summit on Competitiveness: Investing in U.S. Innovation,December 2005; The Business Roundtable, Tapping America’s Potential: The Educationfor Innovation Initiative, July 2005; the Center for Strategic and International Studies,Waiting for Sputnik, 2005.
Science, Technology, Engineering, and Mathematics (STEM) Education Issues
and Legislative Options
Introduction
There is growing concern that the United States is not preparing a sufficientnumber of students, teachers, and professionals in the areas of science, technology,engineering, and mathematics (STEM).1 Although the most recent NationalAssessment of Educational Progress (NAEP) results show improvement in U.S.pupils’ knowledge of math and science, the large majority of students still fail toreach adequate levels of proficiency. When compared to other nations, theachievement of U.S. pupils appears inconsistent with the nation’s role as a worldleader in scientific innovation. For example, among the 40 countries participatingin the 2003 Program for International Student Assessment (PISA), the U.S. ranked28th in math literacy and 24th in science literacy.
Some attribute poor student performance to an inadequate supply of qualifiedteachers. This appears to be the case with respect to subject-matter knowledge:many U.S. math and science teachers lack an undergraduate major or minor in thosefields — as many as half of those teaching in middle school math. Indeed, post-secondary degrees in math and physical science have steadily decreased in recentdecades as a proportion of all STEM degrees awarded. While degrees in someSTEM fields (particularly biology and computer science) have increased in recentdecades, the overall proportion of STEM degrees awarded in the United States hashistorically remained at about 17% of all postsecondary degrees awarded.Meanwhile, many other nations have seen rapid growth in postsecondary educationalattainment — with particularly high growth in the number of STEM degreesawarded. According to the National Science Foundation, the United States currently

CRS-2
2 U.S. Government Accountability Office, Federal Science, Technology, Engineering, andMathematics Programs and Related Trends, GAO-06-114, Oct. 2005. 3 These points were reiterated by Cornelia M. Ashby, Director of GAO’s Education,Workforce, and Income Security Team. Her testimony can be found at [http://edworkforce.house.gov/hearings/109th/fc/competitiveness050306/wl5306.htm], as well as on the GAOwebsite at [http://www.gao.gov/new.items/d06702t.pdf].4 Office of Science and Technology Policy, Domestic Policy Council, AmericanCompetitiveness Initiative — Leading the World In Innovation, Feb. 2006.
ranks 20th among all nations in the proportion of 24-year-olds who earn degrees innatural science or engineering. Once a leader in STEM education, the United Statesis now far behind many countries on several measures.
What has been the federal role in promoting STEM education? A recent studyby the Government Accountability Office (GAO) found that 207 distinct federalSTEM education programs were appropriated nearly $3 billion in FY2004.2 Nearlythree-quarters of those funds supported 99 programs in two agencies — the NationalInstitutes of Health (NIH) and the National Science Foundation (NSF). Most of the207 programs had multiple goals, provided multiple types of assistance, and weretargeted at multiple groups. The study concluded that these programs are highlydecentralized and could benefit from stronger coordination, while noting that thecreation of the National Science and Technology Council in 1993 was a step in theright direction.3
Several pieces of legislation have been introduced in the 109th Congress thatwould support STEM education in the United States. Many of the proposals in thesebills have been influenced by the recommendations of several reports recently issuedby the scientific, business, and policy-making communities. Of particular influencehas been a report issued by the National Academy of Sciences (NAS), Rising Abovethe Gathering Storm: Energizing and Employing America for a Brighter EconomicFuture — also known as the “Augustine” report. Many of the recommendationsappearing in the NAS report are also contained in the Administration’s AmericanCompetitiveness Initiative.4 Among the report’s many recommendations, five aretargeted at improving STEM education. These five recommendations seek toincrease the supply of new STEM teachers, improve the skills of current STEMteachers, enlarge the pre-collegiate pipeline, increase postsecondary degreeattainment, and enhance support for graduate and early-career research.
The purpose of this report is to put these legislative proposals into a usefulcontext. The first section analyzes data from various sources to build a morethorough understanding of the status of STEM education in the United States. Thesecond section looks at the federal role in promoting STEM education, providing abroad overview of nearly all of the programs in federal agencies and a detailed lookat a few selected programs. Finally, the third section discusses legislative optionscurrently being considered to improve STEM education. This discussion focusesprimarily on the proposals that have seen congressional action to date.

CRS-3
5 For more information on NAEP and other assessments, see CRS Report RL31407,Educational Testing: Implementation of ESEA Title I-A Requirements Under the No ChildLeft Behind Act, by Wayne C. Riddle.6 The National Assessment Governing Board is an independent, bipartisan group created byCongress in 1988 to set policy for the NAEP. More information on the board and NAEPachievement levels can be found at [http://www.nagb.org/].
STEM Education in the United States
Elementary and Secondary Education
Assessments of Math and Science Knowledge. National-levelassessment of U.S. students’ knowledge of math and science is a relatively recentphenomenon, and assessments in other countries that provide for internationalcomparisons are even more recent. Yet the limited information available thus far isbeginning to reveal results that concern many individuals interested in the U.S.educational system and the economy’s future competitiveness. The most recentassessments show improvement in U.S. pupils’ knowledge of math and science;however, the large majority still fail to reach adequate levels of proficiency.Moreover, when compared to other nations, the achievement of U.S. students is seenby many as inconsistent with the nation’s role as a world leader in scientificinnovation.
The National Assessment of Educational Progress (NAEP) is the only nationallyrepresentative, continuing assessment of elementary and secondary students’ mathand science knowledge. Since 1969, NAEP has assessed students from both publicand nonpublic schools at grades 4, 8, and 12. Students’ performance on theassessment is measured on a 0-500 scale, and beginning in 1990 has been reportedin terms of the percentages of students attaining three achievement levels: basic,proficient, and advanced.5
Proficient is the level identified by the National Assessment Governing Boardas the degree of academic achievement that all students should reach, and “representssolid academic performance. Students reaching this level have demonstratedcompetency over challenging subject matter.” In contrast, the board states that“Basic denotes partial mastery of the knowledge and skills that are fundamental forproficient work at a given grade.”6
The most recent NAEP administration occurred in 2005. Figure 1 displays theavailable results from the NAEP math tests administered between 1990 and 2005.Although the proportion of 4th and 8th grade students achieving the proficient levelor above has been increasing each year, overall math performance has been quite low.The percentage performing at the basic level has not improved in 15 years. Abouttwo in five students continue to achieve only partial mastery of math. In 2005, onlyabout one-third of 4th and 8th grade students performed at the proficient level in math

CRS-4
7 U.S. Department of Education, National Center for Education Statistics, The Nation’sReport Card: Mathematics 2005, (NCES 2006-453), Oct. 2005, p. 3.8 The reporting delay for the 2005 grade 12 math assessments is due, in part, to substantialchanges made in the assessment framework, and will not include comparisons to resultsfrom previous years.9 U.S. Department of Education, National Center for Education Statistics, The Nation’sReport Card: Mathematics 2000 (NCES 2001-517) Aug. 2001, Figure B.
Figure 1. Percentages of Students Scoring Basic and Proficient in Math, Selected Years: 1990-2005
— 36% and 30%, respectively.7 The remainder of students — approximately 20%of 4th graders and just over 30% of 8th graders — scored below the basic level.
Source: U.S. Department of Education, National Center for Education Statistics, The Nation’s ReportCard, various years.
For 12th grade students, the most recently published NAEP results are from the2000 assessments.8 Only 17% of 12th grade students performed at the proficient orhigher level on the math assessment that year.9 This figure was only slightly higherthan the previous two assessments in 1996 (16%) and 1992 (15%), but wassignificantly higher, in statistical terms, than the 12% reported proficient in 1990.Progress aside, it appears that very few students graduate from U.S. high schools withmath skills considered adequate. More than half of all 12th grade students performedbelow even the basic level in each assessment year except 1996.

CRS-5
10 U.S. Department of Education, National Center for Education Statistics, The Nation’sReport Card: Science 2005 (NCES 2006-466) May 2006, Figures 4, 14, and 24.11 More information on the development of this assessment can be found in archived CRSReport 86-683, Comparison of the Achievement of American Elementary and SecondaryPupils with Those Abroad — The Examinations Sponsored by the International Associationfor the Evaluation of Educational Achievement (IEA), by Wayne C. Riddle (available onrequest).12 Performance on the 1995 TIMSS assessment was normalized on a scale in which theaverage was set at 500 and the standard deviation at 100. Each country was weighted so thatits students contributed equally to the mean and standard deviation of the scale. To providetrend estimates, subsequent TIMSS assessments are pegged to the 1995 average.13 All the TIMSS results in this report were taken from, Patrick Gonzales, Juan CarlosGuzmán, Lisette Partelow, Erin Pahlke, Leslie Jocelyn, David Kastberg, and TrevorWilliams, Highlights From the Trends in International Mathematics and Science Study(TIMSS) 2003 (NCES 2005 — 005), Dec. 2004.
Similarly low levels of achievement have been found with regard to knowledgeof science. Less than one-third of 4th and 8th grade students and less than one-fifthof 12th grade students score at or above proficient in science. In 2005, the percentageof 4th, 8th, and 12th grade students scoring proficient or above was 29%, 29%, and18%, respectively; compared to 27%, 30%, and 18% in 2000 and 28%, 29%, and21% in 1996.10
U.S. Students Compared to Students in Other Nations. Anotherrelatively recent development in the area of academic assessment has been the effortby a number of nations to produce reliable cross-national comparison data.11 TheTrends in International Mathematics and Science Study (TIMSS) assessesachievement in these subjects at grades 4 and 8 among students in several countriesaround the world. TIMSS has been administered to 4th grade students on twooccasions (1995 and 2003) and to 8th grade students on three occasions (1995, 1999,and 2003). In the latest administration, 25 countries participated in assessments oftheir 4th grade students, and 45 countries participated in assessments of their 8th gradestudents. Unlike NAEP, TIMSS results are reported only in terms of numericalscores, not achievement levels.
U.S. 4th grade pupils outscored the international average on the most recentTIMSS assessment.12 The international average score for all countries participatingin the 2003 4th grade TIMSS was 495 in math and 489 in science.13 The averagescore for U.S. students was 518 in math and 536 in science. U.S. 4th grade studentsoutscored students in 13 of the 24 countries participating in the math assessment in2003. In science, U.S. students outperformed students in 16 of the 24 countries.Among the 10 Organization for Economic Co-operation and Development (OECD)member states participating in the 2003 TIMSS, U.S. 4th grade students ranked fourthin math and tied for second in science.
U.S. 8th grade pupils also outscored the international average. Among 8th gradestudents, the international average on the 2003 TIMSS was 466 in math and 473 inscience. The average score for U.S. students was 504 in math and 527 in science.Among the 44 countries participating in the 8th grade assessments in 2003, U.S.

CRS-6
students outscored students in 25 countries in math and 32 countries in science.Twelve OECD countries participated in the 8th grade TIMSS in 2003 — fiveoutscored the United States in math and three outscored the United States in science.
TIMSS previously assessed students at grade 4 in 1995 and grade 8 in 1995 and1999. Although there was no measurable difference between U.S. 4th graders’average scores in 1995 and 2003, the standing of the United States declined relativeto that of the 14 other countries participating in both math and science assessments.In math, U.S. 4th graders outperformed students in nine of these countries in 1995,on average, compared to six countries in 2003. In science, U.S. 4th gradersoutperformed students in 13 of these countries in 1995, on average, compared toeight countries in 2003.
Among 8th graders, U.S. scores increased on both the math and scienceassessments between 1995 and 2003. The increase in scores translated into a higherranking of the United States relative to other countries. In math, 12 of the 21participating countries outscored U.S. 8th graders in 1995, while seven did so in 2003.In science, 15 of the 21 participating countries outscored U.S. 8th graders in 1995,while 10 did so in 2003. Table 1 displays the 2003 TIMSS math and science scoresof 4th and 8th grade students by country (scores in bold are higher than the U.S.score).
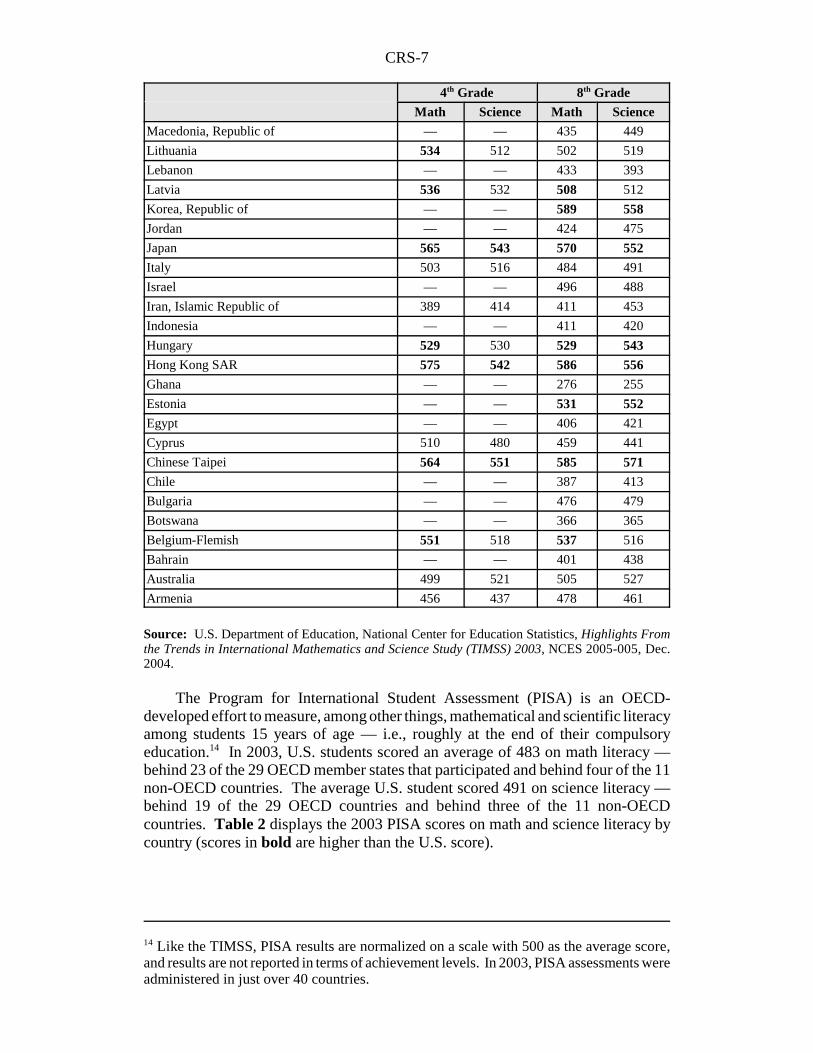
Table 1. TIMSS Scores by Grade and Country/Jurisdiction, 2003
4th Grade 8th Grade
Math Science Math Science
International average 495 489 466 473
United States 518 536 504 527
United Kingdom 531 540 — —
Tunisia 339 314 410 404
Sweden — — 499 524
South Africa — — 264 244
Slovenia 479 490 493 520
Slovak Republic — — 508 517
Singapore 594 565 605 578
Serbia — — 477 468
Scotland 490 502 498 512
Saudi Arabia — — 332 398
Russian Federation 532 526 508 514
Romania — — 475 470
Philippines 358 332 378 377
Palestinian National Authority — — 390 435
Norway 451 466 461 494
New Zealand 493 520 494 520
Netherlands 540 525 536 536
Morocco 347 304 387 396
Moldova, Republic of 504 496 460 472
Malaysia — — 508 510
CRS-7
4th Grade 8th Grade
Math Science Math Science
14 Like the TIMSS, PISA results are normalized on a scale with 500 as the average score,and results are not reported in terms of achievement levels. In 2003, PISA assessments wereadministered in just over 40 countries.
Macedonia, Republic of — — 435 449
Lithuania 534 512 502 519
Lebanon — — 433 393
Latvia 536 532 508 512
Korea, Republic of — — 589 558
Jordan — — 424 475
Japan 565 543 570 552
Italy 503 516 484 491
Israel — — 496 488
Iran, Islamic Republic of 389 414 411 453
Indonesia — — 411 420
Hungary 529 530 529 543
Hong Kong SAR 575 542 586 556
Ghana — — 276 255
Estonia — — 531 552
Egypt — — 406 421
Cyprus 510 480 459 441
Chinese Taipei 564 551 585 571
Chile — — 387 413
Bulgaria — — 476 479
Botswana — — 366 365
Belgium-Flemish 551 518 537 516
Bahrain — — 401 438
Australia 499 521 505 527
Armenia 456 437 478 461
Source: U.S. Department of Education, National Center for Education Statistics, Highlights Fromthe Trends in International Mathematics and Science Study (TIMSS) 2003, NCES 2005-005, Dec.2004.
The Program for International Student Assessment (PISA) is an OECD-developed effort to measure, among other things, mathematical and scientific literacyamong students 15 years of age — i.e., roughly at the end of their compulsoryeducation.14 In 2003, U.S. students scored an average of 483 on math literacy —behind 23 of the 29 OECD member states that participated and behind four of the 11non-OECD countries. The average U.S. student scored 491 on science literacy —behind 19 of the 29 OECD countries and behind three of the 11 non-OECDcountries. Table 2 displays the 2003 PISA scores on math and science literacy bycountry (scores in bold are higher than the U.S. score).

CRS-8
Table 2. PISA Math and Science Scores, 2003
2003
Math Science
OECD average 500 500
United States 483 491
Turkey 423 434
Switzerland 527 513
Sweden 509 506
Spain 485 487
Slovak Republic 498 495
Portugal 466 468
Poland 490 498
Norway 495 484
New Zealand 524 521
Netherlands 538 524
Mexico 385 405
Luxembourg 493 483
Korea, Republic of 542 538
Japan 534 548
Italy 466 487
Ireland 503 505
Iceland 515 495
Hungary 490 503
Greece 445 481
Germany 503 502
France 511 511
Finland 544 548
Denmark 514 475
Czech Republic 517 523
Canada 533 519
Belgium 529 509
Austria 506 491
Australia 524 525
Non-OECD Countries
Uruguay 422 438
United Kingdom 508 518
Tunisia 359 385
Thailand 417 429
Serbia and Montenegro 437 436
Russian Federation 468 489
Macao SAR 527 525
Liechtenstein 536 525
Latvia 483 489
Indonesia 360 395
Hong Kong SAR 550 540Source: U.S. Department of Education, National Center for Education Statistics, InternationalOutcomes of Learning in Mathematics Literacy and Problem Solving, NCES 2005-003, Dec. 2004.

CRS-9
15 Michael B. Allen, Eight Questions on Teacher Preparation: What Does the ResearchSay?, Education Commission of the States, July 2003.16 The sample is drawn from the Department of Education Common Core of Data, whichcontains virtually every school in the country.17 U.S. Department of Education, Digest of Education Statistics, 2004, NCES 2005-025,Oct. 2005, Table 67.18 CRS analysis of Schools and Staffing Survey data, Mar. 29, 2006.19 U.S. Department of Education, Qualifications of the Public School Teacher Workforce,May 2002, Tables B-11 and B-12.
Math and Science Teacher Quality
Many observers look to the nation’s teaching force as a source of nationalshortcomings in student math and science achievement. A recent review of theresearch on teacher quality conducted over the last 20 years revealed that, amongthose who teach math and science, having a major in the subject taught has asignificant positive impact on student achievement.15 Unfortunately, many U.S. mathand science teachers lack this credential. The Schools and Staffing Survey (SASS)is the only nationally representative survey that collects detailed data on teachers’preparation and subject assignments.16 The most recent administration of the surveyfor which public data are available took place during the 1999-2000 school year.That year, there were just under 3 million teachers in U.S. schools, about evenly splitbetween the elementary and secondary levels. Among the nation’s 1.4 million publicsecondary school teachers, 13.7% reported math as their main teaching assignmentand 11.4% reported science as their main teaching assignment.17
Nearly all public secondary school math and science teachers held at least abaccalaureate degree (99.7%), and most had some form of state teaching certification(86.2%) at the time of the survey.18 However, many of those who taught middleschool (classified as grades 5-8) math and science lacked an undergraduate orgraduate major or minor in the subject they taught. Among middle-school teachers,51.5% of those who taught math and 40.0% of those who taught science did not havea major or minor in these subjects. By contrast, few of those who taught high school(classified as grades 9-12) math or science lacked an undergraduate or graduate majoror minor in that subject. Among high school teachers, 14.5% of those who taughtmath and 11.2% of those who taught science did not have a major or minor in thesesubjects.19 Table 3 displays these statistics for teachers in eight subject areas.

CRS-10
20 Through various “completions” surveys of postsecondary institutions administeredannually since 1960, ED enumerates the number of degrees earned in each field during theprevious academic year. 21 U.S. Department of Education, National Center for Education Statistics, Digest ofEducation Statistics, 2004, NCES 2005-025, Oct. 2005, Table 169.22 Includes Ph.D., Ed.D., and comparable degrees at the doctoral level, but excludesfirst-professional degrees, such as M.D., D.D.S., and law degrees.
Table 3. Percentage of Middle and High School TeachersLacking a Major or Minor in Subject Taught, 1999-2000
Middle School High School
English 44.8% 13.3%
Foreign language 27.2% 28.3%
Mathematics 51.5% 14.5%
Science 40.0% 11.2%
Social science 29.6% 10.5%
ESL/bilingual education 57.6% 59.4%
Arts and music 6.8% 6.1%
Physical/health education 12.6% 9.5%
Source: U.S. Department of Education, National Center for Education Statistics, Qualifications ofthe Public School Teacher Workforce: Prevalence of Out-of-Field Teaching 1987-88 to 1999-2000,NCES 2002-603, May 2002.
Given the link between teachers’ undergraduate majors and student achievementin math and science, these data appear to comport with some of the NAEP findingsdiscussed earlier. Recall that those assessments revealed that only about one-thirdof 4th and 8th grade students performed at the proficient or higher level in math andscience. On the other hand, at the high school level, the data seem to diverge. Whilefour-fifths of math and science teachers at this level have a major in the subject, onlytwo-fifths of high school students scored proficient or above on the NAEP in thosesubjects.
Postsecondary Education
STEM Degrees Awarded in the United States. The number of studentsattaining STEM postsecondary degrees in the U.S. more than doubled between 1960and 2000; however, as a proportion of degrees in all fields, STEM degree awardshave stagnated during this period.20 In the 2002-2003 academic year, more than 2.5million degrees were awarded by postsecondary institutions in the United States.21
That year, just under 16% (399,465) of all degrees were conferred in STEM fields;all STEM degrees comprised 14.6% of associate degrees, 16.7% of baccalaureatedegrees, 12.9% of master’s degrees, and 34.8% of doctoral degrees.22 Table 4displays the distribution of degrees granted by academic level and field of study.
At the associate and baccalaureate levels, the number of STEM degrees awardedwas roughly equivalent to the number awarded in business. In 2002-2003, 92,640

CRS-11
associate degrees and 224,911 baccalaureate degrees were awarded in STEM fields,compared to 102,157 and 293,545, respectively, in business. However, nearly twiceas many master’s degrees were granted in business (127,545) as in STEM (65,897),and an even larger number of master’s degrees were awarded in education (147,448).At the doctoral level, STEM plays a larger role. Doctoral degrees awarded in STEMfields account for more than one-third of all degrees awarded at this level. Educationis the only field in which more doctoral degrees (6,835) were awarded than in thelargest three STEM fields — biology, engineering, and the physical sciences (5,003,5,333, and 3,858, respectively).
Specialization within STEM fields also varies by academic level. Engineeringwas among the most common STEM specialties at all levels of study in 2002-2003.Biology was a common specialization at the baccalaureate and doctoral levels, butnot at the master’s level. Computer science was common at all but the doctoral level.Physical sciences was a common specialization only at the doctoral level.
Figure 2 displays the trends in STEM degrees awarded over the last threedecades (excluding associate degrees). The solid line represents the number ofSTEM degrees awarded as a proportion of the total number of degrees awarded in allfields of study. The flat line indicates that the ratio of STEM degrees to all degreesawarded has historically hovered at around 17%. The bars represent the number ofdegrees awarded in each STEM sub-field as a proportion of all STEM degreesawarded. The top two segments of each bar reveal a consistent decline, since 1970,in the number of degrees awarded in math and the physical sciences. The bottomsegment of each bar shows a history of fluctuation in the number of degrees awardedin biology over the last 30 years. The middle two segments in the figure representthe proportion of degrees awarded in engineering and computer science. The figurereveals a steady decline in the proportion of STEM degrees awarded in engineeringsince 1980, and a steady increase in computer science degrees (except for acontraction that occurred in the late 1980s following a rapid expansion in the early1980s).

CRS-12
Table 4. Degrees Conferred by Degree-Granting Institutions by Academic Level and Field of Study, 2002-2003
Associate Baccalaureate Master’s Doctoral Total
All fields 632,912 1,348,503 512,645 46,024 2,540,084
STEM fields, total 92,640 224,911 65,897 16,017 399,465
STEM, percentage of all fields 14.6% 16.7% 12.9% 34.8% 15.7%
Biological and biomedical sciences 1,496 60,072 6,990 5,003 73,561
Computer and information sciences 46,089 57,439 19,503 816 123,847
Engineering and engineering technologies 42,133 76,967 30,669 5,333 155,102
Mathematics and statistics 732 12,493 3,626 1,007 17,858
Physical sciences and science technologies 2,190 17,940 5,109 3,858 29,097
Non-STEM fields, total 540,272 1,123,592 446,748 30,007 2,140,619
Business 102,157 293,545 127,545 1,251 524,498
Education 11,199 105,790 147,448 6,835 271,272
English language and literature/letters 896 53,670 7,413 1,246 63,225
Foreign languages and area studies 1,176 23,530 4,558 1,228 30,492
Liberal arts and sciences, general studies, and humanities 216,814 40,221 3,312 78 260,425
Philosophy, theology, and religious studies/vocations 804 18,270 6,677 1,983 27,734
Psychology 1,784 78,613 17,123 4,831 102,351
Social sciences 5,422 115,488 12,109 2,989 136,008
History 316 27,730 2,525 861 31,432
Other 199,704 366,735 118,038 8,705 693,182
Source: U.S. Department of Education, National Center for Education Statistics, Digest of Education Statistics, 2004, NCES 2005-025, Oct. 2005, Table 249-252..
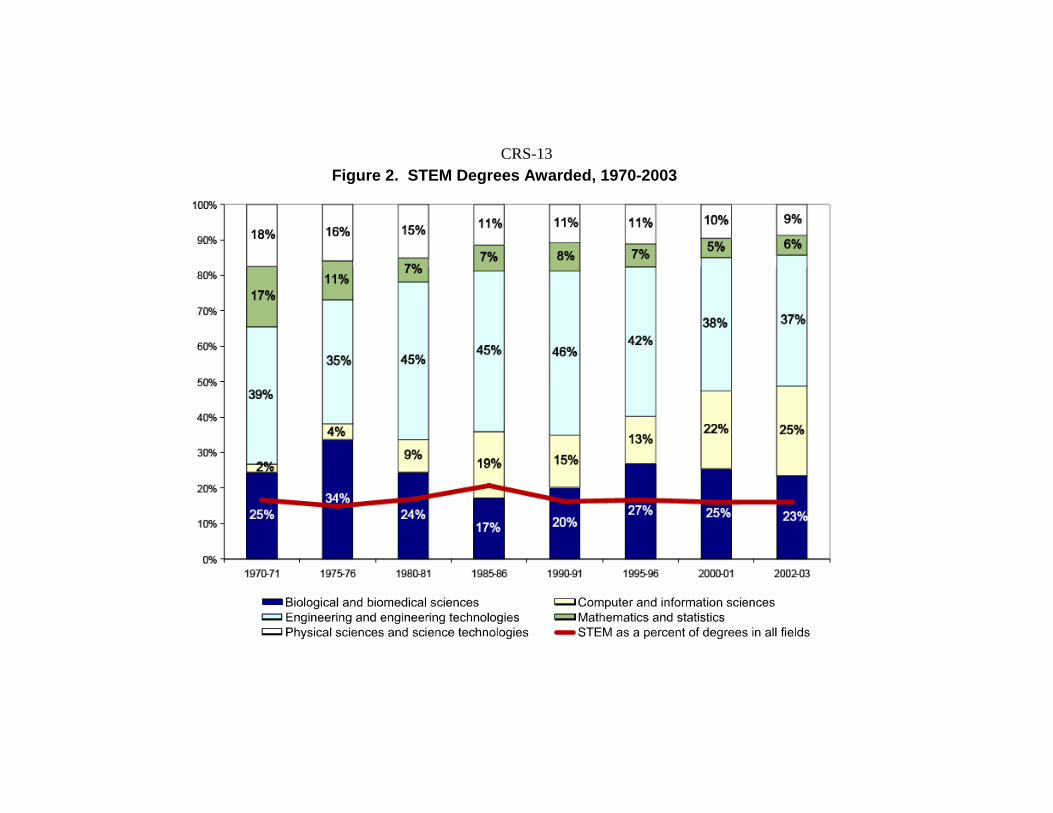
CRS-13Figure 2. STEM Degrees Awarded, 1970-2003
CRS-14
23 National Science Board, Science and Engineering Indicators, 2006, (NSB 06-1).Arlington, VA: National Science Foundation, Jan. 2006, p. O-15.24 For more information on issues related to foreign students and foreign technical workers,see the following: CRS Report 97-746, Foreign Science and Engineering Presence in U.S.Institutions and the Labor Force, by Christine M. Matthews; CRS Report RL31973,Programs Funded by the H-1B Visa Education and Training Fee and Labor MarketConditions for Information Technology (IT) Workers, by Linda Levine; and CRS ReportRL30498, Immigration: Legislative Issues on Nonimmigrant Professional Specialty (H-1B)Workers, by Ruth Ellen Wasem.25 Organization for Economic Co-operation and Development, Education at a Glance, OECDIndicators 2005, Paris, France, Sept. 2005. The OECD compiles annual data from nationallabor force surveys on educational attainment for the 30 OECD member countries, as wellas 13 non-OECD countries that participate in the World Education Indicators (WEI)program. More information on sources and methods can be found at [http://www.oecd.org/dataoecd/36/39/35324864.pdf].
U.S. Degrees Awarded to Foreign Students. The increased presence offoreign students in graduate science and engineering programs and in the scientificworkforce has been and continues to be of concern to some in the scientificcommunity. Enrollment of U.S. citizens in graduate science and engineeringprograms has not kept pace with that of foreign students in these programs.According to the National Science Foundation (NSF) Survey of Earned Doctorates,foreign students earned one-third of all doctoral degrees awarded in 2003.
Doctoral degrees awarded to foreign students were concentrated in STEM fields.The NSF reports that foreign students earned “more than half of those [awarded] inengineering, 44% of those in mathematics and computer science, and 35% of thosein the physical sciences.”23 Many of these degree recipients remain in the UnitedStates to work. The same NSF report indicates that 53% of those who earned adoctorate in 1993 remained in the U.S. as of 1997, and 61% of the 1998 cohort werestill working in the United States in 2003. In addition to the number of foreignstudents in graduate science and engineering programs, a significant number ofuniversity faculty in the scientific disciplines are foreign, and foreign doctorates areemployed in large numbers by industry.24
International Postsecondary Educational Attainment. The UnitedStates has one of the highest rates of postsecondary educational attainment in theworld. In 2003, the most recent academic year for which international data areavailable, 38% of the U.S. population aged 25-64 held a postsecondary degree — 9%at the tertiary-type B (vocational level) and 29% at the tertiary-type A (universitylevel) or above. The OECD compiled comparison data from 30 OECD memberstates and 13 other nations. Three countries (Canada, Israel, and the RussianFederation) had larger shares at the two tertiary levels combined; however, all threehad lower rates at the tertiary-type A level. At the tertiary-type A level, only onecountry (Norway) had a rate as high as the United States. The average for OECDmember states was 16% at tertiary-type A and 8% at tertiary-type B.25
China and India were not included in the OECD data. Reliable information onpostsecondary educational attainment is very difficult to obtain for these countries.
CRS-15
26 The World Bank, Constructing Knowledge Societies: new challenges for tertiaryeducation, Washington, D.C., October 2002. Available at [http://siteresources.worldbank.org/EDUCATION/Resources/278200-1099079877269/547664-1099079956815/ConstructingKnowledgeSocieties.pdf].27 Unlike the OECD data, which are based on labor-force surveys of households andindividuals, the CID data are based on the United Nations Educational, Scientific andCultural Organization (UNESCO) census and survey data of the entire population.Documentation describing methodology as well as data files for the CID data is availableat [http://www.cid.harvard.edu/ciddata/ciddata.html].
The World Bank estimates that, in 1998, tertiary enrollment of the populationbetween 18 and 24 years old was 6% in China and 8% in India, up from 1.7% and5.2%, respectively, in 1980.26 Based on measures constructed by faculty at theCenter for International Development (CID), the National Science Foundation (NSF)has generated an estimate of the distribution of the world’s population that possessesa tertiary education.27 The NSF estimates that the number of people in the world whohad a tertiary education more than doubled from 73 million in 1980 to 194 millionin 2000. Moreover, the two fastest-growing countries were China and India. Chinahoused 5.4% of the world’s tertiary degree holders in 1980, and India had 4.1%; by2000, the share in these countries was 10.5% and 7.7%, respectively. Indeed, asFigure 3 indicates, China and India were the only countries to substantially increasetheir share of the world’s tertiary degree-holders during that period.

CRS-16
Figure 3. Population 15 Years Old or Older With Tertiary Education by Country, 1980 and 2000
Source: National Science Foundation, Science and Engineering Indicators, 2006, Volume 1,Arlington, VA, NSB 06-01, Jan. 2006.

CRS-17
28 First university degrees are those designated Level 5A by the International StandardClassification of Education (ISCED 97), and usually require less than five years to complete.More information on this classification and the ISCED is available at [http://www.unesco.org/education/information/nfsunesco/doc/isced_1997.htm].
International Comparisons in STEM Education. The NSF has compileddata for many countries on the share of first university degrees awarded in STEMfields.28 According to these data, the United States has one of the lowest rates ofSTEM to non-STEM degree production in the world. In 2002, STEM degreesaccounted for 16.8% of all first university degrees awarded in the United States (thesame NCES figure reported at the outset of this section). The international averagefor the ratio of STEM to non-STEM degrees was 26.4% in 2002. Table 5 displaysthe field of first university degrees for regions and countries that award more than200,000 university degrees annually. Among these nations, only Brazil awards asmaller share (15.5%) of STEM degrees than the United States. By contrast, theworld leaders in the proportion of STEM degrees awarded are Japan (64.0%) andChina (52.1%). Although the U.S. ranks near the bottom in the proportion of STEMdegrees, it ranks third (behind Japan and China) in the absolute number of STEMdegrees awarded.
Table 5. Field of First University Degree, by Selected Regionand Country, 2002 or the Most Recent Year Available
Region/Country All fields STEM Fields Percent STEM
All regions 9,057,193 2,395,238 26.4%
Asia 3,224,593 1,073,369 33.3%
China 929,598 484,704 52.1%
India 750,000 176,036 23.5%
Japan 548,897 351,299 64.0%
South Korea 239,793 97,307 40.6%
Middle East 445,488 104,974 23.6%
Europe 2,682,448 713,274 26.6%
France 309,009 83,984 27.2%
Spain 211,979 55,418 26.1%
United Kingdom 282,380 72,810 25.8%
Central/Eastern Europe 1,176,898 319,188 27.1%
Russia 554,814 183,729 33.1%
North/Central America 1,827,226 341,526 18.7%
Mexico 321,799 80,315 25.0%
United States 1,305,730 219,175 16.8%
South America 543,805 96,724 17.8%
Brazil 395,988 61,281 15.5%
Source: National Science Foundation, Science and Engineering Indicators, 2006, Volume 1,Arlington, VA, NSB 06-01, January 2006, Table 2-37.
CRS-18
29 U.S. Government Accountability Office, Federal Science, Technology, Engineering, andMathematics Programs and Related Trends, GAO-06-114, Oct. 2005. The GAO study doesnot include programs in the Department of Defense because the department decided not toparticipate. Other programs were omitted from the report for various reasons; typicallybecause they did not meet the GAO criteria for a STEM-related educational program(according to an Apr. 26, 2006 conversation with the report’s lead author, Tim Hall).30 Attrition rates among college students majoring in STEM fields combined with the growthof foreign students in U.S. graduate STEM programs suggest that pre-college STEMeducation may be a major source of the nation’s difficulty in this area.
Federal Programs that Promote STEM Education
Government Accountability Office Study
According to a 2005 Government Accountability Office (GAO) survey of 13federal civilian agencies, in FY2004 there were 207 federal education programsdesigned to increase the number of students studying in STEM fields and/or improvethe quality of STEM education.29 About $2.8 billion was appropriated for theseprograms that year, and about 71% ($2 billion) of those funds supported 99 programsin two agencies. In 2004, the National Institutes of Health (NIH) received $998million that funded 51 programs, and the National Science Foundation (NSF)received $997 million that funded 48 programs. Seven of the 13 agencies had morethan five STEM-related education programs. In addition to the NIH and NSF, onlythree other agencies received more than $100 million for STEM-related educationprograms. In FY2004, the National Aeronautics and Space Administration (NASA)received $231 million that funded five programs, the U.S. Department of Education(ED) received $221 million that funded four programs, and the EnvironmentalProtection Agency (EPA) received $121 million that funded 21 programs.
The GAO study found that most of the 207 programs had multiple goals,provided multiple types of assistance, and were targeted at multiple groups. Theanalysis identified six major program goals, four main types of assistance, and 11target groups. The findings revealed that federal STEM education programs areheavily geared toward attracting college graduates into pursuing careers in STEMfields by providing financial assistance at the graduate and postdoctoral levels.Moreover, improving K-12 teacher education in STEM areas was the least frequentof the major goals, improving infrastructure was the least frequent of the main typesof assistance, and elementary and secondary students were the least frequent grouptargeted by federal STEM education programs.30
The major goals of these programs were found by GAO to be the following (thenumber of programs with this goal is shown in parentheses):
! attract and prepare students at all educational levels to pursuecoursework in STEM areas (114),
! attract students to pursue STEM postsecondary degrees (two-yearthrough Ph.D.) and postdoctoral appointments (137),
! provide growth and research opportunities for college and graduatestudents in STEM fields (103),
CRS-19
31 Additional program descriptions are available in the CRS congressional distributionmemorandum, Federally Sponsored Programs for K-12 Science, Mathematics, andTechnology Education, by Bonnie F. Mangan, available upon request.32 More information on the NRSA program is available at [http://grants.nih.gov/training/nrsa.htm].
! attract graduates to pursue careers in STEM fields (131),! improve teacher education in STEM areas (73), and! improve or expand the capacity of institutions to promote STEM
fields (90).
The four main types of assistance provided by these programs were as follows(the number of programs providing this service is shown in parentheses):
! financial support for students or scholars (131),! institutional support to improve educational quality (76),! support for teacher and faculty development (84), and ! institutional physical infrastructure support (27).
The 11 target groups served by these programs were the following (the numberof programs targeting them is shown in parentheses):
! elementary school students (28),! middle school students (34),! high school students (53),! two-year college students (58),! four-year college students (96),! graduate students (100),! postdoctoral scholars (70),! elementary school teachers (39),! secondary school teachers (50),! college faculty or instructional staff (79), and! institutions (82).
Description of Selected Federal STEM Programs
The 2005 GAO report did not discuss federal STEM programs in detail (a verybrief description of programs funded at $10 million or more is contained in AppendixIII of the report). This section describes the kinds of activities the largest of theseprograms support, and how they operate at the federal, state, and/or local levels.31
NIH National Research Service Awards. The NIH was appropriated $998million in FY2004 in support of its 51 STEM educational programs. Nearly two-thirds ($653 million) of those funds went to three programs under the NationalResearch Service Awards (NRSA), first funded in 1975.32 Most of these funds ($547million) went to one program, the NRSA Institutional Research Training Grants,which provides pre- and postdoctoral fellowships in health-related fields. Anadditional $73 million went to NRSA Individual Postdoctoral Fellowship Grants and$34 million went to NRSA Predoctoral Fellowship Grants. The Training Grants are

CRS-20
awarded to institutions to develop or enhance research training opportunities forindividuals, selected by the institution, who are training for careers in specified areasof interest to the institution or principal investigator. The Fellowship Grants areawarded directly to individuals from various organizations within the NIH (e.g., theNational Institute on Aging) to support the particular research interests of theindividual receiving the award.
NRSA grant applicants must be U.S. citizens or nationals, or permanent residentaliens of the United States — individuals on temporary or student visas are noteligible. Predoctoral trainees must have received a baccalaureate degree by thestarting date of their appointment, and must be training at the postbaccalaureate leveland be enrolled in a program leading to a Ph.D. in science or in an equivalentresearch doctoral degree program. Health-profession students who wish to interrupttheir studies for a year or more to engage in full-time research training beforecompleting their professional degrees are also eligible. Postdoctoral trainees musthave received, as of the beginning date of their appointment, a Ph.D., M.D., orcomparable doctoral degree from an accredited domestic or foreign institution.Institutional grants are made for a five-year period. Trainee appointments arenormally made in 12-month increments, although short-term (two- to three-month)awards are available. No individual trainee may receive more than five years ofaggregate NRSA support at the predoctoral level or three years of support at thepostdoctoral level, including any combination of support from institutional traininggrants and individual fellowship awards. The annual stipend for predoctoral traineesin 2005 was about $12,000, and the postdoctoral stipend was between $20,000 and$32,000 (depending on years of experience).
In FY2004, Training Grants were awarded to 293 institutions in all but sixstates. A total of 2,356 grants were awarded, which funded nearly 9,000 predoctoralfellowships and nearly 5,500 postdoctoral fellowships. The Fellowship Grantprograms supported around 2,500 pre- and postdoctoral students in 2004. The largemajority of the Training Grants were awarded through the National Institute ofGeneral Medical Sciences.
NSF Graduate Research Fellowships. The largest of the NSF STEMeducation programs — the Graduate Research Fellowships ($97 million in FY2005) — is also one of the longest-running federal STEM programs (enacted in 1952).The purpose of this program is to increase the size and diversity of the U.S.workforce in science and engineering. The program provides three years of supportto approximately 1,000 graduate students annually in STEM disciplines who arepursuing research-based master’s and doctoral degrees, with additional focus onwomen in engineering and computer and information sciences. In 2006, 907 awardswere given to graduate students studying in nine major fields at 150 instituions.
Applicants must be U.S. citizens or nationals, or permanent resident aliens ofthe United States; must have completed no more than twelve months of full-timegraduate study at the time of their application; and must be pursuing an advanced

CRS-21
33 A list of NSF-supported fields of study can be found at [http://www.nsf.gov/pubs/2005/nsf05601/nsf05601.htm#study].
degree in a STEM field supported by the National Science Foundation.33 Thefellows’ affiliated institution receives a $40,500 award — $30,000 for a 12-monthstipend and $10,500 for an annual cost-of-education allowance. These awards arefor a maximum of three years and usable over a five-year period, and provide aone-time $1,000 International Research Travel Allowance. All discipline-basedreview panels, made up of professors, researchers, and others respected in theirfields, convene for three days each year to read and evaluate applications in theirareas of expertise. In 2005, there were 29 such panels made up of more than 500experts.
NSF Mathematics and Science Partnerships. The Mathematics andScience Partnerships program was the NSF’s second-largest program in FY2005 ($79million in FY2005) and was the agency’s largest program in FY2004 ($139 million).Since its inception in 2002, this program has awarded grants that support four typesof projects (the number of awards is shown in parentheses):
! Comprehensive Partnership projects (12) to implement change inmathematics and science education across the K-12 continuum;
! Targeted Partnership projects (28) to improve K-12 studentachievement in a narrower grade range or disciplinary focus inmathematics and/or science;
! Institute Partnership projects (8) to focus on improving middle andhigh school mathematics and science through the development ofschool-based intellectual leaders and master teachers; and
! Research, Evaluation & Technical Assistance projects (22) to buildresearch, evaluation, and infrastructure capacity for the MSP.
One of the Comprehensive Partnership projects is between the BaltimoreCounty Public Schools (BCPS) and the University of Maryland, Baltimore County(UMBC). The two main goals of the UMBC-BCPS STEM Partnership are to (1)facilitate the implementation, testing, refinement, and dissemination of promisingpractices for improving STEM student achievement, and (2) improve teacher qualityand retention in selected high-need elementary, middle, and high schools inBaltimore County Public Schools. Centered on creating and evaluatingperformance-based pre-service (internship) teacher education programs andsustainable professional development programs for teachers and administrators, theproject is designed to increase K-12 student achievement in STEM areas byincreasing teacher and administrator knowledge. Ongoing assessments of studentwork and the differentiation of instruction based upon these assessments serve toevaluate and refine instruction, curricula and assessments, professional developmentprograms, administrative leadership strategies, and directions for overall schoolimprovement in STEM areas. UMBC and BCPS collaboration is facilitated by thecreation of the Center for Excellence in STEM Education, where UMBC faculty andBCPS teachers and administrators develop projects to serve the needs of the BCPSdistrict and the university. At the center, faculty and teachers work together to
CRS-22
simultaneously improve the university’s STEM and teacher education departmentsand the teaching and learning culture in the BCPS.
One of the Targeted Partnership grants supports the Promoting ReflectiveInquiry in Mathematics Education Partnership, which includes Black Hills StateUniversity, Technology and Innovations in Education (TIE) of the Black HillsSpecial Services Cooperative, and the Rapid City School District in South Dakota.The overall goal of the partnership is aimed at improving achievement inmathematics for all students in Rapid City schools, with a particular goal of reducingthe achievement gap between Native American and non-Native American students.The project seeks to improve the professional capacity and sustain the quality ofK-12 in-service teachers of mathematics in the Rapid City School District, andstudent teachers of mathematics from Black Hills State University in order to provideeffective, inquiry-based mathematics instruction. Objectives include reducing thenumber of high school students taking non-college preparatory mathematics,increasing the number of students taking upper level mathematics, and increasingstudent performance on college entrance exams. To accomplish these goals, theproject provides 100 hours of professional development in combination withcontent-based workshops at the district level, and building-based activities involvingmodeling of effective lessons, peer mentoring and coaching, and lesson study.Mathematics education and discipline faculty from Black Hills State University areinvolved in district-wide professional development activities. A cadre ofbuilding-based Mathematics Lead Teachers convenes learning teams composed ofmathematics teachers, mathematics student teachers, school counselors, and buildingadministrators to identify key issues in mathematics curriculum and instruction.
NSF Research Experiences for Undergraduates. The ResearchExperiences for Undergraduates (REU) program is the largest of the NSF STEMeducation programs that supports active research participation by undergraduatestudents ($51 million in FY2005). REU projects involve students in research throughtwo avenues. REU Sites are based on independent proposals to initiate and conductprojects that engage a number of students in research. REU Supplements arerequested for ongoing NSF-funded research projects or are included as a componentof proposals for new or renewal NSF grants or cooperative agreements. REUprojects may be based in a single discipline or academic department, or oninterdisciplinary or multi-department research opportunities with a coherentintellectual theme. Undergraduate student participants in either Sites or Supplementsmust be citizens or permanent residents of the United States or its possessions.Students apply directly to REU Sites (rather that to the NSF) to participate in theprogram.
One of the grantees under this program is the REU Site in Microbiology at theUniversity of Iowa. The goals of this project are to (1) recruit and select brightstudents, including women, individuals with diverse backgrounds with respect togeographic origin and ethnicity, and students from non-Ph.D.-granting institutionswhere research possibilities are limited; (2) involve students in basic, experimentalresearch in microbiology; (3) expose students to a broad range of bioscience research;(4) develop each student’s critical-thinking skills; and (5) develop each student’sability to record, analyze, and present scientific information. The student participantsare integrated into faculty research programs and expected to perform like beginning

CRS-23
graduate students. Informal faculty-student discussions and weekly seminarssupplement laboratory research. Weekly informal lunches, two picnics, and abanquet facilitate social and scientific interactions. At the end of each summer’sprogram, the students prepare oral presentations to be given at a Summer ProgramSymposium. Each student also prepares a written research report under the guidanceof a mentor.
NASA Minority University Research Education Program. Nearly halfof the funds ($106 million of $231 million) appropriated for NASA’s STEMeducation programs in FY2004 went to the Minority University Research EducationProgram (MUREP). MUREP supports grants to expand and advance NASA’sscientific and technological base through collaborative efforts with Historically BlackColleges and Universities (HBCUs) and other minority universities, includingHispanic-serving institutions and tribal colleges and universities. The programprovides (1) K-12 awards to build and support successful pathways for students toprogress to the next level of mathematics and science through a college preparatorycurriculum and enrollment in college; (2) higher-education awards to improve therate at which underrepresented minorities are awarded degrees in STEM disciplines;and (3) partnership awards to higher-education institutions and school districts thatimprove K-12 STEM teaching.
One of the partnership programs, the Minority University Mathematics, Scienceand Technology Awards for Teacher and Curriculum Enhancement Program,supports collaborative efforts between universities and school districts to increase thenumber and percentage of state-certified STEM teachers in schools with highpercentages of disadvantaged students. Grant awards range from $50,000 to$200,000 annually for each of three years of support, for a total of up to $600,000.A longstanding grant funded under this program involves a partnership betweenFlorida International University and Miami-Dade County Public Schools. Studentsfrom three middle schools and one high school attend mathematics, science, andtechnology classes for half of each day at the university and spend the other half ofthe day in their home school. University faculty, graduate students, and preservicesecondary mathematics teachers work with district teachers in providing the at-riskstudents with standards-based curriculum and instruction.
ED Mathematics and Science Partnerships. Three-quarters of theSTEM program funds in the Department of Education ($149 million of $221 million)in FY2004 went to the Mathematics and Science Partnership (MSP) program. TheMSP is intended to increase the academic achievement of students in mathematicsand science by enhancing the content knowledge and teaching skills of classroomteachers. These partnerships — between state education agencies, high-need schooldistricts, and STEM faculty in institutions of higher education — are supported bystate-administered formula grants and carried out in collaboration with the NSF-MSPprogram. Partnerships must use their grants for one or more of several specificactivities. Among them are the following:
! professional development to improve math and science teachers’subject knowledge;
! activities to promote strong teaching skills among these teachers andteacher educators;
CRS-24
34 Analysts at the Brookings Institution conducted a survey of 266 winning MSP projectsfrom 41 states. Results of the survey are available at [http://www.ed.gov/programs/mathsci/proposalreview.doc].35 The Education Commission of the States, Keeping America Competitive: Five StrategiesTo Improve Mathematics and Science Education, July 2005; The Association of AmericanUniversities, National Defense Education and Innovation Initiative, Meeting America’sEconomic and Security Challenges in the 21st Century, Jan. 2006; The National Academyof Sciences, Committee on Science, Engineering, and Public Policy, Rising Above theGathering Storm: Energizing and Employing America for a Brighter Economic Future,Feb. 2006; The National Summit on Competitiveness, Statement of the National Summit onCompetitiveness: Investing in U.S. Innovation, Dec. 2005; The Business Roundtable,Tapping America’s Potential: The Education for Innovation Initiative, July 2005; TheCenter for Strategic and International Studies, Waiting for Sputnik, 2005.
! math and science summer workshops or institutes with academic-year followup;
! recruitment of math, science, and engineering majors to teachingjobs through signing and performance incentives, stipends foralternative certification, and scholarships for advanced course work;
! development and redesign of more rigorous, standards-aligned mathand science curricula;
! distance-learning programs for math and science teachers;! and opportunities for math and science teachers to have contact with
working mathematicians, scientists, and engineers.
A review of projects funded in 2004 revealed that most grantees focus on math(as opposed to science) instruction in middle schools, and provide professionaldevelopment to roughly 46 teachers over a period of about 21 months.34 The surveyfound that most projects link content to state standards, and that algebra, geometry,and problem-solving are the top three math topics addressed by professionaldevelopment activities. Most projects administer content knowledge tests toteachers, conduct observations, and make pre-and post-test comparisons. About halfof the projects develop their own tests for teachers, and most rely on state tests ofacademic achievement to measure student knowledge.
Proposals to Improve STEM Education
Several pieces of legislation have been introduced in the 109th Congress with thepurpose of improving STEM education in the United States. Many of the proposalsin these bills have been influenced by the recommendations of several reportsrecently issued by leading academic, scientific, and business organizations(mentioned in the introduction of this report).35 These recommendations, particularlythose from the business community, are not limited to the educational system. Thisreport does not discuss these non-educational policy recommendations (e.g.,immigration policies that affect the supply of foreign workers to fill U.S. demand inSTEM occupations). The concluding section of this report discusses STEMeducation policy recommendations in detail, as well as selected pieces of legislationthat have been introduced in this area.

CRS-25
Recommendations by the Scientific Community
The recommendations to improve federal STEM policy concern every aspect ofthe educational pipeline. All of the recent reports issuing STEM education policyrecommendations focus on five areas: improving elementary and secondarypreparation in math and science, recruiting new elementary and secondary math andscience teachers, retooling current math and science teachers, increasing the numberof undergraduate STEM degrees awarded, and supporting graduate and early-careerresearch. As mentioned at the outset of this report, one report that has been ofparticular influence in the STEM debate is from the National Academy of Sciences(NAS) — Rising Above the Gathering Storm. This influence is perhaps due to theclear targets and concrete programs laid out in the report. The NAS report’s fiverecommendations to improve STEM education follow.
! quadruple middle- and high-school math and science course-takingby 2010,
! recruit 10,000 new math and science teachers per year,! strengthen the skills of 250,000 current math and science teachers,! increase the number of STEM baccalaureate degrees awarded, and! support graduate and early-career research in STEM fields.
To enlarge the pipeline of future STEM degree recipients, NAS sets a goal of
quadrupling the number of middle and high school students taking AdvancedPlacement (AP) or International Baccalaureate (IB) math or science courses, from thecurrent 1.1 million to 4.5 million by 2010. NAS further sets a goal of increasing thenumber of students who pass either the AP or IB tests to 700,000 by 2010. Toenlarge the pipeline, NAS also supports the expansion of programs such as statewidespecialty high schools for STEM immersion and inquiry-based learning throughlaboratory experience, summer internships, and other research opportunities.
To recruit 10,000 new STEM teachers, NAS advocates the creation of acompetitive grant program to award merit-based scholarships to obtain a four-yearSTEM degree in conjunction with certification as a K-12 mathematics or scienceteacher. These $10,000 to $20,000 awards could be used only for educationalexpenses and would require a five-year service commitment. An additional $10,000annual bonus would be awarded to participating teachers in underserved schools ininner cities and rural areas. In further support of this scholarship program, NASrecommends that five-year, $1 million matching grants be awarded to postsecondaryinstitutions to encourage the creation of programs that integrate the obtainment of aSTEM bachelor’s degree with teacher certification.
NAS proposes four approaches to achieving the goal of strengthening the skillsof 250,000 current STEM teachers. First, NAS proposes that matching grants beawarded to support the establishment of state and regional summer institutes forSTEM teachers modeled after the Merck Institute for Science Education. Second,NAS proposes that additional grants go to postsecondary institutions that supportSTEM master’s degree programs for current STEM teachers (with or without STEMbachelor’s degrees) modeled after the University of Pennsylvania Science TeachersInstitute. Third, NAS proposes that programs be created to train current teachers toprovide AP, IB, and pre-AP or pre-IB instruction modeled after the Advanced

CRS-26
Placement Initiative and the Laying the Foundation programs. Fourth, NAS proposesthe creation of a national panel to collect, evaluate, and develop rigorous K-12 STEMcurricula modeled after Project Lead the Way.
To increase STEM bachelor’s degree attainment, NAS proposes providing25,000 new scholarships each year. These Undergraduate Scholar Awards inScience, Technology, Engineering, and Mathematics (USA-STEM) would bedistributed to each state in proportion with its population, and awarded to studentsbased on competitive national exams. The $20,000 scholarships could only go toU.S. citizens, and could only be used for the payment of tuition and fees in pursuitof a STEM degree at a U.S. postsecondary institution.
To increase graduate study in areas of national need, including STEM, NASproposes the creation of 5,000 new fellowships each year to U.S. citizens pursuingdoctoral degrees. The fellowships would be administered by the National ScienceFoundation, which would also draw on the advice of several federal agencies indetermining the areas of need. An annual stipend of $30,000 would be accompaniedby an additional $20,000 annually to cover the cost of tuition and fees. Thesefellowships would also be portable, so that students could choose to study at aparticular institution without the influence of faculty research grants.
Legislation in the 109th Congress
Several bills containing STEM education-related proposals have beenintroduced in the 109th Congress, and have also seen additional legislative action.Some of these bills have already been passed by Congress and signed into law by thePresident. The National Aeronautics and Space Administration Authorization Actof 2005 (P.L. 109-155) directed the Administrator to develop, expand, and evaluateeducational outreach programs in science and space that serve elementary andsecondary schools. The National Defense Authorization Act of 2006 (P.L. 109-163)made permanent the Science, Mathematics and Research for Transformation pilotprogram initiated by the Defense Act of 2005 (P.L. 108-375) to address deficienciesof scientists and engineers in the national security workforce. The Deficit ReductionAct of 2005 (P.L. 109-171) established the Academic Competitiveness Grants andthe National Science and Mathematics Access to Retain Talent Grants programs,which supplement Pell Grants for students studying mathematics, technology,engineering, critical foreign languages, and physical, life, and computer sciences.The act also established the Academic Competitiveness Council, chaired by theSecretary of Education and charged with identifying and evaluating all federal STEMprograms, and recommending reforms to improve program integration andcoordination.
Additional bills that have been introduced in the 109th Congress that wouldmake substantial changes or additions to current federal STEM education policyinclude two intended to reauthorize the Higher Education Act (HEA), as well asseveral pieces of so-called “competitiveness” legislation. On February 28, 2006, theSenate Committee on Health, Education, Labor, and Pensions reported S. 1614, theHigher Education Amendments of 2005 (S.Rept. 109-218). On March 30, 2006, theHouse passed H.R. 609, the College Access and Opportunity Act of 2005. On April24, 2006, the Senate Committee on Energy and Natural Resources reported S. 2197,

CRS-27
Protecting America’s Competitive Edge Through Energy Act of 2006 (S.Rept.109-249). A companion bill, S. 2198, Protecting America’s Competitive EdgeThrough Education and Research Act of 2006, has been the subject of two hearings(February 28, 2006 and March 1, 2006). Another bill that would make substantialadditions to federal STEM education policy is S. 2109, the National Innovation Act.On June 22, 2006, the House Committee on Science reported two bills — H.R. 5358,the Science and Mathematics Education for Competitiveness Act, and H.R. 5356, theEarly Career Research Act.
Secondary School Math and Science Preparation. S. 2197 wouldprovide experiential-based learning opportunities for students by establishing asummer internship program for middle school and secondary school students at theNational Laboratories funded by the Department of Energy (DOE). Language in thebill requires that 40% of the participants be from low-income families. The bill alsorequires that the participants be from schools where teachers are teaching “out-of-field,” hold temporary certification, or have a high turnover rate. For this purpose,S. 2197 would authorize appropriations of $50 million for each of five fiscal years — FY2007 through FY2011.
S. 2109 would increase support for science education through the NSF. The billwould authorize the following amounts for expansion of science, mathematics,engineering, and technology talent under the NSF Authorization Act of 2002 (P.L.107-368): FY2007, $35 million; FY2008, $50 million; FY2009, $100 million; andFY2010, $150 million. S. 2109 would also promote innovation-based experientiallearning. This bill would allow NSF to award grants to local education agencies(LEAs) for implementation of innovation-based experiential learning. A total of 500elementary or middle schools and 500 secondary schools would participate. Fundingwould total $10 million in FY2007 and $20 million each for FY2008 and FY2009.
Recruiting and Retaining New STEM Teachers. Provisions in S. 2198would direct the NSF to provide two types of support for future science andmathematics teachers. One such award would be four-year fellowships in the amountof $10,000 annually to individuals who complete a baccalaureate degree in science,engineering, or mathematics, with concurrent teacher certification. A requirementwould be that these individuals teach as full-time mathematics, science, orelementary school teachers in high-need elementary and secondary schools.Additional support for teacher recruitment would be through scholarships for scienceand mathematics teachers. The NSF Director would award merit-based scholarshipsof up to $20,000 per year for not more than four years to students majoring inscience, mathematics, and engineering education who pursue concurrent teachercertification to assist students in paying their college education expenses.
S. 2198 would also authorize institutional grants to provide an integrated courseof study in mathematics, science, engineering, or teacher education that leads to abaccalaureate degree in the STEM disciplines with concurrent teacher certification.The awards would total $1 million per year for a period of five years. Matchingfunds in predetermined amounts would be required from non-federal sources — notless than 25% of the amount for the first year, not less than 35% for the second year,and not less than 50% of the amount of the grant award for each succeeding year ofthe grant.

CRS-28
36 More information on teacher loan forgiveness can be found in CRS Report RL32516,Student Loan Forgiveness Programs, by Gail McCallion.
S. 2198 would provide further institutional grants to develop part-time,three-year master’s degree programs in science and mathematics education forteacher enhancement. Eligible participants must collaborate with a teacherpreparation program of an institution of higher education. The competitivelyawarded grants are not to exceed $1 million. Priority would be given to applicantswho consult with LEAs, use online technology, and develop innovative effortsdirected at reducing shortages of science and mathematics teachers in low-incomeurban or rural areas.
H.R. 609 and S. 1614 would expand and extend the current loan forgivenessprogram for STEM teachers. Currently, HEA Title IV, Section 428J and 465, asamended by the Taxpayer-Teacher Protection Act of 2004 (P.L. 108-409), providesa higher maximum debt relief for qualified math and science secondary schoolteachers; up to $17,500 in loan forgiveness compared to $5,000 for other eligibleteachers. However, only teachers who were new borrowers between October 1, 1998and October 1, 2005 are eligible. Both S. 1614 and H.R. 609 would extend eligibilityfor loan forgiveness of up to $17,500 to qualified math and science secondary schoolteachers who were new borrowers after October 1, 1998; i.e., they would extendeligibility beyond the October 1, 2005 limit set by P.L. 108-409.36
H.R. 609 would establish the Mathematics and Science Incentive Program toprovide eligible math and science teachers relief from interest payments on studentloans in return for working in high-need schools. Participating teachers would serveat least five years and could not receive more than $5,000 in total relief. S. 1614would allow state and partnership grantees under the HEA Title II, TeacherEnhancement Grant program to provide scholarships to students who later teach inthe areas of math or science.
H.R. 609 would create an Adjunct Teacher Corps that would award grants toLEAs or other educational organizations (private or public) to recruit professionalswith math and science skills to serve as adjunct teachers. Grants could be used todevelop outreach programs, fund signing bonuses, and compensate outside entitiesfor the costs associated with allowing employees to serve. Grantees would have tomatch the federal funds received dollar-for-dollar.
Upgrading the STEM Skills of Current Teachers. Another type ofaward provided in S. 2198 would be in the form of a fellowship for five years, in theamount of $10,000 annually, to teachers who have successfully completed a master’sdegree in science or mathematics education, and who undertake increasedresponsibilities such as teacher mentoring and other leadership activities. S. 2198would also direct the Secretary of Education to award grants to nonprofit entities thatpartner with local school districts for the training of teachers who will lead AdvancedPlacement or International Baccalaureate (AP-IB) and pre-AP-IB programs in scienceand mathematics. The grantees must demonstrate an ability to serve not fewer than10,000 children from low-income families.

CRS-29
S. 2198 would also support a National Clearinghouse on Mathematics andScience Teaching Materials. The Secretary of Education would establish a nationalpanel, after consultation with the National Academies, to collect proven effective K-12 mathematics and science teaching materials, and create a clearinghouse of suchmaterials for dissemination to states and school districts. The bill would authorizethe appropriation of $20 million for each fiscal year — FY2007 through FY2011.
S. 2197 would provide for assistance to speciality schools for science andmathematics. The bill would require that funds and staff of the National Laboratoriesbe made available to assist in teaching courses at statewide speciality schools withcomprehensive programs in science, mathematics, and engineering.
Both S. 1614 and H.R. 609 would target the HEA, Title II, TeacherEnhancement Grant program to math and science teachers. Under the currentprogram, partnership grantees may provide professional development to improveteachers’ content knowledge; however, no particular subject areas are specified.Both bills would support efforts by partnership grantees to increase the number ofmath and science teachers and to provide opportunities for clinical experience in theareas of math and science. Both bills would also allow state grantees to supportbonus pay for math and science teachers.
H.R. 5358 would rename the current NSF Math and Science Partnershipprogram that supports teacher training partnerships between LEAs and either IHEsor eligible nonprofit organizations. Grantees would operate teacher institutes thatprovide intensive content instruction in science and mathematics, as well as inductionprograms for new teachers, professional development, and training in the use oftechnology and laboratory equipment. Grants would be awarded for a period of fiveyears at between $75,000 and $2 million per year. The bill would authorizeappropriations of $50 million for each of the fiscal years 2007 through 2011.
Increase STEM Baccalaureate Degree Attainment. S. 2198 wouldprovide support for a Future American Scientist Scholarships program. This programwould provide 25,000 new competitive merit-based undergraduate scholarships tostudents who are U.S. citizens. The scholarships would be awarded in the amountof $20,000 per year. The bill would authorize an appropriation of $375 million forFY2007; $750 million for FY2008; $1.125 billion for FY2009; and $1.5 billionannually for FY2010 through FY2013.
S. 1614 would create a new Mathematics and Science Scholars Program thatwould award $1,000 for each of up to two years to eligible undergraduate studentsmajoring in mathematics, science, technology, or engineering. To be eligible,students would have to complete a “rigorous secondary school curriculum inmathematics and science” as determined by the state. In determining priority for thescholarship winners, the governor of the state may take into consideration (1) thestudent’s regional or geographic location, (2) whether the student attended school ina high-need area, (3) attended a low-performing school, or (4) is a member of a groupunder-represented in STEM fields.
H.R. 609 would amend the current Robert C. Byrd Honors Scholarship Programto focus these awards on students pursuing a major in studies leading to a
CRS-30
baccalaureate, master’s, or doctoral degree in mathematics, engineering, or thephysical, life, or computer sciences. These scholarships would be for a period of upto five years, and would be equal to the students’ unmet financial need (i.e., the costof attendance minus any non-loan aid). At least 50% of the cost of these scholarshipswould have to come from non-federal funds.
H.R. 5358 would amend the current NSF Robert Noyce Scholarship Program,which provides scholarships to undergraduates majoring in STEM fields. Studentswould be eligible for a $10,000 scholarship annually (up from the current $7,500),and would be required to teach math or science in a high-need school. Recipientsmust serve two years as a teacher for every year they received a scholarship, with amaximum of four years of service. The bill would also make special considerationsfor students and working professionals attending part-time. The bill authorizes $50million for this program in FY2007, $70 million in FY2008, and $90 million forFY2009 through FY2011.
H.R. 5358 would establish a Talent Expansion Program, as well as Centers forUndergraduate Education in Science, Mathematics, and Engineering, which wouldaward grants to IHEs intended to improve and expand course-taking in STEM fields.The former program would be authorized at $40 million for FY2007, $45 million forFY2008, and $50 million for FY2009 through FY2011. The latter program wouldbe authorized at $4 million for FY2007, $10 million for FY2008 through FY2011.
Graduate Research and Early-Career Scholarship. S. 2198 wouldprovide funding for graduate research fellowships in the critical fields of science,mathematics, and engineering. The bill would establish a fellowship program toprovide tuition and financial support for eligible students pursuing master’s anddoctoral degrees in science, mathematics, and engineering, and other areas of nationalneed. S. 2198 would authorize appropriations of $225 million for FY2007, $450million for FY2008, and $675 million for FY2009 through FY2013.
Both S. 1614 and H.R. 609 would amend the Graduate Assistance in Areas ofNational Need program (HEA, Title VII, Section 711) to encourage study in STEMfields. The current program provides grants to institutions of higher education thataward graduate degrees in areas of national need. This program also fundsfellowships to graduate students pursuing doctoral degrees in areas of national needat eligible institutions. The Secretary of Education, in consultation with federalagencies and nonprofit organizations, is given the authority to determine the areas ofnational need. S. 1614 would require the Secretary to consult with specific federaland nonprofit agencies and organizations (including NAS) in determining the areasof national need. H.R. 609 would require that in determining the areas of nationalneed, the Secretary shall prioritize “math and science teachers, special educationteachers, and teachers who provide instruction for limited English proficientindividuals.”
S. 2109 proposes expanded graduate fellowship and graduate traineeshipprograms in the NSF. It would authorize the appropriation of $34 million each yearfor FY2007 through FY2011 for expansion of the Graduate Research FellowshipProgram in NSF. Such funding would allow for an additional 250 fellowships to beawarded to U.S. citizens each year during the five-year period. The total number of

CRS-31
fellowships to be awarded is 1,250. The bill also provides $57 million each year fora period of five years for the expansion of the Integrative Graduate Education andResearch Traineeship program in NSF. The support would provide an additional 250grants per year to U.S. citizens, for a total of 1,250 awards.
S. 2109 would direct the Secretary of the Department of Defense (DOD) toutilize appropriations for expansion of the Science, Mathematics, and Research forTransformation Defense Scholarship Program (SMART). The bill would providesupport for an additional 160 doctoral degrees and 60 master’s degrees for FY2007through FY2011. The Secretary of Defense would be charged with expanding by 200the number of participants in the National Defense Science and Engineering GraduateFellowship program each fiscal year from FY2007 through FY2011. S. 2109 callsfor the establishment of a program to award traineeships to undergraduate andgraduate students pursuing studies in areas important to DOD in science,mathematics, and engineering. The selected programs should expose students tomultidisciplinary studies, innovation-oriented studies, and academic, private sector,or government laboratories and research. Awardees would be required to work forDOD for 10 years following the completion of the degree program. The bill wouldauthorize appropriations in the amount of $11.1 million each year for FY2007through FY2011.
S. 2109 would establish a clearinghouse of successful professional sciencemaster’s degree programs, and make the program elements available to colleges anduniversities. Grants would be awarded for pilot programs at four-year institutionsthat foster improvement of professional science master’s degree programs. The billdirects that preference be given to institutions that obtain two-thirds of their fundingfrom non-federal support. A maximum of 200 grants would be awarded to four-yearinstitutions for one three-year term, with renewal possible for a maximum of twoadditional years. Language included in the bill states that performance benchmarksbe developed prior to the beginning of the program. The amount of $20 millionwould be made available for evaluation and reporting of the pilot program.
S. 2197 would authorize research grants for early-career scientists andengineers. The participants must have completed their degrees no more than 10 yearsbefore the awarding of the grants. Not less than 65 grants per year would be awardedto outstanding early-career researchers to support other researchers in the DOENational Laboratories, and federally funded research and development centers. Thegrants would be awarded for a period of five years in duration, and at a level of$100,000 for each year of the grant period. The bill would authorize the appropriationof $6.5 million in FY2007, $13 million in FY2008, $19.5 million in FY2009, $26million in FY2010, and $32.5 million in FY2011.
H.R. 5356 would authorize two new programs (one carried out by the NSFDirector and the other by the DOE Under Secretary of Science) that would awardgrants to scientists and engineers at the early stages of their careers at IHEs and otherresearch institutions. Five-year, merit-based grants are to be awarded at a minimumof $80,000 per year to support innovative projects that integrate research andeducation.
CRS-32
Federal Program Coordination. Under S. 2198, the Director of the Officeof Science and Technology Policy would establish a standing committee oneducation in mathematics, science, and engineering. The responsibility of thecommittee would include the development of national goals for support of thedisciplines by the federal government. Language in the bill stipulates that thereshould be public comment on the national goals. In addition, plans should beperiodically reviewed and updated by the Director.
S. 2197 calls for the creation of a position of Director of Mathematics, Scienceand Engineering Education, and charges that the Director administer and overseeprograms at the DOE. In conjunction with the NAS, the Director would assess, afterfive years, the performance of science and mathematics programs at DOE. The billwould establish a Mathematics, Science, and Engineering Education fund, using0.3% of funding made available to DOE for research, education, demonstration, andcommercial application.
H.R. 609 would establish Mathematics and Science Education CoordinatingCouncil Grants to assist states in coordinating math- and science-related activitiessupported by the Elementary and Secondary Education Act Title II, Part B,Mathematics and Science Partnerships Program, and the HEA Title II, TeacherQuality Enhancement Program.