Crown Equipment Corporation - University of Michiganhmrc/news/conference slides/Crown...
45
1 C Crown Equipment Corporation Crown Equipment Corporation HealthWise Program Review HealthWise Program Review 12 March 2008 12 March 2008
Transcript of Crown Equipment Corporation - University of Michiganhmrc/news/conference slides/Crown...

1
C
Crown Equipment CorporationCrown Equipment Corporation
HealthWise Program ReviewHealthWise Program Review
12 March 200812 March 2008

2
Crown Equipment Corporation Facts and Figures
Located in New Bremen, Ohio
Approximately 6,000 employees in the USA
Manufactures battery powered material handling equipment
$1.5 billion privately owned business
8 Manufacturing Plants in the New Bremen Area
3 Manufacturing Plants outside of Ohio (IN & NC)
40 Branches located in 20 States

3
Learning Objectives
1. Provide understanding about our HealthWise Program, a next generation HMP.
2. Demonstrate a reduction in risk factors within the Crown population.
3. Demonstrate an improvement in medical costs within the Crown population.
4. Allow time for Q&A to insure that all attendees understand the success of HealthWise.

4
Key Factors for Success1. Senior Management Support
2. Cross-functional Committee
3. Alignment with HMRC
4. Appropriate Incentives
5. Alignment of Benefits
6. Development of Key Measurements
7. Manager & Support Staff

5
Components of HealthWise1. Appropriate Incentives
2. Health Risk Appraisal (HRA)
3. Wellness Screening
4. Health Advisor
5. HealthWise Website
6. Vending improvements

6
1. Appropriate Incentivesa. Health Benefit Credit (annual): $520
Employee - $325Spouse - $195
b. Cash Award for Health Advising: $100Estimate 35% of our populationRoughly 2,700 employees & spouses
c. Subway Card for the Healthy: $10About 1,500 employees

7
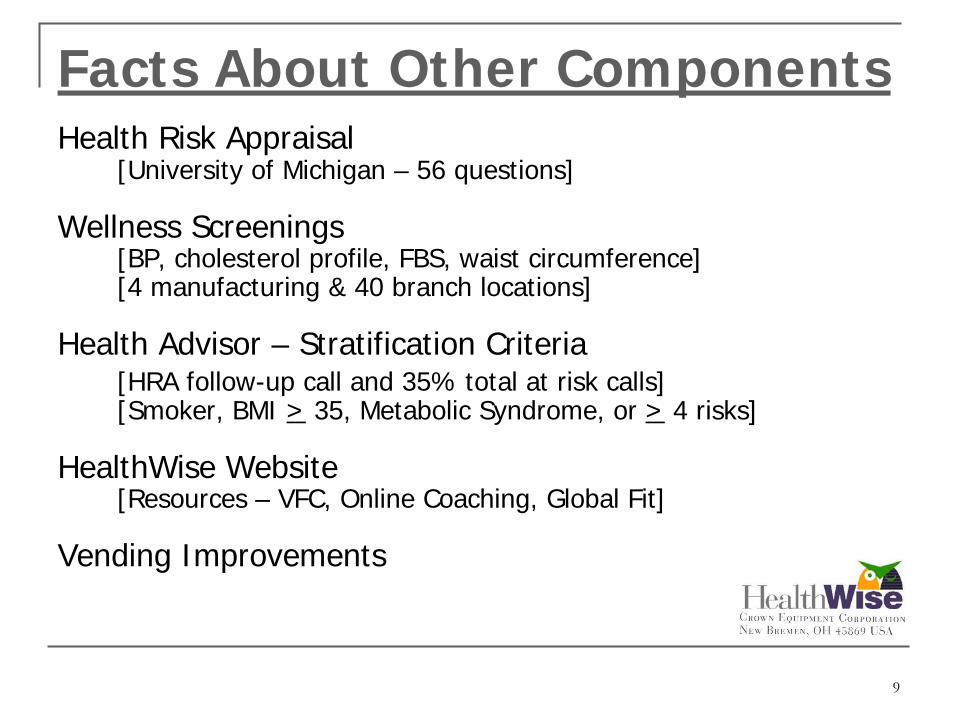
Facts About Other ComponentsHealth Risk Appraisal
[University of Michigan – 56 questions]
Wellness Screenings [BP, cholesterol profile, FBS, waist circumference] [4 manufacturing & 40 branch locations]
Health Advisor – Stratification Criteria [HRA follow-up call and 35% total at risk calls] [Smoker, BMI > 35, Metabolic Syndrome, or > 4 risks]
HealthWise Website [Resources – VFC, Online Coaching, Global Fit]
Vending Improvements

8
9
Facts About Other ComponentsHealth Risk Appraisal
[University of Michigan – 56 questions]
Wellness Screenings [BP, cholesterol profile, FBS, waist circumference] [4 manufacturing & 40 branch locations]
Health Advisor – Stratification Criteria [HRA follow-up call and 35% total at risk calls] [Smoker, BMI > 35, Metabolic Syndrome, or > 4 risks]
HealthWise Website [Resources – VFC, Online Coaching, Global Fit]
Vending Improvements

10
Program Participation 1. HRA/Wellness Screening
2. HRA Follow-Up Call
3. Additional Health Advising
4. YMCA Initiative
5. Risk Status/Transition

11
Cumulative HRA Participation
9 0 % 9 2 % 9 2 %9 0 %9 4 % 9 5 %
8 6 % 8 8 %
7 6 %
0 %
2 0 %
4 0 %
6 0 %
8 0 %
1 0 0 %
2 0 0 4 ( N = 4 2 5 7 ) 2 0 0 5 ( N = 4 6 7 9 ) 2 0 0 6 ( N = 4 8 8 9 )
A n n u a l C u m u l a t i ve 2 + T i m e P a r t i c i pa n t s 3 T i m e P a r t i c i p a n t s

12
Health Advising Statistics - 2007HRA Completers 7641
Completed HRA Follow-Up Call 7301 (95.6%)
Enrolled in 6 Month Program 2151 (29.5%)
Completed 6 Month Program 1751 (81.4%)
Average Contacts/Participant 3.7
Average Contacts/6 Month Participant 5.1
Number of Contact Range 1 to 25
13
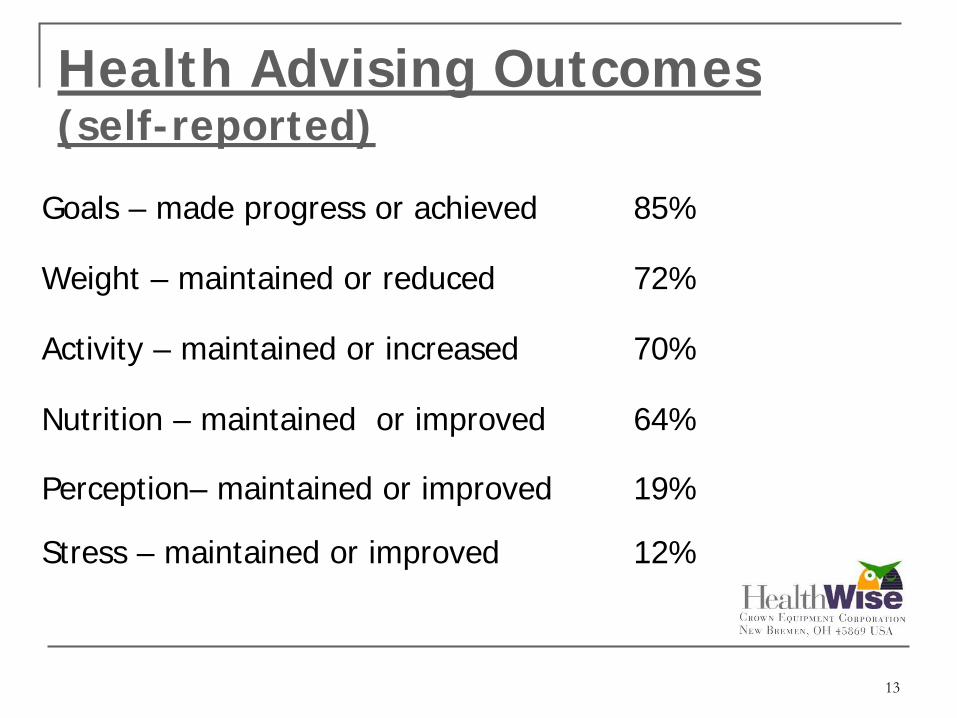
Health Advising Outcomes (self-reported)
Goals – made progress or achieved 85%
Weight – maintained or reduced 72%
Activity – maintained or increased 70%
Nutrition – maintained or improved 64%
Perception– maintained or improved 19%
Stress – maintained or improved 12%

14
YMCA Initiative Comparison# of employees free 2 month membership(2004-2006 Jan/Feb, 2007-2008 Dec/Jan)
78105 110
175197
0
50
100
150
200
250
2004 2005 2006 2007 2008
2005 – 4 new memberships
2006 – 12 new memberships
2007 – 32 new memberships
2008 – 25 new memberships YMCA requesting November/December as free months

15
HRA Risk Status 2004 – 2007: #1
Each Year HRA Participants
Risk Status Year 2004 Year 2005 Year 2006 Year 2007(N=4,498) (N=4,865) (N=5,241) (N=7,641)
Existing Medical Conditions 7.0% 7.3% 6.9% 8.0%Smoking 20.9% 21.0% 20.8% 18.1%Physical Activity 17.7% 14.4% 13.6% 14.9%Body Weight 50.3% 50.3% 50.4% 49.8%Blood Pressure 38.0% 34.7% 35.5% 33.1%Perceived Health 12.4% 11.8% 11.3% 11.2%Stress 30.2% 26.6% 24.8% 21.4%Alcohol 7.0% 5.9% 5.1% 3.6%Cholesterol 15.9% 16.3% 13.4% 12.2%Life Satisfaction 20.9% 17.4% 15.4% 13.3%Illness Days 5.4% 5.2% 5.1% 4.8%Safety Belt Use 41.7% 36.1% 32.5% 26.9%Health Age Index 10.1% 7.3% 7.2% 5.7%Medication/Drug for Relaxation 11.1% 11.5% 11.2% 13.1%

16
HRA Risk Status 2004 – 2007: #2Each Year HRA Participants
Year 2004 Year 2005 Year 2006 Year 2007(N=4,498) (N=4,865) (N=5,241) (N=7,641)
Job Satisfaction 17.1% 12.9% 11.0% 9.7%0 risk 7.1% 9.5% 10.9% 12.8%1 risk 16.7% 17.9% 19.4% 22.1%2 risks 21.4% 22.7% 23.1% 23.5%3 risks 18.8% 18.7% 18.3% 17.1%4 risks 13.6% 13.6% 12.4% 10.9%5 risks 10.2% 8.3% 7.9% 6.7%6+ risks 12.2% 9.2% 8.0% 7.0%
Risk LevelsLow Risk (0-2 risks) 45.2% 50.1% 53.4% 58.3%Medium Risk (3-4 risks) 32.4% 32.3% 30.7% 28.0%High Risk (5+ risks) 22.4% 17.5% 15.9% 13.7%
Average Risk 3.1 2.8 2.6 2.5
Average Wellness Score 77.3 80.7 80.9 82.3
Average Age 40.1 40 39.8 40.3

17
279 (36.7%)
487 (43.1%)
185(24.3%)
Crown EquipmentRisk Transitions
2004 – 2007High Risk(>4 risks)High Risk(>4 risks)
Low RiskLow Risk(0 (0 -- 2 risks)2 risks)
Medium RiskMedium Risk(3 (3 -- 4 risks)4 risks)
296 (38.9%)
1,295 (79.6%)
488(43.2%)
1,129 (32.1%)
760 (21.6%)
1,627 (46.3%)
1,054 (30.0%)
495 (14.1%)
1,967 (55.9%)
4545(2.8%)(2.8%)
154 (13.6%)154 (13.6%)
287 (17.6%)287 (17.6%)
Crown Equipment employees participated in 4 HRAs in 2004, 2005, 2006, and 2007 (N=3,516).
18
Crown Data 2004-20071. Metabolic Syndrome
2. Health Care Cost Trends
3. Potential Cost Savings

19

20

21
Identification of Metabolic Syndrome Any 3 of the following:
Risk Factor Defining Level1. Waist Size
Men > 40 in (>102 cm)Women > 35 in (>88 cm)
2. Triglycerides > 150 mg/dL
3. HDLMen < 40 mg/dLWomen < 50 mg/dL
4. Blood Pressure > 130 / 85 mm Hg
5. Fasting Glucose > 110 mg/dL

22
Metabolic Syndrome #1Metabolic Syndrome Risks Factors 2004
Risks Number of people at risk
0 risk 772 23.5%
1 risk 789 24.0%
2 risks 741 22.6%
3 risks 552 16.8%
4 risks 316 9.6%
5 risks 115 3.5%
Without Metabolic Syndrome 2,302 70.1%
With Metabolic Syndrome 983 29.9%
Totals 3,285 100.0%
*significantly different (p<.05) than those without metabolic syndrome, after controlling for age, gender and ethnicity.

23
Metabolic Syndrome #2
Risks Number of people at risk
0 risk 770 21.3%
1 risk 813 24.7%
2 risks 720 21.9%
3 risks 580 17.7%
4 risks 355 10.8%
5 risks 117 3.6%
Without Metabolic Syndrome 2,233 68.0%
With Metabolic Syndrome 1,052 32.0%
Totals 3,285 100.0%
*significantly different (p<.05) than those without metabolic syndrome, after controlling for age, gender and ethnicity.
Metabolic Syndrome Risks Factors 2006

24
Metabolic Syndrome #3
M etabolic Syndrome Prevalence from 2004 to 2006
2004 29.9% with metabolic
syndrome
2006 32.0% with metabolic syndrome
The prevalence of metabolic syndrome increased from 29.9% in 2004 to 32.0% in 2006. Among those who were low risk in 2004, 15% of them moved to high risk in 2006. On a positive note, among the 983 individuals who were high risk in 2004, 27.3% of them reduced enough risks to be considered low risk in 2006.
Low Risk N=2302 70.1%
High Risk N=983 29.9%
Low Risk N=1965 85.4%
High Risk N=337 14.6%
Low Risk N=268 27.3%
High Risk N=715 72.7%
25
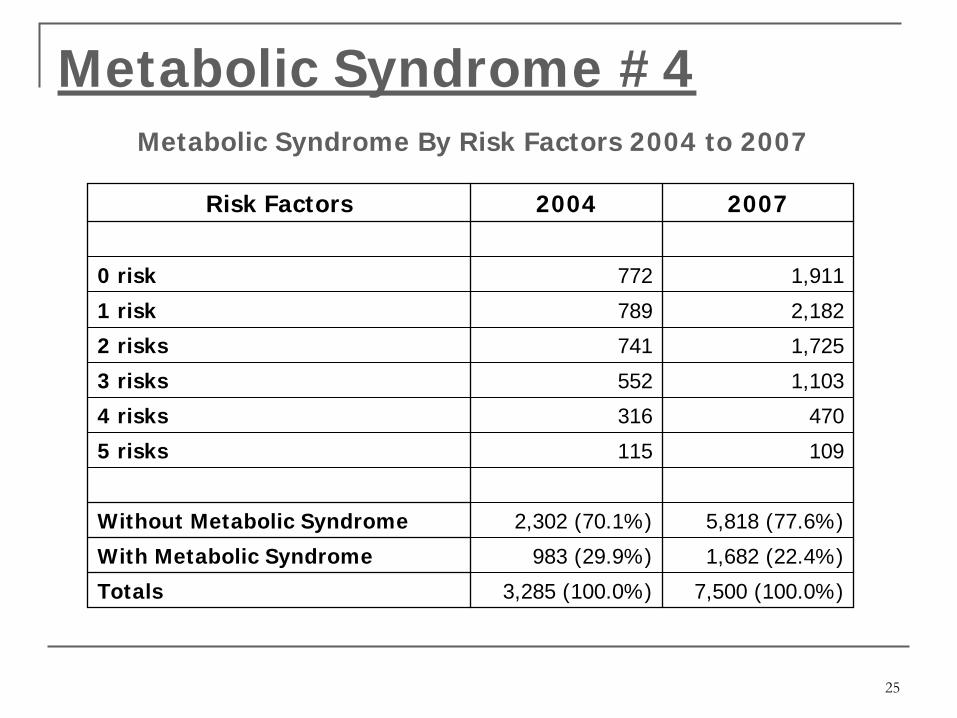
Metabolic Syndrome #4Metabolic Syndrome By Risk Factors 2004 to 2007
Risk Factors 2004 2007
0 risk 772 1,911
1 risk 789 2,182
2 risks 741 1,725
3 risks 552 1,103
4 risks 316 470
5 risks 115 109
Without Metabolic Syndrome 2,302 (70.1%) 5,818 (77.6%)
With Metabolic Syndrome 983 (29.9%) 1,682 (22.4%)
Totals 3,285 (100.0%) 7,500 (100.0%)

26

27

28

29
Health Care Cost TrendsDistribution of Average Annual Health Costs by Age
0%
5%
10%
15%
20%
<25 25-29 30-34 35-39 40-44 45-49 50-54 55-59 60-64 65+
% o
f Pop
ulat
ion
Avg
. Ann
ual H
ealth
Car
e Pa
id
2004 2006

30
Costs Associated with Risks Medical Paid Amount x Age x Risk
$2,098
$4,530
$5,813$7,123
$4,401
$3,216
$1,550$2,667
$3,364
$4,718
$3,069$2,480
$1,351 $2,110
$2,912
$3,894
$2,605 $2,200
$1,122$1,523 $2,081
$2,941$1,851 $1,641
$0$1,000$2,000$3,000$4,000$5,000$6,000$7,000
19-34 35-44 45-54 55-64 65-74 75+
Edington. AJHP. 15(5):341-349, 2001
High RiskMedium Risk
Low RiskNon Participant

31
$840 $1,261
$3,321
$0
$1,000
$2,000
$3,000
$4,000
$5,000
$6,000
Low Risk (0-2Risks)
HRA Non-Participant
Medium Risk(3-4 Risks)
High Risk (5+Risks)
Excess CostsBase Cost
Excess Medical Costs due to Excess Risks
$2,199
$3,039$3,460
$5,520
Edington, AJHP. 15(5):341-349, 2001

32
Low Risk (0-2 Risks) Medium Risk (3-4Risks)
High Risk (5+ Risks) HRA Non-Particip
Excess Costs
Base Cost
Excess Health Care Costs due to Excess Risks
Crown Equipment Corporation: 2004 – 2006

33

34

35
36
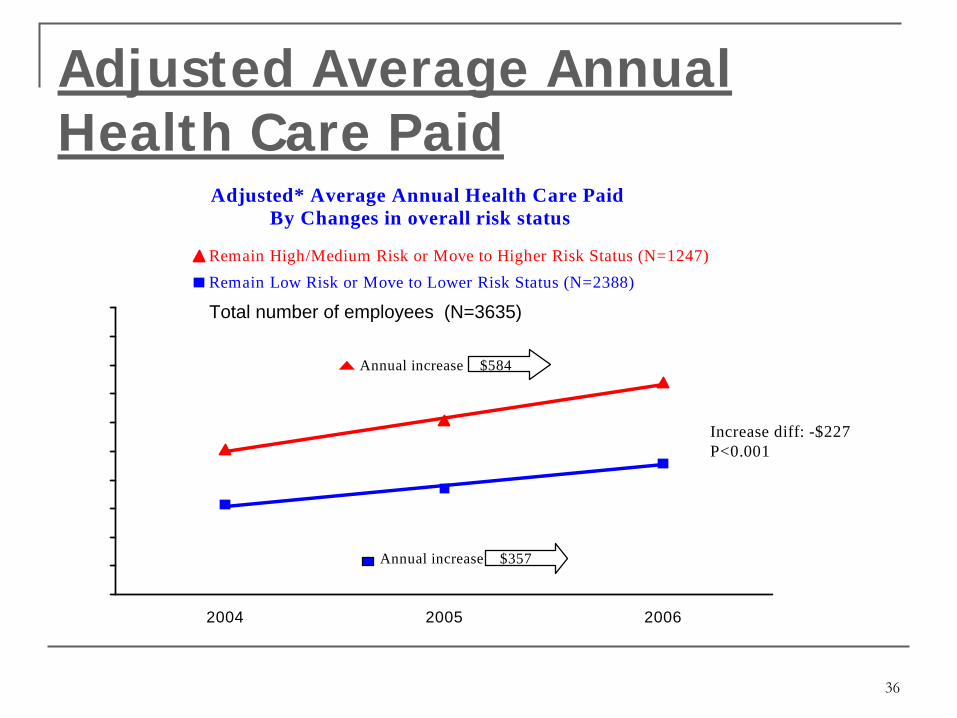
Adjusted Average Annual Health Care Paid
Adjusted* Average Annual Health Care Paid By Changes in overall risk status
2004 2005 2006
Remain High/Medium Risk or Move to Higher Risk Status (N=1247)Remain Low Risk or Move to Lower Risk Status (N=2388)
Increase diff: -$227 P<0.001
Annual increase $584
Annual increase $357
Total number of employees (N=3635)

37
1) Difference in cost between high/medium risk and low risk employees at Crown Equipment Corporation:
a) 2004: $949 / employee b) 2005: $1,181 / employee c) 2006: $1,402 / employee d) 2007: $1,629 / employee (estimated)
2) Number of employees who moved to low risk: a) Risk Transitions 2004-2007: 340 employees b) Natural Flow 2004-2007: 81 employees
[Natural flow over 3 years is -5.0%] c) Total number: 421 employees
3) Potential Cost Savings:a) Conservative number = 340 x $1,629 = $553,860 b) Approximate number = 421 x $1,629 = $685,809
Potential Cost Savings from Movement to Low Risk

38
Relationship Between Annual Medical and Pharmacy Costs and Wellness Score
$2087
$1800 $1643
$1415
$2369
$2817
$2508
$1,200
$1,700
$2,200
$2,700
65 70 75 80 85 90 95
Annual Medical Costs
Wellness Score
One Point in Wellness Score
Equals $56
$2087
$1800 $1643
$1415
$2369
$2817
$2508
$1,200
$1,700
$2,200
$2,700
65 70 75 80 85 90 95
Annual Medical Costs
Wellness Score
One Point in Wellness Score
Equals $56
JOEM: 45(10):1049-1057, 2003
University of Michigan HMRC

39
Four Time HRA Participants
Year 2004 2005 2006 2007Average 77.2 80.7 80.9 81.4Wellness Score
Number of 3,516 3,516 3,516 3,516Employees
Average Age 40.7 41.6 42.6 43.5
Statistics1) One point in wellness score = $56 / employee2) Improvement of 4.2 points between 2004 and 20073) Potential cost savings = $56 x 4.2 x 3,516 = $826,963
Crown Average Wellness Score

40
Summary Questions & Answers1.Are we making a difference at Crown?
a. Risk Factorsb. Health Care Costs
2.Is there more work to be done at Crown?a. Keep participation at > 90%b. Move the low risk group to 80%c. Improve the overall wellness scored. Keep the low risk people low risk
3.Who benefits from our HealthWise Program?a. Employeesb. Employer

41

42
C
Questions & Answers
or
Preguntas y Respuestas

43
C
Thank You!
James R. Heap, [email protected]
419-629-2311
Karen O’FlahertyKaren.o’[email protected]
419-629-2311

Health Risks and BehaviorsHealth Risk Measure
AlcoholBlood PressureBody WeightCholesterolExisting Medical ProblemHDLIllness DaysLife SatisfactionPerception of HealthPhysical ActivitySafety Belt UsageSmoking Stress
High Risk Criteria
More than 14 drinks/weekSystolic >139 mmHg or Diastolic >89 mmHgBMI ≥
27.5Greater than 239 mg/dlHeart, Cancer, Diabetes, StrokeLess than 35 mg/dl>5 days last yearPartly or not satisfiedFair or poorLess than one time/weekUsing safety belt less than 100% of timeCurrent smokerHigh
OVERALL RISK LEVELSLow RiskMedium RiskHigh Risk
0 to 2 high risks3 to 4 high risks5 or more high risks

45
Disability Trends Related to Change in Risks (Among two time HRA Participants, N=3281)
3 or More Risks Disability Days:
2.66 (N=1771)
0- 2 Risks Disability Days:
0.97 (N=1510)
3 or More Risks Disability Days:
2.88 (N=1176)
3 or More Risks Disability Days:
2.42 (N=298)
0- 2 Risks Disability Days:
2.02 (N=595)
0-2 Risks Disability Days:
1.24 (N=1212)
Time One HRA 2004 Disability
Days
Time Two HRA 2006 Disability
Days
+0.22 -0.64 +1.45 +0.27