Crowdsourcing Bike Share Station Locations: Evaluating ... · Crowdsourcing Bike Share Station...
17
Crowdsourcing Bike Share Station Locations: Evaluating participation and placement Greg P. Griffin and Junfeng Jiao Abstract Problem, Research Strategy, and Findings: Planners increasingly involve stakeholders in co-producing vital planning information by crowdsourcing data using online map-based commenting platforms. Few studies, however, investigate the role and impact of such online platforms on planning outcomes. We evaluate the impact of participant input via a public participation geographic information system, PPGIS, a platform to suggest placement of new bike share stations in New York City and Chicago. We conducted two analyses to evaluate how close planners built new bike share stations to those suggested on PPGIS platforms. Our proximity analysis found that only a small percent of built stations were within 100 ft (30 m) of suggested stations, but our geospatial analysis showed a substantial clustering of suggested and built stations in both cities, not likely due to random distribution. We find that the PPGIS platforms have great promise for creating genuine co-production of planning knowledge and insights and that system planners did take account of the suggestions offered online. We did not, however, interview planners in either system, and both cities may be atypical as is bike share planning; moreover, multiple factors influence where bike stations can be located so that not all suggested stations could be built. Takeaway for Practice: Planners can use PPGIS and similar platforms to help stakeholders learn by doing and to increase their own local knowledge to improve planning outcomes. Planners should work to develop better online participatory systems and to allow stakeholders to provide more and better data, continuing to evaluate PPGIS efforts in order to improve the transparency and legitimacy of online public involvement processes. Keywords bike share; PPGIS; crowdsourcing; co-production Public participation is a critical element in most formal US planning processes. The American Institute of Certified Planners’ Code of Ethics and Professional Conduct specifies that planners must “give people the opportunity to have a meaningful impact on the development of plans and programs that may affect them” (AICP, 2016). Planners now widely include digital participation methods in their practice, intensifying questions about the efficacy and legitimacy of citizen input. We assess evidence on how planners use crowdsourcing as a form of Preprint manuscript The Version of Record of this manuscript will be available at: Griffin, G. P., & Jiao, J. Crowdsourcing bike share station locations: Evaluating participation and placement. Journal of the American Planning Association. https://doi.org/10.1080/01944363.201 8.1476174 About the authors: Greg P. Griffin, AICP ([email protected] or [email protected]) is a Ph.D. candidate at the University of Texas at Austin. Junfeng Jiao ([email protected]) is an assistant professor at the University of Texas at Austin.
Transcript of Crowdsourcing Bike Share Station Locations: Evaluating ... · Crowdsourcing Bike Share Station...
Crowdsourcing Bike Share
Station Locations: Evaluating
participation and placement
Greg P. Griffin and Junfeng Jiao
Abstract
Problem, Research Strategy, and Findings: Planners increasingly involve stakeholders in
co-producing vital planning information by crowdsourcing data using online map-based
commenting platforms. Few studies, however, investigate the role and impact of such online
platforms on planning outcomes. We evaluate the impact of participant input via a public
participation geographic information system, PPGIS, a platform to suggest placement of new
bike share stations in New York City and Chicago. We conducted two analyses to evaluate
how close planners built new bike share stations to those suggested on PPGIS platforms. Our
proximity analysis found that only a small percent of built stations were within 100 ft (30 m)
of suggested stations, but our geospatial analysis showed a substantial clustering of
suggested and built stations in both cities, not likely due to random distribution. We find that
the PPGIS platforms have great promise for creating genuine co-production of planning
knowledge and insights and that system planners did take account of the suggestions offered
online. We did not, however, interview planners in either system, and both cities may be
atypical as is bike share planning; moreover, multiple factors influence where bike stations
can be located so that not all suggested stations could be built.
Takeaway for Practice: Planners can use PPGIS and similar platforms to help stakeholders
learn by doing and to increase their own local knowledge to improve planning outcomes.
Planners should work to develop better online participatory systems and to allow
stakeholders to provide more and better data, continuing to evaluate PPGIS efforts in order
to improve the transparency and legitimacy of online public involvement processes.
Keywords
bike share; PPGIS; crowdsourcing; co-production
Public participation is a critical element in most
formal US planning processes. The American
Institute of Certified Planners’ Code of Ethics and
Professional Conduct specifies that planners must
“give people the opportunity to have a
meaningful impact on the development of plans
and programs that may affect them” (AICP,
2016). Planners now widely include digital
participation methods in their practice,
intensifying questions about the efficacy and
legitimacy of citizen input. We assess evidence on
how planners use crowdsourcing as a form of
Preprint manuscript
The Version of Record of this manuscript
will be available at:
Griffin, G. P., & Jiao, J. Crowdsourcing
bike share station locations:
Evaluating participation and
placement. Journal of the American
Planning Association.
https://doi.org/10.1080/01944363.2018.1476174
About the authors: Greg P. Griffin, AICP
([email protected] or [email protected])
is a Ph.D. candidate at the University of Texas at
Austin. Junfeng Jiao ([email protected]) is an
assistant professor at the University of Texas at
Austin.
participation by evaluating cases of bike share
system planning in New York (NY) and Chicago
(IL). We explored the relationship between where
people suggested bike stations and where stations
were built in these two cities.
New York and Chicago each used a public
participation GIS platform (PPGIS) in
conjunction with more traditional neighborhood
meetings and community workshops to solicit the
views of stakeholders on where to locate bike
share stations. Participants using the online
platforms could specify the precise location of a
suggested bike share station and offer a written
defense of their suggestions. Our goal was to
understand the extent of co-productive behavior;
that is the extent to which planners used the
suggestions offered by online participants. We
asked two research questions: First, did the bike
share systems build stations close to where the
public suggested? Second, how does the
proximity of suggested and built bike share
locations vary geographically across the systems?
We used two quantitative metrics to address the
two questions, a proximity analysis and a
geostatistical analysis (Moran’s I); they gave
different results.
Our initial proximity analysis found that the
two city bike share systems only located 5% and
10% of built bike share stations within 100 ft (30
m) of the locations suggested online in NYC and
Chicago, respectively. In both cities, participants
suggested more stations in downtown than in
other areas in the larger metropolitan area. The
Chicago bike share system was twice as likely to
locate built stations within 100 ft of suggested
locations near Chicago’s core than it was to locate
built stations near suggested locations in the outer
ring of the system. This simple relationship did
not hold in New York.
Our second analysis, a geostatistical tool,
gave us a more nuanced understanding of the
spatial relationships between suggested and built
stations. We found that a higher percent of
suggested and built stations were closely
clustered spatially: 15% and 17% of suggested
stations in NYC and Chicago respectively were
statistically close to built stations and not
randomly distributed. The two systems built
stations statistically closer to suggested stations
in the core area (NYC: 17% and Chicago 29%),
and statistically fewer stations in the in the outer
areas of the bike share systems (NYC: 3% and
Chicago 7%). We conclude, based on the second
analysis, that the PPGIS platform, one of several
involvement methods, did have a meaningful
impact on where systems located bike share
stations, and this constituted a form of co-
productive behavior. We admit that there are
currently no hard guidelines on how much or how
many suggestions planners must listen to or
accept for us to be able to confidently say that
PPGIS (or any) participants were actively
involved in co-productive behavior. Our analyses
are based only on quantitative measures as well;
we did not interview any of the stakeholders
involved although we did read multiple public
documents.
We believe our findings have three lessons
for planners. First, PPGIS does provide an action-
oriented, co-productive approach to collect
geographically-specific local ideas for urban
planning. Second, PPGIS platforms can support
participant learning-by-doing, and provide useful
results for planning, if done correctly and if
planners know how to use the input effectively.
Third, and most significantly, planners and
researchers must continue to evaluate PPGIS
efforts to improve the transparency and
legitimacy of online public involvement
processes.
We first discuss the foundations of
participatory planning and the role of new
technologies in these processes in the following
sections; we then provide background on the use
of PPGIS in New York City and Chicago, our
methods, and results. We conclude by justifying
our findings and what we consider their
implications for planning, as we just described
them here.
Planning with the crowd Participatory planning opens a decision-making
process to the people likely to be impacted by the
ultimate decisions. Urban planning in democratic
countries has supported participatory processes
since the late 20th Century, valuing input from
citizens and explicitly using their ideas in
decision-making, albeit at varying levels
(Alexander, 2001; Healey, 1997; Margerum,
2002). Planning without a meaningful
participatory element runs contrary to traditional
tenets of representative democracy, including
leadership that respects and understands public
views, or at least those of voters (Campbell &
Marshall, 2000). Public participation is at the core
of current planning practice and is often
mandated in formal planning processes by
various levels of government (Brody, Godschalk,
& Burby, 2003; Sciara, 2017). Empirical studies
demonstrate that the breadth and depth of public
involvement contribute to plan strength and
implementation (Burby, 2003). Many scholars
and participants, however, question the validity
and legitimacy of a range of participatory
processes (Forester, 2001; Trapenberg Frick,
2013), increasingly including online platforms
(Afzalan & Muller, 2018).
A public process requires broad
representation, which may be facilitated by, or
even require the use of multiple involvement
methods including online based technologies that
incorporate social media (Evans-Cowley &
Griffin, 2012; Schweitzer, 2014). Online
technologies may allow and even encourage co-
productive planning, a concept which involves
participants by emphasizing doing planning
versus talking about planning, spotlighting
specific actions those stakeholders may undertake
in concert with government organizations. Co-
productive actions are those in which the public
performs needed planning roles otherwise
conducted by planners within an agency (Watson,
2014). Planners are expanding their use of online
participatory technologies to facilitate co-
productive planning, in particular, to incorporate
crowdsourcing approaches. In crowdsourcing, an
organization, like a planning agency, requests
information and ideas from a large and relatively
open group of Internet users. Participants use an
online portal in each instance, through a computer
or smartphone, to provide needed information,
ideas, or value judgments in response to these
direct requests by planners.
Planners have used crowdsourcing
techniques to identify and assess historic
structures (Minner, Holleran, Roberts, & Conrad,
2015); collect travel data (Griffin & Jiao 2015),
and to assess property conditions (Thompson,
2016). Some scholars suggest that these
techniques might support planning in a manner
that is convenient to participants and
geographically specific, providing useful
information to planners (Evans-Cowley &
Hollander, 2010; Griffin, 2014; Kahila-Tani,
Broberg, Kyttä, & Tyger, 2016). Afzalan and
Muller (2018), however, note concerns about how
well planners can use some or all data provided
online. Planners’ increasing use of complex
systems and widespread public adoption of
information and communication technology
opens a knowledge gap on how planners should
balance sophistication and openness in
participatory planning (Goodspeed, 2016).
Co-production in bike share planning, the
focus of this paper, allows and encourages the
public to share perceptions and opinions and
submit ideas for station locations based on their
own experience of the environment. Those
community insights could then result in a
valuable GIS dataset that planners could integrate
with other sources to choose the best locations for
bike stations. We take advantage of the speed and
relative simplicity of planning for bike share
systems to evaluate the actual outcome of online
participatory technologies, overcoming
challenges that face other evaluation studies. The
majority of studies evaluating participation in
planning focus on assessing the plan before actual
implementation takes place (ex-ante), or during
implementation, termed ongoing by Guyadeen
and Seasons (2018). Time lag and situational
complexity often prevent many planning
evaluation studies from connecting process with
completed real-world outcomes through ex-post
evaluations—a significant gap in knowledge
about the effectiveness of planning (Guyadeen
and Seasons 2018). Bike sharing, however, is
implemented quickly relative to other
transportation improvements, allowing ex-post
evaluation of the role of the participatory
processes that supported those efforts with a
minimum of intervening complexities.
We note that the literature suggests that
technology-supported public involvement,
however useful, may be insufficient to open the
planning process to all relevant stakeholders
(Desouza & Bhagwatwar, 2014). Afzalan and
Muller (2018) review the literature on the
strengths and weaknesses of a variety of online
participatory techniques, finding that any online
participatory tool inherently excludes those
without technology access, knowledge, or
interest. Participants, moreover, may be limited in
the kind of information they can provide on
various platforms, while planners may have
challenges evaluating and analyzing the results.
Afzalan and Muller (2018) find that planning
agencies are often poorly equipped to make the
best decisions about which technology to acquire
and the staffing and training needed to operate
these platforms successfully, protect user privacy,
and appropriately use the data.
Evaluating the role of PPGIS in Planning for
Bike Sharing Online public technologies create new
opportunities for reaching audiences and
stakeholders for participatory planning but create
new challenges for planners and publics as well
(Afzalan & Muller, 2018). Civic-oriented
software developers have launched replicable
PPGIS platforms for collecting geographically-
based public input on a variety of topics. Use of
PPGIS and bike sharing technologies are
increasingly common, and have stabilized,
changing less than during early implementations.
However, little plan evaluation research evaluates
or measures the impact of PPGIS on actual
planning outcomes or impacts.
Most current studies of PPGIS tend to
evaluate the tools and methods, that is, ex-ante or
ongoing assessments, rather than the outcomes of
the participatory process (Brown & Kyttä, 2014).
Planning agencies using PPGIS seldom have the
time and resources to perform systematic
evaluations of the relationship between public
inputs and the results of the planning efforts they
are supporting (Guyadeen & Seasons, 2018;
Afzalan & Muller, 2018). Academics have
avoided evaluating the outcomes of PPGIS
processes because of the time delay involved in
seeing projects come to fruition (Brown & Kyttä,
2014). A 2016 case study of four United States
bike share PPGIS platforms analyzed the
potential for representative bias among platform
users (Piatkowski, Marshall, & Afzalan, 2017).
The researchers found that the PPGIS
contributions did not represent the community at
large, concluding that using only the online
platform could exacerbate problems for equity of
access to the bike share system (Piatkowski,
Marshall, & Afzalan, 2017). Another study of
PPGIS use in planning for Muncie (IN) also
found bias in geographic representation (Radil &
Jiao, 2016). Bike share planning in Cincinnati
(OH) relied on the PPGIS for public input, while
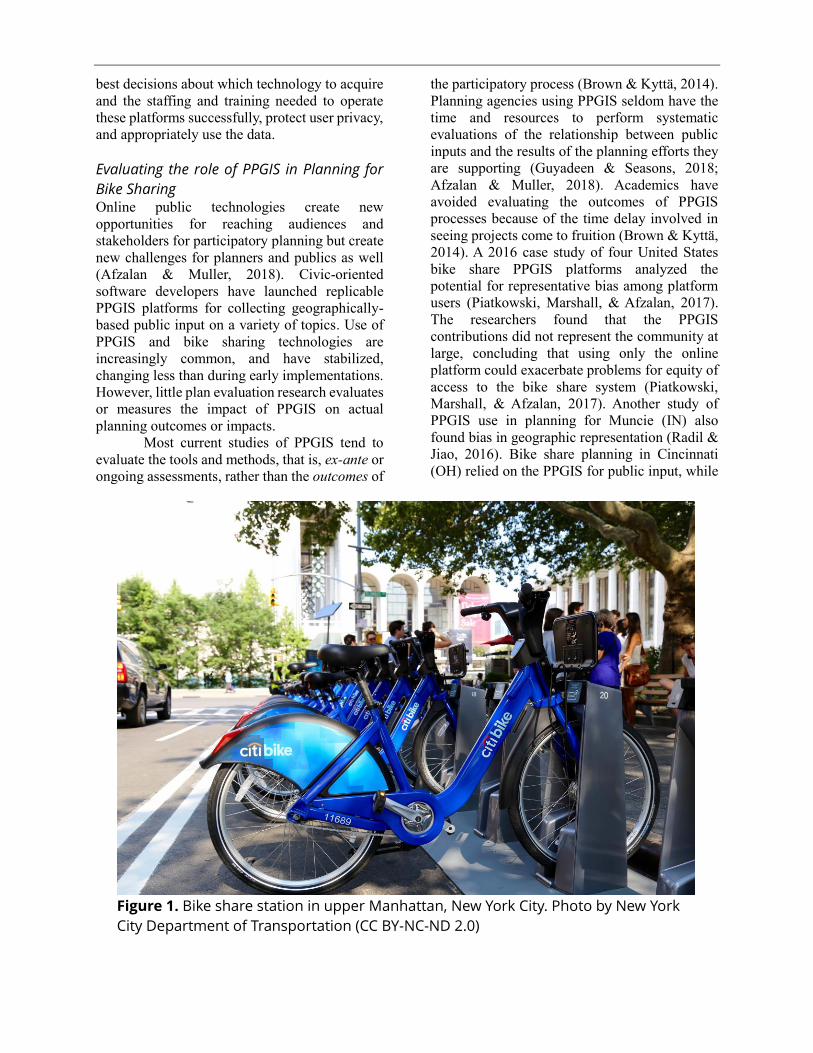
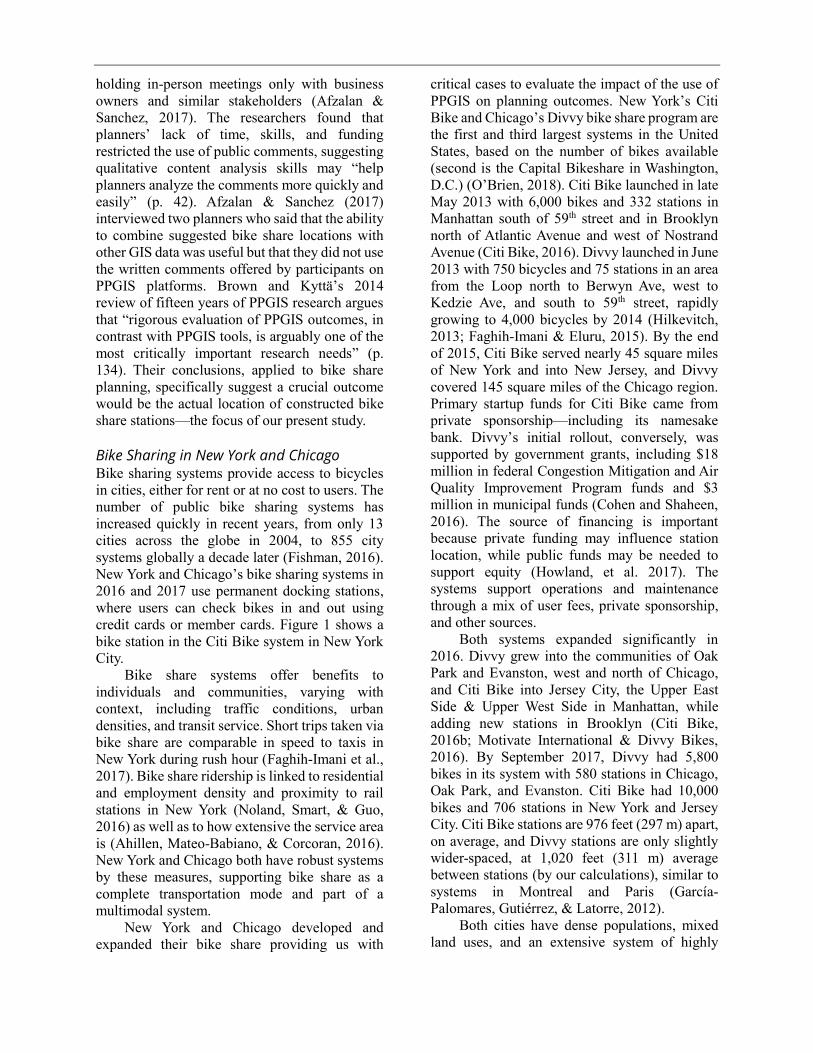
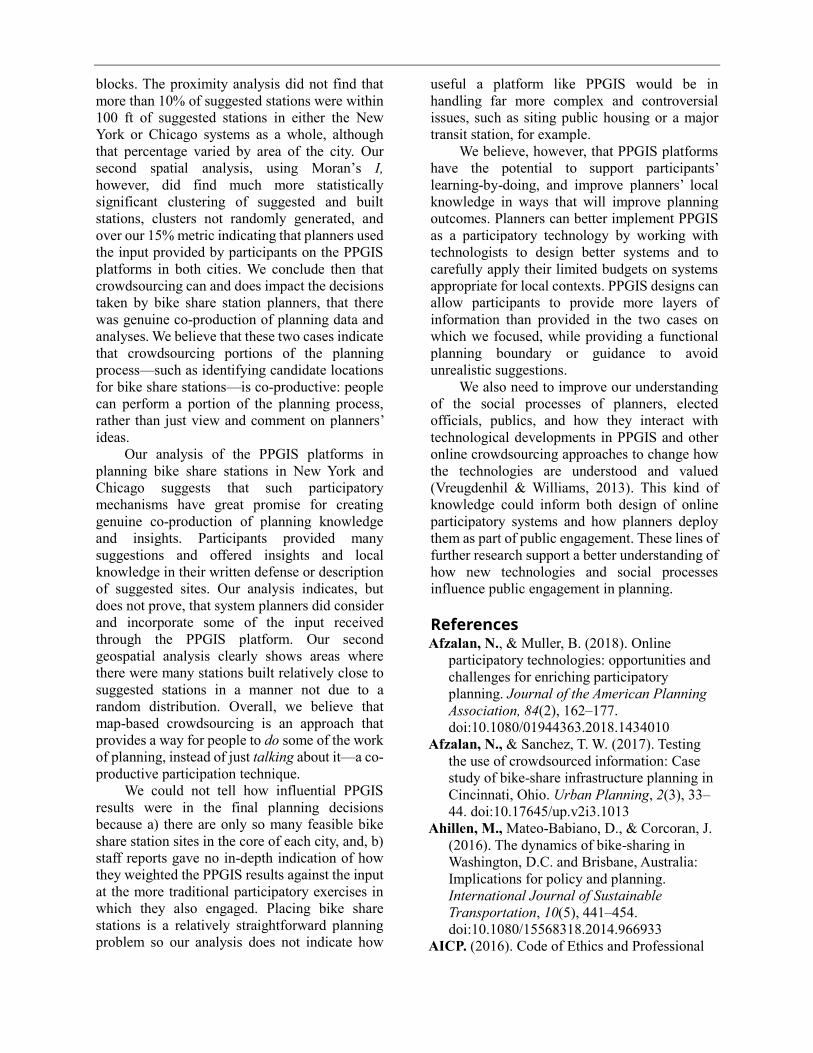
Figure 1. Bike share station in upper Manhattan, New York City. Photo by New York
City Department of Transportation (CC BY-NC-ND 2.0)
holding in-person meetings only with business
owners and similar stakeholders (Afzalan &
Sanchez, 2017). The researchers found that
planners’ lack of time, skills, and funding
restricted the use of public comments, suggesting
qualitative content analysis skills may “help
planners analyze the comments more quickly and
easily” (p. 42). Afzalan & Sanchez (2017)
interviewed two planners who said that the ability
to combine suggested bike share locations with
other GIS data was useful but that they did not use
the written comments offered by participants on
PPGIS platforms. Brown and Kyttä’s 2014
review of fifteen years of PPGIS research argues
that “rigorous evaluation of PPGIS outcomes, in
contrast with PPGIS tools, is arguably one of the
most critically important research needs” (p.
134). Their conclusions, applied to bike share
planning, specifically suggest a crucial outcome
would be the actual location of constructed bike
share stations—the focus of our present study.
Bike Sharing in New York and Chicago Bike sharing systems provide access to bicycles
in cities, either for rent or at no cost to users. The
number of public bike sharing systems has
increased quickly in recent years, from only 13
cities across the globe in 2004, to 855 city
systems globally a decade later (Fishman, 2016).
New York and Chicago’s bike sharing systems in
2016 and 2017 use permanent docking stations,
where users can check bikes in and out using
credit cards or member cards. Figure 1 shows a
bike station in the Citi Bike system in New York
City.
Bike share systems offer benefits to
individuals and communities, varying with
context, including traffic conditions, urban
densities, and transit service. Short trips taken via
bike share are comparable in speed to taxis in
New York during rush hour (Faghih-Imani et al.,
2017). Bike share ridership is linked to residential
and employment density and proximity to rail
stations in New York (Noland, Smart, & Guo,
2016) as well as to how extensive the service area
is (Ahillen, Mateo-Babiano, & Corcoran, 2016).
New York and Chicago both have robust systems
by these measures, supporting bike share as a
complete transportation mode and part of a
multimodal system.
New York and Chicago developed and
expanded their bike share providing us with
critical cases to evaluate the impact of the use of
PPGIS on planning outcomes. New York’s Citi
Bike and Chicago’s Divvy bike share program are
the first and third largest systems in the United
States, based on the number of bikes available
(second is the Capital Bikeshare in Washington,
D.C.) (O’Brien, 2018). Citi Bike launched in late
May 2013 with 6,000 bikes and 332 stations in
Manhattan south of 59th street and in Brooklyn
north of Atlantic Avenue and west of Nostrand
Avenue (Citi Bike, 2016). Divvy launched in June
2013 with 750 bicycles and 75 stations in an area
from the Loop north to Berwyn Ave, west to
Kedzie Ave, and south to 59th street, rapidly
growing to 4,000 bicycles by 2014 (Hilkevitch,
2013; Faghih-Imani & Eluru, 2015). By the end
of 2015, Citi Bike served nearly 45 square miles
of New York and into New Jersey, and Divvy
covered 145 square miles of the Chicago region.
Primary startup funds for Citi Bike came from
private sponsorship—including its namesake
bank. Divvy’s initial rollout, conversely, was
supported by government grants, including $18
million in federal Congestion Mitigation and Air
Quality Improvement Program funds and $3
million in municipal funds (Cohen and Shaheen,
2016). The source of financing is important
because private funding may influence station
location, while public funds may be needed to
support equity (Howland, et al. 2017). The
systems support operations and maintenance
through a mix of user fees, private sponsorship,
and other sources.
Both systems expanded significantly in
2016. Divvy grew into the communities of Oak
Park and Evanston, west and north of Chicago,
and Citi Bike into Jersey City, the Upper East
Side & Upper West Side in Manhattan, while
adding new stations in Brooklyn (Citi Bike,
2016b; Motivate International & Divvy Bikes,
2016). By September 2017, Divvy had 5,800
bikes in its system with 580 stations in Chicago,
Oak Park, and Evanston. Citi Bike had 10,000
bikes and 706 stations in New York and Jersey
City. Citi Bike stations are 976 feet (297 m) apart,
on average, and Divvy stations are only slightly
wider-spaced, at 1,020 feet (311 m) average
between stations (by our calculations), similar to
systems in Montreal and Paris (García-
Palomares, Gutiérrez, & Latorre, 2012).
Both cities have dense populations, mixed
land uses, and an extensive system of highly
connected streets—factors considered supportive
of bike share use and bicycling in general
(O’Brien, Cheshire, & Batty, 2014; Pucher &
Buehler, 2012). Chicago is a city of over 2.7
million residents, less than a third that of New
York City which had 8.6 million people in 2015
(U.S. Census Bureau Population Division, 2016).
Chicago leads the nation in the extent of its
protected bike lanes, however, with 161 linear
miles, as compared with New York City’s 51
miles of protected bike lanes (Alliance for
Bicycling and Walking, 2016). Bike lanes
protected by buffer space, flexible posts, parked
cars, or other traffic devices, may increase both
real and perceived safety for bicycling (Lusk et
al., 2011; Thomas & DeRobertis, 2013), making
cycling attractive to a broader spectrum of the
population, including women (Dill, Goddard,
Monsere, & McNeil, 2015). Roughly 1.4% of
Chicago commuters bicycle to work, versus 1.0%
in New York; these data, however, only count
cycling as a commute mode when it is the primary
mode to work (and not, for example bicycling to
and from transit stops) (Alliance for Bicycling
and Walking, 2016; Whitfield, Paul, & Wendel,
2015). The provision of bicycle infrastructure,
bike lanes, and bike sharing systems, consumes
street space and funding, requiring planners to
consider both the social and physical construction
of these systems (Vreugdenhil & Williams, 2013;
Zavestoski & Agyeman, 2015). These issues, and
debates over them, are most visible during public
involvement processes.
Formal planning efforts for both Citi Bike
and Divvy included in-person public meetings,
websites with an interactive PPGIS platform
allowing users to suggest bike share station
locations, and GIS analysis by planners on
optimal bike share station locations. In the initial
bike share system planning, New York City DOT
conducted in-person workshops with paper maps;
planners then combined the locations suggested
on paper maps at in-person meetings with the
PPGIS results, noting “stations that received
votes via the Website [the PPGIS platform] were
prioritized over stations that had not” (New York
City DOT, 2013, p. 18). The NYC planners vetted
stations using technical guidelines on visibility
and access, considering sidewalks, on-street sites,
parks and other public property, and private
property when allowed by owners. DOT planners
also developed a GIS model to predict bike share
station demand using land use, population
density, tourism rates and subway turnstile
counts; they then added public input to
recommend a location for each 1,000 square foot
grid square covering the planning area. NYC
DOT planners used published practical guidelines
on locating bike share stations (NACTO 2015),
“work[ing] to meet the basic rules of station
spacing, making sure that stations would be
placed approximate 1,000 feet [305 m] apart – a
3-5-minute walk” (New York City DOT, 2013, p.
19) before finalizing bike share station locations .
Planners then asked local community board
meetings to comment on their draft suggested
locations; they also solicited input by posting the
locations on the department website. “In total,
43% of the stations proposed in the draft plans
were moved due to community request” (New
York City DOT, 2013, p. 19). Documentation of
the planning process included some information
about the technical methods used by planners
such as GIS analysis and station spacing, but
emphasized the role of public collaboration—
suggesting planners would use public input in
siting stations.
Chicago’s Divvy planners did not publish a
comprehensive process report explaining their
planning process and the role of online public
input on station locations. The NYC Citi Bike
report, however, claims that Chicago and other
cities “…have largely replicated the [NYC DOT]
approach” (New York City DOT, 2013, p. 19). On
April 15, 2015, Chicago Mayor Rahm Emanuel
announced that the Divvy systems would expand
by 176 stations by June, 2015 to outer areas and
would add more stations downtown creating a
denser downtown network. The Mayor said: “We
are encouraged by Divvy’s popularity, and this
expansion will ensure more residents in more
neighborhoods can access this system,” also
noting the inclusive process using local
suggestions for where stations would be located
(Claffey, 2015). A cooperative agreement
between the Illinois Department of
Transportation, Chicago, and neighboring cities
Evanston and Oak Park led to further Divvy
expansion when 70 additional stations were built
in 2016 (Hurley, 2014). Divvy described the
expansion process into Evanston on the north side
of Chicago as based on “…data from a survey
during the City’s Bike Plan Update, a
Northwestern University Industrial Engineering
capstone project, a community meeting, an online
survey [the PPGIS], and paper surveys provided
at the Levy Senior Center and Evanston Public
Library’s Main Library” (Divvy, 2015). The
Chicago bike share planning process changed
slightly between its initial rollout in Chicago and
into surrounding cities, but consistently included
in-person meetings, PPGIS input, technical
analysis, and a final public review.
Respondents on the PPGIS platforms in both
cities often provided additional comments or
descriptions of the sites they suggested. None of
the documents that we reviewed in either city,
however, mentioned if or how planners had used
those written public comments in their decision-
making. We do not know, therefore, if bike share
system planners did not find these additional
comments to be useful or if they lacked the
resources to analyze them systematically.
We focus on the impact of the information
provided on the two PPGIS platforms, map-based
web portals, on the bike share planning process in
both city systems. The PPGIS programs in both
New York and Chicago were built with an open-
access software platform that combined a map of
the city that indicated existing bike share station
locations, a map of additional stations already
suggested by other participants, and a large
“Suggest a Location” button that allowed
participants to identify a new station site not
already suggested (OpenPlans, 2013). The New
York Citi Bike online system prompted
participants to provide a written defense of a
selected or suggested location in a two-line text
box: “this would be a great location because...”
Divvy had a similar prompt which asked for a
simple “description” of the suggested station
(Divvy, 2018). The platforms also incorporated
the ability for users to ‘like’ and comment on
others’ suggestions; the platform used social
media links to spur interest from others online.
Neither Chicago nor New York City solicited
information on participant demographics, so we
cannot directly analyze how representative
participants were by income, race, ethnicity, or
gender identity.
Are Stations Built in Proximity to Suggested
Stations? Few studies that evaluate PPGIS platforms used
in planning actually measure the outcome or
impact on planning decision of the input provided
on those platforms. Scholars and practitioners
seem to lack practical methods to do so. We also
lack comparative metrics on what degree of
agreement between crowdsourced participant
suggestions and actual planning decisions, or
impacts on the ground, constitutes co-productive
activity. Participant inputs might conflict, and
planners must also consider a range of practical
considerations which participants do not consider
important or do not rank in the same way. Thus
100% agreement is neither likely nor beneficial;
no relationship between participant suggestions
and planning impacts or outcomes, however, is
not public participation at all. We have no good
scholarship on where to draw the line between the
two extremes on this spectrum.
We approach the problem of measuring the
impact of crowdsourced suggestions supplied on
the PPGIS platform on the planning process for
bike share station location using two methods
after an initial data collection and refinement
stage. We initially obtained and refined the
PPGIS data provided in each city in a specific
time period. We then conducted two quantitative
analyses; we first calculated descriptive statistics
such as the average proximity of stations
suggested on the PPGIS platforms to built
stations overall and then by specific zones in each
city. Second, we used a geostatistic analysis that
identifies the statistical significance of the
proximity of suggested to built stations by
identifying clusters of both types of stations that
are not likely to occur randomly, again by specific
zones in each city. We then set reasonable but
arbitrary measures to determine if we could see
evidence of co-production, that is, if the input
provided by public stakeholders was valued and
used by bike share system planners. We decided
that there was co-production through
crowdsourcing if there was more than 15%
agreement between suggested and built stations
in the service area overall or in particular zones in
the city, as we defined them.
Evaluating the Input Provided on
PPGIS Platforms in New York and
Chicago Both Citi Bike and Divvy used the Shareabouts
platform created and shared by Open Plans
(OpenPlans, 2013) to allow stakeholders to
suggest and justify new public bike sharing
stations in New York and Chicago. We accessed
the PPGIS databases through the Shareabouts
application programming interface (Hebbert,
2016). We downloaded the suggested locations
from the date each platform was set up—Citi
Bike, October 28, 2014, and Divvy, February 11,
2015—and ending when we web-scraped the
PPGIS site information on March 26, 2016. We
excluded suggestions after December 31, 2015,
providing at least eight months for suggestions to
potentially influence station placement before our
collection of constructed bike share station
locations as they existed on August 3, 2016. This
process resulted in a total of 4,744 locations
suggested for Citi Bike, and 5,318 for Divvy.
Each system implemented multiple waves of
expansions and minor relocations over our data
collection period. The location of bike share
stations are relatively permanent, but cities may
relocate stations to alternative locations on a
temporary or longer-term basis, due to financial
constraints, construction projects near a station
(Citi Bike, 2015; Divvy, 2015), and even legal
threats (Briquelet, 2013).
We excluded suggested bike share locations
outside the service area of the system since
neither bike share program imposed any spatial
limits on public input; that is, the PPGIS did not
automatically require suggestions within a
realistic boundary. Fifty-seven percent of the
suggested locations for Citi Bike and 15% of
Divvy’s were outside of the service boundary as
a result. We ended with 2,022 suggested locations
in the New York’s Citi Bike Share system, and
4,507 in Chicago’s Divvy system after excluding
suggestions outside the service area.
We were concerned that a few individual
participants might suggest a large number of
stations or use automated programs to re-enter the
same suggestions multiple times, skewing our
results. We were able to determine that 93% of the
individual participants on the Citi Bike PPGIS
platform suggested only one or two locations
(although one user suggested 29 stations). We
individually reviewed entries from the top five
contributors by the number of locations they
suggested, and found they included reasonable
locations and descriptions. Therefore, we did not
exclude any locations suggested by frequent
contributors. We did not have a way to assess the
extent to which one or a few users entered
multiple sites or multiple times in the Divvy
system but since they both used the same
OpenPlans platform, the potential for misuse was
similar.
Roughly 92% the locations suggested in
Chicago, and 89% in New York included written
comments; respondents in both systems were
more likely to include written comments or
descriptions of suggested bike share stations sites
in the outer parts of the system. In Chicago, for
example, respondents provided written comments
or descriptions of all (100%) of the stations that
they suggested in outer areas of the system but
only with 88% of suggested stations in the inner
core. We surmise that participants suggesting
stations in outlying areas might have felt a greater
need to provide planners with local information,
details they may have felt that system planners
would not know or understand.
We next defined three zones, each system’s
core, mid-range, and outer areas, to analyze how
the proximity of suggested and built locations
differed over the metropolitan area as each
system expanded. In New York City, we defined
the core as Manhattan, the mid-range zone to
include Brooklyn and Queens, and the third zone
in New Jersey. In Chicago, we measured the
distance from the station in the geographic center
of the system to the outmost station—12.5 miles
(20 km), defining the core as the center to the first
four miles, the middle section to eight miles, and
the rest to an outer zone. The reason for the two
different approaches in creating zones is that
Chicago’s density decreases relatively smoothly
from the core to suburb edges in all directions
away from Lake Michigan. Conversely, island
and river geography dictates much of New York’s
density. We created the three evaluation zones for
each bike share system to generalize density
across the large and complex cities.
How Close are Built to Suggested Bike Share
Locations? Our first analysis assessed the proximity of
suggested bike share station locations to built
stations as a straight-line distance in each city; we
did not use a road network distance, because
people often walk to bike stations directly,
traversing parking lots, crossing streets at mid-
block, and across parkland. We determined that
the critical distance for a station location to meet
the intent of a participant suggesting a station on
the PPGIS platform was 100 feet (30 m)—a tight
threshold to approximate where a participant
intended to place a station site. We use a 100-foot
criterion because it splits the shortest urban
blocks of 200 feet [61 m] (Handy, Butler, &
Paterson, 2003) in half, yet provides minimal
space for error of placement by contributors
(Brown, 2012). We then calculated the percentage
of suggested stations within 100 ft of any built
stations, as well as the average distance from the
bike share station locations suggested on the
PPGIS to the nearest built station for each of the
three zones in New York and Chicago.
Our second analysis was designed to
investigate whether finding built stations near
suggested stations (< 100 ft or 30 m) was due to
random chance. We used a spatial hot spot
analysis method called a Local Moran’s I
(Anselin, 1995; Esri, 2016) to answer this
question. This approach reveals whether the
proximity between built stations and suggested
stations is spatially statistical significant—at a
95% confidence level. This method has been used
by other researchers to identify clusters of
phenomena such as social media use in
neighborhoods (Anselin & Williams, 2016), and
changes in bicycle ridership (Boss, Nelson,
Winters, & Ferster, in press). We further broke
down each system into three zones based on
density, because: a) the denser an area is the more
likely a suggested and built station would be close
to one another whether planners used PPGIS as
crowdsourced data or not, and, thus b) the average
proximity of suggested to built stations might not
accurately describe any given area or allow us to
see important differences by community spatial
characteristics. We then used the Moran’s I
analysis to calculate the percent of suggested
stations that were statistically significant in
proximity to built stations in each zone,
identifying clusters of suggestions close to built
stations.
Our work has several limitations. First,
neither the NYC nor Chicago bike share system
explicitly describes how they weighed PPGIS
input overall or against other forms of public
input. We did review a number of planning
documents in both cities that mentioned the role
of the PPGIS platforms but the documents gave
no clear indication if or how much planners used
PPGIS suggestions in making station siting
decisions, either alone or in combination with
input from more traditional participatory
methods. We did not interview bike share system
planners about the process so we do not know if
and how they balanced the technical challenges
with which they were familiar (land use costs,
regulatory issues, infrastructure needs, etc)
against locations suggested by any stakeholders,
as Afzalan and Sanchez (2017) did in their
Cincinnati case study. Second, other factors such
as market strength to support operational costs,
equity considerations, the influence of corporate
sponsorships, and a range of local political factors
may influence the location of bike share
stations—we could not control for any of these
factors. Third, neither dataset included the socio-
demographic characteristics of online
respondents, so we could not assess whether
participation on the PPGIS was more or less
representative than more traditional participation
methods—a crucial planning concern. Fourth,
New York and Chicago are hardly typical; their
large populations, extensive transit services, and
financial resources make them very different
from smaller cities considering bike share
programs. Some of the differences in the average
distances between suggested and constructed
stations in both cities are likely associated with
their geographic characteristics—New York’s
service area is spatially smaller, yet is more
densely populated and constrained by waterways.
Finally, appropriate locations for bike share
stations are limited by the spatial constraints of
streetscapes, including the location of utilities,
transit stops, vehicle parking, accessibility
requirements, and other issues.
We are thus limited in our ability to fully
assess the impact of suggestions made on the
PPGIS platform on the bike sharing system
planning process, the extent of true
crowdsourcing, although we do draw some
preliminary conclusions. An important next step
in addressing this increasingly important
planning topic would be to conduct extensive
interviews with all relevant stakeholders in
PPGIS planning processes to learn how they
understood and used citizen input from different
sources, and to assess whether those participating
online were more or less representative of a
broader community of stakeholders than those
involved in traditional participatory processes.
Crowdsourcing and Planning Bike
Share in New York and Chicago Participants on both the Citi Bike and Divvy
PPGIS platforms suggested a total of 10,062
individual bike share locations over the study
period, 4,744 in the New York City area and 5,318
around Chicago. Only 85% of suggested Divvy
Bike bike share stations and 43% of suggested
Citi bike share stations were within the boundary
of these systems as of 2016. We excluded from
our analysis any suggested stations outside of the
system boundaries, giving us a total of 6,529 (NY:
2,022 and Chicago: 4,507) suggested bike share
locations.
Participants suggested more stations in the
core of both cities than in the inner suburbs or
outer-edges. Participants also suggested nearly
four times more stations in Chicago overall and
more than seven times more stations in New York
overall than the systems built. The ratio of
suggested to built stations differed substantially
by area of the city. Divvy participants suggested
8.1, 7.9, and 6.1 times more stations than were
built in inner, middle and outer rings,
respectively. In New York, the Citi Bike system
received 4.4, 3.6, and 1.3 more suggested stations
than it built.
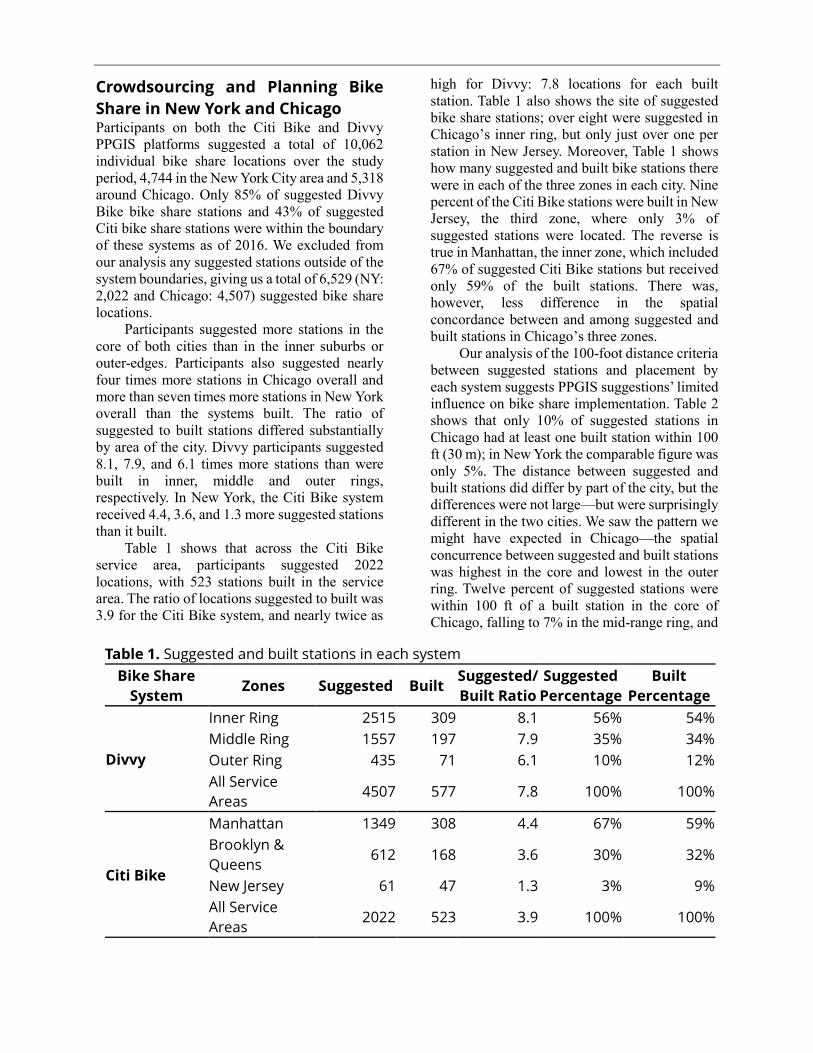
Table 1 shows that across the Citi Bike
service area, participants suggested 2022
locations, with 523 stations built in the service
area. The ratio of locations suggested to built was
3.9 for the Citi Bike system, and nearly twice as
high for Divvy: 7.8 locations for each built
station. Table 1 also shows the site of suggested
bike share stations; over eight were suggested in
Chicago’s inner ring, but only just over one per
station in New Jersey. Moreover, Table 1 shows
how many suggested and built bike stations there
were in each of the three zones in each city. Nine
percent of the Citi Bike stations were built in New
Jersey, the third zone, where only 3% of
suggested stations were located. The reverse is
true in Manhattan, the inner zone, which included
67% of suggested Citi Bike stations but received
only 59% of the built stations. There was,
however, less difference in the spatial
concordance between and among suggested and
built stations in Chicago’s three zones.
Our analysis of the 100-foot distance criteria
between suggested stations and placement by
each system suggests PPGIS suggestions’ limited
influence on bike share implementation. Table 2
shows that only 10% of suggested stations in
Chicago had at least one built station within 100
ft (30 m); in New York the comparable figure was
only 5%. The distance between suggested and
built stations did differ by part of the city, but the
differences were not large—but were surprisingly
different in the two cities. We saw the pattern we
might have expected in Chicago—the spatial
concurrence between suggested and built stations
was highest in the core and lowest in the outer
ring. Twelve percent of suggested stations were
within 100 ft of a built station in the core of
Chicago, falling to 7% in the mid-range ring, and
Table 1. Suggested and built stations in each system
Bike Share
System Zones Suggested Built
Suggested/
Built Ratio
Suggested
Percentage
Built
Percentage
Divvy
Inner Ring 2515 309 8.1 56% 54%
Middle Ring 1557 197 7.9 35% 34%
Outer Ring 435 71 6.1 10% 12%
All Service
Areas 4507 577 7.8 100% 100%
Citi Bike
Manhattan 1349 308 4.4 67% 59%
Brooklyn &
Queens 612 168 3.6 30% 32%
New Jersey 61 47 1.3 3% 9%
All Service
Areas 2022 523 3.9 100% 100%
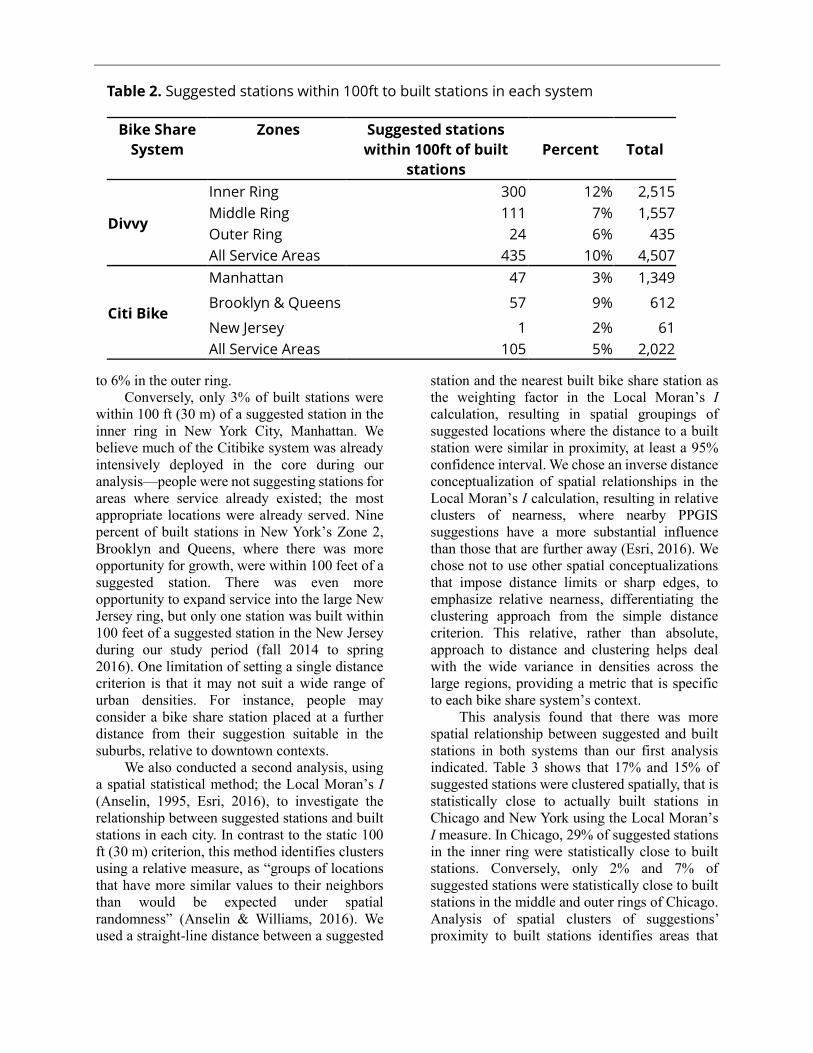
to 6% in the outer ring.
Conversely, only 3% of built stations were
within 100 ft (30 m) of a suggested station in the
inner ring in New York City, Manhattan. We
believe much of the Citibike system was already
intensively deployed in the core during our
analysis—people were not suggesting stations for
areas where service already existed; the most
appropriate locations were already served. Nine
percent of built stations in New York’s Zone 2,
Brooklyn and Queens, where there was more
opportunity for growth, were within 100 feet of a
suggested station. There was even more
opportunity to expand service into the large New
Jersey ring, but only one station was built within
100 feet of a suggested station in the New Jersey
during our study period (fall 2014 to spring
2016). One limitation of setting a single distance
criterion is that it may not suit a wide range of
urban densities. For instance, people may
consider a bike share station placed at a further
distance from their suggestion suitable in the
suburbs, relative to downtown contexts.
We also conducted a second analysis, using
a spatial statistical method; the Local Moran’s I
(Anselin, 1995, Esri, 2016), to investigate the
relationship between suggested stations and built
stations in each city. In contrast to the static 100
ft (30 m) criterion, this method identifies clusters
using a relative measure, as “groups of locations
that have more similar values to their neighbors
than would be expected under spatial
randomness” (Anselin & Williams, 2016). We
used a straight-line distance between a suggested
station and the nearest built bike share station as
the weighting factor in the Local Moran’s I
calculation, resulting in spatial groupings of
suggested locations where the distance to a built
station were similar in proximity, at least a 95%
confidence interval. We chose an inverse distance
conceptualization of spatial relationships in the
Local Moran’s I calculation, resulting in relative
clusters of nearness, where nearby PPGIS
suggestions have a more substantial influence
than those that are further away (Esri, 2016). We
chose not to use other spatial conceptualizations
that impose distance limits or sharp edges, to
emphasize relative nearness, differentiating the
clustering approach from the simple distance
criterion. This relative, rather than absolute,
approach to distance and clustering helps deal
with the wide variance in densities across the
large regions, providing a metric that is specific
to each bike share system’s context.
This analysis found that there was more
spatial relationship between suggested and built
stations in both systems than our first analysis
indicated. Table 3 shows that 17% and 15% of
suggested stations were clustered spatially, that is
statistically close to actually built stations in
Chicago and New York using the Local Moran’s
I measure. In Chicago, 29% of suggested stations
in the inner ring were statistically close to built
stations. Conversely, only 2% and 7% of
suggested stations were statistically close to built
stations in the middle and outer rings of Chicago.
Analysis of spatial clusters of suggestions’
proximity to built stations identifies areas that
Table 2. Suggested stations within 100ft to built stations in each system
Bike Share
System
Zones Suggested stations
within 100ft of built
stations
Percent Total
Divvy
Inner Ring 300 12% 2,515
Middle Ring 111 7% 1,557
Outer Ring 24 6% 435
All Service Areas 435 10% 4,507
Citi Bike
Manhattan 47 3% 1,349
Brooklyn & Queens 57 9% 612
New Jersey 1 2% 61
All Service Areas 105 5% 2,022
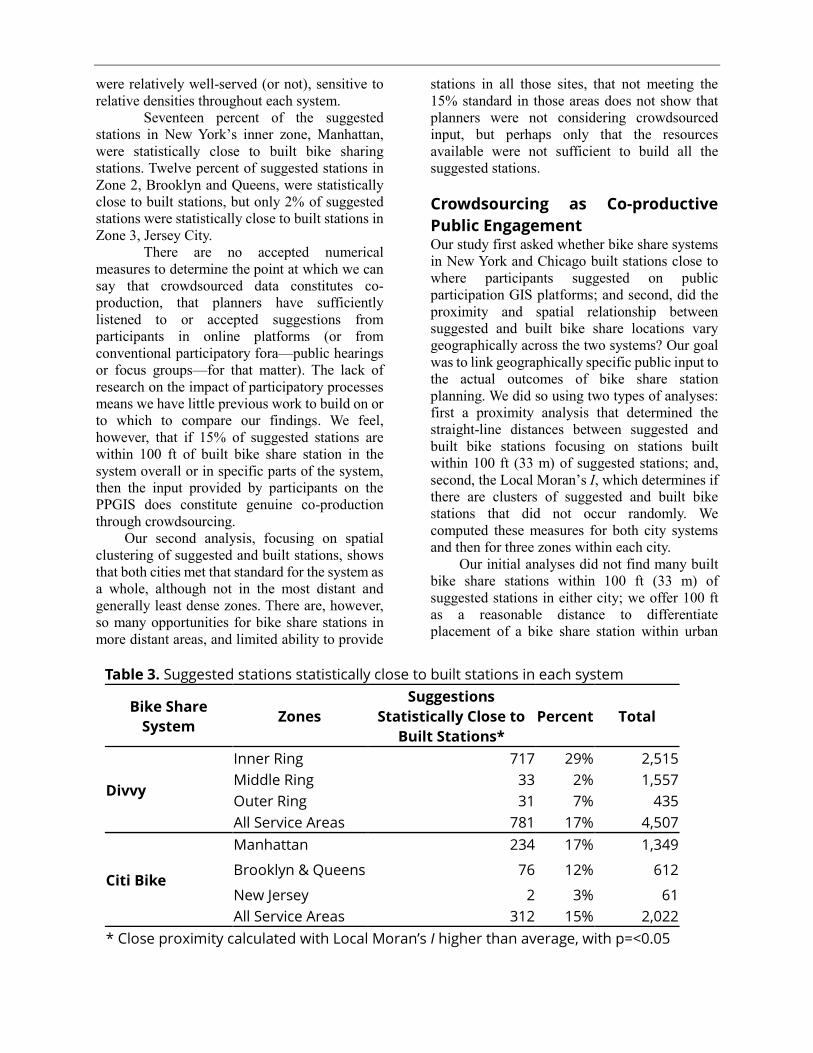
were relatively well-served (or not), sensitive to
relative densities throughout each system.
Seventeen percent of the suggested
stations in New York’s inner zone, Manhattan,
were statistically close to built bike sharing
stations. Twelve percent of suggested stations in
Zone 2, Brooklyn and Queens, were statistically
close to built stations, but only 2% of suggested
stations were statistically close to built stations in
Zone 3, Jersey City.
There are no accepted numerical
measures to determine the point at which we can
say that crowdsourced data constitutes co-
production, that planners have sufficiently
listened to or accepted suggestions from
participants in online platforms (or from
conventional participatory fora—public hearings
or focus groups—for that matter). The lack of
research on the impact of participatory processes
means we have little previous work to build on or
to which to compare our findings. We feel,
however, that if 15% of suggested stations are
within 100 ft of built bike share station in the
system overall or in specific parts of the system,
then the input provided by participants on the
PPGIS does constitute genuine co-production
through crowdsourcing.
Our second analysis, focusing on spatial
clustering of suggested and built stations, shows
that both cities met that standard for the system as
a whole, although not in the most distant and
generally least dense zones. There are, however,
so many opportunities for bike share stations in
more distant areas, and limited ability to provide
stations in all those sites, that not meeting the
15% standard in those areas does not show that
planners were not considering crowdsourced
input, but perhaps only that the resources
available were not sufficient to build all the
suggested stations.
Crowdsourcing as Co-productive
Public Engagement Our study first asked whether bike share systems
in New York and Chicago built stations close to
where participants suggested on public
participation GIS platforms; and second, did the
proximity and spatial relationship between
suggested and built bike share locations vary
geographically across the two systems? Our goal
was to link geographically specific public input to
the actual outcomes of bike share station
planning. We did so using two types of analyses:
first a proximity analysis that determined the
straight-line distances between suggested and
built bike stations focusing on stations built
within 100 ft (33 m) of suggested stations; and,
second, the Local Moran’s I, which determines if
there are clusters of suggested and built bike
stations that did not occur randomly. We
computed these measures for both city systems
and then for three zones within each city.
Our initial analyses did not find many built
bike share stations within 100 ft (33 m) of
suggested stations in either city; we offer 100 ft
as a reasonable distance to differentiate
placement of a bike share station within urban
Table 3. Suggested stations statistically close to built stations in each system
Bike Share
System Zones
Suggestions
Statistically Close to
Built Stations*
Percent Total
Divvy
Inner Ring 717 29% 2,515
Middle Ring 33 2% 1,557
Outer Ring 31 7% 435
All Service Areas 781 17% 4,507
Citi Bike
Manhattan 234 17% 1,349
Brooklyn & Queens 76 12% 612
New Jersey 2 3% 61
All Service Areas 312 15% 2,022
* Close proximity calculated with Local Moran’s I higher than average, with p=<0.05
blocks. The proximity analysis did not find that
more than 10% of suggested stations were within
100 ft of suggested stations in either the New
York or Chicago systems as a whole, although
that percentage varied by area of the city. Our
second spatial analysis, using Moran’s I,
however, did find much more statistically
significant clustering of suggested and built
stations, clusters not randomly generated, and
over our 15% metric indicating that planners used
the input provided by participants on the PPGIS
platforms in both cities. We conclude then that
crowdsourcing can and does impact the decisions
taken by bike share station planners, that there
was genuine co-production of planning data and
analyses. We believe that these two cases indicate
that crowdsourcing portions of the planning
process—such as identifying candidate locations
for bike share stations—is co-productive: people
can perform a portion of the planning process,
rather than just view and comment on planners’
ideas.
Our analysis of the PPGIS platforms in
planning bike share stations in New York and
Chicago suggests that such participatory
mechanisms have great promise for creating
genuine co-production of planning knowledge
and insights. Participants provided many
suggestions and offered insights and local
knowledge in their written defense or description
of suggested sites. Our analysis indicates, but
does not prove, that system planners did consider
and incorporate some of the input received
through the PPGIS platform. Our second
geospatial analysis clearly shows areas where
there were many stations built relatively close to
suggested stations in a manner not due to a
random distribution. Overall, we believe that
map-based crowdsourcing is an approach that
provides a way for people to do some of the work
of planning, instead of just talking about it—a co-
productive participation technique.
We could not tell how influential PPGIS
results were in the final planning decisions
because a) there are only so many feasible bike
share station sites in the core of each city, and, b)
staff reports gave no in-depth indication of how
they weighted the PPGIS results against the input
at the more traditional participatory exercises in
which they also engaged. Placing bike share
stations is a relatively straightforward planning
problem so our analysis does not indicate how
useful a platform like PPGIS would be in
handling far more complex and controversial
issues, such as siting public housing or a major
transit station, for example.
We believe, however, that PPGIS platforms
have the potential to support participants’
learning-by-doing, and improve planners’ local
knowledge in ways that will improve planning
outcomes. Planners can better implement PPGIS
as a participatory technology by working with
technologists to design better systems and to
carefully apply their limited budgets on systems
appropriate for local contexts. PPGIS designs can
allow participants to provide more layers of
information than provided in the two cases on
which we focused, while providing a functional
planning boundary or guidance to avoid
unrealistic suggestions.
We also need to improve our understanding
of the social processes of planners, elected
officials, publics, and how they interact with
technological developments in PPGIS and other
online crowdsourcing approaches to change how
the technologies are understood and valued
(Vreugdenhil & Williams, 2013). This kind of
knowledge could inform both design of online
participatory systems and how planners deploy
them as part of public engagement. These lines of
further research support a better understanding of
how new technologies and social processes
influence public engagement in planning.
References Afzalan, N., & Muller, B. (2018). Online
participatory technologies: opportunities and
challenges for enriching participatory
planning. Journal of the American Planning
Association, 84(2), 162–177.
doi:10.1080/01944363.2018.1434010
Afzalan, N., & Sanchez, T. W. (2017). Testing
the use of crowdsourced information: Case
study of bike-share infrastructure planning in
Cincinnati, Ohio. Urban Planning, 2(3), 33–
44. doi:10.17645/up.v2i3.1013
Ahillen, M., Mateo-Babiano, D., & Corcoran, J.
(2016). The dynamics of bike-sharing in
Washington, D.C. and Brisbane, Australia:
Implications for policy and planning.
International Journal of Sustainable
Transportation, 10(5), 441–454.
doi:10.1080/15568318.2014.966933
AICP. (2016). Code of Ethics and Professional
Conduct. Retrieved January 28, 2018, from
https://www.planning.org/ethics/ethicscode/
Alexander, E. R. (2001). The planner-prince:
interdependence, rationalities and post-
communicative practice. Planning Theory &
Practice, 2(3), 311–324.
doi:10.1080/14649350120096848
Alliance for Bicycling and Walking. (2016).
Bicycling and walking in the United States
2016 benchmarking report. Washington,
D.C.: Alliance for Bicycling and Walking.
Retrieved from
http://bikingandwalkingbenchmarks.org/back
end/sites/default/files/2016benchmarkingrepo
rt_web.pdf
Anselin, L. (1995). Local Indicators of Spatial
Association-LISA. Geographical Analysis,
27(2), 93–115. doi:10.1111/j.1538-
4632.1995.tb00338.x
Anselin, L., & Williams, S. (2016). Digital
neighborhoods. Journal of Urbanism:
International Research on Placemaking and
Urban Sustainability, 9(4), 305–328.
doi:10.1080/17549175.2015.1080752
Boss, D., Nelson, T., Winters, M., & Ferster, C.
J. (in press). Using crowdsourced data to
monitor change in spatial patterns of bicycle
ridership. Journal of Transport & Health.
doi:10.1016/j.jth.2018.02.008
Briquelet, K. (2013). City moves Citi Bike
stations from richest areas while letting other
contested racks stay. Retrieved March 2,
2017, from
http://nypost.com/2013/06/23/city-moves-
citi-bike-stations-from-richest-areas-while-
letting-other-contested-racks-stay/
Brody, S. D., Godschalk, D. R., & Burby, R. J.
(2003). Mandating citizen participation in
plan making: six strategic planning choices.
Journal of the American Planning
Association, 69(3), 245–264.
doi:10.1080/01944360308978018
Brown, G. (2012). An empirical evaluation of
the spatial accuracy of public participation
GIS (PPGIS) data. Applied Geography, 34,
289–294. doi:10.1016/j.apgeog.2011.12.004
Brown, G., & Kyttä, M. (2014). Key issues and
research priorities for public participation
GIS (PPGIS): A synthesis based on empirical
research. Applied Geography, 46, 122–136.
doi:10.1016/j.apgeog.2013.11.004
Burby, R. J. (2003). Making plans that matter:
Citizen involvement and government action.
Journal of the American Planning
Association, 69(1), 33–49.
doi:10.1080/01944360308976292
Campbell, H., & Marshall, R. (2000). Public
involvement and planning: Looking beyond
the one to the many. International Planning
Studies, 5(3), 321–344.
doi:10.1080/713672862
Citi Bike. (2015). Station relocation! Retrieved
March 2, 2017, from
http://citibikeblog.tumblr.com/post/11196863
7572/station-relocation-we-need-to-
temporarily-move
Citi Bike. (2016). About Citi Bike: company,
history. Retrieved August 14, 2016, from
https://www.citibikenyc.com/about
Citi Bike. (2016b). Expansion 2016. Retrieved
August 14, 2016, from
https://www.citibikenyc.com/expansion
Claffey, M. (2015). Mayor Emanuel announces
Divvy expanding to new neighborhoods.
Retrieved February 23, 2017, from
https://www.cityofchicago.org/city/en/depts/c
dot/provdrs/bike/news/2015/april/mayor-
emanuel-announces-divvy-expanding-to-
new-neighborhoods.html
Cohen, A., & Shaheen, S. (2016). Planning for
Shared Mobility (PAS 583). Chicago: IL:
American Planning Association. Retrieved
from
https://www.planning.org/publications/report/
9107556/
Desouza, K. C., & Bhagwatwar, A. (2014).
Technology-enabled participatory platforms
for civic engagement: the case of U.S. cities.
Journal of Urban Technology, 21(4), 25–50.
doi:10.1080/10630732.2014.954898
Dill, J., Goddard, T., Monsere, C. M., & McNeil,
N. (2015). Can protected bike lanes help
close the gender gap in cycling? Lessons
from five cities. Transportation Research
Board 94th Annual Meeting. Washington,
D.C, January 11-15, 2015. Washington, D.C.:
Transportation Research Board of the
National Academies.
Divvy. (2015). Station Moves: Union Station
Construction Update. Retrieved March 2,
2017, from
http://divvybikes.tumblr.com/post/940014384
95/station-moves-union-station-construction-
update
Divvy Bikes. (2018). Suggest a Location.
Retrieved February 24, 2018, from
http://suggest.divvybikes.com
Esri. (2016). Cluster and outlier analysis
(Anselin Local Moran’s I). Retrieved August
9, 2016, from
http://desktop.arcgis.com/en/arcmap/10.3/tool
s/spatial-statistics-toolbox/cluster-and-
outlier-analysis-anselin-local-moran-s.htm
Evans-Cowley, J. S., & Griffin, G. (2012).
Microparticipation with social media for
community engagement in transportation
planning. Transportation Research Record:
Journal of the Transportation Research
Board, 2307, 90–98. doi:10.3141/2307-10
Evans-Cowley, J., & Hollander, J. (2010). The
new generation of public participation:
internet-based participation tools. Planning
Practice and Research, 25(3), 397–408.
doi:10.1080/02697459.2010.503432
Faghih-Imani, A., & Eluru, N. (2015).
Analysing destination choice preferences in
bicycle sharing systems: an investigation of
Chicago’s Divvy system. Transportation
Research Board 94th Annual Meeting.
Washington, D.C, January 11-15, 2015.
Washington, D.C.: Transportation Research
Board of the National Academies.
Faghih-Imani, A., Anowar, S., Miller, E. J., &
Eluru, N. (2017). Hail a cab or ride a bike? A
travel time comparison of taxi and bicycle-
sharing systems in New York City.
Transportation Research Part A: Policy and
Practice, 101, 11–21.
doi:10.1016/j.tra.2017.05.006
Fishman, E. (2016). Bikeshare: a review of
recent literature. Transport Reviews, 36(1),
92–113.
doi:10.1080/01441647.2015.1033036
Forester, J. (2001). An instructive case-study
hampered by theoretical puzzles: critical
comments on Flyvbjerg’s Rationality and
Power. International Planning Studies, 6(3),
263–270. doi:10.1080/713672905
García-Palomares, J. C., Gutiérrez, J., &
Latorre, M. (2012). Optimizing the location
of stations in bike-sharing programs: A GIS
approach. Applied Geography, 35, 235–246.
doi:10.1016/j.apgeog.2012.07.002
Goodspeed, R. (2016). Digital knowledge
technologies in planning practice: from black
boxes to media for collaborative inquiry.
Planning Theory & Practice, 17(4), 577–600.
doi:10.1080/14649357.2016.1212996
Griffin, G. P. (2014). Geographic specificity and
positionality of public input in transportation:
a rural transportation planning case from
Central Texas. Urban, Planning and
Transport Research, 2(1), 407–422.
doi:10.1080/21650020.2014.969442
Griffin, G. P., & Jiao, J. (2015). Crowdsourcing
bicycle volumes: Exploring the role of
volunteered geographic information and
established monitoring methods. URISA
Journal, 27(1), 57–66. Retrieved from
https://ssrn.com/abstract=2668747
Guyadeen, D., & Seasons, M. (2018).
Evaluation theory and practice: Comparing
program evaluation and evaluation in
planning. Journal of Planning Education and
Research, 38(1), 98–110.
doi:10.1177/0739456X16675930
Handy, S. L., Butler, K. S., & Paterson, R. G.
(2003). PAS Report 515 Planning for street
connectivity—getting from here to there.
Chicago: IL: American Planning Association.
Healey, P. (1997). Collaborative planning:
shaping places in fragmented societies.
London: Macmillan.
Hebbert, F. (2016). Viewing data via the Django
admin interface. Retrieved March 20, 2016,
from
https://github.com/openplans/shareabouts-
api/blob/master/doc/GETTING_YOUR_DAT
A.md
Hilkevitch, J. (2013, April 25). Chicago ready to
roll out bike-sharing. Chicago Tribune.
Retrieved from
http://www.chicagotribune.com/news/ct-met-
bike-sharing-divvy-0425-20130425-
story.html
Howland, S., McNeil, N., Broach, J., Rankins,
K., MacArthur, J., & Dill, J. (2017). Current
Efforts to Make Bikeshare More Equitable.
Transportation Research Record: Journal of
the Transportation Research Board, 2662,
160–167. doi:10.3141/2662-18
Hurley, C. (2014). Divvy Bicycle Share –
Evanston Expansion. Retrieved May 27,
2016, from
http://www.cityofevanston.org/assets/SP3
CityCouncil_DivvyPresentation_Nov17
v2.pdf
Kahila-Tani, M., Broberg, A., Kyttä, M., &
Tyger, T. (2016). Let the citizens map—
public participation GIS as a planning
support system in the Helsinki master plan
process. Planning Practice & Research,
31(2), 195–214.
doi:10.1080/02697459.2015.1104203
Lusk, A. C., Furth, P. G., Morency, P., Miranda-
Moreno, L. F., Willett, W. C., & Dennerlein,
J. T. (2011). Risk of injury for bicycling on
cycle tracks versus in the street. Injury
Prevention, 17(2), 131–135.
doi:10.1136/ip.2010.028696
Margerum, R. D. (2002). Evaluating
collaborative planning: implications from an
empirical analysis of growth management.
Journal of the American Planning
Association, 68(2), 179–193.
doi:10.1080/01944360208976264
Minner, J., Holleran, M., Roberts, A., & Conrad,
J. (2015). Capturing volunteered historical
information: lessons from development of a
local government crowdsourcing tool.
International Journal of E-Planning
Research, 4(1), 19–41.
doi:10.4018/ijepr.2015010102
Motivate International, & Divvy Bikes. (2016).
About Divvy. Retrieved August 14, 2016,
from https://www.divvybikes.com/about
NACTO. (2015). Walkable Station Spacing is
Key to Successful, Equitable Bike Share.
(NACTO Bike Share Equity Practitioners'
Paper #1). New York City: National
Association of City Transportation Officials.
Retrieved from https://nacto.org/wp-
content/uploads/2015/06/NACTO_Walkable-
Station-Spacing-Is-Key-For-Bike-Share.pdf
New York City DOT. (2013). NYC bike share
designed by New Yorkers. Retrieved May 26,
2016, from
www.nyc.gov/html/dot/downloads/pdf/bike-
share-outreach-report.pdf
Noland, R. B., Smart, M. J., & Guo, Z. (2016).
Bikeshare trip generation in New York City.
Transportation Research Part A: Policy and
Practice, 94, 164–181.
doi:10.1016/j.tra.2016.08.030
O’Brien, O. (2018). Bike Share Map. Retrieved
January 25, 2018, from
http://bikes.oobrien.com/
O’Brien, O., Cheshire, J., & Batty, M. (2014).
Mining bicycle sharing data for generating
insights into sustainable transport systems.
Journal of Transport Geography, 34, 262–
273. doi:10.1016/j.jtrangeo.2013.06.007
OpenPlans. (2013). Shareabouts. Retrieved
January 25, 2018, from
https://github.com/openplans/shareabouts
Piatkowski, D., Marshall, W., & Afzalan, N.
(2017). Can web-based community
engagement inform equitable planning
outcomes? A case study of bikesharing.
Journal of Urbanism: International Research
on Placemaking and Urban Sustainability,
10(3), 296–309.
doi:10.1080/17549175.2016.1254672
Pucher, J. R., & Buehler, R. (2012). City
cycling. (J. Pucher & R. Buehler, Eds.).
Cambridge, MA: MIT Press.
Radil, S. M., & Jiao, J. (2016). Public
participatory GIS and the geography of
inclusion. The Professional Geographer,
68(2), 202–210.
doi:10.1080/00330124.2015.1054750
Schweitzer, L. (2014). Planning and social
media: A case study of public transit and
stigma on Twitter. Journal of the American
Planning Association, 80(3), 218–238.
doi:10.1080/01944363.2014.980439
Sciara, G.-C. (2017). Metropolitan
transportation planning: lessons from the
past, institutions for the future. Journal of the
American Planning Association, 83(3), 262–
276. doi:10.1080/01944363.2017.1322526
Thomas, B., & DeRobertis, M. (2013). The
safety of urban cycle tracks: a review of the
literature. Accident Analysis & Prevention,
52, 219–27. doi:10.1016/j.aap.2012.12.017
Thompson, M. M. (2016). Upside-Down GIS:
The Future of Citizen Science and
Community Participation. The Cartographic
Journal, 53(4), 1–9.
doi:10.1080/00087041.2016.1243863
Trapenberg Frick, K. (2013). The actions of
discontent: tea party and property rights
activists pushing back against regional
planning. Journal of the American Planning
Association, 79(3), 190–200.
doi:10.1080/01944363.2013.885312
U.S. Census Bureau Population Division.
(2016). Annual estimates of the resident
population: April 1, 2010 to July 1, 2015.
Retrieved June 20, 2008, from
http://factfinder.census.gov/
Vreugdenhil, R., & Williams, S. (2013). White
line fever: A sociotechnical perspective on
the contested implementation of an urban
bike lane network. Area, 45(3), 283–291.
doi:10.1111/area.12029
Watson, V. (2014). Co-production and
collaboration in planning – the difference.
Planning Theory & Practice, 15(1), 62–76.
doi:10.1080/14649357.2013.866266
Whitfield, G. P., Paul, P., & Wendel, A. M.
(2015). Active transportation surveillance —
United States, 1999 – 2012. MMWR
Surveillance Summaries, 64(7), 1-17.
Zavestoski, S., & Agyeman, J. (2015). Towards
an understanding of complete streets. In S.
Zavestoski & J. Agyeman (Eds.), Incomplete
streets: processes, practices and possibilities
(pp. 307–315). Abington: Routledge.
Acknowledgements The authors greatly appreciate the data mining support
of Matthew Halpern used in this study, and
constructive comments from three anonymous
reviewers.
Research Support Cooperative Mobility for Competitive Megaregions
University Transportation Center supported this study.