Crossroads Resource CenterCONAC Region Farm & Food Economy (North Dakota) — Ken Meter, Crossroads...
19
CONAC REAP Region (North Dakota) Local Farm & Food Economy by Ken Meter, Crossroads Resource Center (Minneapolis) 1 for F.A.R.R.M.S. March 24, 2015 Covers Benson, Bottineau, McHenry, Pierce, Rolette, & Towner Counties in North Dakota CONAC Region (Bureau of Economic Analysis, 2013) 40,885 residents receive $1.6 billion of income annually. Personal income increased 78% from 1969 to 2013, after dollars were adjusted for inflation. This increase, led by growth in Rolette and Bottineau Counties, has been building since 1988. The largest source of personal income is transfer payments (from government programs such as pensions), with $374 million [see below]. Capital income (from interest, rent or dividends) ranks second, accounting for $310 million of personal income. Government jobs rank third, with $304 billion. Wholesale workers earned $45 million, while retail workers earned $43 million. Mining accounted for at least $32 million of personal income in Bottineau County, but data for several other counties has been suppressed for confidentiality reasons. Income earned in other fields, such as health care professions, manufacturing jobs, and construction jobs, were often suppressed, so these cannot be reported. More than $500 million (nearly one-third) of all personal income cannot be tracked because of suppressed data. Note that income from public sources makes up 42% of all personal income in the region. Income earned from transfer payments includes $106 million of retirement and disability insurance benefits; $162 million of medical benefits; $60 million of income maintenance benefits; $10 million of unemployment insurance; and $10 million of veterans’ benefits. Government income includes $91 million of income earned by federal workers and $205 million earned by state and local government workers. Military personnel earn $9 million of personal income. The region’s population decreased 18% since 1969, even though Rolette County’s population grew 27%. Although the CONAC region has a proud tradition of agriculture, there has been limited public planning to assure a secure and stable food supply. 1 Considerable research assistance provided by Nick Wojciak. Crossroads Resource Center 7415 Humboldt Ave. S. / Minneapolis, Minnesota 55423 / 612.869.8664 [email protected] www.crcworks.org Tools for Community Self-determination
Transcript of Crossroads Resource CenterCONAC Region Farm & Food Economy (North Dakota) — Ken Meter, Crossroads...

CONAC REAP Region (North Dakota)
Local Farm & Food Economy
by Ken Meter, Crossroads Resource Center (Minneapolis)1 for
F.A.R.R.M.S. March 24, 2015
Covers Benson, Bottineau, McHenry, Pierce, Rolette, & Towner Counties in North Dakota
CONAC Region (Bureau of Economic Analysis, 2013) 40,885 residents receive $1.6 billion of income annually. Personal income increased 78% from 1969 to 2013, after dollars were adjusted for inflation. This increase, led by growth in Rolette and Bottineau Counties, has been building since 1988. The largest source of personal income is transfer payments (from government programs such as pensions), with $374 million [see below]. Capital income (from interest, rent or dividends) ranks second, accounting for $310 million of personal income. Government jobs rank third, with $304 billion. Wholesale workers earned $45 million, while retail workers earned $43 million. Mining accounted for at least $32 million of personal income in Bottineau County, but data for several other counties has been suppressed for confidentiality reasons. Income earned in other fields, such as health care professions, manufacturing jobs, and construction jobs, were often suppressed, so these cannot be reported. More than $500 million (nearly one-third) of all personal income cannot be tracked because of suppressed data. Note that income from public sources makes up 42% of all personal income in the region.
Income earned from transfer payments includes $106 million of retirement and disability insurance benefits; $162 million of medical benefits; $60 million of income maintenance benefits; $10 million of unemployment insurance; and $10 million of veterans’ benefits. Government income includes $91 million of income earned by federal workers and $205 million earned by state and local government workers. Military personnel earn $9 million of personal income. The region’s population decreased 18% since 1969, even though Rolette County’s population grew 27%. Although the CONAC region has a proud tradition of agriculture, there has been limited public planning to assure a secure and stable food supply.
1 Considerable research assistance provided by Nick Wojciak.
Crossroads Resource Center
7415 Humboldt Ave. S. / Minneapolis, Minnesota 55423 / 612.869.8664 [email protected] www.crcworks.org
Tools for Community Self-determination

CONAC Region Farm & Food Economy (North Dakota) — Ken Meter, Crossroads Resource Center — 2015
— 2 —
Issues affecting low-income residents of the CONAC region: Over 16,000 residents (42%) earn less than 185% of federal poverty guidelines. At this level of income, children qualify for free or reduced-price lunch at school. These lower-income residents spend $34 million each year buying food, including $9.5 million of SNAP benefits (formerly known as food stamps) and additional WIC coupons. The region’s 4,036 farmers receive an annual combined total of $105 million in subsidies (25-year average, 1989-2013), mostly to raise crops such as wheat, corn or soybeans that are sold as commodities, not to feed local residents. Data from Federal Census of 2009-2013, Bureau of Labor Statistics, & Bureau of Economic Analysis. 12% percent of the region’s households (over 5,100 residents) earn less than $10,000 per year. Source: Federal Census of 2009-2013. 12% of all adults aged 18-64 in North Dakota carried no health insurance in 2012. Source: Centers for Disease Control. Food-related health conditions: 40% of North Dakota residents reported in 2013 that they eat fewer than one serving of fruit per day, while 27% reported eating less than one vegetable each day. This is a key indicator of health, since eating five servings of fruit and vegetables daily has been connected to better health outcomes. Source: Centers for Disease Control. 16% of the state’s adults reported in 2013 they “participated in enough aerobic and muscle strengthening exercises to meet guidelines.” Source: Centers for Disease Control. 7.4% of the state’s residents have been diagnosed with diabetes as of 2010. Source: Centers for Disease Control. Medical costs for treating diabetes and related conditions in North Dakota are estimated at $400 million per year. Source: American Diabetes Association. 68% of North Dakota residents are overweight (37%) or obese (31%) as of 2013. Source: Centers for Disease Control. The region's farms (Census of Agriculture, 2012) Agriculture Census data for 2012 were released May 2, 2014 The Census of Agriculture defines a “farm” as “an operation that produces, or would normally produce and sell, $1,000 or more of agricultural products per year.”
Land:
• 4,036 farms. This is 13% of North Dakota farms. • The CONAC Zone region had 2% less farms in 2012 than in 2007. • 1,362 (34%) of these are 1,000 acres or more in size. • 332 (8%) farms are less than 50 acres. • Average farm size is 1,125 acres, less than the state average of 1,268 acres. • The region has 4.5 million acres of land in farms.

CONAC Region Farm & Food Economy (North Dakota) — Ken Meter, Crossroads Resource Center — 2015
— 3 —
• This amounts to 12% of the state’s farmland. • The CONAC region holds 2.9 million acres of harvested cropland. • At least 3,943 of these acres are irrigated. Note that data for acres irrigated in Bottineau, and Rolette
counties were suppressed by the USDA in an effort to protect confidentiality, so this total is incomplete. • Average value of land and buildings per farm was $1.3 million. This was less than the 2012
state average of $1.8 million.
Sales: With the exception of foods sold directly to consumers (see below), farmers typically sell commodities to wholesalers, brokers or manufacturers that require further processing or handling to become consumer items. The word “commodities” is used in this report to mean the crops and livestock sold by farmers through these wholesale channels. The term “products” encompasses commodity sales, direct sales, and any other sales.
• The region’s farmers sold $1.1 billion of crops and livestock in 2012. • Farm product sales increased by 70% from 2007 to 2012. • $1 billion of crops were sold. • $126 million of livestock and products were sold. • 1,773 (44%) of the region’s farms sold less than $10,000 of products in 2012. • Total sales from these small farms were $1.8 million, 0.2% of the region’s farm product
sales. • 1,536 (38%) of the region’s farms sold more than $100,000 of products. • Total sales from these larger farms were $1.1 billion, 97% of the region’s farm product sales. • 26% of the region’s farms (1,040 of 4,036) reported net losses in 2012. This is the same as
the North Dakota average of 26%. • 3,275 (81%) of the CONAC region’s farmers collected a combined total of $45 million of
federal subsidies in 2012.
Top farm products of the CONAC region (2012). Note: * denotes sales data have been suppressed.
Product $ MillionsWheat 340Soybeans 164Corn 122Barley *90Cattle and calves *90Horses and ponies 1Sheep and goats *0.3

CONAC Region Farm & Food Economy (North Dakota) — Ken Meter, Crossroads Resource Center — 2015
— 4 —
Production Expenses: • Fertilizer, lime, and soil conditioners were the largest single expense for CONAC region
farmers in 2012, totaling $137 million (18% of production expenses). • CONAC region farmers charged $103 million (14%) to depreciation. • Chemical purchases totaled $95 million (13%). • Purchases of seeds totaled $87 million (12%). • Land and building rental expenses were $78 million (11%). • Gasoline, fuel, and oil costs totaled $59 million (8%). • Supplies, repairs, and maintenance cost farmesrs $58 million (8%). • Feed purchases totaled $38 million (5%). • Interest expenses were $31 million (4%). • Livestock and poultry purchases were $28 million (4%).
Cattle & Dairy: • 1,200 farms hold an inventory of 187,000 cattle. • 85,000 cattle were sold by farmers in 2012 for total sales of at least $90 million. Note that data
for sales of cattle in Towner County were suppressed by the USDA in an effort to protect confidentiality, so this total is incomplete.
• 1,116 farms raise beef cows. • 15 farms raise milk cows. • 189 farms produced corn for silage. • 1,352 farms produced 482,000 tons of forage crops (hay, etc.) on 317,000 acres. • 1,010 farms sold at least $27 million of forage. Note that data for sales of forage crops in Rolette,
and Towner counties were suppressed by the USDA in an effort to protect confidentiality, so this total is incomplete.
Other Livestock & Animal Products: • 27 farms hold an inventory of at least 600 hogs and pigs. Note that data for inventory of hogs and
pigs in Bottineau, and Towner counties were suppressed by the USDA in an effort to protect confidentiality, so this total is incomplete.
• 23 farms sold at least 489 hogs and pigs in 2012. Note that data for sales of hogs and pigs in Bottineau, and Towner counties were suppressed by the USDA in an effort to protect confidentiality, so this total is incomplete.
• 70 farms hold an inventory of at least 3,860 sheep and lambs. Note that data for inventory of sheep and lambs in Rolette County were suppressed by the USDA in an effort to protect confidentiality, so this total is incomplete.

CONAC Region Farm & Food Economy (North Dakota) — Ken Meter, Crossroads Resource Center — 2015
— 5 —
• 79 farms sold at least $317,000 worth of sheep, goats, and lambs in 2012. Note that data for sales of sheep, goats, and lambs in Rolette, and Towner counties were suppressed by the USDA in an effort to protect confidentiality, so this total is incomplete.
• 100 farms hold an inventory of at least 1,020 laying hens. Note that data for inventory of laying hens in McHenry, and Rolette counties were suppressed by the USDA in an effort to protect confidentiality, so this total is incomplete.
• 16 farms raise broiler chickens. • No farms engage in aquaculture. • 147 farms raise horses and ponies.
Grains, Oil Seeds, & Edible Beans: • 1,788 farms produced $974 million of grains, oil seeds, and edible beans. • 613 farms produced 19 million bushels of corn on 204,000 acres, worth $122 million. • This amounts to an average price per bushel of corn of $6.42. Note that this price is an
approximation, and does not necessarily represent an actual price at which corn was sold. • 934 farms produced 13 million bushels of soybeans on 436,000 acres, worth $164 million. • This amounts to an average price per bushel of soybeans of $12.62. Note that this price is an
approximation, and does not necessarily represent an actual price at which soybeans was sold. • The total value of corn and soybeans amounted to 25% of all farm product sales in 2012. • 1,433 farms produced 44 million bushels of wheat on 1 million acres, worth $340 million. • This amounts to an average price per bushel of wheat of $7.73. Note that this price is an
approximation, and does not necessarily represent an actual price at which wheat was sold.
Vegetables & Melons (some farmers state that Ag Census data does not fully represent vegetable production): • 27 farms worked at least 12 acres to produce vegetables, worth over $9,000. Note that data for
acreage of vegetables in 3 of 6 counties, and data for sales of vegetables in 4 of 6 counties were suppressed by the USDA in an effort to protect confidentiality, so these totals are incomplete.
• This represents a 14 farm increase over 2007. • 15 farms raised potatoes.
Fruits (some farmers state that Ag Census data does not fully represent fruit production): • 7 farms in the region hold at least 30 acres of orchards. Note that data for acreage of orchards in 3
of 6 counties were suppressed by the USDA in an effort to protect confidentiality, so this total is incomplete. • 8 farms sold at least $1,000 of fruits, nuts, and berries. Note that data for sales of fruits, tree nuts,
and berries in Bottineau County were suppressed by the USDA in an effort to protect confidentiality, so this total is incomplete.

CONAC Region Farm & Food Economy (North Dakota) — Ken Meter, Crossroads Resource Center — 2015
— 6 —
Nursery & Greenhouse Plants: • 8 farms sold ornamentals in 2012. Note that data for sales of ornamentals were supprsesed by the
USDA in an effort to protect confidentiality. • This represents a 3 farm increase over 2007.
Direct & Organic Sales: • 61 farms sell $69,000 of food products directly to consumers. This is a 13% increase of
number of farms (54 in 2007) selling direct, and a 36% decrease in direct sales from 2007 sales of 108,000.
• This amounts to 0.01% of farm product sales, less than the national average of 0.3%. • Bottineau County leads the region in direct sales, with $26,000. • 8 farms in the region sold organic products. • 5 farms market through community supported agriculture (CSA). • 60 farms produce and sell value-added products. • 3 farms marketed products directly to retail outlets. • 1 farm had on-farm packing facilities.
Conservation Practices: • 283 farms practice rotational or management intensive grazing. • No farms practiced alley cropping or silvopasture. • 4 farms harvested biomass for use in renewable energy.
Other Crops: • 149 farms produced at least 626,000 bushels of oats on 11,000 acres. Note that data for bushels
of oats in Towner County were suppressed by the USDA in an effort to protect confidentiality, so this total is incomplete.
• 763 farms produced 17 million bushels of barley on 273,000 acres, worth at least $90 million. Note that data for sales of barley in Rolette County were suppressed by the USDA in an effort to protect confidentiality, so this total is incomplete.
• 317 farms produced 23 billion pounds of sunflower seed on 135,000 acres.

CONAC Region Farm & Food Economy (North Dakota) — Ken Meter, Crossroads Resource Center — 2015
— 7 —
Operations by Legal Status for Tax Purposes in the CONAC region (Census of Agriculture, 2012)
Farms AcresFamily or individual 3,654 3,824,581Partnership 225 520,515Corporation (family held) 57 *110,040Corporation (other than family held) 5 9,493Other – cooperative, estate or trust, institutional, etc. 95 *57,592
Totals 4,036 *4,522,221

CONAC Region Farm & Food Economy (North Dakota) — Ken Meter, Crossroads Resource Center — 2015
— 8 —
County and State Highlights
Benson County highlights (Census of Agriculture, 2012): • 563 farms, 5% less than in 2007. • Benson County has 802,000 acres of land in farms. • Farmers sold $241 million of products in 2012. • $223 million (93%) of these sales were crops. • $18 million (7%) of these sales were livestock. • The most prevalent farm size is 1,000 acres, with 227 farms (40%) in this category. • The next most prevalent is 180 to 499 acres, with 116 (21%) farms. • 39 farms (7%) are less than 50 acres. • 214 farms (38%) sold less than $10,000 in farm products. • 259 farms (46%) sold more than $100,000 in farm products. • Benson County ranks 1st in North Dakota for inventory of bison, with 3,489. • The county ranks sixth in the state for acreage of edible beans, with 45,000. • Benson County ranks eighth in North Dakota for acreage of soybeans, with 171,000. • 11 farms sold $12,000 of food directly to consumers. This is 3 farm increase, and a 68%
decrease in direct sales since 2007 sales of $37,000. • Direct sales were 0.005% of farm product sales, less than the national average of 0.3%.
Bottineau County highlights (Census of Agriculture, 2012): • 863 farms, 4% less than in 2007. • Bottineau County has 899,000 acres of land in farms. • Farmers sold $254 million of products in 2012. • $242 million (95%) of these sales were crops. • $12 million (5%) of these sales were livestock. • The most prevalent farm size is 1,000 acres or more, with 257 farms (30%) in this category. • The next most prevalent is 50 to 179 acres, with 223 (26%) farms. • 73 farms (8%) are less than 50 acres. • 403 farms (47%) sold less than $10,000 in farm products. • 301 farms (35%) sold more than $100,000 in farm products. • Bottineau County ranks 1st in North Dakota for acreage of barley, with 106,000. • The county ranks first in the state for acreage of sunflower seed, with 81,000. • Bottineau County ranks third in the state for inventory of hogs and pigs, but sales figures were
suppressed by the USDA in an effort to protect confidentiality. • The county ranks 4th in the state for acreage of canola, with 83,000. • Bottineau County ranks sixth in North Dakota for acreage of wheat, 278,000. • The county ranks 6th in the state for acreage of spring wheat, with 200,000.
CONAC Region Farm & Food Economy (North Dakota) — Ken Meter, Crossroads Resource Center — 2015
— 9 —
• Bottineau County ranks seventh in the state for sales of poultry and eggs, but sales figures were suppressed by the USDA in an effort to protect confidentiality.
• 23 farms sold $26,000 of food directly to consumers. This is a 130% increase in the number of farms selling direct (10 in 2007), and a 225% increase in direct sales over 2007 sales of $8,000.
• Direct sales were 0.01% of farm product sales, less than the national average of 0.3%.
McHenry County highlights (Census of Agriculture, 2012): • 911 farms, 2% less than in 2007. • McHenry County has 1 million acres of land in farms. • Farmers sold $198 million of products in 2012. • $143 million (72%) of these sales were crops. • $55 million (28%) of these sales were livestock. • The most prevalent farm size is 1,000 acres or more, with 301 farms (33%) in this category. • The next most prevalent is 50 to 179 acres, with 195 (21%) farms. • 84 farms (9%) are less than 50 acres. • 397 farms (44%) sold less than $10,000 in farm products. • 316 farms (35%) sold more than $100,000 in farm products. • McHenry County ranks 1st in North Dakota for acreage of forage (hay, etc.), with 149,000. • The county ranks second in the state for inventory of cattle and calves, with 94,000. • McHenry County ranks third in the state for sales of livetock and poultry products, with $55
million. • The county ranks third in the state for sales of cattle and calves, with $49 million. • McHenry County ranks fifth in the state for sales of milk, but sales figures were suppressed by the
USDA in an effort to protect confidentiality. • The county ranks 5th in North Dakota for inventory of laying hens, but inventory figures were
suppressed by the USDA in an effort to protect confidentiality. • McHenry sixth in the state for inventory of horses and ponies, with 1,785. • The county ranks 8th in the state for sales of forage crops (hay, etc.), with $16 million. • 5 farms sold $19,000 of food directly to consumers. This is a 72% decrease in the number of
farms selling direct (18 in 2007), and a 6% increase in direct sales over 2007 sales of $18,000. • Direct sales were 0.01% of farm product sales, less than the national average of 0.3%.
Pierce County highlights (Census of Agriculture, 2012): • 521 farms, 2% less than in 2007. • Pierce County has 598,000 acres of land in farms. • Farmers sold $142 million of products in 2012.

CONAC Region Farm & Food Economy (North Dakota) — Ken Meter, Crossroads Resource Center — 2015
— 10 —
• $129 million (91%) of these sales were crops. • $13 million (9%) of these sales were livestock. • The most prevalent farm size is 1,000 acres or more, with 199 farms (38%) in this category. • The next most prevalent is 180 to 499 acres, with 104 (20%) farms. • 39 farms (7%) are less than 50 acres. • 230 farms (44%) sold less than $10,000 in farm products. • 218 farms (42%) sold more than $100,000 in farm products. • Pierce County ranks 4th in North Dakota for inventory of bison, with 580. • The county ranks sixth in the state for sales of poultry and eggs, but sales figures were suppressed
by the USDA in an effort to protect confidentiality. • No farms sold food directly to consumers in 2012.
Rolette County highlights (Census of Agriculture, 2012): • 649 farms, 2% less than in 2007. • Rolette County has 534,000 acres of land in farms. • Farmers sold $108 million of products in 2012. • $98 million (91%) of these sales were crops. • $10 million (9%) of these sales were livestock. • The most prevalent farm size is 180 to 499 acres, with 173 farms (27%) in this category. • The next most prevalent is 50 to 179 acres, with 165 (25%) farms. • 154 farms (24%) are 1,000 acres or more. • 59 farms (9%) are less than 50 acres. • 320 farms (49%) sold less than $10,000 in farm products. • 161 farms (25%) sold more than $100,000 in farm products. • Rolette County ranks second in North Dakota for inventory of laying hens, but inventory
figures were suppressed by the USDA in an effort to protect confidentiality. • The county ranks third in the state for sales of Christmas trees, but sales figures were suppressed
by the USDA in an effort to protect confidentiality. • Rolette County ranks seventh in the state for acreage of canola, with 73,000. • The county ranks 7th in the state for inventory of horses and ponies, with 1,753. • 14 farms sold $7,000 of food directly to consumers. This is a 2 farm increase, and a 84%
decrease in direct sales since 2007 sales of $43,000. • Direct sales were 0.01% of farm product sales, less than the national average of 0.3%.
Towner County highlights (Census of Agriculture, 2012): • 529 farms, 7% more than in 2007. • Towner County has 645,000 acres of land in farms.
CONAC Region Farm & Food Economy (North Dakota) — Ken Meter, Crossroads Resource Center — 2015
— 11 —
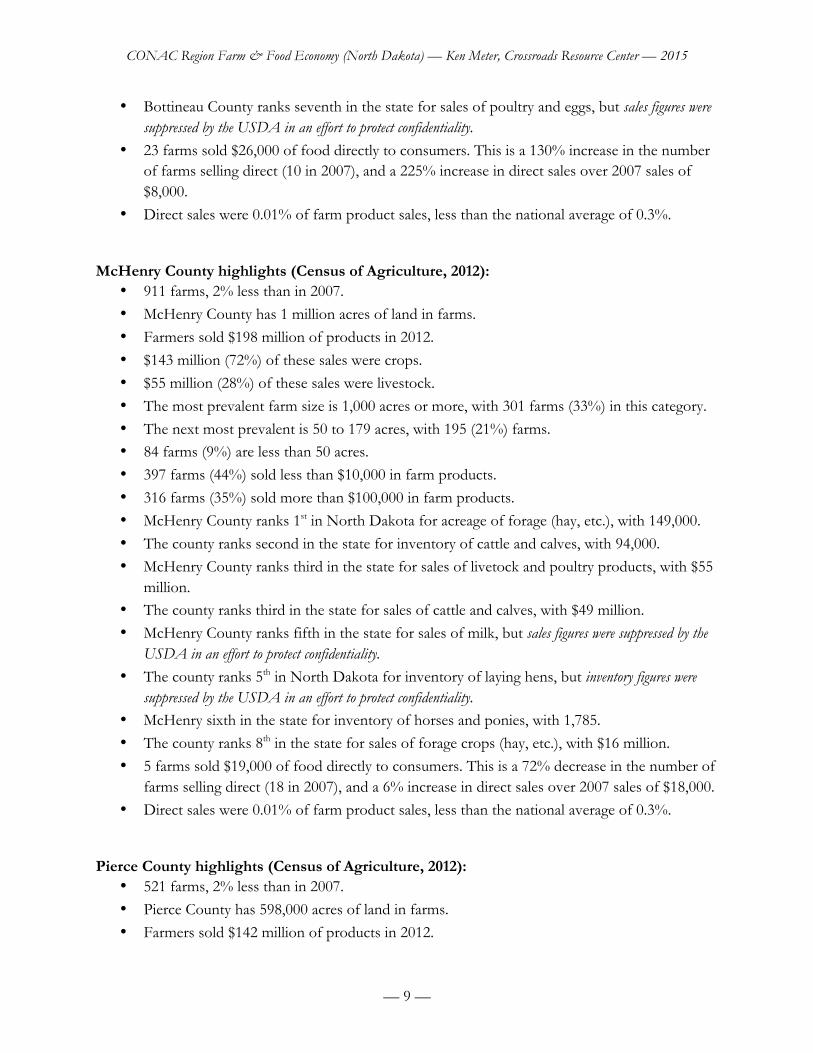
• Farmers sold $197 million of products in 2012. • $180 million (91%) of these sales were crops. • $17 million (9%) of these sales were livestock. • The most prevalent farm size is 1,000 acres or more, with 224 farms (42%) in this category. • The next most prevalent is 500 to 999 acres, with 106 (20%) farms. • 38 farms (7%) are less than 50 acres. • 209 farms (40%) sold less than $10,000 in farm products. • 281 farms (53%) sold more than $100,000 in farm products. • Towner County ranks 1st in the state for sales of hogs and pigs, but sales figures were suppressed
by the USDA in an effort to protect confidentiality. • The county ranks first in the state for inventory of hogs and pigs, but inventory figures were
suppressed by the USDA in an effort to protect confidentiality. • Towner County ranks second in North Dakota for acreage of canola, with 136,000. • The county ranks seventh in the state for acreage of barley, with 37,000. • Towner County ranks 10th in North Dakota for sales of vegetables, but sales figures were
suppressed by the USDA in an effort to protect confidentiality. • The County ranks 10th in the state for acreage of spring wheat, with 167,000. • 8 farms sold $5,000 of food directly to consumers in 2012. There were no direct sales in
2007. • Direct sales were 0.003% of farm product sales, less than the national average of 0.3%.

CONAC Region Farm & Food Economy (North Dakota) — Ken Meter, Crossroads Resource Center — 2015
— 12 —
State of North Dakota highlights (Census of Agriculture, 2012):
• 30,961 farms, 3% less than in 2007. • North Dakota has 39 million acres of land in farms. • Farmers sold $11 billion of products in 2012. • $9.7 billion (88%) of these sales were crops. • $1.3 billion (12%) of these sales was livestock. • The most prevalent farm size is 1,000 acres or more, with 10,861 farms (35%) in this
category. • The next most prevalent is 50 to 179 acres, with 6,557 (21%) farms. • 3,400 farms (11%) are less than 50 acres. • 12,698 farms (41%) sold less than $10,000 in farm products. • 12,556 farms (41%) sold more than $100,000 in farm products. • North Dakota ranks 1st in the country for acreage of spring wheat, with 5.7 million. • The state ranks 2nd in the country for inventory of colonies of bees, with 370,000. • North Dakota ranks 2nd in the country for acreage of wheat, with 7.8 million. • The state ranks 5th in the country for sales of grains, oilseeds, dry beans, and dry peas, with
$8.8 billion. • North Dakota ranks sixth in the country for crop sales, with $9.7 billion. • The state ranks 7th in the country for acreage of soybeans for beans, with 4.7 million. • North Dakota ranks 9th in the country for acreage of corn for grain, with 3.5 million. • The state ranks ninth in the country for acreage of forage (hay, etc.), with 2.2 million. • Statewide vegetable sales totaled $251 million. • 433 farms sold $1.94 million of food directly to consumers. This is a 11 farm decrease in the
number of farms selling direct, and a 20% decrease in direct sales since 2007 sales of $2.43 million.
• Direct sales were 0.02% of farm product sales, much lower than the national average of 0.3%.
• At $1.9 million, direct sales from farmers to consumers amounted to more than the value of the 11th-ranking product, fruits and nuts.
• 118 farms in North Dakota sold $9.8 million of organic food products. • 49 farms market through community supported agriculture (CSA). • 674 farms produce and sell value-added products. • 111 farms marketed products directly to retail outlets. • 47 farms had on-farm packing facilities. • 3,270 farms practice rotational or management intensive grazing. • 38 farms harvested biomass for use in renewable energy.
CONAC Region Farm & Food Economy (North Dakota) — Ken Meter, Crossroads Resource Center — 2015
— 13 —
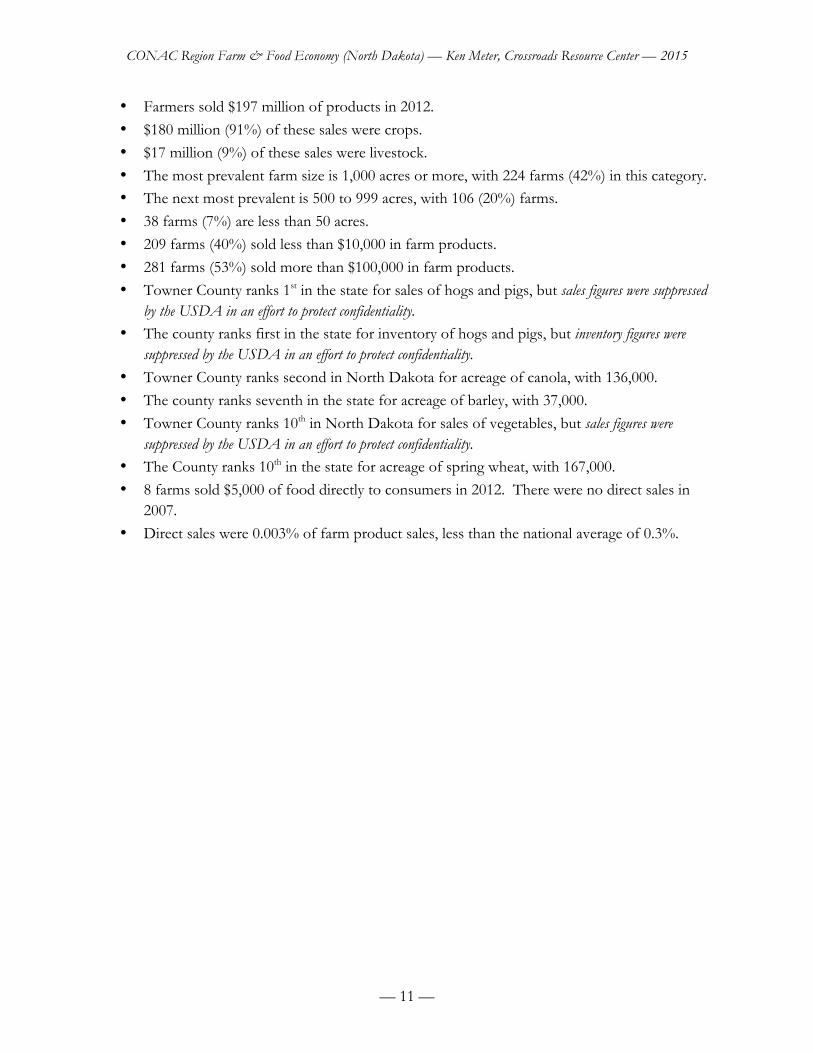
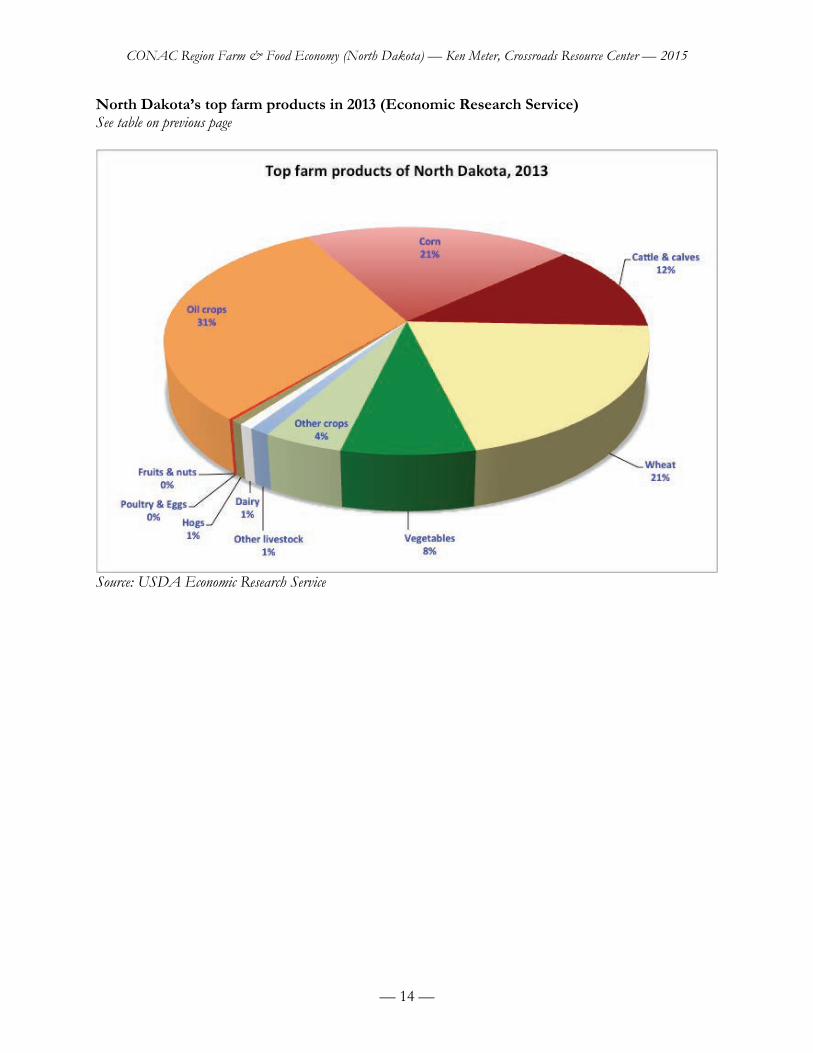
North Dakota’s top farm products in 2013 (Economic Research Service) The data in the table below and pie chart on next page are for North Dakota as a whole.
$ millions
Oil crops 2,617 Corn 1,776 Cattle & calves 1,052 Wheat 1,734 Vegetables 640 Other crops 382 Other livestock 97 Dairy 67 Hogs 58 Poultry & eggs 20 Fruits & nuts 0.4
Note also that at $1.9 million, direct sales from farmers to consumers amounted to more than the value of the 11th-ranking product, fruits and nuts.
CONAC Region Farm & Food Economy (North Dakota) — Ken Meter, Crossroads Resource Center — 2015
— 14 —
North Dakota’s top farm products in 2013 (Economic Research Service) See table on previous page
Source: USDA Economic Research Service

CONAC Region Farm & Food Economy (North Dakota) — Ken Meter, Crossroads Resource Center — 2015
— 15 —
Balance of Cash Receipts and Production Costs (BEA): CONAC region farmers sell $608 million of food commodities per year (1989-2013 average), spending $627 million to raise them, for an average loss of $19 million each year. This is an average net cash loss of $4,707 per farm. Note that these sales figures compiled by the BEA may differ from cash receipts recorded by the USDA Census of Agriculture (above). Overall, farm producers spent a total of $500 million more raising crops and livestock over the years 1989 to 2013, than they earned by selling those products. Indeed, farm production costs exceeded cash receipts for 15 years of that 25-year period. Moreover, 26% of the region's farms reported that they lost money in 2012 (Ag Census), and CONAC region farmers and ranchers earned $168 million less by selling commodities in 2013 than they earned in 1969 (in 2013 dollars). Farmers and ranchers earn another $63 million per year of farm-related income — primarily custom work, and rental income (24-year average for 1989-2013). Federal farm support payments are a more important source of net income than commodity production, averaging $105 million per year for the region for the same years. The region's consumers: See also information covering low-income food consumption and food-related health conditions, page 1-2 above. CONAC region consumers spend $109 million buying food each year, including $67 million for home use. Most of this food is produced outside the region, so CONAC region consumers spend about $100 million per year buying food sourced far away. Only $69,000 of food products (0.01% of farm cash receipts and 0.06% of the region’s consumer market) are sold by farmers directly to consumers.
Farm and food economy summary: Farmers lose $19 million each year producing food commodities, and spend $500 million buying inputs sourced outside of the region. This is only partially offset by federal subsidies. Even when farmers make money, these input purchases result in substantial losses to the region as a whole. Overall, farm production creates a loss of $520 million to the region. Meanwhile, consumers spend $100 million buying food from outside. Thus, total loss to the region is $620 million of potential wealth each year. This loss equals the value of all food commodities raised in the region.

CONAC Region Farm & Food Economy (North Dakota) — Ken Meter, Crossroads Resource Center — 2015
— 16 —
CONAC region: markets for food eaten at home (2012): CONAC region residents purchase $109 million of food each year, including $67 million to eat at home. Home purchases break down in the following way:
millions Meats, poultry, fish, and eggs $ 14 Fruits & vegetables 12 Cereals and bakery products 9 Dairy products 7 “Other,” incl. Sweets, fats, & oils 24
If CONAC region residents purchased $5 of food for home use directly from farmers in the region, this would generate $10 million of new farm income for the region. Benson County: markets for food eaten at home (2012): Benson County residents purchase $18 million of food each year, including $11 million to eat at home. Home purchases break down in the following way:
millions Meats, poultry, fish, and eggs $ 2.3 Fruits & vegetables 2.1 Cereals and bakery products 1.6 Dairy products 1.2 “Other,” incl. Sweets, fats, & oils 4.0
Bottineau County: markets for food eaten at home (2012): Bottineau County residents purchase $18 million of food each year, including $11 million to eat at home. Home purchases break down in the following way:
millions Meats, poultry, fish, and eggs $ 2.2 Fruits & vegetables 2.0 Cereals and bakery products 1.6 Dairy products 1.2 “Other,” incl. Sweets, fats, & oils 3.9

CONAC Region Farm & Food Economy (North Dakota) — Ken Meter, Crossroads Resource Center — 2015
— 17 —
McHenry County: markets for food eaten at home (2012): McHenry County residents purchase $16 million of food each year, including $10 million to eat at home. Home purchases break down in the following way:
millions Meats, poultry, fish, and eggs $ 2.0 Fruits & vegetables 1.8 Cereals and bakery products 1.4 Dairy products 1.0 “Other,” incl. Sweets, fats, & oils 3.5
Pierce County: markets for food eaten at home (2012): Pierce County residents purchase $12 million of food each year, including $7 million to eat at home. Home purchases break down in the following way:
millions Meats, poultry, fish, and eggs $ 1.5 Fruits & vegetables 1.4 Cereals and bakery products 1.0 Dairy products 0.8 “Other,” incl. Sweets, fats, & oils 2.6
Rolette County: markets for food eaten at home (2012): Rolette County residents purchase $39 million of food each year, including $24 million to eat at home. Home purchases break down in the following way:
millions Meats, poultry, fish, and eggs $ 5 Fruits & vegetables 4 Cereals and bakery products 3 Dairy products 3 “Other,” incl. Sweets, fats, & oils 9
CONAC Region Farm & Food Economy (North Dakota) — Ken Meter, Crossroads Resource Center — 2015
— 18 —
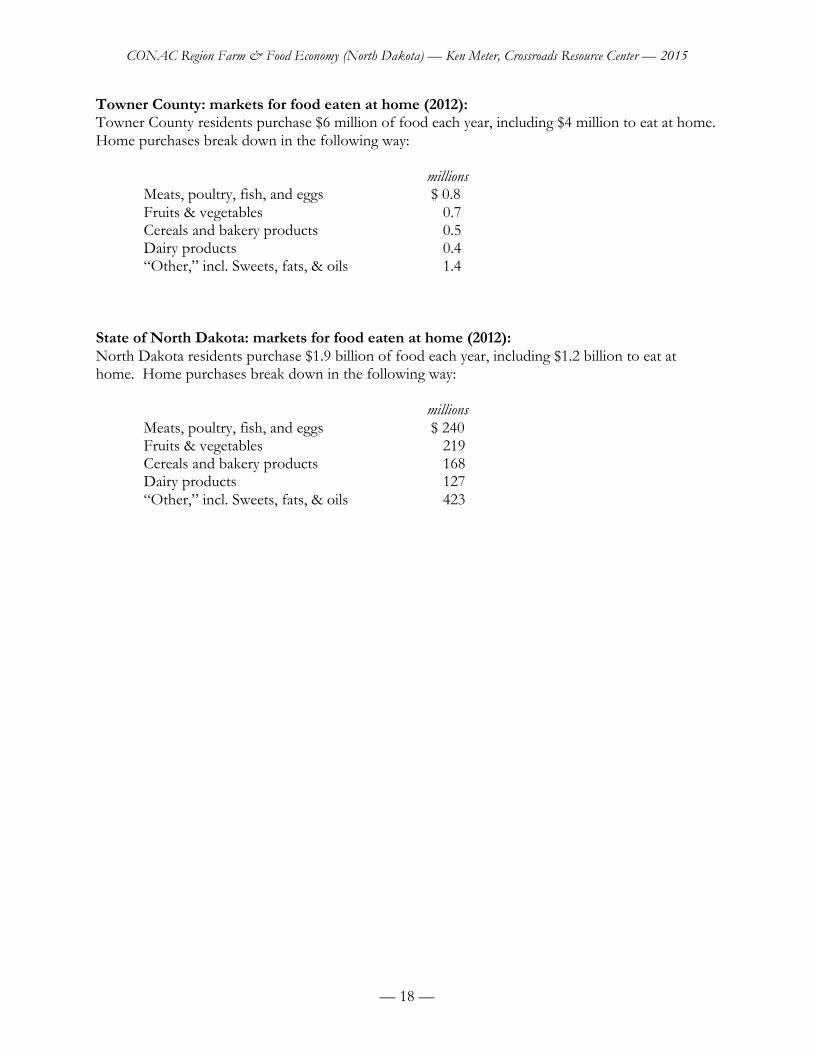
Towner County: markets for food eaten at home (2012): Towner County residents purchase $6 million of food each year, including $4 million to eat at home. Home purchases break down in the following way:
millions Meats, poultry, fish, and eggs $ 0.8 Fruits & vegetables 0.7 Cereals and bakery products 0.5 Dairy products 0.4 “Other,” incl. Sweets, fats, & oils 1.4
State of North Dakota: markets for food eaten at home (2012): North Dakota residents purchase $1.9 billion of food each year, including $1.2 billion to eat at home. Home purchases break down in the following way:
millions Meats, poultry, fish, and eggs $ 240 Fruits & vegetables 219 Cereals and bakery products 168 Dairy products 127 “Other,” incl. Sweets, fats, & oils 423
CONAC Region Farm & Food Economy (North Dakota) — Ken Meter, Crossroads Resource Center — 2015
— 19 —
Key data sources:
Bureau of Economic Analysis data on farm production balance http://www.bea.doc.gov/bea/regional/reis/ Food consumption estimates from Bureau of Labor Statistics Consumer Expenditure Survey http://www.bls.gov/cex/home.htm U.S. Census of Agriculture http://www.nass.usda.gov/census/ USDA/Economic Research Service food consumption data: http://www.ers.usda.gov/data/foodconsumption/ USDA/ Economic Research Service farm income data: http://ers.usda.gov/Data/FarmIncome/finfidmu.htm
For more information:
To see results from Finding Food in Farm Country studies in other regions of the U.S.: http://www.crcworks.org/?submit=fffc To read the original Finding Food in Farm Country study from Southeast Minnesota (written for the Experiment in Rural Cooperation): http://www.crcworks.org/ff.pdf To view a PowerPoint presented in March, 2008, by Ken Meter at Rep. Collin Peterson’s (D-MN) Minnesota agricultural forum, called the “Home Grown Economy”: http://www.crcworks.org/crcppts/petersonkm08.pdf For further information: http://www.crcworks.org/
Contact Ken Meter at Crossroads Resource Center <[email protected]>
(612) 869-8664