Crossover Jets Market Report
38
May 2021 Angus von Schoenberg Crossover Jets Market Report
Transcript of Crossover Jets Market Report

May 2021Angus von Schoenberg
Crossover JetsMarket Report
Crossover Jet ForewordThe entire value chain in the global aviation industry has been hit by a devastating crisis since 2020. However, not all segments of the industry are affected equally. The following report aims to decipher the current market dynamics in one part of the industry that has so far suffered less than others and is expected to lead its recovery. From a passenger demand perspective, this is domestic and regional short-haul travel. According to Kroll Bond Rating Agency (KBRA) “The global regional market is poised to be a leader in the overall aviation market recovery as international travel remains restricted and passengers may be more comfortable with shorter-duration regional flights before long-haul flights, especially in light of vaccine rollouts which should support domestic and regional safety concerns more immediately.” Many industry experts and observers believe that pent-up demand for leisure and visiting friends and relatives will drive this recovery with business travel lagging behind. However, previous, albeit less severe, crises have almost always predicted a decline in business travel, a concern which persistently proved to be unfounded on every occasion.
The equipment serving this demand is met by a combination of narrowbody and regional aircraft. This report covers aircraft in the 100-150 seat category, primarily the new generation Airbus A220 and its Embraer E2 competitor that are increasingly referred to as Crossover Jets, along with current generation E1s. These represent a substantial portion of TrueNoord’s target market, and those of other lessors that focus on regional aircraft. According to KBRA the market “…would support demand for regional aircraft in the near term, while a potential supply glut is expected to be mitigated as operators rightsize their fleets through both retirement of older and larger gauge aircraft… Longer term, the demand for new and used aircraft is expected to be supported by a growing middle-class, a wave of retirements requiring replacements and operators’ increased focus on efficiency and sustainability”. The very fact that, despite the industry slump, there was a net gain of orders for sub-150 seat jets in 2020, and more cancellations than new orders for larger narrowbodies last year, would appear to support this view.
In Asia where airlines have traditionally shunned sub-150 seat jets in favour of larger aircraft, and in some cases widebodies, on domestic and short-haul routes, Asianaviation.com extols the role of such aircraft in the region. It cites examples in Japan, China and Australia where smaller narrowbodies and regional jets are both leading the recovery and maintaining essential connectivity.
Beyond the current pandemic, this report also begins to address our industry’s other prime concern, which is the environmental sustainability of the regional air transport sector.
Anne-Bart Tieleman, CEO

Crossover Jets Market Report | 3
Contents
1 Introduction & Scope 6
2 Summary Specifications, Performance, Economics & Developments 72.1 Development Timeline 72.2 Current Specifications 82.3 Engines 112.4 Range 122.5 Performance 132.6 Economic Comparison 132.7 Economic Comparison Points 162.8 Emissions 18
3 Market Review 203.1 Numbers in Service Update 203.2 Delivery Profile 203.3 Firm Order Backlog 213.4 Future Crossover Jet Forecast 223.5 Crossover Jet Operator Base 243.6 Geographical Dispersion 273.7 Operator Quality 27
4 Crossover Jets Owned by Lessors 284.1 Comparative Lessor Penetration 284.2 Leased Fleet Review 28
5 Market Availability & Demand 305.1 Demand & Supply Drivers 305.2 New Normal Demand 305.3 Availability - Aircraft in Storage 325.4 Placement of Used Aircraft 335.5 Risk factors 33
6 TrueNoord CMV & FV Assessment 346.1 General Trends 346.2 New Value Trends 356.3 Used Crossover Jet Values 366.4 Lease Rate Trends in Market 37

4 | Crossover Jets Market Report
Crossover Jet Executive Summary SWOT
Strengths• The A220 and E2 (Crossover Jets) offer
the best operating economics of any sub-150 seat aircraft
• Competitive operating economics with Airbus A320neo and Boeing 737 MAX
• Best in class range for those airlines that need it
• Interior cabin closer to that of large narrowbody than any other regional jet
• Crossover Jets offer the ideal capacity to lead the overall aviation market recovery in domestic, regional and short-haul markets in a reduced demand environment
Opportunities• Operating economics similar to A320neo
and 737 MAX may create demand from LCC airlines
• Any short or longer term downturn in demand for travel could favour the capacity offered by the Crossover Jets by offering “right-sizing” opportunities
• Increased pressure to demonstrate lower emissions could favour deployment of additional Crossover Jets
• Any trend towards more point-to-point services, instead of indirect routings through hubs, caused by customer preferences and increased sustainability pressure could increase demand for this category of aircraft
Weaknesses• Perceived lower cabin quality due to
narrower fuselage and reduced on-board baggage capacity compared to established narrowbodies
• The many different possible configurations of the A220 could harm liquidity of the type in the secondary market. There are fewer E2 configuration variants
• While an A220 stretch to a -500 variant is feasible this would risk cannibalising Airbus’ core A320 product line. This risk does not exist for the E2
• Embraer lacks the market power of Airbus and does not have presence in the narrowbody segment
Threats• Any prolonged COVID-19 induced
economic downturn could negatively impact any significant future orders for Crossover Jets for some years to come and lower market acceptance of the type
• Prolonged availability of distressed current generation E1 aircraft in particular could slow demand growth for both A220s and E2s
• Earlier obsolescence risk against future disruptive alternative propulsion systems or revolutionary airframe design

Crossover Jets Market Report | 5
Values & Lease RatesThe values and lease rates described below are from appraisers. Other than for new aircraft deliveries there have been no transactions involving used aircraft so no data points are available. This is to be expected for these aircraft since they are all new to market within the last five years. There is some evidence that lease rates are slightly lower than shown below particularly for new deliveries to airlines that are considered strong credits.
New Value Average (Average of: Avitas, Collateral Verifications, IBA, ICF, MBA and Oriel)
• A220-100 US$32.6m
• A220-300 US$36.8m
• E190-E2 US$31.1m
• E195-E2 US$33.9m
Average New Aircraft Lease Rates Per Month(Average of: Avitas, Collateral Verifications, IBA, ICF, MBA and Oriel)
• A220-100 US$230,000
• A220-300 US$256,000
• E190-E2 US$222,000
• E195-E2 US$242,000

6 | Crossover Jets Market Report
1 Introduction & ScopeAircraft Types covered in this ReportAirbus A220 & Embraer E-Jet E2
Originally designed and manufactured by Bombardier as the C-Series in two models, the CS100 and CS300, this report will review the Airbus A220-100 and A220-300 (collectively referred to as “A220” hereafter where applicable) alongside the Embraer E-190E2 and E-195E2 (collectively the “E2” hereafter where applicable). Within the E2 family there will be greater focus on the E195-E2 since the E190-E2 is more commonly classed as a regional jet with the same capacity as its E1 predecessor.
From a definitional standpoint, these aircraft can be referred to as either large regional jets or small narrowbodies. Often the larger A220-300 in particular and sometimes the E195-E2 are deemed to be small narrowbodies while their respective smaller siblings are often classed as regional jets. More recently the term “Crossover Jet” has also been applied to these aircraft and this report adopts that term.
CompetitorsThe Crossover Jets’ closest competitors are in the small narrowbody category, the 737-700 and the A319 and these will also be included where relevant. The smaller 737-600 and A318, which are now out of production, were only ever manufactured in very small numbers and will therefore be excluded.
ScopeThis report provides an overview of the 100-150 seat jet market primarily covering the above referenced in-production aircraft.
In some cases, the economics of the Crossover Jets will also be compared to larger A320 or 737-800 aircraft to derive a more comprehensive view of their actual and potential position in the market.
This report will examine the A220 and E2 aircraft characteristics, applications, market penetration, and operating economics, as well as addressing the current dynamics in values of these aircraft which continue to see some variety of opinion from the appraisal community. The impact of the COVID-19 induced pandemic on the market for the type will be included. Furthermore, in the economic analysis, the effect of reduced passenger demand will be assessed.
In addition, this report includes a new comparative section on emissions for the applicable aircraft and how this matches the road transport options that compete with regional aircraft operations. Since rail transport is only an alternative between large cities where air transport is mainly confined to larger aircraft, this is excluded.

Crossover Jets Market Report | 7
2 Summary Specifications, Performance, Economics & Developments
2.1 Development Timeline2.1.1 A220
The A220 programme’s history suffered a series of false starts and delays. It was initially launched as the BRJ-X (Bombardier Regional Jet expansion) in 1998, but was shelved in 2000 in favour of the cheaper development of its existing CRJ platform. The programme was not revisited until 2004 when the C-Series powered by Pratt and Whitney geared turbofans was first mooted. In 2006 the project was again shelved. In the meantime Embraer had successfully launched the E-Jets and both the E170 and E190 had entered service.
In 2008 the aircraft was again relaunched with an initial firm order from Lufthansa Group for SWISS with planned first deliveries in 2012 beginning with the CS100 to be followed by the CS300 some 6 months later. This schedule suffered significant delays primarily due to the GTF engine which was not certified until 2013. In early 2014, the GTF suffered an uncontained engine failure on a test flight, which caused a temporary suspension of the programme. Further certification related delays meant that the CS100 was not certified by Transport Canada until December 2015. The FAA and EASA (Source: EASA TCDS 30/11/2018) followed in June 2016 for the A220-100 and October 2016 for the A220-300.
The delays and resulting budget overruns threatened the stability of the Bombardier Group, which in turn led to a Canadian government sponsored bailout funded by the Caisse d’Investissement de Quebec. Meanwhile Airbus, in particular, had been competing aggressively with Bombardier to deter potential C-Series customers.
Even with the previous bailout, it became clear during 2017 that the programme could not survive independently and so later that year Airbus, which itself was threatened with a US/Europe trade dispute, agreed to purchase a majority (50.1%) stake in the programme with Bombardier and the Caisse d’Investissement retaining the remaining shares. However, regulatory anti-trust approval did not occur till mid-2018 and only at that point did it become possible to integrate the programme and rebrand the aircraft as the A220.
2.1.2 E2
The E2’s programme history was a shorter process. Following its most successful aircraft programme to date with the E1, Embraer announced the E2 at the 2013 Paris Air Show.
In response to both the demand for larger capacity aircraft at that time and a need for improved operating economics, the smallest capacity E170 was dropped and the entry level aircraft was the E175-E2. Embraer kept the E190-E2 at the same capacity as its predecessor and added three rows to the E195 to offer its largest ever aircraft.
From a design and technical perspective, the larger E2 pairing adopted the same PW engine as the A220 in place of the CF34 on its predecessor. This larger engine and the drive for greater efficiency has also led to a new wing design. Updated avionics and a new interior complete the main upgrades.
The first aircraft as an E190-E2 made its maiden flight in May 2016 slightly ahead of schedule. Other aircraft were then added to the test programme and the aircraft was certified by the Brazilian aviation authority (ANAC), the FAA and EASA in February 2018 and the first production aircraft was delivered to Wideroe shortly thereafter. The larger E195-E2 obtained its type certification in April 2019.

8 | Crossover Jets Market Report
2.2 Current Specifications2.2.1 Configuration & Services
For all available aircraft types, the larger the cabin, the greater the number of possible interior configurations. As the A220 is the largest aircraft in the Crossover Jet category it is normal to expect the type to have a larger variety of seating configurations and service level options. In addition, as most operators consider the type a small narrowbody operated by mainline carriers, the aircraft is likely to be used on some longer distance missions that require more on-board services compared to smaller regional jets or turboprops.
As a consequence, Airbus offers a series of possible seating configurations to cater for the complete range of full-service carriers and those that operate an LCC business model. This includes various dual and single class configurations as described in Figure 1 below. Different layouts are also common on the E2 and Embraer E1 or CRJ types, but Airbus offers a greater variety of service options to satisfy the wishes of customer airlines.
Figure 1: A220 Configuration Options
2 x 3 12 97-108 125 135
2 x 3 12 120-125 145 160
Cross Section Dual Business Dual Economy Single Class Density Typical Dual & Single Class Maximum
A220-100
A220-300

Crossover Jets Market Report | 9
Services
The fore and aft galleys can be configured in a variety of ways to satisfy operator requirements. This includes a varied number of either two or three lavatories in different positions. There is also substantial variation in the number and depth of galley trolley stowage cabinets and passenger deck wardrobes.
While the number of cabin interior options may be attractive to airline customers, this creates greater transition time and costs for owners when and if aircraft are moved between operators that require a consistent fleet specification.
2.2.2 E2 Configuration & Services
At the lower end of seat capacities the A220-100 competes with the E2 range with the 96-114 seat E-190E2 and the A220-300 with the 120-146 seat E195-E2 (See Figure 2). Compared to the A220, the Embraer E2 seating is arranged in a typical regional jet 2 x 2 cross section, while the A220 is in 3 x 2. The E190-E2 is smaller than the A220-100, while the E195-E2 sits between both A220 variants when configured in a comparable dual or single class lay-out. In the densest delivered single class layout, the capacity of the A220-300 is almost identical to the high density E1905-E2 although the Embraer seat pitch at 28” is less spacious than that of the Airbus. The 160 seat Airbus variant has not yet been ordered.
Figure 1: A220 Configuration Options
2 x 3 12 97-108 125 135
2 x 3 12 120-125 145 160
Cross Section Dual Business Dual Economy Single Class Density Typical Dual & Single Class Maximum
A220-100
A220-300
Figure 2: Embraer E2 Configurations
2 x 2 9-12 84-88 106-114 114
2 x 2 12 108 132-146 146
Cross Section Dual Business Dual Economy Single Class Density Typical Dual & Single Class Maximum
E190-E2
E195-E2

10 | Crossover Jets Market Report
Figure 4: Seating in Other Regional Jets & Narrowbodies
Min Max Layout
A319ceo 110 156 3 x 3
A319neo 120 160 3 x 3
737-700 126 149 3 x 3
737 MAX 7 138 153 3 x 3
E190-E1 96 114 2 x 2
E195-E1 100 124 2 x 2
CRJ1000 97 104 2 x 2
Fokker 100 85 109 3 x 2
BAe RJ100 100 128 3 x 3/2
2.2.3 Competing Narrowbody Aircraft Capacity & Configuration
At the larger end of the spectrum as shown in Figure 3 below, the Crossover Jet capacity is similar to the A319neo and 737 MAX 7. Standalone, the A220-300, as a new generation aircraft, has better economics than the A319neo (see section 2.6). Consequently the A319neo is generally only preferred if the operator wishes to achieve commonality with other A320 family members.
Current & Older Generation Comparison
A variety of new, current and older generation aircraft as shown in Figure 4 with similar capacity remain active globally, of which current generation 737-700s and A319ceos remain the most widely in-service types. A smaller but significant number of current generation E195-E1s also remain in service of which many are less than 10 years old. Because of their relatively low acquisition cost compared to new A220s or E2 aircraft, these can be competitive despite their greater fuel consumption. By contrast, older out of production types from Fokker and BAe are mostly reaching retirement and are no longer considered to be competitors.
2.2.4 Principal Specifications & Weights
The principal weights and specifications associated with both A220 variants and the Embraer E190/E195-E2 along with current generation aircraft are shown in Figure 5 below.
Source: Embraer
Figure 3: Seat Capacity Comparison
200
180
160
140
120
100
80
Seat
Cap
acity
– S
ingl
e C
lass

Crossover Jets Market Report | 11
Figure 5: Specifications Comparison
Variant A220-100 A220-300 E190-E2 E195-E2
MTOW (max) 61,235kg 67,585kg 56,400kg 61,500kg
Max. payload 15,105kg 18,688kg 13,700kg 16,150kg
Engines (2x) PW1519G/ PW1521G/ PW1919G PW1919G PW1521G PW1524G
Range 3,350Nm 3,350Nm 2,850Nm 2,600Nm
Take o� Distance 1,540m 1,980m 1,490m 1,700m
Max Pax Capacity 135 160 114 146
Source: Airbus & Embraer
Variant E190-E1 E195-E1 A319 737-700
MTOW (max) 51,800kg 52,290kg 75,000kg 70,080kg
Max. payload 13,047kg 13,917kg 18,200kg 16,505kg
Engines (2x) CF34-10E CF34-10E CFM56-5B CFM56-7B V2500-A5
Range 2,450Nm 2,300Nm 3,672Nm 4,400Nm
Take o� Distance* 1,720m 2,150m 2,800m 2,050m
Max Pax Capacity 114 124 156 149
*Take o� distance applicable for MTOW Source: Airbus, Embraer & Boeing
2.3 EnginesAll A220 and E2 models are powered by derivatives of the Pratt & Whitney PW1000G series geared turbofan (GTF) engine.
The architecture of the new engine, which also powers larger new generation A320neo family aircraft, increases the diameter of the fan in relation to the engine core compared to previous generation CF34 or CFM56 power plants. This increases propulsive efficiency and thereby reduces fuel burn for a similar level of thrust. Technologically, a greater fan diameter at the same rotation speed means that the outer blade tips would have a higher tangential velocity and would turn at supersonic speed beyond a certain radius. In order to increase the fan blade length, PW has adopted similar technology to turboprop engines by introducing a reduction gear box to slow the rotation speed of the engine fan as shown in Figure 6 below.
However, the increased engine diameter not only increases its weight, but also requires a larger and therefore heavier landing gear to generate sufficient ground clearance in addition to a strengthened and thus heavier wing structure. Consequently, in comparison to the only like-for-like similar aircraft, the E190, the E2 variant is almost five tonnes heavier than its predecessor (see Figure 5 above).

12 | Crossover Jets Market Report
2.4 RangeIn a standard North American style configuration (97 seats) the A220-100 has a range of nearly 3,500nm in a typical two class configuration as shown in Figure 7 below, whereas in single class at 125 seats the range reduces substantially. In all cases, the range exceeds that of the E190-E2 shown in Figure 8.
In the vast majority of applications, with the exception of North American coast to coast services, where the E190-E2 can still operate with a small margin, the extra range of the A220-100 would not be required. An exception might include, for example, a London City to New York service in an all business class layout with around 50-60 seats, which an E190-E2 could not complete.
In the case of the Embraer E2, the range of both models is extended by 300-400Nm compared to the E1 generation.
In comparison to competing current generation narrowbodies, neither A220 quite matches the range of the A319 and is significantly less than the B737-700.
Figure 6: PW1000G Architecture
Source: Researchgate
Conventional TurbofanFan speed constrainedby low pressure spool
Low compressor and low turbinespeed constrained by fan
Ultra-e�cient, light-weight, low-speed fan
Low compressor and lowturbine speed optimised
Geared Turbofan Engine
Figure 7: A220 Range Figure 8: E2 Range
Source: Airbus Source: Embraer
ParisAbu Dhabi
Asmara
Dakar
Douala
AstanaQuebec
Paris
Reykjavik
Abidjan
Riyadh
Moscow
A220-100: 3,450nm A220-300: 3,400nm E190-E2: 2,850nm E195-E2: 2,600nm
Crossover Jets Market Report | 13
2.5 PerformanceThe ability to operate from restricted airports with short runways is often a key attribute of regional aircraft. Typically, this favours turboprops over jets, but where turboprops are not optimal, the strong runway performance of the smaller Crossover Jets will find some applications, notably at airports such as London City or Florence. In this context, Embraer has maintained or marginally improved upon the short take-off and landing capability of the E2 as shown in Figure 6 above. (Note that for consistency between aircraft types the take-off distances shown in Figure 6 apply to MTOW. Shorter distances are applicable at lower take-off weights when for example shorter trips are to be performed with less fuel uploaded.) All the Embraer aircraft have marginally better short-field performance characteristics compared to the A220 models. However, the A220-100 is London City certified and is operated there by SWISS.
Note that to date, with some exceptions (e.g. Northern European leisure flights to a few of the Greek islands), the need for short field performance historically, has primarily been for small capacity regional aircraft rather than narrowbody sized units, so this capability is not likely to generate a significant benefit for Embraer outside certain limited niches.
2.6 Economic ComparisonThe elements of operating costs, excluding the aircraft capital portion, are often referred to as cash operating costs (COC). The elements that are driven by the aircraft itself are briefly reviewed below. While crew costs are a major COC component the cockpit crew costs are assumed to be the same for all aircraft. In practice these may however differ significantly between regional and mainline operators and will benefit the type accepted in the regional operation. While navigation and landing charges are included in the COCs these are not separately reviewed as these are largely driven by aircraft weight in many parts of the world.
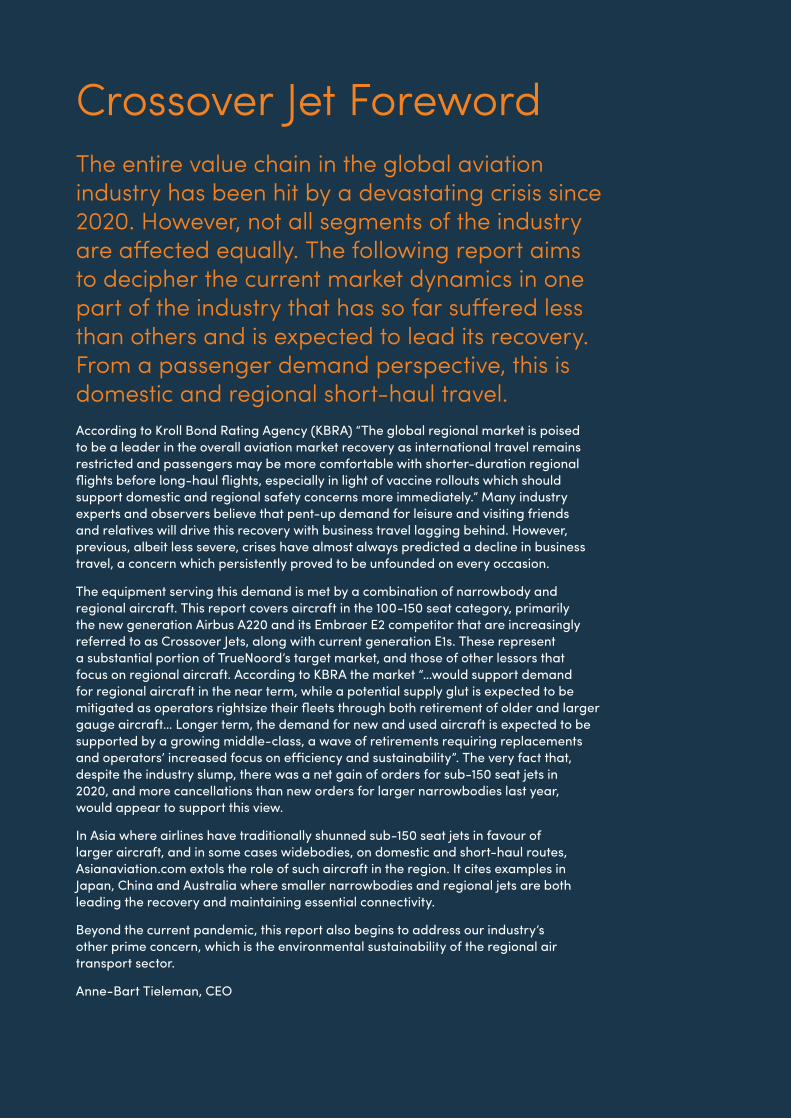
2.6.1 Fuel Burn
The relative fuel burn improvement of the newest generation of A220 and E2 aircraft, compared to current generation E1 aircraft of a similar or slightly smaller passenger capacity, are shown in Figure 9 below along with selected ubiquitous other narrowbody types. The trip fuel benefit of the E195-E2 versus the E195-E1 is about 16% and as the aircraft also has more seats than its predecessor the per seat benefit exceeds 25%. Its relationship with the A220-300 as a larger and heavier aircraft is that it performs less well on a trip basis but similarly on a per seat level (8 extra seats in a typical single class configuration). As the maximum seat capacity of the A220-300 is now 160 seats (although there have been no orders for this variant) versus 146 seats in the E195-E2 a maximum difference of 14 seats would marginally tilt the balance in favour of the A220-300 on a per seat basis.
15%
10%
5%
0%
-5%
-10%
-15%
-20%
-25%
-30%
-35%
Fuel
per
sea
t
Fuel per trip
-30% -20% -10% 0% 10% 20%
E195-E2 (138)
E190-E2 (102)
E195 (118) A319 (134)
737-700 (140)
A320 (163)A319neo (134)
A220-100 (120)
737 MAX (140)
A220-300 (145)
A320neo (163)
E190 (102)
30%
Source: TrueNoord Intelligence
Figure 9: Block Fuel Relative to E195-E1 (500Nm @ US$0.79kg fuel)

14 | Crossover Jets Market Report
The fuel burn benefit of new generation aircraft is the principal gain of these types over current generation aircraft. This benefit is further enhanced since lower fuel burn not only contributes to lower operating costs, but also translates into lower CO2 emissions.
Furthermore, while the current in-service generation of E1 aircraft shown have a greater fuel burn per seat than the popular narrowbody types, the new Crossover Jets compare similarly or slightly more favourably to the newest 737 MAX or A320neo.
In order to maintain consistency with previous reports the fuel price has been maintained at US$0.79/kg although current costs are below this level. If fuel prices remain as low as current prices, this benefit as a proportion of operating costs is significantly eroded.
2.6.2 Maintenance/Flight Hours/Flight Cycles
As the A220 and Embraer E2 aircraft remain relatively new to market, there is little real maintenance experience on either type. Therefore, OEM data, which has been cross checked with third party sources, has been used. As a consequence, the scheduled tasks and hard time intervals are reasonably accurate, but the associated costs are estimates. (Note that since scheduled engine shop visits and LLP replacements should not occur for some years, the actual prices are likely to be significantly greater.) The principal scheduled maintenance tasks, intervals and estimated costs are as outlined in Figure 10 as follows:
Figure 10: Maintenance Comparison A220-100/300 & Embraer E190/195-E2
A220-100/300
Airframe Base Maintenance
E190/195-E2
Base maintenance is divided into a series of Flight Hour (FH) limited checks and calendar time limited checks. In general, operators try to limit the number of heavy base maintenance visits to minimise both down-time and the opening of panels. Ideally, the FH and calendar interval of base checks is determined so that both would coincide. Assuming an annual average utilisation of 2,500-3,000 FH, this usually ensures optimal alignment. In the event that utilisation is lower, calendar checks would be needed earlier so that the full potential of FH life cannot be used. Conversely, if utilisation is higher then some calendar time may not be used in order to achieve check alignment.
The airframe maintenance heavy base check interval (C-check equivalent) is currently 8,500FH.
The second base check at around 17,000FH is designed to coincide with the calendar based 6 year corrosion prevention & control programme (CPCP) check, assuming a utilisation of around 3,000FH/year. The fourth base check coincides with the 12 year check. (There are no calendar items at the third base check.)
TrueNoord estimates the average cost of a base check to be approximately US$20 per FH. This is an estimate and may vary according to findings. Man hour estimates vary between 450 and 750 hours. The man hours and costs are expected to be similar across both models with the -300 cost expected to be slightly greater.
From the second base check, the 6 year and subsequent CPCP tasks would also normally be performed. This is expected to cost in the region of US$9,800/mth.
At the fourth base check at around 34,000FH, the 12 year tasks would be performed at costs in addition to those of the other base checks.
In addition there is a 30,000FC structural inspection, which depending on the FH:FC ratio might align with the following (fifth) base check.
The airframe maintenance heavy check (C-check equivalent) is currently 10,000FH or 7,500FC. This represents an escalation from 7,500FH on the E1 aircraft although escalation on the E1 is pending. The base check intervals would, depending on utilisation & FH:FC ratio, occur at 3-4 year intervals on average. (Note: assuming, as is likely, that the average ratio exceeds 1.3:1 the FH limit would arrive first.)
The second base check at 20,000FH has additional tasks compared to the first base check. This check would then also coincide with the first major 8 year calendar check at which time many CPCP items need to be performed including the removal of the aircraft interiors. The next sequential major calendar check occurs at 16 years at about the same time as the fourth base check.
The mature base check cost is estimated to cost in the region of US$43.5 per FH. This may vary according to findings. Costs are expected to be similar across both models.
The calendar based checks at the second base check are expected to cost in the region of US$4,100/mth and about 50% more at the time of the fourth base check (16 years) which also includes the largest base check workscope.
In addition there are 20,000FC and 40,000FC structural checks.

Crossover Jets Market Report | 15
APU
Like the engines, the APU is on-condition with no hard time limits. An overhaul interval of about 10,000 APU hrs (AH) is expected. The APU contains LLPs with a limit of 30,000 APU cycles. The expected overhaul cost is in the region of US$32 per APU hour excluding APU LLPs.
The on-condition APU is expected to require a performance restoration at about 9,500 APU hrs (AH). It also contains LLPs with a limit of 30,000 APU cycles. The expected overhaul cost is in the region of US$32 per APU hour excluding APU LLPs.
Engine Life Limited Parts (LLPs)
LLP costs are around US$120 per engine FC excluding an outer di�user case (a static LLP).
Once mature, all the LLPs are planned to have a 25,000FC limit. However, since the engine is new and not mature many LLPs currently have much lower limits. Today, there are still some significant LLPs with limits less than half the target life. By the time scheduled LLP replacements are needed in practice, TrueNoord expects that target life will have been reached. In the event that certain LLPs have not reached their 25,000FC limits, earlier shop vists would be needed and this would increase costs substantially even if the list prices for a�ected LLPs are proportionally reduced.
Engine Performance Restoration (EPR)
While engines are maintained on-condition, the LLPs have a target life of 25,000FC at which time a shop visit for their replacement is needed. An EPR would also be performed at this point.
This first run EPR would cost in the region of US$225 per engine FH. Each subsequent shop visit (SV) would be expected to exceed the cost of the previous SV.
While engines are maintained on-condition, the LLPs have a target life of 25,000FC at which time a shop visit for their replacement is needed. An EPR would also be performed at this point.
EPR intervals should be marginally longer than on the A220 since it is a lighter aircraft. Costs are expected to be similar or slightly lower per event. If on-wing time is longer, then Maintenance Rates per engine FH will be lower.
Landing Gear
Overhaul limits are 25,000FC or 12 years, whichever occurs first. The expected overhaul cost is in the region of US$19 per FC.
Overhaul limits are 22,000FC or 12 years whichever occurs first. The expected overhaul cost is in the region of US$18 per FC.
To date, there is no scheduled maintenance experience for the GTF engine. However, it is expected that an on-condition EPR would be needed at about 15,000FC (20,000FH) in a
relatively benign environment and earlier in a hostile climate.
Comments on MaintenanceThe above maintenance costs and intervals are based on fixed intervals except for engines, which are maintained on-condition. The actual maintenance costs will vary considerably according to how the aircraft are operated and the environments in which they fly.
With regard to engines in particular, there is considerable disparity between benign and inhospitable climates. Hot and high operating conditions will cause more stress on engines and reduce the intervals between EPRs. Similarly, flight deck crew handling, high humidity, salty air, sandy/dusty airports or areas with high pollution levels also impact engine performance. The cost estimates above assume a relatively benign European operating environment.
The estimated costs in Figure 10 above are based upon prices applicable for events in 2019/20. Since no base checks for new aircraft would arise for about three years, annual cost escalation would need to be included.

16 | Crossover Jets Market Report
2.7 Economic Comparison PointsDrivers of Economic Efficiency in New Generation Crossover Jets
Section 2.2 describes the gains in propulsive efficiency related to the GTF engines, but this is not the only driver of improved economic performance of both the A220 and E2 aircraft. Unlike their A320neo and 737 MAX narrowbody counterparts, the A220 is a completely new design and the E2 is a new design in most key areas apart from the fuselage itself.
Both families have new wing designs, but exhibit a difference of philosophy. The A220’s new wing design incorporates winglets from the outset, while the E2 adopts a raked wing architecture that was not used for the E1 and is similar to the Boeing 787. This improves fuel efficiency by 4-6% in both cases.
Other incremental improvements in both aircraft relate to a combination of aerodynamic and weight saving measures. Less weight always translates into lower fuel burn. For example, this includes greater use of composites although neither aircraft has a composite airframe like the 787. The use of lighter materials in the cabin of both families also contributes to a small efficiency gain. In isolation any weight saving measure produces little benefit, but when cumulated they become significant. On an overall basis, the E2 is some six tonnes lighter than the A220. Furthermore, the E2 has a narrower fuselage which, while this brings some disadvantages, makes it slightly more aerodynamically efficient. Figure 11 below illustrates the operating empty weight of the A220 and E2 compared to their 737 NG and A320ceo counterparts.
Economic Comparison
Figure 12 below compares the principal operating costs per month (assuming around 200 sectors/mth) of the highlighted A220s and E2 aircraft with each other, and current generation large regional jets and small narrowbodies. The costs assume a European environment with associated weight related charges so that the new generation aircraft incur increased navigation charges compared to the lighter E190/E195s. Maintenance charges are similar except for the older generation A319s and 737-700s.
The analysis of differences in the operating costs that do not relate to specific aircraft types (cockpit crew scheduling and costs, airport handling charges, line maintenance) have been cursory in this study. However, as evident from the past, the operation of large regional jet aircraft in the regional arm of a network operator can result in substantial organisation related savings particularly in relation to crew costs. This would then show a reduction compared to the narrowbodies in Figure 12 and could therefore tilt the balance. Whilst in the U.S. scope clauses will render such a transfer unrealistic, in Europe, the current generation of E-Jets are already in regional airline service. With this pedigree, the E2s may be more likely to enter regional airline service than the A220, which could translate into a future advantage for the type.
Source: Avitas
850
800
750
700
650
600
550
500
OEW
per
sea
t (Lb
s)
50 60 70 80 90 100 110
Figure 11: Comparison of Weight per Seat
Operating Empty Weight (OEW) (000s Lbs)
More E�cient
E190-E2 (97)
A318 (107)
A319 (124)
A320 (150)
A321 (185)
737-900ER (180)737-800 (162)
A220-300 (130)
E195-E2 (120)
A220-100(110)
737-600(110)
737-700(126)
neo and MAXhave higher
OEW

Crossover Jets Market Report | 17
The cash operating costs exclude the impact of the aircraft rental or financing costs. As shown in Figure 13 below, where aircraft costs are added on the basis of current market values and operating lease rentals (see Section 6.4), the impact of relatively low financing costs exacerbated by COVID-19 induced lower values and lease rates, mean that there is now a large differential between new and used aircraft. This means that the lower aircraft cost negates or even exceeds the improved new technology benefits of the A220 and Embraer E2 aircraft. Therefore, the direct operating costs can end up greater than current or older generation aircraft. Irrespective of any short-term inability to incur capital expenditure, this currently creates little economic incentive for airlines to invest in the newest technology outside the confines of environmental imperatives.
15%
10%
5%
0%
-5%
-10%
-15%
-20%
CO
C p
er s
eat
COC per trip
-10% -5% 0% 5% 15%10%
E195-E2 (138)
E190-E2 (102)
E195 (118)
737-700 (140)
A320 (163)
A319neo (134)A220-100 (120)
737 MAX (140)
A220-300 (145) A320neo (163)
E190 (102)
30%25%20%
Source: TrueNoord Intelligence
Figure 12: Relative Cash Operating Costs in US$/mth (500Nm at US$0.79/kg fuel)
20%
10%
15%
5%
0%
-5%
-10%
DO
C p
er s
eat
DOC per trip
-10% -5% 0% 5% 15%10%
E195-E2 (138)
E190-E2 (102)
E195 (118)
737-700 (140) A320 (163)
A319neo (134)A220-100 (120)
737 MAX (140)
A220-300 (145) A320neo (163)
E190 (102)
35%25% 25%20%
Source: TrueNoord Intelligence
Figure 13: Relative Direct Operating Costs/mth in US$ (500Nm at US$0.79/kg fuel)
18 | Crossover Jets Market Report
Figure 14: CO2 Emissions Per 500Nm Flight in Tonnes & Per Seat in kg
Source: TrueNoord Intelligence & IATA
E190 E190-E2 E195 E195-E2 A319 A319neo A320 A320neo A220-100 A220-300
10
9
8
7
6
5
4
11
80
70
60
50
40
30
20
10
0
90
Tonn
es C
O2 /
Trip kg C
O2/Seat
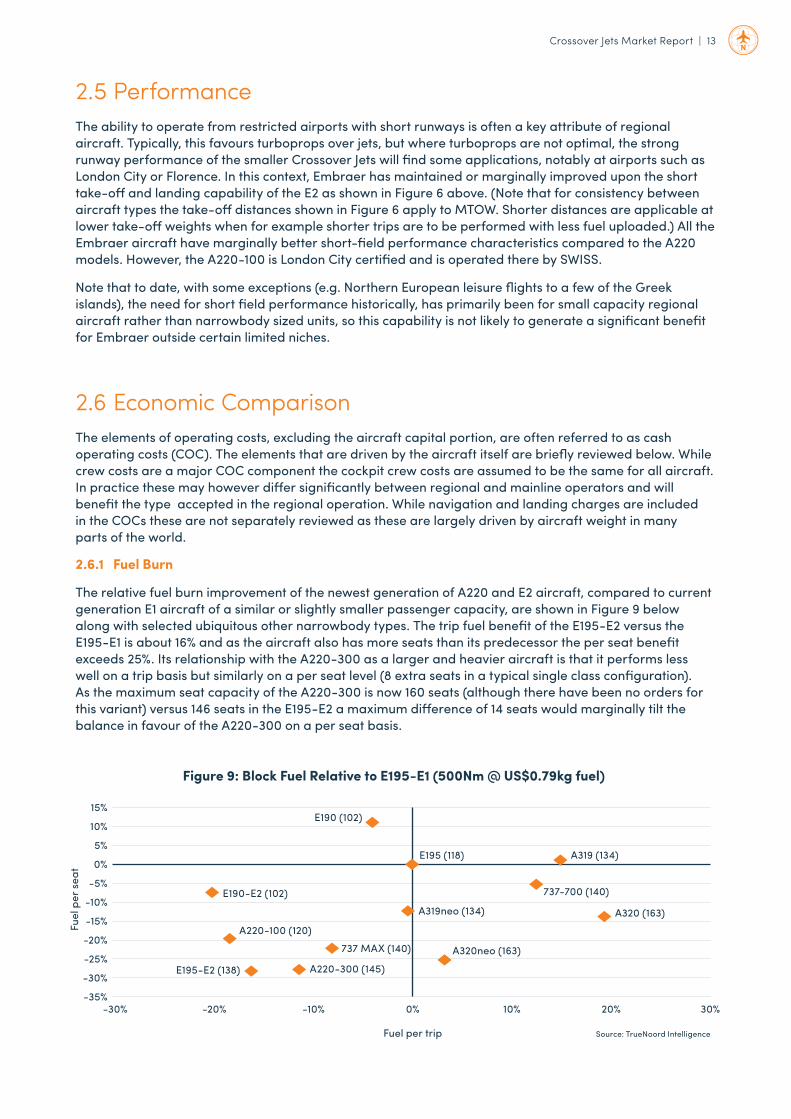
2.8 EmissionsPrior to the onset of the current pandemic, aircraft emissions had become a major industry concern and this is projected to return to the forefront in future. Since any reduction in fuel burn automatically leads to a reduction in emissions, this has become a major driver in the ongoing demand to develop more efficient aircraft.
As the principal concern relates to CO2 emissions, Figure 14 below shows carbon emissions for a selection of new and current generation regional jets and narrowbody aircraft. In the case of the A320, currently the world’s most widely deployed commercial aircraft, CO2 emissions in the new A320neo have reduced by over 10% compared to its predecessor on both a trip and per seat basis. This has largely been achieved with the adoption of the GTF and CFM LEAP engines.
In the case of the new generation Crossover Jets, the gain has been similar or greater. For example, the gain for the E195-E2 is closer to 15% over the previous E1 although part of this has been achieved by an incremental increase in capacity. (The E190 versus E190-E2 is a like-for-like comparison.)
Furthermore, the historical gap in fuel efficiency between narrowbodies and smaller capacity regional jets has been eroded in that CO2 emissions per seat of the E195-E2 and the A220-300 are similar to those of the A320neo.

Crossover Jets Market Report | 19
Measurement Difficulties
Note that the above measurements are difficult to compare on an objective basis. There are several ongoing industry initiatives to develop objective fuel burn and CO2 measurements which include such items as energy efficiency ratings similar to labels typically found on white goods, but to date no agreement has been reached for many of the following reasons:
1. The above comparison ignores the constraint that road travel is almost never direct and that therefore the distance for the same journey by road is greater than an air distance comparison.
2. Air distance measurements are also not accurate as many flight profiles involve indirect routings due primarily to poorly co-ordinated cross border air traffic management. This is a legacy political and governmental issue that remains to be solved. For example, in Europe the Single European Skies Initiative (SESAR) has been ongoing for some 20 years without agreement by EU member states.
3. Neither the air distance nor the road travel CO2 accounts for congestion. Road traffic congestion and air traffic holding patterns in major conurbations are features of both transport modes.
4. Published fuel and CO2 data for cars is based upon ideal driving, which almost never accounts for real conditions or the manner in which the car is driven. Furthermore, in comparing a long 500Nm journey, such travel, if by car, would typically be with an above average sized car that would consume more fuel and emit more CO2.
5. OEM data for aircraft fuel consumption also tends to assume optimal conditions for the relevant aircraft. Real flying conditions are affected by weather (wind speed, inclement weather avoidance), different individual airline operating procedures (e.g. fuel load policies and crew fuel load discretion beyond legal reserves) and payload carried. Distortions can also arise where fuel is tankered for a subsequent journey due either to there being no refuelling facilities at a destination or variations in the cost of fuel. TrueNoord has to the best of its ability accounted for average real flying conditions by using airline and third party independent sources, but the data is not perfect.
6. CO2 emissions do not provide a complete picture of harmful green house gas. Aircraft do emit other harmful gases, notably nitrous oxide, but other modes of transport also emit other toxic gases. The above comparison accounts for none of these effects.
Note on Aircraft CO2 Emissions compared to travel by car.
The ongoing debate about harmful aviation related emissions often views air transport in isolation compared to other modes of transport. This risks a consumer or policy reaction that may encourage substitution of air travel by other modes of transport which may not necessarily be more emissions friendly. While a comprehensive analysis of air travel compared to other modes is outside the scope of this report, the following example describes a comparison with an average car. The reason for selecting a car as an alternative mode is that in the short-haul regional segment of interest to TrueNoord, a car journey is most often the only alternative.
An average petrol car emits approximately 150g of CO2/km (according to which.co.uk, a leading UK based publication that reports on consumer issues and researches and reviews product testing results). This equates to 240g/mile or 276g/Nm. If an average car were to travel the same 500Nm journey as any of the aircraft referenced above, the CO2 output would be 138.12kg for the equivalent trip.
In order to generate a reasonable comparison the CO2 per seat on any of the above mentioned aircraft in Fig 14 should be adjusted to reflect a realistic load factor. If an average load factor of 75% is assumed, CO2 emissions per passenger on an A220-300 or an A320neo would be under 75kg per passenger.
According to Statista.com, the average number of passengers per car journey is 1.6, which would mean that the equivalent car journey would generate 86kg CO2 per passenger on the same journey. There would need to be an average of closer to two passengers per average car journey to achieve the same CO2 emissions per passenger as the A220-300 or A320neo.
This would suggest that the commonest form of alternative ground transportation is not necessarily more emissions friendly than air travel.

20 | Crossover Jets Market Report
3 Market ReviewWhile the following market review maintains the same structure as previous aircraft type reports, this version has been prepared in the context of the COVID-19 pandemic which necessitates a different emphasis within certain sub-sections and also addresses the fact that it is not necessarily possible to draw similar conclusions from the empirical data shown.
3.1 Numbers in Service UpdateSince both the A220 and the E2 series are new to the market the number of aircraft is still small. So far only the A220-300 has an installed operator base that exceeds 100 units with all others at significantly lower levels as shown in Figure 15.
As the aircraft are both highly efficient new generation aircraft that also provide the smaller capacity needed in the current low demand environment compared to mainline narrowbodies, the numbers of aircraft in COVID-19 induced short-term storage are low, although a small number of A220s have been delivered to Russian lessor GTLK and have gone straight to storage as no operator has been secured. Furthermore, A220-300 and E195-E2 deliveries have been delayed due to the pandemic for carriers including Azul and to a lesser extent Air Baltic. However, for 2020 the impact has been relatively small.
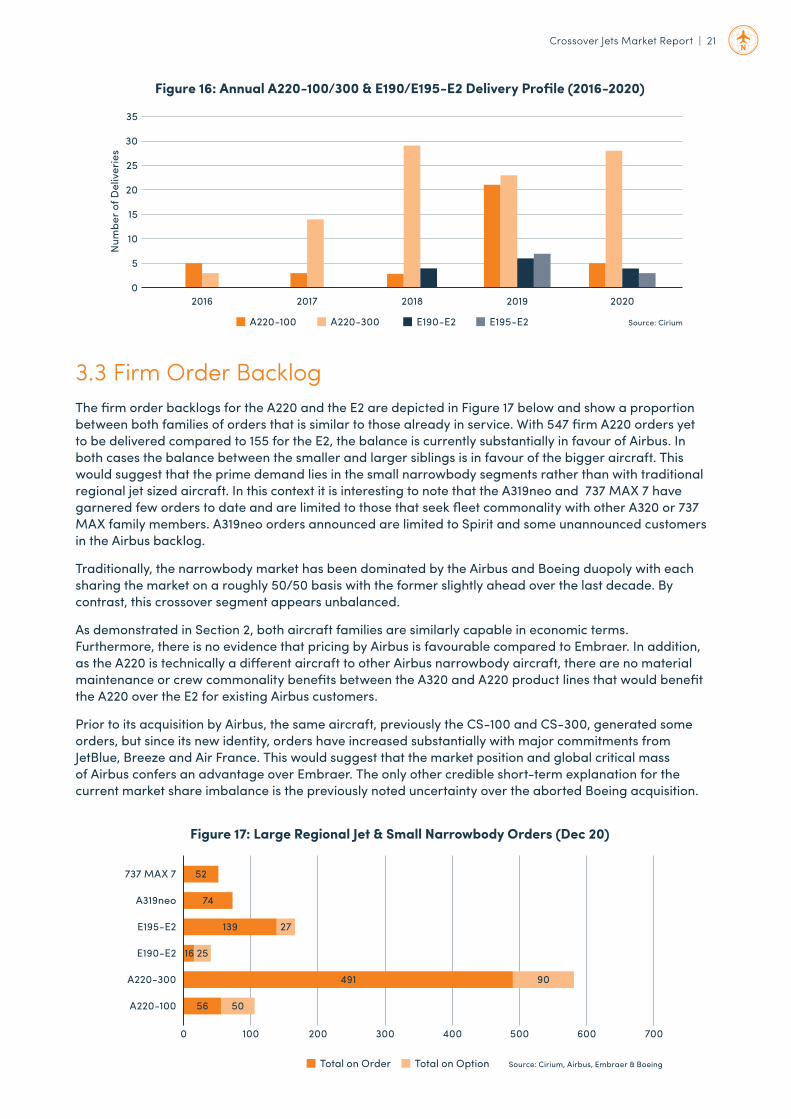
3.2 Delivery ProfileThe delivery profile for both the A220 and the E2 has been limited since first deliveries in 2016/17 (see Figure 16). Until 2020 this reflected production related issues and integration with Airbus for the A220 along with a shortage of GTF engines from PW due to early reliability problems, which diverted many new engines onto existing aircraft.
In the case of the E2, there has been a slow order book from operators which was partly driven by the uncertainty over the drawn out and ultimately aborted merger with Boeing. It was also driven by the onset of the current pandemic during which very few aircraft orders have been placed for any aircraft type.
Since the onset of COVID-19, there have been a number of delivery deferrals for both families, which led to lower than scheduled deliveries in 2020.
Figure 15: A220-100/300 & Competing E190/195-E2 Population (Dec 2020)
Source: CiriumTotal in Service Total in Storage
A220-100 A220-300 E190-E2 E195-E2
100
80
60
40
20
0
120
Crossover Jets Market Report | 21
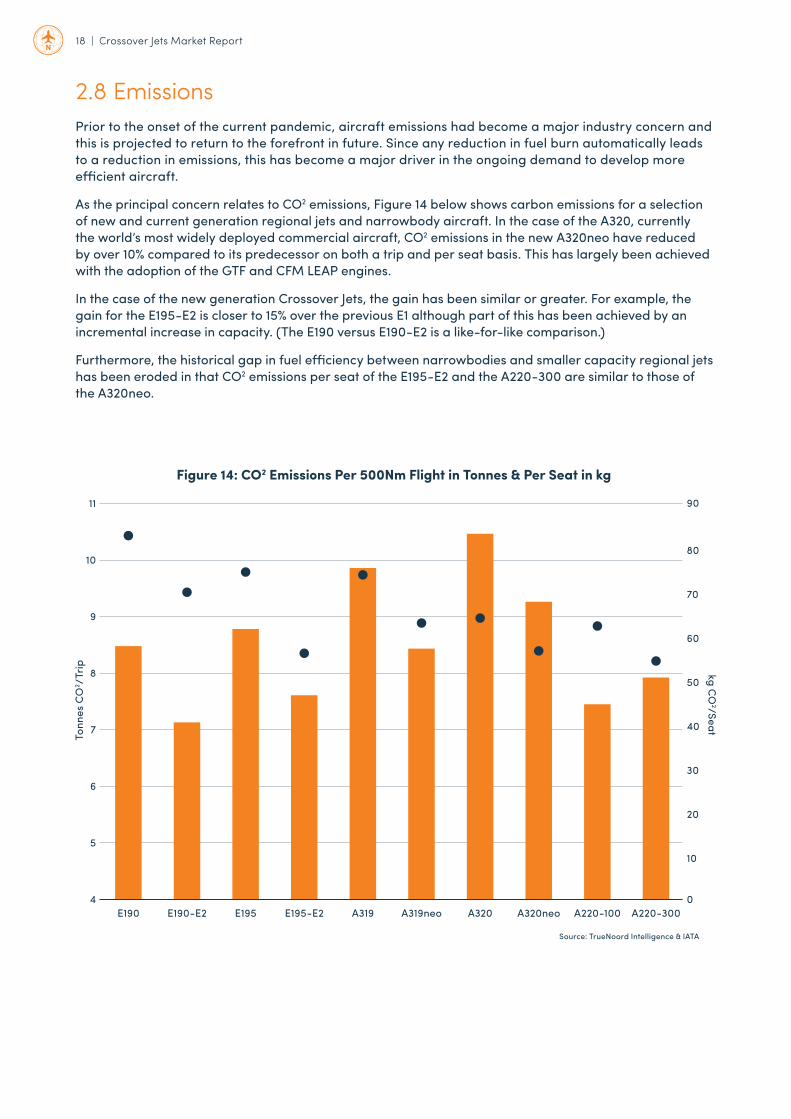
3.3 Firm Order BacklogThe firm order backlogs for the A220 and the E2 are depicted in Figure 17 below and show a proportion between both families of orders that is similar to those already in service. With 547 firm A220 orders yet to be delivered compared to 155 for the E2, the balance is currently substantially in favour of Airbus. In both cases the balance between the smaller and larger siblings is in favour of the bigger aircraft. This would suggest that the prime demand lies in the small narrowbody segments rather than with traditional regional jet sized aircraft. In this context it is interesting to note that the A319neo and 737 MAX 7 have garnered few orders to date and are limited to those that seek fleet commonality with other A320 or 737 MAX family members. A319neo orders announced are limited to Spirit and some unannounced customers in the Airbus backlog.
Traditionally, the narrowbody market has been dominated by the Airbus and Boeing duopoly with each sharing the market on a roughly 50/50 basis with the former slightly ahead over the last decade. By contrast, this crossover segment appears unbalanced.
As demonstrated in Section 2, both aircraft families are similarly capable in economic terms. Furthermore, there is no evidence that pricing by Airbus is favourable compared to Embraer. In addition, as the A220 is technically a different aircraft to other Airbus narrowbody aircraft, there are no material maintenance or crew commonality benefits between the A320 and A220 product lines that would benefit the A220 over the E2 for existing Airbus customers.
Prior to its acquisition by Airbus, the same aircraft, previously the CS-100 and CS-300, generated some orders, but since its new identity, orders have increased substantially with major commitments from JetBlue, Breeze and Air France. This would suggest that the market position and global critical mass of Airbus confers an advantage over Embraer. The only other credible short-term explanation for the current market share imbalance is the previously noted uncertainty over the aborted Boeing acquisition.
Figure 16: Annual A220-100/300 & E190/E195-E2 Delivery Profile (2016-2020)
Source: CiriumA220-100
2020
A220-300 E190-E2 E195-E2
2019201820172016
25
20
15
10
5
0
35
30
Num
ber o
f Del
iver
ies
Total on Order Total on Option
A220-300
A220-100
737 MAX 7
A319neo
E195-E2
E190-E2
Figure 17: Large Regional Jet & Small Narrowbody Orders (Dec 20)
Source: Cirium, Airbus, Embraer & Boeing
0 100 200 300 400 500 600 700
52
74
139 27
2516
491 90
56 50

22 | Crossover Jets Market Report
Impact of COVID-19 on Order Backlog
The COVID-19 pandemic has had some impact on the order backlog for the subject A220 and E2 product lines. Both manufacturers have seen a number of delivery deferrals due in 2020 and 2021 to late 2021 and beyond, but although the E2 programme suffered some order cancellations primarily in Asia (Air Costa, Kalstar, Tianjin) before the current pandemic, so far the smaller Embraer order book has not suffered any COVID-19 induced cancellations*. However, the largest E195-E2 customer Azul has deferred a number of near term deliveries.
By contrast the larger Airbus order book has seen some cancellations. Gulf Air has cancelled its order for 10 x A220-300 and Air Canada has cancelled 12 of its orders. In addition, Macquarie Air Finance has now cancelled two successive tranches of three deliveries. This means a total of 28 deliveries due in 2020 were cancelled.
* The only cancellations suffered by Embraer during COVID-19 relate to E175-E2s as a consequence of the bankruptcy of Trans States in the USA.
3.4 Future Crossover Jet ForecastIn previous aircraft type market reports, the provision of future market fleet forecasts has, beyond a cursory review, been considered out of scope. However, given the uncertainty of the COVID-19 induced economic effects on air transport, the projected future recovery and its timing has a significant impact on the penetration and prospects for this category of aircraft.
In addition, since the respective populations of these new generation aircraft are currently small due to their recent service entry, any analysis of the operator base and future liquidity of these types needs to account for the likely scale of the future fleet.
Projected Impact of COVID-19
Of the available 2020 revised forecasts, most are not comparable between 2019 and 2020. However, the Cirium Fleet Forecast (CFF) does show how its previous and current views compare as shown in Figure 18. As such Cirium does not expect new aircraft deliveries to return to pre-COVID-19 levels until 2026-2027. Cirium also projects that some 70% of deliveries will occur in the narrowbody segment with the sub-100 seat regional jet category remaining relatively stable compared to 2019. However, the Crossover Jet sub-150 segment is classified within the narrowbody segment.
3000
Num
ber o
f Del
iver
ies
2500
2000
1500
1000
500
0
2020 20
2120
2220
2320
2420
2520
2620
2720
2820
29
2019 CFF 2020 CFF
Figure 18: Cirium Fleet Forecast Comparison 2019 & 2020
Source: Cirium

Crossover Jets Market Report | 23
OEM Forecasts
To date all OEMs generally produce an annual aircraft demand forecast for a forward looking scenario of up to 20 years. Thus far only Boeing and Embraer have updated their 2019 forecasts.
Of the OEM forecasts, Boeing projects an optimistic view in its 2020 Commercial Market Outlook (CMO) with a long-term belief that the outlook for narrowbodies remains unchanged with over 32,000 deliveries over the coming 20 years. The only significant change is that a portion of these are moved into the 10-20 year horizon as opposed to the next 10 years. For regional jets, which Boeing defines as below 90 seat aircraft, the forecast projects a modest increase of some 200 units to 2,240. The subject aircraft fall into the narrowbody category and are dwarfed by 737 MAX and A320neo deliveries so that little useful data can be derived from the CMO for the sub-150 seat segment.
The Embraer Market Outlook (EMO) is slightly more conservative. The main change compared to the 2019 EMO is that future uncertainty means that its forecast horizon for 2020 only covers the next 10 years instead of 20. Embraer concedes that overall traffic growth over the period will be subdued, but that replacement demand will make up much of the new aircraft production in the sub-150 seat category. The EMO notes an incumbent sub-150 fleet in 2019 of 8,660 units which is forecast to grow by 1,280 units to 2029. During that time it believes that almost half the incumbent fleet will be replaced.
Figure 19 shows the geographical variation for its 10 year forecast. This suggests that in the mature markets there will be very modest growth of the fleet in Europe and a slight decline in North America and that most deliveries will be replacement aircraft. By contrast there will be a near doubling of the fleet in Latin America and even greater growth in the Asia Pacific region including China. In Asia, Embraer predicts most of the sub-150 seat growth will stem from the need to build connectivity to secondary airports, many of which are under construction (200 in China alone). In LATAM, Embraer believes the greater need will be to develop frequency between major and secondary cities many of which are currently only served once daily or less.
IBA A220 & E2 Forecast
In November 2020 TrueNoord commissioned IBA to prepare a forecast for all regional aircraft types and small narrowbodies including the A220 and E2 aircraft, but excluding sub-150 seat A320neo and 737 MAX types. IBA projects a 70/30 split between Airbus and Embraer for the subject aircraft shown in Figure 20. In comparison with this forecast for the subject types, both Cirium and IBA agree that 2027 and 2028 will be the peak delivery years. None of the OEM projections provide an annualised delivery forecast. Over the next decade IBA forecasts around 2,450 A220 and E2 deliveries, whereas Embraer forecasts some 4,400 sub-150 seat jet aircraft deliveries, which includes both smaller regional jets and smaller mainline Airbus and Boeing narrowbodies, as well as Chinese and Russian manufactured examples.
Source: Embraer
LATAM
Europe
Russia & CIS
0 500 1000 1500 2000 2500 3000 3500 4000
North America
Middle East
China & APAC
Africa
New Deliveries 2029 2019
Figure 19: Embraer Sub-150 Seat Forecast 2020-2029

24 | Crossover Jets Market Report
3.5 Crossover Jet Operator BaseNormally the absolute number of operators of any particular type is a vital determinant of its suitability as a leasing product. This is a prime driver of liquidity by showing the number of operators that could absorb incremental aircraft as secondary users. On its own the number of operators is not a sufficient indicator of liquidity. A strong operator base can be materially weakened if there is an excess concentration of aircraft with a small number of operators. This can reduce liquidity and poses a risk if any of the largest carriers go bankrupt or unexpectedly phase out the type, thereby creating a large pool of available aircraft.
At this stage of the programme, the above metrics cannot yet be adopted in isolation to Crossover Jets as too few aircraft have been delivered so that firm orders, and those forecast, also need to be taken into account.
3.5.1 A220 Operators in December 2020
Currently there are two A220-100 and six A220-300 operators (see Figure 21). Air Vanuatu was scheduled to take its first delivery before 2020 year end and Air France, Air Senegal, JetBlue and Breeze are all expected to accept initial aircraft in 2021.
350
400
300
250
200
150
100
50
02020
Num
ber o
f Del
iver
ies
2021 2022 2023 2024 2025
A220-100 A220-300 E190-E2 E195-E2
2026 2027 2028 2029 2030
Source: IBA
Figure 20: A220 & E2 Delivery Forecast
Figure 21: Number of A220 Operators in Dec 2020
Source: Airbus & Cirium

Crossover Jets Market Report | 25
3.5.2 E2 Operators in December 2020
Currently there are four E190-E2 and two E195-E2 operators (see Figure 22). During 2021, KLM Cityhopper and Belavia are scheduled to receive their first deliveries. Most of the deferred future Azul deliveries will begin in 2024.
3.5.3 Other Competitors & Potential Future Operator Base
Replacement Market
Depending on how the aircraft is configured, the A220’s capacity of 97-160 seats means it competes not only with the E2 but also with the existing larger aircraft types shown in Figure 23. This comprises in excess of 2,300 smaller Airbus and Boeing narrowbodies, over 700 existing generation Embraer (E190/E195) regional jets and some 275 other older generation aircraft. This represents a substantial portion of the long-term replacement market that the new Airbus and Embraer families can address. In addition, the A220-300 with 160 seats would also compete with some A320s and 737-800s although nobody has yet ordered the 160 seat version.
In the case of the current generation of large regional jets, the residual population of BAe RJ85/100 and F100s whose fleets have an average age exceeding 25 years, the A220-100 and E2 are obvious replacements. With no growth the replacement potential amounts to some 200 units. The existing population of E1 aircraft represents a greater opportunity and indeed Airbus is actively targeting those operators. In terms of operators as shown in Figure 24, the Airbus targets could exceed 60 airlines across both the E190 and E195 operator base for both A220 models.
At the larger capacity end of the seating spectrum, the A220-300 in particular represents a like-for-like replacement for many A319 and 737-700 aircraft and highlights a target audience of some 140 operators. The E195-E2 could address a portion of this market also. The average fleet age of both of these incumbent fleets is also greater than the average for the large regional jet fleet so that the replacement opportunity is nearer.
Figure 22: Number of E2 Operators in December 2020
Source: Embraer & Cirium
Figure 23: Other Similar Capacity Regional Jets& Narrowbodies in Service (December 2020)
Source: Cirium
E195-E1
E190-E1
CRJ1000
RJ85/100
F100
0 200 400 600 800 1,000 1,200 1,400
737-700
A319ceo

26 | Crossover Jets Market Report
Post COVID-19 Growth Potential
There is much, as yet inconclusive, debate about the future shape of air travel demand over the coming years. This includes a scenario where demand on any given mature network may never fully recover and that future growth will be driven by new and expanding markets in developing regions.
In economically mature markets, traffic may remain indefinitely suppressed due to environmental pressure from governments and consumers to reduce emissions. If such mature markets remain subdued for any significant period, airlines may be forced to adjust long-term capacity (see Section 5.2 for more detailed comments).
Accordingly, in the event that the current pandemic reduces the demand for high capacity narrowbodies, both the A220 and the E2 could also address a portion of the vast A320 and 737-800 replacement market.
However, the current pandemic and some pre-COVID-19 trends also hinder the market opportunity for the Crossover Jets:
• Most carriers have already curtailed or are planning to restrict capital expenditure on new aircraft over the coming years, which means that any new commitments will be hard to secure;
• The incumbent base of A320 and 737 families is huge and even if a proportion are ageing their ongoing crew and maintenance commonality advantages may outweigh the benefits of the newer technology Crossover Jets;
• While the cost of fuel remains relatively low by recent standards, the economic benefit of newer aircraft is more limited;
• The current generation of E1 aircraft targeted by both Airbus and Embraer itself has not yet reached an age where large scale replacement would occur; and
• The capital, leasing and maintenance costs of the current E1 fleet have reduced both before and since the pandemic so that the cash operating cost benefit of the new A220 and E2 is eroded (and often more than negated) by the low acquisition cost of the existing aircraft. So the relative Direct Operating Costs of the A220 or E2 often do not justify acquiring the types (see Section 2.5.3).
The above reasons mean that in the short-term, apart from curtailed capital expenditure budgets, the biggest competitor to the A220 and E2 in the large regional aircraft space is not the alternative OEM’s product, but the existing E1 fleet.
Figure 24: Number of Large Regional Jet & SmallNarrowbody operators (December 2020)
A220-300
A220-100
E195-E1
E190-E1
E195-E2
0 5 10 15 20 25 30 35 40 45 50 55 60 65 70 75 80
E190-E2
CRJ1000
737-700
A319neo
A319ceo
Source: Cirium

Crossover Jets Market Report | 27
3.6 Geographical Dispersion3.6.1 Historical Perspective
From a lessor perspective a wide geographical distribution is desirable since this not only underscores the versatility of large regional jets and small narrowbodies, but also assists market liquidity and placement opportunities in the secondary market. Also it ensures access to local crew training facilities, maintenance facilities, spare part stocks and trained staff. Often, if a type falls out of favour in one region this can affect several operators in the same area, so the ability to place used fleets in other regions is important. With its significant installed base of E1s and some commonality with the E2, the E-Jets may have an historical advantage.
3.6.2 Crossover Jet & Competitor Geographical Dispersion
Since the A220 and E2 programmes are still at an early stage, it is premature to judge the impact of geographical diversity on the global fleet. However, for such a small active fleet, the geographical diversity of the A220 fleet is strong with operators in all regions except Latin America (see Figure 25). The current backlog shows that the initial fleet growth will mainly be in Europe and North America with large delivery streams to Air France, JetBlue and Breeze.
The incumbent E2 fleet is even smaller, but is also reasonably well diversified although the programme has not yet secured a major North American customer. Since Embraer’s strong presence in North America is limited to scope clause compliant sub-76 seat regional jets, it may prove a bigger challenge to place such sub-150 seat aircraft with mainline North American carriers than for Airbus.
3.7 Operator QualityThe limited A220 operator base comprises strongly regarded national flag carriers including Delta, Swiss and Korean. As yet this does not include any significant low cost carriers although JetBlue and Breeze will soon join. Historically, when the aircraft was still wholly a Bombardier product, Air Asia had been strongly considering a commitment and more recently Southwest is rumoured to be seriously evaluating the type. Given that a seat density of up to 160 seats is now possible for the A220-300, it seems probable that some additional established LCC operators would commit to the type in future. Therefore, it is likely that the A220 will have a high credit quality operator base for the next decade and beyond.
So far the E2 also has a reasonably high quality albeit small operator base. To date, this also includes Azul, a substantial LCC, although many of its orders for the E195-E2 have been deferred. In Europe, KLM Cityhopper and Binter Canarias are both high quality carriers. In the short term, the prospects for quality operators of E190-E2s seem less clear. While the current operators are quality airlines, many are smaller carriers. In future, if airline networks fragment with more point to point connectivity, or as the incumbent population of E1 generation aircraft ages and becomes more pressured by environmental concerns, the Crossover Jet may well find a number of applications.
A220 in Service E2 in Service A220 on Order E2 on Order
350
300
250
200
150
100
50
0Europe
Num
ber o
f Airc
raft
North America APAC Africa LATAM
Source: Cirium & CH-Aviation
Figure 25: A220 & E2 Geographical Dispersion

28 | Crossover Jets Market Report
4 Crossover Jets Owned by Lessors
4.1 Comparative Lessor PenetrationThe number of aircraft as a proportion of the total fleet is a strong indicator of the maturity of any type among the leasing community. A deep level of lessor penetration suggests that the aircraft type is perceived as a strong asset class with good liquidity characteristics and high value retention. It is therefore not surprising to see the most popular narrow body aircraft with a penetration approaching 50% of all aircraft as shown in Figure 26 below. However, the subject Crossover Jet aircraft compete more closely with the A319 and 737-700 whose lessor penetration levels are closer to 30%.
In terms of the existing fleet, too few A220 and E2 aircraft have been delivered to determine the likely levels of lessor acceptance. For example, the apparently high level of E195-E2 lessor involvement represents the majority of very early deliveries to Azul so that this cannot be viewed as indicative of a long-term trend. By contrast, more A220s of both variants have been financed by lessors than E2s, but the proportion leased is far lower. Nevertheless with the increased appetite of mainstream narrow body lessors, it is expected that the proportion of leased aircraft will trend towards those of other larger single-aisle variants.
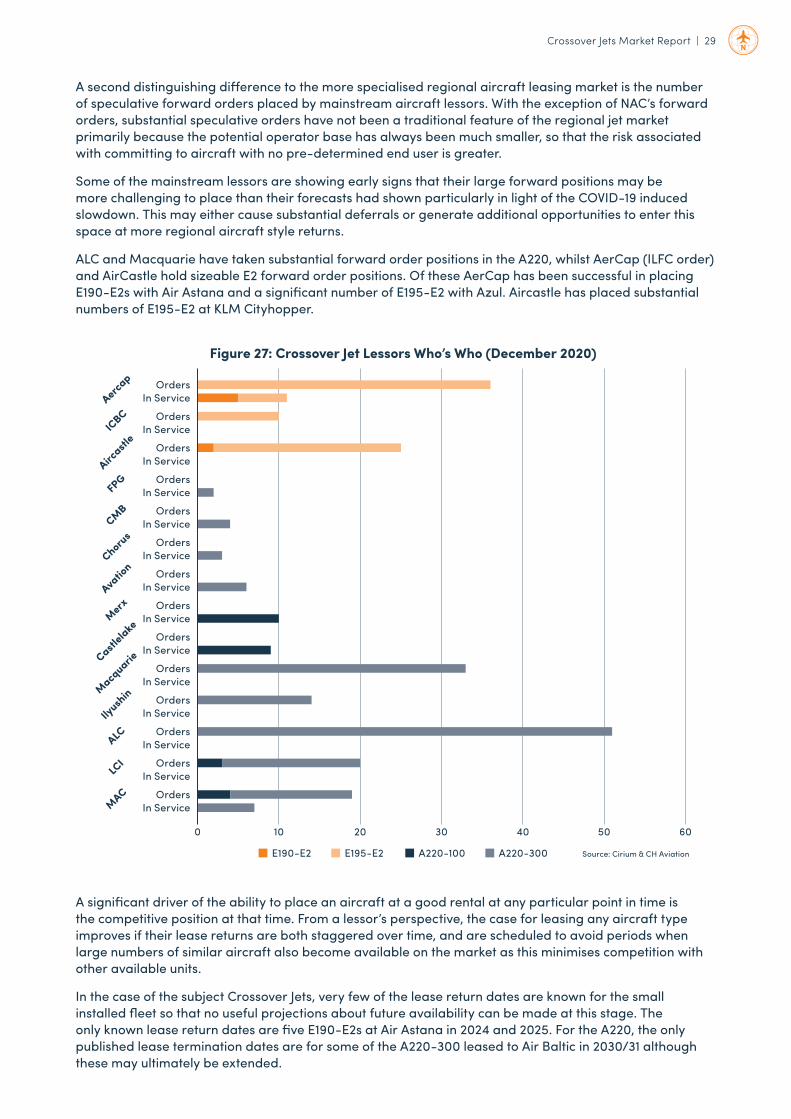
4.2 Leased Fleet ReviewA breakdown of the main lessors of Crossover Jets is shown in Figure 27. The critical feature of this breakdown is the dominance of mainstream narrowbody lessors. Only NAC and Chorus feature as lessors more traditionally involved in the regional aircraft space. Their commitments are also relatively smaller than those of the large lessors. ALC and Aercap stand out as having large positions for both A220-300 and E195-E2s.
This has implications for the more traditional regional aircraft lessors who may wish to build portfolios of these aircraft. First, many of the mainstream lessors not only have access to larger pools of capital and leverage, but they also often do so at lower cost. This means they can price their lease rate factors more competitively than many regional aircraft lessors. Secondly, traditional mainstream leasing has become so competitive in recent years as the number of participants has grown, resulting in lease rate factors that have reached a point where lessor returns have become unattractive to some for mainstream Airbus and Boeing narrowbodies. In turn, this has led some to be attracted to the higher returns achievable in large regional jets and small narrowbodies. For some, the subject aircraft therefore offer enhanced return potential.
Figure 26: Operating Lease Penetration Comparison by Aircraft Type (Dec 2020)
% and number leased Number of Lessors Source: Cirium & CH Aviation
A320ceo 737 NG A319ceo 737-700 E190-E2 E195-E2 E190-E1 E195-E1 A220-100 A220-300
10%
0%
60%
50%
40%
30%
20%
70%
80
70
60
50
40
30
20
10
0
90
100
265 210
8
10
182 79 18
2424
35
2 1
19
102 5
Crossover Jets Market Report | 29
A second distinguishing difference to the more specialised regional aircraft leasing market is the number of speculative forward orders placed by mainstream aircraft lessors. With the exception of NAC’s forward orders, substantial speculative orders have not been a traditional feature of the regional jet market primarily because the potential operator base has always been much smaller, so that the risk associated with committing to aircraft with no pre-determined end user is greater.
Some of the mainstream lessors are showing early signs that their large forward positions may be more challenging to place than their forecasts had shown particularly in light of the COVID-19 induced slowdown. This may either cause substantial deferrals or generate additional opportunities to enter this space at more regional aircraft style returns.
ALC and Macquarie have taken substantial forward order positions in the A220, whilst AerCap (ILFC order) and AirCastle hold sizeable E2 forward order positions. Of these AerCap has been successful in placing E190-E2s with Air Astana and a significant number of E195-E2 with Azul. Aircastle has placed substantial numbers of E195-E2 at KLM Cityhopper.
10 20 30 40 50 60
Figure 27: Crossover Jet Lessors Who’s Who (December 2020)
Source: Cirium & CH Aviation
Orders
0
In Service
E190-E2 E195-E2 A220-100 A220-300
Aercap
OrdersIn ServiceIC
BC
OrdersIn ServiceAirc
astle
OrdersIn ServiceFPG
OrdersIn ServiceCMB
OrdersIn ServiceChoru
s
OrdersIn ServiceAva
tion
OrdersIn ServiceMerx
OrdersIn Service
Castlelake
OrdersIn Service
Macquarie
OrdersIn ServiceIly
ushin
OrdersIn ServiceALC
OrdersIn ServiceLC
I
OrdersIn ServiceMAC
A significant driver of the ability to place an aircraft at a good rental at any particular point in time is the competitive position at that time. From a lessor’s perspective, the case for leasing any aircraft type improves if their lease returns are both staggered over time, and are scheduled to avoid periods when large numbers of similar aircraft also become available on the market as this minimises competition with other available units.
In the case of the subject Crossover Jets, very few of the lease return dates are known for the small installed fleet so that no useful projections about future availability can be made at this stage. The only known lease return dates are five E190-E2s at Air Astana in 2024 and 2025. For the A220, the only published lease termination dates are for some of the A220-300 leased to Air Baltic in 2030/31 although these may ultimately be extended.

30 | Crossover Jets Market Report
5 Market Availability & Demand
5.1 Demand & Supply DriversSince the A220 and E2 are new to the industry, no used-market of material significance has yet arisen in comparison to previous reports prepared for other aircraft types. Therefore, the historical used aircraft activity cannot be deployed as a meaningful guide to future activity. Furthermore, since entry into service with primary users is new or nearly new in all cases, no used aircraft activity is expected for a number of years, unless as a consequence of any airline bankruptcies, so that little supply of used examples should be expected over the coming years.
Consequently, supply for the future will primarily be a function of production rates at Airbus and Embraer. Since the A220 is manufactured at the former Bombardier facility at Meribel in Montreal and has been supplemented by additional assembly capacity in Mobile, Alabama for the US market, no short-term production constraints are expected. For Embraer, with the exception of the E175-E1, production of all other E1 generation aircraft is complete or nearly complete so that the production facility at San José dos Campos has more than sufficient assembly capacity for current and future orders.
From a demand perspective, requirements for the A220 and E2 will be driven by combination of replacement demand for older generation aircraft and market growth for aircraft in the 100-150 seat segment. The replacement market candidate aircraft are addressed in Section 3.5.3 Other Competitors and Future Operator Base (page 25) but the principal underlying drivers are addressed in 5.2 below.
5.2 New Normal DemandSince the onset of COVID-19 and the consequent collapse in short-term demand for air travel, airlines have naturally focused on survival. Beyond the immediate effects, air service providers are now seeking to revise and shape their medium to long-term fleet plans based on various post pandemic recovery scenarios. While the speed of this recovery is outside the scope of this report, there is a wide consensus that traffic demand will recover although it may take many years to reach pre-pandemic levels. This means that demand for aircraft in the size capacity of the A220 or the E2 will be driven by the following factors:
Short-term Demand Drivers
• While airlines await a return to service for the majority of their existing fleets, it is unlikely that operators will commit to capital expenditure on additional aircraft if they already operate the types or commit to new models that are not in their fleets. This would suggest that few if any new orders can be expected in the short term.
• There is broad consensus that short-haul and domestic travel in particular will recover much faster than international and long-haul markets. This means that the market for sub-150 seat aircraft should rebound more quickly and re-establish demand.
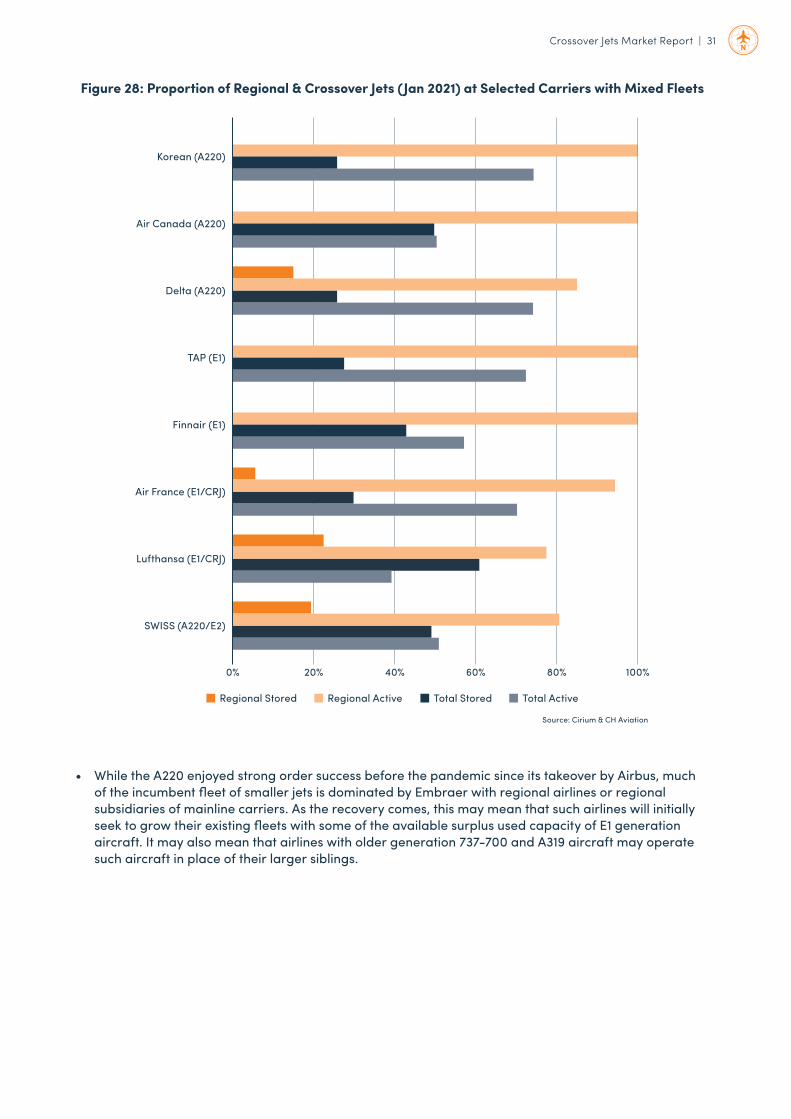
• In a static or slow demand environment where airlines cannot fill their pre-pandemic capacity, carriers are more likely to deploy lower capacity aircraft with lower trip costs. This favours the subject Crossover Jets and is often referred to as “rightsizing”. Recent data points show this trend in which many airlines that have mixed fleets and can choose different aircraft to operate services, are doing so in place of larger A320 or 737 aircraft. Figure 28 shows how the indicated aircraft are performing compared to their overall fleets in January 2021 with a selection of mainline carriers. This should support the market for RJs and Crossover Jets.
Crossover Jets Market Report | 31
• While the A220 enjoyed strong order success before the pandemic since its takeover by Airbus, much of the incumbent fleet of smaller jets is dominated by Embraer with regional airlines or regional subsidiaries of mainline carriers. As the recovery comes, this may mean that such airlines will initially seek to grow their existing fleets with some of the available surplus used capacity of E1 generation aircraft. It may also mean that airlines with older generation 737-700 and A319 aircraft may operate such aircraft in place of their larger siblings.
Figure 28: Proportion of Regional & Crossover Jets (Jan 2021) at Selected Carriers with Mixed Fleets
Source: Cirium & CH Aviation
Regional Stored Regional Active Total Stored Total Active
Korean (A220)
Air Canada (A220)
Delta (A220)
TAP (E1)
Finnair (E1)
0% 20% 40% 60% 80% 100%
Air France (E1/CRJ)
Lufthansa (E1/CRJ)
SWISS (A220/E2)
32 | Crossover Jets Market Report
5.3 Availability – Aircraft in StorageThere is no complete inventory of aircraft available for sale or lease at any point in time. However, stored aircraft data is often used as a proxy. The weakness of this proxy is that it includes aircraft that are in transition between lessees or sellers and buyers as well as those that may be temporarily stored, or parked for a variety of reasons. In the current pandemic substantial numbers of aircraft have been temporarily stored for extended periods, which renders any conclusions from storage close to meaningless since most are not available to the market. While, in theory, some carriers might be willing to dispose of some temporarily stored aircraft, the reality is such that very few sellers would accept the proceeds that could be realised in such a distressed market.
As the in-service and stored fleet of aircraft for the A220 and the E2 in particular remain small to date, a brief review of the low numbers that are or may be available in the secondary market is provided below. The comments also briefly address those aircraft speculatively ordered by lessors that could be available.
Long-term Demand Drivers
• Even if residual pandemic risk persists beyond the widespread uptake of vaccines, this is likely to impact the demand for air travel for several more years. At a macro level this would lead to a smaller airline industry, but smaller capacity efficient aircraft will form a greater proportion of airline fleets so that the impact on the subject Crossover Jet aircraft would be less than for other large aircraft.
• From a public health perspective, passengers may be more reluctant to transit through major hub airports, which could increase the demand for point to point services that avoid hubs. Therefore, despite an overall smaller industry, this could fuel the demand for smaller sub-150 seaters. It is too early to tell whether this is a discernible trend.
• Business travel is projected to recover more slowly than leisure and visiting friends and relatives traffic. If business travel reduces, (note: this has been projected in previous recessions and did not ultimately occur) this could depress demand on a longer term basis for regional airlines since an above average proportion of regional traffic is business related. However, if business traffic is reduced on traditional regional jet routes it is also reduced on denser city pairs. For those with mixed fleets, this means that traditional business routes that require frequency to attract high yield passengers could be operated with Crossover Jets instead of larger aircraft. This should moderate the impact on these aircraft of any decline in business traffic.
• The current pandemic in mature economies has propelled early indicators for a demographic shift away from large urban conurbations to more rural settings. Increased home working and improved digital communications mean that traditional office-based service industry staff can operate more remotely and only need to meet in person infrequently. While this would dampen the demand for business travel, it could also fuel it. If traditional office workers are able to work remotely on a permanent basis, which enables them to also live more rurally, a hitherto almost non-existent business travel market could open for short distance domestic and regional travel to smaller secondary airports that serve remote service industry workers. This would create demand for more connectivity with smaller regional and Crossover Jet aircraft.
• Environmental pressure at both a government regulatory level, and increasingly with consumers, means that airlines need to be seen to act to improve their greenhouse gas footprint. Crossover Jet aircraft offer a 12-15% fuel burn and equivalent emissions improvement compared to older regional jets and an even greater gain compared to A319 and 737-700s. With increased state involvement at many airlines linked to environmental targets, the subject aircraft represent the most modern technology available with which to reduce emissions.
At worst the above factors would serve to dampen any decline in demand for regional jets and smaller narrowbodies and may even increase demand. Many of the above factors are taken into account in the forecasts reviewed in section 3.4.
Crossover Jets Market Report | 33
A220 Stored Aircraft Available
There are no A220 aircraft advertised or publicly known to be available in the market. However, six A220-300s from the original order of 20 units placed by Ilyushin Finance and now novated to Russian lessor GTLK were delivered straight to storage. These aircraft destined for Red Wings have an unusual interior configuration.
In relation to the A220 backlog held by lessors, a portion may take longer to place than previously envisaged and some lessors have cancelled or deferred certain order positions. Macquarie, for example, has twice cancelled three delivery positions over the past year and LCI, which is increasingly refocusing on its core business of helicopter leasing, may cancel many of its positions. This should ensure that no large population of whitetails appears on the market.
E2 Stored Aircraft Available
There are also no E2 aircraft publicly known to be available on the used market.
Like the backlog for the larger A220-300, the forward order backlog for the E2 is predominantly for the larger E195-E2 variant as all the E190-E2s ordered by Aercap have been delivered. The majority of the Aercap backlog will be delivered to Azul although some of these orders have been deferred. In the case of Aircastle all of its 25 (except three) are for the larger E195.
5.4 Placement of Used Aircraft Given that the programme for both families of aircraft remains new, there have to date been no known placements of used aircraft.
5.5 Risk FactorsWhile both existing lessors and other owners have had considerable success in placing other used aircraft with new carriers, considerable risk factors which may affect demand for Crossover Jets persist. At a macro level these include:
• Any sustained pandemic-induced economic deterioration globally could have a substantial negative impact on the demand for aircraft;
• If a post-pandemic recovery is strong as some project, the current short-term move towards rightsizing to match lower demand could be reduced by a return to the pre-pandemic trend of up-gauging capacity;
• Even if traffic recovery occurs, the consensus that business traffic will be the slowest segment to return to growth may mean that some airlines may consider that reducing capacity by cutting frequency rather than aircraft capacity is easier to implement. This could be a preferable way to manage demand since other classes of leisure traffic are far less sensitive to frequency; and
• Any of the current new generation aircraft types face a greater early obsolescence risk than their predecessors as the rapidly increased pressure to produce aircraft powered by sustainable energy sources gathers pace. Any technological step-change to hydrogen or electrically powered aircraft will impact smaller gauge aircraft before mainline single or twin aisle aircraft.
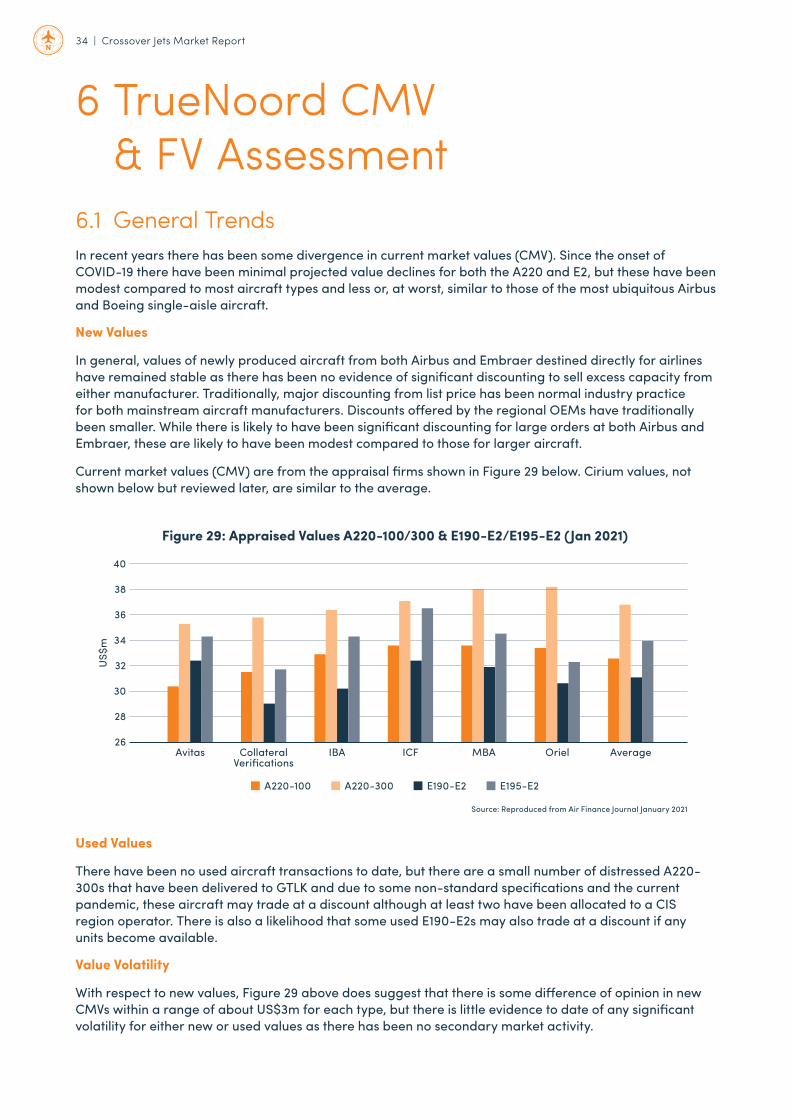
34 | Crossover Jets Market Report
6 TrueNoord CMV & FV Assessment
6.1 General TrendsIn recent years there has been some divergence in current market values (CMV). Since the onset of COVID-19 there have been minimal projected value declines for both the A220 and E2, but these have been modest compared to most aircraft types and less or, at worst, similar to those of the most ubiquitous Airbus and Boeing single-aisle aircraft.
New Values
In general, values of newly produced aircraft from both Airbus and Embraer destined directly for airlines have remained stable as there has been no evidence of significant discounting to sell excess capacity from either manufacturer. Traditionally, major discounting from list price has been normal industry practice for both mainstream aircraft manufacturers. Discounts offered by the regional OEMs have traditionally been smaller. While there is likely to have been significant discounting for large orders at both Airbus and Embraer, these are likely to have been modest compared to those for larger aircraft.
Current market values (CMV) are from the appraisal firms shown in Figure 29 below. Cirium values, not shown below but reviewed later, are similar to the average.
Used Values
There have been no used aircraft transactions to date, but there are a small number of distressed A220-300s that have been delivered to GTLK and due to some non-standard specifications and the current pandemic, these aircraft may trade at a discount although at least two have been allocated to a CIS region operator. There is also a likelihood that some used E190-E2s may also trade at a discount if any units become available.
Value Volatility
With respect to new values, Figure 29 above does suggest that there is some difference of opinion in new CMVs within a range of about US$3m for each type, but there is little evidence to date of any significant volatility for either new or used values as there has been no secondary market activity.
Figure 29: Appraised Values A220-100/300 & E190-E2/E195-E2 (Jan 2021)
Source: Reproduced from Air Finance Journal January 2021
A220-100 A220-300 E190-E2 E195-E2
Avitas CollateralVerifications
IBA ICF MBA Oriel Average
36
34
32
30
28
26
40
38
US$
m
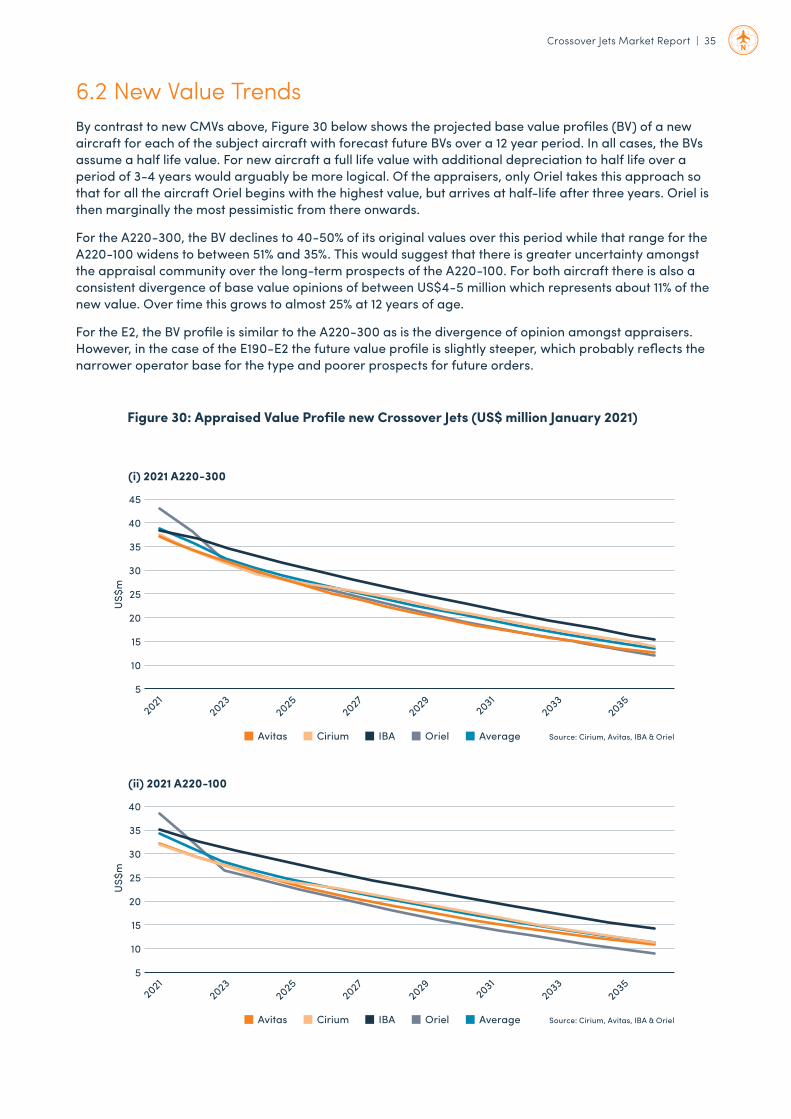
Crossover Jets Market Report | 35
6.2 New Value TrendsBy contrast to new CMVs above, Figure 30 below shows the projected base value profiles (BV) of a new aircraft for each of the subject aircraft with forecast future BVs over a 12 year period. In all cases, the BVs assume a half life value. For new aircraft a full life value with additional depreciation to half life over a period of 3-4 years would arguably be more logical. Of the appraisers, only Oriel takes this approach so that for all the aircraft Oriel begins with the highest value, but arrives at half-life after three years. Oriel is then marginally the most pessimistic from there onwards.
For the A220-300, the BV declines to 40-50% of its original values over this period while that range for the A220-100 widens to between 51% and 35%. This would suggest that there is greater uncertainty amongst the appraisal community over the long-term prospects of the A220-100. For both aircraft there is also a consistent divergence of base value opinions of between US$4-5 million which represents about 11% of the new value. Over time this grows to almost 25% at 12 years of age.
For the E2, the BV profile is similar to the A220-300 as is the divergence of opinion amongst appraisers. However, in the case of the E190-E2 the future value profile is slightly steeper, which probably reflects the narrower operator base for the type and poorer prospects for future orders.
Source: Cirium, Avitas, IBA & OrielAvitas Cirium IBA Oriel Average
(i) 2021 A220-300
45
40
35
30
25
20
15
10
5
2021
2023
2025
2027
2029 20
3120
3320
35
Figure 30: Appraised Value Profile new Crossover Jets (US$ million January 2021)
US$
m
Source: Cirium, Avitas, IBA & OrielAvitas Cirium IBA Oriel Average
(ii) 2021 A220-100
40
35
30
25
20
15
10
5
2021
2023
2025
2027
2029 20
3120
3320
35
US$
m
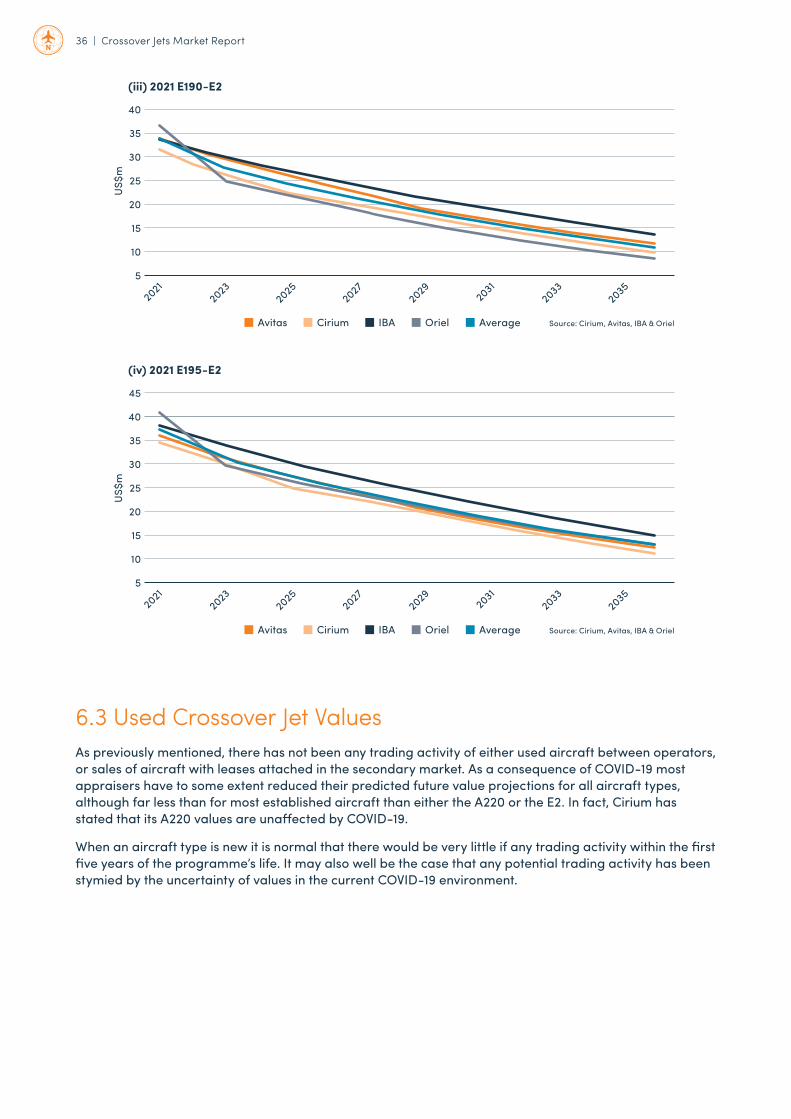
36 | Crossover Jets Market Report
6.3 Used Crossover Jet ValuesAs previously mentioned, there has not been any trading activity of either used aircraft between operators, or sales of aircraft with leases attached in the secondary market. As a consequence of COVID-19 most appraisers have to some extent reduced their predicted future value projections for all aircraft types, although far less than for most established aircraft than either the A220 or the E2. In fact, Cirium has stated that its A220 values are unaffected by COVID-19.
When an aircraft type is new it is normal that there would be very little if any trading activity within the first five years of the programme’s life. It may also well be the case that any potential trading activity has been stymied by the uncertainty of values in the current COVID-19 environment.
Source: Cirium, Avitas, IBA & OrielAvitas Cirium IBA Oriel Average
(iii) 2021 E190-E2
40
35
30
25
20
15
10
5
2021
2023
2025
2027
2029 20
3120
3320
35
US$
m
Source: Cirium, Avitas, IBA & OrielAvitas Cirium IBA Oriel Average
40
(iv) 2021 E195-E2
45
35
30
25
20
15
10
5
2021
2023
2025
2027
2029 20
3120
3320
35
US$
m
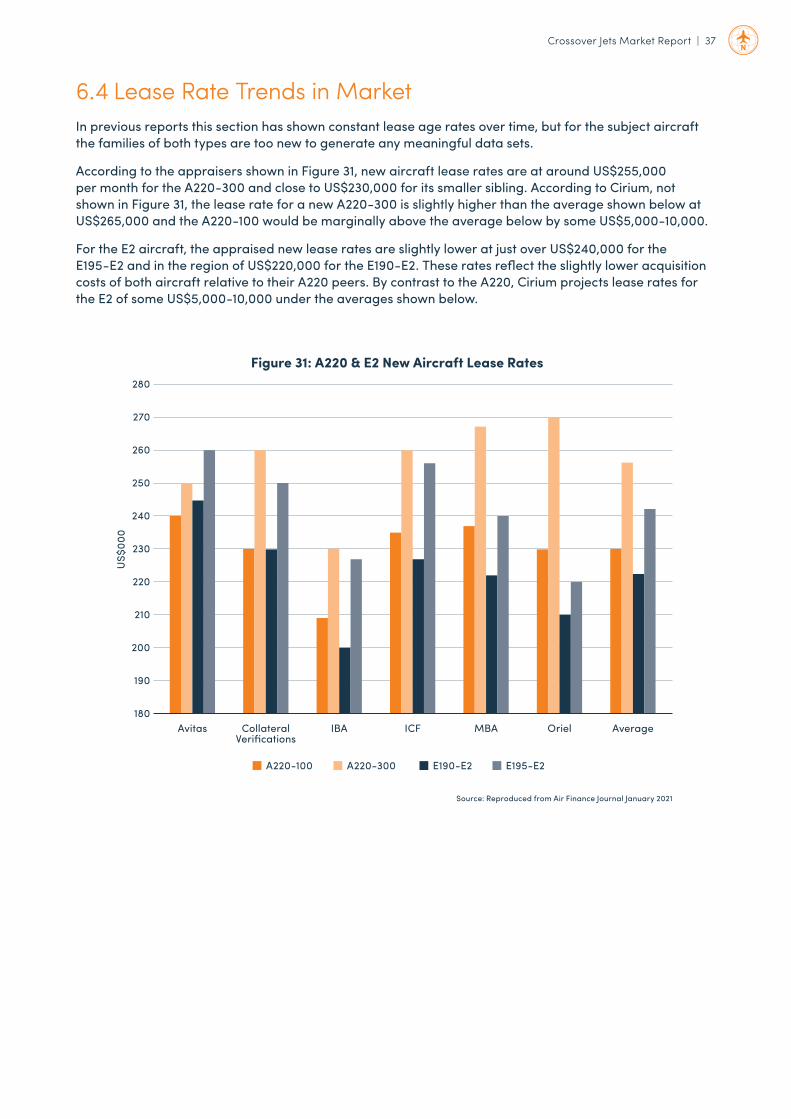
Crossover Jets Market Report | 37
6.4 Lease Rate Trends in MarketIn previous reports this section has shown constant lease age rates over time, but for the subject aircraft the families of both types are too new to generate any meaningful data sets.
According to the appraisers shown in Figure 31, new aircraft lease rates are at around US$255,000 per month for the A220-300 and close to US$230,000 for its smaller sibling. According to Cirium, not shown in Figure 31, the lease rate for a new A220-300 is slightly higher than the average shown below at US$265,000 and the A220-100 would be marginally above the average below by some US$5,000-10,000.
For the E2 aircraft, the appraised new lease rates are slightly lower at just over US$240,000 for the E195-E2 and in the region of US$220,000 for the E190-E2. These rates reflect the slightly lower acquisition costs of both aircraft relative to their A220 peers. By contrast to the A220, Cirium projects lease rates for the E2 of some US$5,000-10,000 under the averages shown below.
Figure 31: A220 & E2 New Aircraft Lease Rates
Source: Reproduced from Air Finance Journal January 2021
A220-100 A220-300 E190-E2 E195-E2
Avitas CollateralVerifications
IBA ICF MBA Oriel Average
230
220
210
200
190
180
250
260
270
280
240
US$
000