TR2014 033 Ecological status of mangrove removal sites in the ...
Upload
truonghanhCategory
view
215download
1
CrossComp: Comparing Multiple Artists Performing Similar Modeling Tasks
Jonathan D. Denning Fabio PellaciniDartmouth College Sapienza University of Rome
June 2014, Dartmouth Computer Science Technical Report TR2014-760
Figure 1: A subset of snapshots from Scout sequence by Author.
1 Abstract
In two previous papers, we have focused on summarizing and visu-alizing the edits of a single workflow and visualizing and mergingthe edits of two independent workflows. In this paper, we focus onvisualizing the similarities and dissimilarities of many workflowswhere digital artists perform similar tasks. The tasks have beenchosen so each artist starts and ends with a common state. Weshow how to leverage the previous work to produce a visualizationtool that allows for easy scanning through the workflows.
2 Introduction
Let us consider the following scenario as a motivating example.Suppose that a digital arts instructor assigns to the students the taskof creating a particular 3D model. The assignment could be usedto assess the students’ ability or technique or to teach the studenta new technique. For the former use-case, the instructor mightchoose to give to the students a target model to recreate. For thelatter, the instructor might present the instructions in the form of avideo tutorial. The scenario illustrated above is a common practiceespecially for web-based mentoring, such as with CG Cookie.
When the assigned task involves many components, the instructormay ask the students to periodically save a snapshot of their modelas they work and then submit their workflow as a work-in-progresssequence. When the task is a single piece, the students may onlyreport the final state of their model.
In [Denning et al. 2011] and [Denning and Pellacini 2014], wedemonstrated two systems that summarize and visualize a singleartist working on a single task. Clearly, the instructor could useone of these tools to review the workflow of each student. Thesetools and techniques, however, do not help with determining howclosely the student followed the tutorial, with identifying effectiveor efficient workflow patterns, or with finding poor techniques orcommon modeling problems.
In this paper, we present CrossComp, a system designed to helpcompare multiple artists performing similar mesh editing tasks. Wefocus on task-based polygonal modeling workflows, where the startand ending conditions are highly defined but the workflows fromstart to finish may differ. We demonstrate CrossComp by analyzingfour subjects performing four tasks, where three tasks use a videotutorial and the fourth uses a target 3D model. We remark on someobservations on the workflows that are clear in CrossComp butmight have been missed with manual inspection or with inspectingonly snapshots. Finally, we conclude with reporting on open-endedfeedback from a professional digital artist and instructor and withdiscussing limitations and future research directions for this work.
3 Related Work
The works by Kong et al. [Kong et al. 2012] and Pavel et al. [Pavelet al. 2013] are closely related to the work presented in this paper.The goal of their work is to help users identify the trade-offsbetween many possible workflows that perform the same image-editing task, such as “Find Edges” or “Sketch Effect”. They presentand evaluate different workflow visualizations for displaying andcomparing image-editing workflows. One visualization, calledunion graph, compares two sequences of commands by showingeach sequence as a directed graph with a node for each operationand directed edges to indicate temporal order. The similarity anddissimilarity is indicated by overlapping nodes of the two graphsif the corresponding operations are sufficiently similar in terms ofoperation name or type and parameter settings. Another, calledalignment view, compares two or more sequences of commands byarranging the workflows according to similarity in operation usage.The operations of each workflow is drawn as a list, and edges aredrawn between neighboring operations that are similar.
While their data included short, highly-polished tasks scrapedfrom photo-editing tutorials, our work focuses on much longerworkflows that can contain errors and undone work. Furthermore,although they provided step-by-step visualizations of the workflowallowing for manual inspection and comparison, their automatedmethods rely solely on the operation type and parameter settings.Typically mesh editing software has far fewer number of opera-tions that can be performed with many operations able to performseveral different types of manipulations. In other words, whencompared to image editing workflows, the differences in meshediting workflows depend more on the effect of the operation orthe combination of operations than the actual operation name,parameter setting, or order of operations.
Lafrenier et al. [Lafreniere et al. 2013] describe a system, Fol-lowUs, where a user can view a tutorial submitted by the originalauthor or by other users performing their version of the tutorial.Matejka et al. [Matejka et al. 2009] describe a recommendersystem, CommunityCommands, that collects usage data from auser community and then displays to each user a set of commandsthe user may not be familiar with. These two systems enhancea user’s understanding of the tutorial or software system bypresenting how other users of the community perform the task oruse the software. The focus of our work is to provide the user a toolto compare the workflows of the community, not just to review.

scout transporter station interceptorFigure 2: Final meshes for each task. The scout, transporter, and station tasks were presented as video tutorials, and the subjects wereasked to follow the tutorial. The interceptor task was presented as a final mesh, and the subjects were asked to recreate the mesh as closelyas possible by using any modeling technique.
4 Data Collection
Our experiments consisted of four relatively short tasks, involvingroughly 20 to 60 minutes of modeling, of moderately increasingdifficulty. The first three tasks we presented to the subject in videotutorial format, and the final task was given as a target model. Weasked the subjects to follow as closely as possible the steps in thethree video tutorials and to recreate as precisely as they could thetarget mesh of the fourth task. For the final task, the subject coulduse any modeling technique to replicate the model.
Although all of the subjects reported having some modelingexperience, some did not have any experience using the chosenmodeling software prior to starting the experiment. Therefore, wedesigned the video tutorials to provide software usage instruction inaddition to high-level explanations of the mesh construction via anoverlaid audio track. The video of each tutorial is a screen-capturetime-lapse of the construction played back in an interactive videoplayer at real time with a few pauses to point out features. Themesh of the final task is viewed within an interactive 3D viewer toallow the subject to inspect and interact with the mesh.
We chose for all four tasks the theme of spaceships. Althoughthese goal-based tasks would limit the exploration and variabilityof the workflows, we felt that open-ended tasks or goals that wereopen to interpretation would inject a subjectivity and aestheticcomponent into the workflow that would make objective analysissignificantly more difficult. Figure 2 shows the final mesh for eachof the four tasks.
We used an instrumented version of Blender to record theworkflows, both for the author and for the subjects. The startingcondition for all tasks contains a single unit cube. Every actionthat modified the state of the modeling software was recorded,including the undoing of work. The entire recording system forthe subject was a self-contained executable with a simple interface,which simplified the process for the subject, and allowed thesubject to work at their own pace.
Four subjects participated in the study, but one subject did notsubmit one of the tasks. See Table 1 for statistics on the recordedworkflows.
5 Correspondence and Distance
CrossComp takes as input the recorded snapshots of the cor-responding workflows. In order to compare, CrossComp mustbuild an intra-correspondence of elements along each workflowand an inter-correspondence between the workflows. The intra-correspondences is constructed similarly to MeshFlow, whereeach face is uniquely labeled (locally) upon creation and trackedthroughout the workflow.
While we cannot make any assumptions about the state of the mesh
Model Type Author Sbj. 1 Sbj. 2 Sbj. 3 Sbj. 4
scout vid 100 125 298 144 217transporter vid 171 197 238 164 311station vid 244 — 160 306 377interceptor mesh 195 507 283 230 465
Table 1: Statistics for workflow comparison data. The numericalvalues indicate number of mesh changing edits (no selections,view changes, etc.). The author created the video tutorials (scout,transporter, station) and mesh target goal (interceptor) that theother subjects followed and tried to reproduce. Note: Subject 1 didnot finish the station task.
Figure 3: A subset of snapshots from Transporter sequence byAuthor. Corresponding faces are colored similarly.
in the middle of the workflow, because the mesh can be arbitrarilychanged, we can assume that the beginning and ending states oftwo workflows are similar to known states. As the beginning statefor each task is a unit cube and therefore not very informativein terms of inter-correspondences, we use the final state of eachworkflow to build inter-correspondences. We use a slightlymodified MeshGit∗ to build inter-correspondences between theending state of the meshes and to uniquely label (globally) thefaces. See Figure 4 for results of building inter-correspondences.
Snapshot Edit Distance. One way to compare two meshesto find how similar or dissimilar they are is to compute an editdistance between the pair. The edit distance between two meshes isdefined as the minimal amount of change required to turn one meshinto the other. If the edit distance is small, then the two meshes arequite similar; if the distance is large, then the two meshes are quitedissimilar.
In [Denning and Pellacini 2013] we defined a mesh edit distancewhich we used to build a correspondence between meshes.
∗The MeshGit modifications include: the the dot product of the ele-ments’ normals in geometric cost are made absolute, and the greedy stepis performed one additional time at end without removing twisted facesor faces with mismatched adjacencies. The first modification accounts forflipped normals, and the second modification allows MeshGit to match asmany faces as possible by ignoring mismatched adjacencies.

scou
ttra
nspo
rter
stat
ion
inte
rcep
tor
Figure 4: Final meshes for each of the tasks with inter-correspondences illustrated by matching face colors. The top-left subfigure for eachworkflow was constructed by Author, and all other subfigures are for the modeling subjects. The faces of top-left subfigure are randomlycolored, and the faces for other workflows are colored to indicate inter-correspondences. If the face does not have an inter-correspondence,it is colored dark red.

Figure 5: Basic user interface. The left column visualizes thesnapshots of workflows in low-dimensional space. The centercolumn shows a pairwise edit distance heat map. The right columncontains interactive views of each workflow.
CrossComp uses a modified version of the mesh edit distance†
along with the already established intra-correspondences andinter-correspondences to compute an edit distance between anytwo pairs of snapshots.
6 Visualization
The basic user interface for CrossComp is shown in Figure 5.The left column shows a 3D embedding of the snapshots afterperforming a nonlinear dimensionality reduction of the pairwiseedit distances, the center column visualizes a heat map of thepairwise edit distances, and the right column consists of interactiveviews of the snapshots for each workflow. While each columnvisualizes different features of the workflows, they are syncedover the time dimension for each workflow. This syncing means,for example, that adjusting the current time of a workflow in onecolumn will automatically update the corresponding visualizationsin the other columns. The first column indicates currently viewedtime with a white circle; the second with horizontal and verticallines; the third with white ticks on the colored bars below themodel. Each workflow has an associated color (red, green, yellow,blue, purple, resp.). Changes to the mesh are indicated in the thirdcolumn by coloring the modified faces orange.
In all of the figures, the original tutorial author workflow is the firstworkflow (red), and the subjects’ workflows are compared to theauthor.
Edit Distance Coordinates. The left side of Figure 6 shows a3D embedding of the Scout workflows according to their pairwisesnapshot edit distance. Each snapshot of the workflow is indicatedby a dot, colored corresponding to the workflow. The edgesbetween dots indicate temporal order of edits. We performed anonlinear dimensionality reduction on the pairwise edit distancesby using Isomap [Tenenbaum et al. 2000] with a k-nn search tofind the local neighborhood. We used a value of k = 10, butforced at least one mesh from each workflow to be included (themesh with smallest edit distance) so the embedding would take allworkflows into account.
The dots corresponding to two similar snapshots will appear closein this space, while the dots of two quite different snapshots willbe far apart. Referring back to Figure 6, note the inset figurewhich zooms into the large cluster of dots near the center of thecolumn. These dots correspond to the early snapshots of theworkflows, where the meshes were very similar in shape (the initial
†The snapshot edit distance considers only the face elements ofMeshGit’s mesh edit distance.
Figure 6: Outliers in Scout task. Two of the workflows (2,5) usedthe wrong operation or and one the wrong parameter setting (3),causing a very large change that differed greatly from the otherworkflows. Inset zooms into the initial state of the workflows.
Figure 7: Heat map of Scout task. The color in the pairwise heatmap indicates the edit distance between a pair of mesh snapshotsfrom all workflows of a task. Cool colors (blue, green) indicatesimilar meshes, i.e., small edit distances. Warm colors (red, yellow)indicate dissimilar meshes, i.e., large edit distances. Note: the heatmap is symmetric because we used a symmetric edit distance.
cube mesh). From these dots, all the workflows except the third(yellow) follow very closely to each other with just a few outliers.The outliers, selected in the figure, were caused by the artistsperforming an incorrect operation (here, the spin operation insteadof subdivide). The artist quickly corrected the error by undoingthe work and then continued following closely the tutorial. Thethird workflow, however, diverged from the other workflows afterperforming a large number of incorrect operations, seen as thenumerous back and forth edges near the center of the inset. Closeto the end of the third workflow, we see some additional outlierswhere the artist attempts to choose the correct parameter settingsfor the mirror modifier. We discuss this more below.
Edit Distance Heat Map. Figure 7 shows a heat map visualiza-tion of the pairwise edit distances of the Scout task workflows. Thetopmost row and leftmost column of the heatmap correspond tothe first workflow, followed by the second workflow moving downand right, etc. The color in the intersection of a specific row andcolumn indicates the edit distance between the mesh snapshots cor-responding to the specific row and column. The color is determinedby linearly mapping the regularized distance to a color gradientthat runs from black to blue, green, red, and dark red, where ablack color indicates no edit distance (exactly the same mesh), anda dark red color indicates a large distance (very different meshes).Extra space is added between rows and columns to distinguish theworkflows. The horizontal and vertical lines running across theheat map indicate the currently viewed time for the corresponding
workflow. We regularize the edit distances by dividing by the totalnumber of faces. We found that edit distance regularization helpsfilter accumulated change and generates more intuitive heat maps.
One observation to note about the figure is the wide band of darkred rows and columns in the early parts (top-left corner) of the thirdworkflow, where the artist made and corrected several mistakes.Finally, after nearly a third of workflow, the artist was able tofollow along with the tutorial, although with some errors which isseen with green color (moderate distance) in bottom-right cornerof each block of third row or column.
Cross-Workflow Scrubbing. While the user scrubs throughthe timeline of one workflow, CrossComp can automatically snapthe other workflows to the closest snapshot in terms of the editdistance. This cross-workflow scrubbing allows the user to inspecthow all of the workflows progressed, even though the artists mayhave worked at a different pace. We define the closest snapshot ina specific workflow to a given snapshot as the snapshot with thelowest regularized edit distance from the given.
Spatial Filtering. Similarly to MeshFlow and 3DFlow, the usercan perform spatial filtering on the workflows to find when theartists modified a region of interest. When the user selects a face inone workflow, the corresponding faces in the other workflows areselected, too. The timeline (colorbar below the model) is darkenedto indicate the edits that do not modify the selected faces. SeeFigure 8 for an example.
7 Results
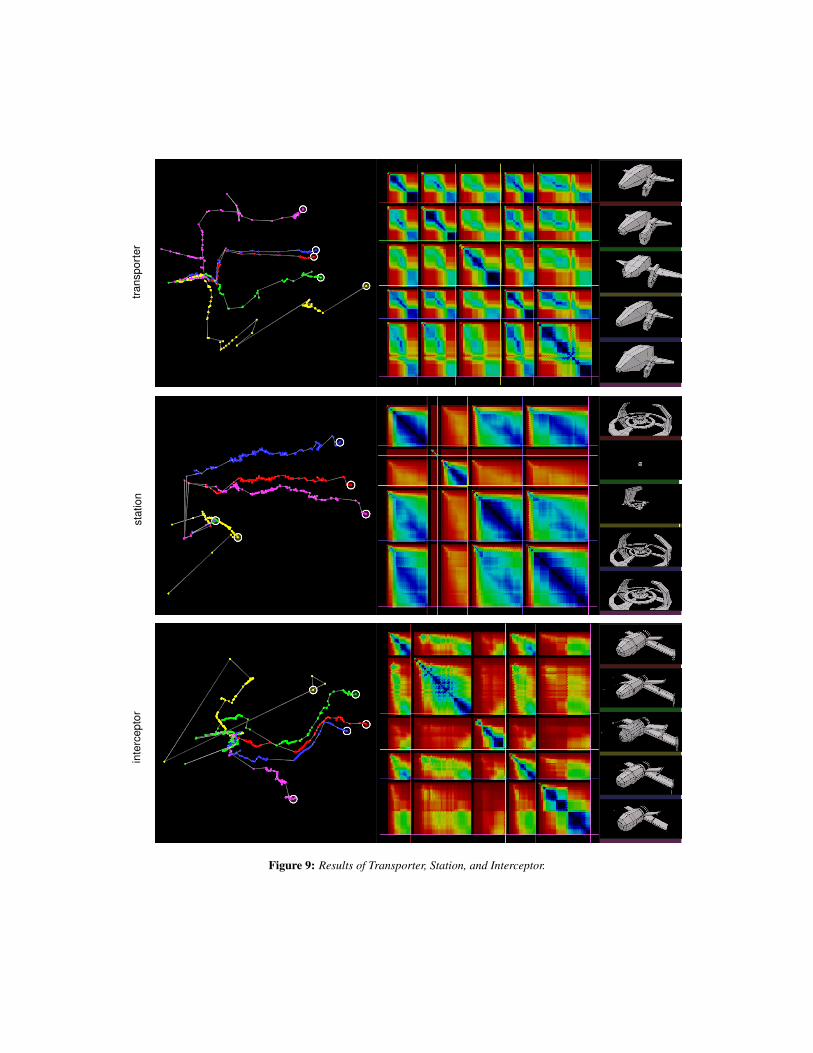
Figure 9 displays the results of the Transporter, Station, andInterceptor workflows. Below we will discuss briefly someobservations for these workflows.
Transporter. Generally, all four subjects followed the Trans-porter tutorial relatively closely. The fifth workflow contained afew corrected errors (visualized as the purple outlier runs in thefirst column.) The first and fourth workflows were the closest pairof workflows. While all the final meshes were similar in shape, thedifferences of proportions and fine details of the engines caused adivergence of the workflows in the 3D embedded view.
Station. In the Station task, one of the subjects did not submitthe completed task, so the second workflow remains as a cube.Also, the third workflow only loosely followed the tutorial andinvolved fewer edits than the video tutorial, and the subject didnot have the mesh positioned correctly for the mirror modifier toduplicate the other three quadrants properly, resulting in an outlierin the first column. The first, fourth, and fifth workflows followedeach other closely.
Interceptor. Where the previous tasks were presented as a videotutorial, the interceptor task was presented to the subjects as a finaltarget mesh. The subjects were free to construct the mesh usingany techniques and in any order. One important observation to noteis that while the artists can construct the mesh in any order, the ma-jority of divergence was due to differences in adjacencies. For ex-ample, the first and fourth workflows are relatively close in the firstcolumn, because their meshes are topologically quite similar. How-ever, the second, third, and fifth workflows contained many changesin adjacency (missing features, extra faces, incorrectly connectedfaces, etc.) and therefore appear to diverge from the first and fourth
workflows. The extremely large distances seen in the third work-flow are due to setting incorrectly the mirror modifier parameters.
7.1 Feedback
We presented our findings to Jonathan Williamson, a professionaldigital modeling artist and instructor for CG Cookie, in order togather some open-ended feedback. Williamson stated that theembedded view made it clear when the artists made and thencorrected a mistake and that the curves hinted at the similarities ofthe workflows. When shown the Interceptor dataset, he remarkedabout how the subjects took a similar approach to constructing thespaceship despite not having step-by-step instructions, which wasan unexpected observation.
Williamson said that he is quite excited about the results andinterested in finding ways to use CrossComp to instruct. One usagescenario he proposed centers on an assignment he has given before,which follows closely the Interceptor workflow, where he asks thestudents to create a challenging mesh. CG Cookie has created fourexercises of this type in the past, and Williamson states that whilethey receive many more requests to do more, they have not beenable to due to the time involved in reviewing the workflows. Afterlooking over the submitted final versions, he would create a videotutorial on constructing the model while pointing out commonmistakes and pitfalls seen in the students’ results. He believed thatCrossComp would help him in finding, analyzing, and pointing outthese situations.
7.2 Limitations
There are a few limitations to our input data and approach toanalyzing. We discuss some of these limitations in this subsection.
Input Data. We designed our experiments to include instructionsfor using Blender and to be relatively short and simple. Thisdecision was motivated by some of our subjects may have noexperience using Blender and possibly only little experiencemodeling. Furthermore, despite walking the subjects step-by-stepthrough first three tasks, one workflow was submitted incomplete,and two submitted with gross errors. Although these issues limitthe scope of our experiments to novices and amateurs, we foundthat CrossComp was able to produce intuitive results that helpedwith making key observations about individual workflows and withcomparing the workflows with one another. We leave for futurework the study of more experienced subjects performing longerand more advanced tasks.
Correspondences. MeshGit builds a one-to-one correspon-dence between two meshes. A discrete correspondence workswell when the two meshes are very similar in terms of faceadjacency. However, when only a fuzzy correspondence isnecessary or computable, such as when the models use the mesh toprovide a relatively loose representation the surface, other surfacecorrespondence methods might be more appropriate. We chose touse MeshGit’s correspondence building method and designed ourexperiments to fit in these limitations, because MeshGit computes amesh edit distance which we use directly. We leave the explorationof other correspondence building and distance computing methodsfor future work.
Edit Distances. Computing a full pairwise edit distance canbecome quite expensive, growing polynomially in the lengthsof workflows and number of subjects. It should be noted thatthe pairwise distances needs to be computed only once and then

Figure 8: Filtering to spatial selection. The user selected the faces of the engine in one task, and the corresponding faces are highlighted forthe other tasks. The edits that modify the selected region are highlighted in the timeline.
cached, is a highly parallel operation, is symmetric, and can beonly sparsely computed.
8 Conclusion
In this paper, we presented CrossComp, a method for comparingmultiple artists performing similar tasks. Motivated by real-worlddigital modeling exercises, we demonstrated how to use intra-and inter-correspondences within a set of workflows to computea pairwise snapshot edit distance. CrossComp can visualizethese edit distances as a heat map, where similar and dissimilarsnapshots are identified using cool and hot colors, respectively.CrossComp can also perform nonlinear dimensionality reductionon the distances to embed the workflows in a 3D space, wherecurves and distances indicate similar editing patterns or mistakesand errors. Open-ended feedback from a professional artist andinstructor indicate that a system like CrossComp could stronglybenefit the instruction community.
References
DENNING, J. D., AND PELLACINI, F. 2013. MeshGit: Diffing andmerging meshes for polygonal modeling. ACM Transactions onGraphics 32, 4, 35:1–35:10.
DENNING, J. D., AND PELLACINI, F. 2014. 3DFlow: Continuoussummarization of mesh editing workflows. Tech. rep., Depart-ment of Computer Science, Dartmouth College, June.
DENNING, J. D., KERR, W. B., AND PELLACINI, F. 2011. Mesh-Flow: interactive visualization of mesh construction sequences.ACM Transaction on Graphics 30, 4, 66:1–66:8.
KONG, N., GROSSMAN, T., HARTMANN, B., AGRAWALA, M.,AND FITZMAURICE, G. 2012. Delta: a tool for representingand comparing workflows. In Proceedings of the SIGCHI Con-ference on Human Factors in Computing Systems, ACM, 1027–1036.
LAFRENIERE, B., GROSSMAN, T., AND FITZMAURICE, G. 2013.Community enhanced tutorials: improving tutorials with mul-tiple demonstrations. In Proceedings of the 2013 ACM annualconference on Human factors in computing systems, ACM, NewYork, NY, USA, CHI ’13, 1779–1788.
MATEJKA, J., LI, W., GROSSMAN, T., AND FITZMAURICE, G.2009. CommunityCommands: Command recommendations forsoftware applications. In UIST.
PAVEL, A., BERTHOUZOZ, F., HARTMANN, B., ANDAGRAWALA, M. 2013. Browsing and analyzing the command-level structure of large collections of image manipulationtutorials. Tech. rep., Electrical Engineering and ComputerSciences, University of California at Berkeley, October.
TENENBAUM, J. B., DE SILVA, V., AND LANGFORD, J. C. 2000.A global geometric framework for nonlinear dimensionality re-duction. Science 290.
trans
port
erst
atio
nin
terc
epto
r
Figure 9: Results of Transporter, Station, and Interceptor.