Cross-Trading by ERISA Plan Managers - DOL
49
Cross-Trading by ERISA Plan Managers Final Report Thomas H. McInish, Ph.D., C.F.A. Tel: 901-678-4662 Fax: 901-678-3006 Email: [email protected]
Transcript of Cross-Trading by ERISA Plan Managers - DOL

Cross-Trading by ERISA Plan Managers
Final Report
Thomas H. McInish, Ph.D., C.F.A.
Tel: 901-678-4662 Fax: 901-678-3006 Email: [email protected]
Cross-Trading by ERISA Plan Managers
Executive Summary
ERISA prohibits cross trades, the exchange of assets between two accounts
without going through a public market. There have been numerous exemption requests
motivated by a desire to reduce transaction costs. Mutual funds are permitted to cross
trade under Rule 17a-7. Opportunities for cross trades arise when some funds within a
group have cash inflows and others have cash outflows and due to differences of opinion
among managers for a given mutual fund group about the desirability of holding
particular assets. Cross trades represent an economically significant source of savings for
mutual funds.
With a view toward identifying insights relevant to cross-trading, this study
reviews the academic literature dealing with the way financial markets are organized and
how this organization affects transaction costs, dealer quotes and prices, and other market
characteristics. Transaction costs include direct costs such as commissions and indirect
costs such as the bid-ask spread, which covers order processing costs (the normal
expenses of providing liquidity) and asymmetric information costs (dealer losses to
informed traders). Additional indirect costs are market impact costs, delay costs, and the
opportunity costs of missing a trade. Transaction costs typically range from one to four
percent, depending on a number of factors such as the type of asset (equities, debt,
derivatives, and currencies), daily trading volume in the asset, the size of the order,
market conditions (recent news, whether others are buying or selling), and the country in
which the asset is traded. Because investment managers often have one- or two-year

investment horizons, transaction costs are of sufficient size to be a significant drag on
performance.
Dealer quotes reflect asymmetric information costs and trade size. Trade prices
exhibit regularities, including U-shaped patterns in returns, volume, variability of returns,
and bid-ask spreads. There are other systematic features of trading such as the tendency
of the last trade of the day to be on the ask. Further, buys and sells do not have the same
market impact. Without a market trade, it is impossible to know what price each
counterparty would have paid or received.
If both parties are equally motivated and seek to trade at the same time, it makes
sense to simply use the average of the bid and ask price as the cross trade price so that the
buyer and seller split the savings in commissions, market impact costs, delay costs, and
opportunity costs. But if one party typically uses patient trading strategies or is
accommodating the counterparty, determination of a fair crossing price is difficult.
Consider a manager of two ERISA plans, one of which needs to raise funds to pay
participants and plans to sell an illiquid security. The quoted market price is considered
low. In fact the price represents such a “good deal” that the ERISA manager would like
to purchase the security in a second ERISA plan. The second plan may not have
sufficient cash, but can sell very marketable securities to raise the needed funds. In this
case, the second fund incurs extra costs to purchase the securities and is motivated to
make this investment only because obtaining these securities at such a good price will
enhance the return of the fund. In this case the average of the quoted bid and ask in the
market would not represent a fair price for the second fund. Instead, the second fund
should probably receive the entire benefit of the “good deal.”

If the goal is to minimize risk, cross trading should be prohibited. In a cost-
benefit context, steps can be taken to reduce risk of abuse including limiting cross trading
to large plans and requiring a written plans and monitoring. This would permit plans
receiving an exemption to benefit from the savings available from cross trading.

Cross-Trading by ERISA Plan Managers
Abstract
ERISA prohibits cross trades, the exchange of assets between two accounts
without going through a public market. There have been numerous exemption requests
motivated by a desire to reduce transaction costs (typically one to four percent). Mutual
fund cross trades under Rule 17a-7 achieve economically significant savings.
Transaction costs comprise commissions, market impact, and opportunity costs of
missed trades. Further, round trip trades incur a bid-ask spread, which covers order
processing costs (the normal expenses of providing liquidity) and asymmetric
information costs (dealer losses to informed traders). Dealer quotes reflect asymmetric
information costs and trade size. Trade prices exhibit regularities, including U-shaped
patterns in returns and volume. Without a market trade, it is impossible to know what
price each counterparty would have paid/received.
If both parties are equally motivated and seek to trade at the same time, it makes
sense to cross at the spread midpoint. But if one party typically uses patient trading
strategies or is accommodating the counterparty, determination of a fair crossing price is
difficult. If the goal is to minimize risk, cross trading should be prohibited. In a cost-
benefit context, steps such as having written implementation plans and strong monitoring
can reduce risk of abuse.
Cross-Trading by ERISA Plan Managers
1. Introduction
This study reviews the academic literature dealing with market microstructure1
with a view to shedding light on the benefits and costs of cross trading. 2 Cross-trades are
prohibited by ERISA unless they are consummated pursuant to an exemption. There have
been numerous requests for exemptions to allow cross trading under specific
circumstances. A principal motivation for these exemption requests is that trading costs
are substantial. The costs of trading vary across types of financial products such as
equities, debt, derivatives, and currencies and also from country to country. Trading
costs include direct costs such as commissions and taxes and indirect costs such as the
bid-ask spread,3 market impact costs, delay costs, and the opportunity costs of missing a
trade. Trading costs can amount to four percent and more of the amount of money
involved. Because both sides of a cross-trade avoid commissions and other transaction
costs, the benefits are clear and substantial.
The Department of Labor (DOL) has identified a number of potential abuses that
might result from cross trading.4 These concerns have focused on the types of securities
subject to cross trading, the way cross-trading affects investment decision and the like.
1Market microstructure is “the study of the way financial markets are organized and how this organization affects prices, risk, trading costs, and other market characteristics.” (McInish, 2000). 2We define a cross-trade as the sale of an asset for one portfolio and the purchase of that same asset for another portfolio where both portfolios are under the control of the same individual or firm. 3The ask (bid) is the price at which a liquidity provider is willing to sell (buy) and the difference between the ask and the bid is called the spread, an important cost of trading. On each round-trip trade (a purchase and sale) investors expect to pay a spread and suppliers of immediacy expect to earn a spread. 4These include: providing artificial liquidity to favored accounts, allocating cross-trade opportunities to favored accounts, and allowing cross-trade opportunities to affect investment decision. Department of Labor, Pension and Welfare Benefits Administration, (March 20) 1998, Federal Register (Volume 63, number 54).

Here, we extend these concerns to additional issues related to the behavior of markets and
the way that trading is conducted. A few of these concerns may be indicative. In the
microstructure literature, the initiator of a transaction is viewed as the demander of
liquidity and the counterparty as the supplier of liquidity.5 The demander of liquidity
typically compensates the supplier. Some investment strategies call for more urgent
execution of orders than others. Plans with less urgent needs may use patient trading
strategies such as the use of limit orders rather than market orders.6 By becoming
suppliers of liquidity rather than demanders, patient traders may dramatically reduce
transaction costs. By becoming a party to a cross trade, a plan foregoes the possibility of
using patient trading strategies.
On the other hand, investment managers already face difficult allocation decisions
that may involve ERISA plans. Wagner (2000) discusses the problems facing managers
in executing orders when the manager has a fiduciary duty to multiple clients, possibly
including multiple ERISA plans. In accumulating positions in the same asset for multiple
accounts, all accounts that trade on the same day typically get the same average price.
However, rather than allowing investment managers a free hand in selecting brokers to
execute trades, some clients require the investment manager to direct trades to a
particular broker. The investment manager selects a broker to execute the non-directed
orders. In this case it may not be fair for non-directing customers to suffer or benefit
form directed orders. Separation of trade execution channels in this way requires some
5The microstructure literature often considers two types of traders. Informed traders’ orders are motivated by information about the value of assets. On the other hand, liquidity motivated traders do not trade because of information. A mutual fund might have an inflow of cash that must be invested. The terms noise trader, uninformed trader, and liquidity trader are synonymous. Noise traders may include traders who think the have information, but do not. 6Order types are described in appendix 1.
2

orders to go first with subsequent orders likely experiencing greater market impact costs
and opportunity costs due to execution failures. Most managers require trades with
constraints to go last.7
One group seeking permission to cross trade between ERISA plans are in-house
asset managers (INHAMS8). INHAMs are required to be Registered Investment
Advisors and, therefore are subject to SEC inspections. Trading, including cross-trading,
is a focus of these inspections (see appendix 2). It is unlikely that SEC inspectors would
note or comment on DOL regulations in their inspection reports if these differed from
SEC requirements. But the fact that these INHAMS are subject to the inspections
indicates that have experience with maintaining the types of records that would be useful
to plan fiduciaries in evaluating cross trading.9
2. Mutual funds
Mutual funds can cross trade under Rule 17a-7 of the Investment Company Act of
1940.10 Many mutual fund groups take advantage of this rule to effect cross trades, but
some benefit to a greater extent than others. Many cross-trades are liquidity motivated.
Events that trigger a cross-trade may arise from the normal inflow and outflow of fund
7Wagner (2000). 8The INHAM concept is described in PTE 96-23 60 Fed. Reg. 15597 (Mar. 24, 1995). 9The types of records that might be useful are described in the letter of Mr. Ivan Strasfeld to the U.S. Department of Labor dated July 10, 2000. These include the trade date, the name of the issuer/security, the type of transaction, the principal amount of number of shares; the price and the basis for the price, the high and low price for the security on the trade date, and a certification regarding compliance with the firm’s procedures. 10Rule 17a-7 -- Exemption of Certain Purchase or Sale Transactions Between an Investment Company and Certain Affiliated Persons Thereof, Investment Company Act of 1940.
3
assets. However the initiation and termination of funds within a group may increase the
opportunities for cross trades.
Consideration of several actual mutual fund groups may be useful. Longleaf
funds manage more than $4.5 billion of assets and had more than $700 million of security
purchases in 2001. Yet, Longleaf funds typically effect only a few cross trades each year.
However, the closing of one of Longleaf’s four funds in 2001 allowed for the increased
use of cross trading.11 Longleaf’s opportunities to cross trade are limited by the fact that
all of its funds are value funds that seek to acquire securities that are assessed to be
undervalued. A more important source of cross trading opportunities arises from
opportunities to trade among different managers within a fund group. If a fund group has
different types of managers or managers with differing opinions, there are increased
opportunities for cross trading. American Century has more than $85 billion under
management. Cross trading opportunities have resulted from a shift of investors’ assets
from growth to value managers within the group. The American Century Small Cap
Value Fund’s assets grew from $225 million at the end of 2001 to $1,286 million at the
middle of June 2002, a growth of $1,061 million. Assuming that 1% of this asset growth
was accomplished through cross trades and that a cross trade saves 1% of the transaction
value round trip, the resulting savings are ($1,061 million X 0.01 X 0.01) =) $106,100.12
11The Longleaf funds operated four funds during 2001 including the Partners, Small-Cap and Realty funds. The Realty fund was closed. The Longleaf Partners Funds annual report at December 31, 2001 states: “Purchases in the Partners and Small-Cap Fund include securities purchases from the Realty Fund in conjunction with its liquidation. The securities were purchased from the Realty Fund at the last sales price on the security’s primary exchange, without brokerage commission in accord with procedures previously adopted by the Boards of Trustees of the Funds pursuant to Rule 17a-7 of the investment Company Act of 1940.“ 12One half of the savings accrues to the Small Cap fund and one-half to the fund with the cash outflow.
4

As the amount of assets under management increases, the potential savings from
cross trading grows at an even faster rate. One reason for this is that larger funds trade in
larger blocks, which have greater market impact. Another reason is that larger funds
have more managers leading to more disagreements as to whether a given stock should be
included in a portfolio. Fidelity Investments manages more than 150 mutual funds.
Conversations with industry executives indicate that perhaps 8% to 10% of equity trades
are cross trades at Fidelity. Fidelity has an ERISA exemption, but this exemption is not a
significant factor in Fidelity cross trades.13 Consider just one Fidelity Fund, the Fidelity
Aggressive Growth Fund, which had assets of $5,324 million and a turnover rate of 118%
in 2001.14 Assume that all trades are equity trades, that cross trades save 1% round trip,
and that 8% of trades are cross trades. Then the savings for this fund in 2001 due to cross
trades was ($5,324 million X 1.18 X 0.08 X 0.01 =) $5.026 million, not counting any
savings due to purchases made as a result of fund growth. Even though the Fidelity
Magellan Fund had a turnover rate of only 15%, because its assets total almost $72
billion, the savings from cross trades would likely have more than ($72,000 million X
0.15 X 0.08 X 0.01 =) $8.6 million. Clearly, cross trades represent economically
significant sums for Fidelity Investments.
These considerations lead to the following observations that are applicable to
ERISA plans. The larger the ERISA plan the greater the potential savings from cross
13PTE 94-43. 14For a mutual fund, the portfolio turnover rate is an annualized rate found by dividing the lesser of purchases or sales by the average of portfolio assets. Suppose that a fund is growing so that purchases of assets are greater than sales. In this case, a turnover rate of 1.0 indicates that sales of assets equaled average fund assets and purchases of assets equaled sales of assets plus any purchases of assets due to fund growth.
5

trading and the potential savings grows at a much faster rate than the rate of asset growth.
The main considerations that lead to this result are:
1. Market impact and delay costs. Larger investment size leads to greater market
impact costs. If 50,000 shares are traded each day, an order for 20,00 shares can
typically be executed quickly with little market impact while an order for 200,000
shares will take more time to execute and incur more market impact. An order for
400,000 shares is typically more than twice as difficult and takes more than twice
as long to execute as an order for 200,000 shares.
2. Larger funds may involve more ERISA plans. The likelihood that there will be
inflows for one plan and outflows from another at the same time is much greater
if there are five plans than if there are only two plans.
3. Larger funds have more investment managers. Investment managers may
disagree about the merits of a particular investment. The greater the number of
investment managers the greater the likelihood that one manager will want to buy
a security that another manager is selling. This observation is most applicable to
plans that employ multiple external investment managers.
3. Transactions costs
Transactions costs are all of the costs associated with the management of
investments, including the time involved in making investment decisions.15 Transaction
costs are classified as explicit or implicit. Explicit costs are itemized separately and paid
for like any other expenses. The most common explicit costs are commissions and
15For additional information see Schwartz and Whitcomb (1988).
6
transfer taxes and fees. The most common implicit transaction costs are the bid-ask
spread, market impact costs, delay, and opportunity costs. Table 1 provides an estimate
of each of these costs for equities.16 Note that commissions are the smallest component
of execution costs. Delay costs are the largest cost. Market impact costs are also
substantial totaling 50% more than commissions. The costs of executing the average
small cap order are more than four times as high as that of the average large cap order.17
A study of 31 stocks whose weighting in the Toronto Stock Exchange 300 index was
changed due to a redefinition of public float showed that the price impact of the change
on these 31 stocks was 2.34 percent.18 Because of market impact costs, it is common for
institutions to break up large orders for execution. Define a trade package as orders on
the same side of the market by a single investment manager. One study of 37 large
institutions found that more than one-half of the dollar value of executed trade packages
required four or more days for completion. This finding provides strong evidence that
16Taking a different approach, Hasbrouck and Schwartz (1988) reason that execution costs due to bid-ask bounce (the movement of stock prices between the bid and the ask), market impact, and the like, temporarily push trading prices away from their true value. Hence, comparison of volatility over different periods can be used to investigate the impact of transaction costs. These authors calculate the ratio of the variance of 12-hour returns to 24 times the variance of half-hour returns. Because these intervals cover the same calendar period, we know that the actual volatility is the same over these two measurement intervals. Therefore, the value of the ratio should be 1.0. Any temporary deviations provide a measure of execution costs. Using this methodology these authors report average execution costs of 0.148% of the transactions amount for NYSE-listed stocks. The comparable costs reported by Hasbrouck and Schwartz for American Stock Exchange and more liquid NASDAQ stocks are 0.123% and 0.438%, respectively. If the assumption that the entire difference in the variance ratios is due to transaction costs does not hold, the Hasbrouck and Schwartz measure will overestimate execution costs. Stabilization activities of the specialist, the presence of limit orders, or the sequential arrival of information causing price adjustment delays might also affect short-term price volatility. 17In this example large (small) cap (capitalization) is more (less) than one billion dollars. 18Kaul, Mehrotra and Morck (2000).
7
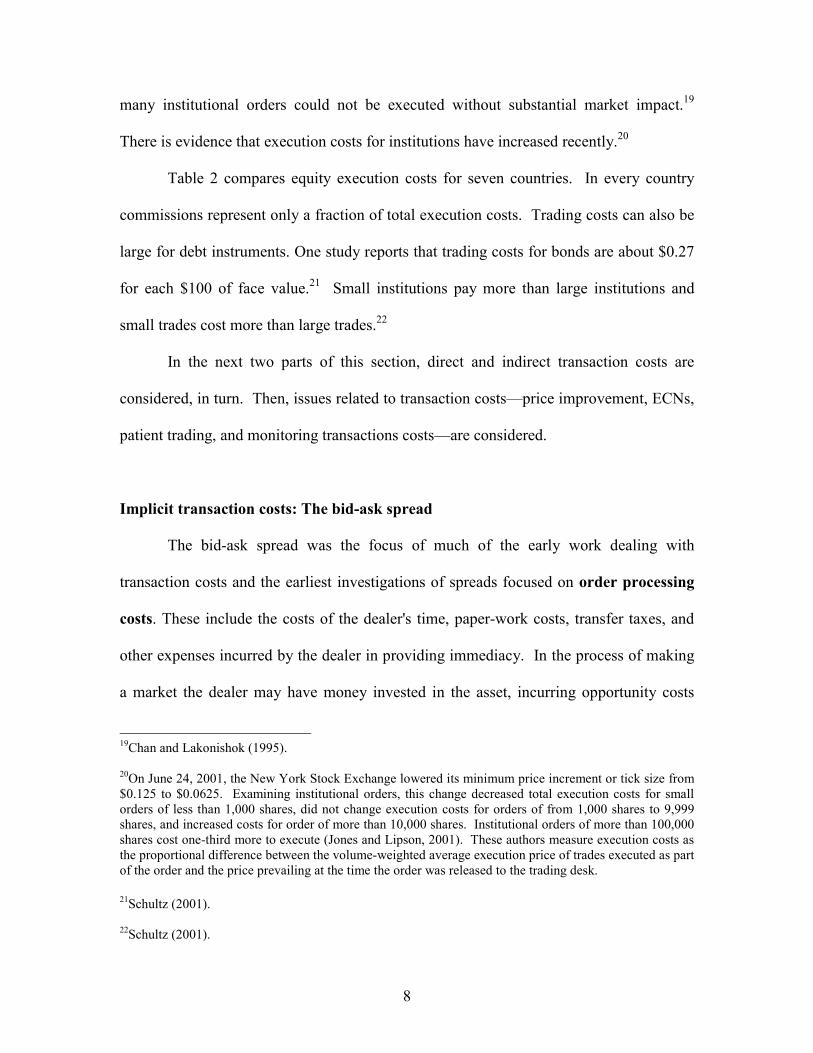
many institutional orders could not be executed without substantial market impact.19
There is evidence that execution costs for institutions have increased recently.20
Table 2 compares equity execution costs for seven countries. In every country
commissions represent only a fraction of total execution costs. Trading costs can also be
large for debt instruments. One study reports that trading costs for bonds are about $0.27
for each $100 of face value.21 Small institutions pay more than large institutions and
small trades cost more than large trades.22
In the next two parts of this section, direct and indirect transaction costs are
considered, in turn. Then, issues related to transaction costs—price improvement, ECNs,
patient trading, and monitoring transactions costs—are considered.
Implicit transaction costs: The bid-ask spread
The bid-ask spread was the focus of much of the early work dealing with
transaction costs and the earliest investigations of spreads focused on order processing
costs. These include the costs of the dealer's time, paper-work costs, transfer taxes, and
other expenses incurred by the dealer in providing immediacy. In the process of making
a market the dealer may have money invested in the asset, incurring opportunity costs
19Chan and Lakonishok (1995). 20On June 24, 2001, the New York Stock Exchange lowered its minimum price increment or tick size from $0.125 to $0.0625. Examining institutional orders, this change decreased total execution costs for small orders of less than 1,000 shares, did not change execution costs for orders of from 1,000 shares to 9,999 shares, and increased costs for order of more than 10,000 shares. Institutional orders of more than 100,000 shares cost one-third more to execute (Jones and Lipson, 2001). These authors measure execution costs as the proportional difference between the volume-weighted average execution price of trades executed as part of the order and the price prevailing at the time the order was released to the trading desk. 21Schultz (2001). 22Schultz (2001).
8

that contribute to order processing costs. Another cost of providing immediacy is
inventory holding costs, dealer losses resulting from a positive or negative inventory
position.23
More recently, a third cost incurred by dealers who provide immediacy has
received attention, namely, asymmetric information costs.24 Some investors are likely
better informed than the dealer. When these informed investors buy from the dealer,
subsequently, prices are likely to rise. And when informed investors sell to the dealer,
subsequently, prices are likely to decline. Therefore, in dealing with informed investors
the dealer is buying just before price decreases and selling just before price increases.25
A buy transaction arriving after a long time interval has a lower price impact than a buy
transaction arriving right after a previous buy. Because informed traders typically seek to
trade quickly before their information becomes generally known, liquidity suppliers infer
a higher likelihood of traders being informed if the trades are close together.26
23Inventory holding costs are the costs incurred or anticipated by a dealer as a result of inventory positions acquired in the process of market making. An example of the inventory holding cost model is provided by Ho and Stoll (1981) who propose that after a dealer purchase bid prices are lowered to discourage additional sales and ask prices are also lower to encourage purchases from the dealer. Thus, the new bid and ask prices must reflect prices that make the dealer indifferent between a transaction at the bid and a transaction at the ask. 24Asymmetric information costs are the costs incurred or anticipated by a dealer as a result of trading with counterparties who are motivated by the possession of superior insight into the appropriate equilibrium price of the asset. Of course, the loss to the less knowledgeable party is the gain to the party with superior insight. A trader with knowledge that current prices are not at true value would is motivated to trade immediately rather than provide liquidity to others. 25If this were not the case the market maker’s counterparties would not truly be informed. For examples of asymmetric information models see Copeland and Galai (1983) and Glosten and Milgrom (1985). 26Dufour and Engle (2000). There is evidence that order processing costs have little intra- or inter-day variation, but adverse selection costs are high at the beginning and end of the trading day relative to the middle of the day. Adverse selection costs are also higher on Mondays than on other days of the week for actively traded firms.
9
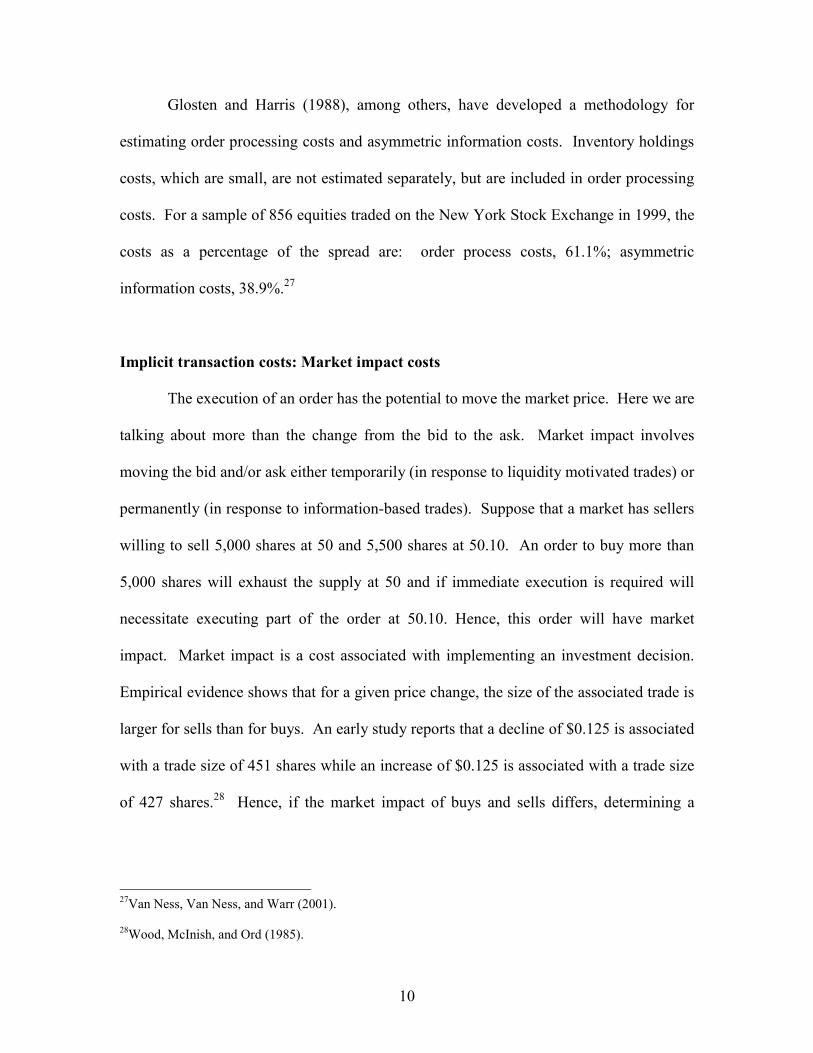
Glosten and Harris (1988), among others, have developed a methodology for
estimating order processing costs and asymmetric information costs. Inventory holdings
costs, which are small, are not estimated separately, but are included in order processing
costs. For a sample of 856 equities traded on the New York Stock Exchange in 1999, the
costs as a percentage of the spread are: order process costs, 61.1%; asymmetric
information costs, 38.9%.27
Implicit transaction costs: Market impact costs
The execution of an order has the potential to move the market price. Here we are
talking about more than the change from the bid to the ask. Market impact involves
moving the bid and/or ask either temporarily (in response to liquidity motivated trades) or
permanently (in response to information-based trades). Suppose that a market has sellers
willing to sell 5,000 shares at 50 and 5,500 shares at 50.10. An order to buy more than
5,000 shares will exhaust the supply at 50 and if immediate execution is required will
necessitate executing part of the order at 50.10. Hence, this order will have market
impact. Market impact is a cost associated with implementing an investment decision.
Empirical evidence shows that for a given price change, the size of the associated trade is
larger for sells than for buys. An early study reports that a decline of $0.125 is associated
with a trade size of 451 shares while an increase of $0.125 is associated with a trade size
of 427 shares.28 Hence, if the market impact of buys and sells differs, determining a
27Van Ness, Van Ness, and Warr (2001). 28Wood, McInish, and Ord (1985).
10

cross-trade price by, say, taking the midpoint of the bid and ask, may be unfair to one of
the parties.
It may take several days to execute an order. There is a trade off between market
impact costs and delay costs. Table 1 shows that delay costs are much larger than
commissions and, in fact, are almost 60% larger than commissions and market impact
combined (0.60/0.38 = 1.58). Opportunity costs result when the order cannot be
completed due to market price movements or other factors. Table 1 shows that for one
sample the opportunity costs of the ten percent of trades not completed were twenty
percent greater than commissions.
Block trades
A block trade is commonly defined as a trade of 10,000 shares or more.
According to one study, the price impact of block trades on Nasdaq is -0.55% for sales
and 0.53% for purchases. Comparable figures for the NYSE are –0.48% for sales and
0.46% for purchases.29
The relationship between trade size and transaction cost is not as simple as larger
trades cost more. In fact, one study reports “no evidence that larger trades are associated
with higher indirect execution costs.”30 Larger trades have greater impact, but the
relationship between trade size and market impact is not linear in trade size.31 The
information content of a block trade increases with trade size using earnings forecast
29LaPlante and Muscarella (1997). 30Block, French, and McInish (1994). 31Koski and Michaely (2000).
11

errors as a proxy for information asymmetry.32 Large trades have a greater price impact
during times when asymmetric information is greatest.33
Buys and sells have different market impact. A price change of 1/4 is associated
with an average trade size of more than 1,400 for a price increase and more than 1,700
shares for a price decrease.34 Researchers have found that block purchases have a larger
permanent price impact than block sales.35 Similar results are reported for institutional
trades.36 Prices go up on purchases and down on sales, but the sale prices quickly revert
to their pre-trade price while the increased prices due to purchases are permanent.37 The
effects of transactions and cumulative order activity on the price schedule increase as the
average trading volume decreases.38
The probability of information based trading is lower in high volume stocks.
High volume stocks tend to have a higher incidence of information events than low
volume stocks, leading to a higher arrival rate of informed traders. But the effects of the
higher arrival rate of informed traders are more than offset by an even higher rate of
arrival of liquidity traders.39 The majority of trades are small, but most of the cumulative
stock-price change is due to medium-sized orders. Informed traders would prefer to trade
32Seppi (1992). 33Koski and Michaely (2000). 34Wood, McInish and Ord (1985). 35Kraus and Stoll (1972) and Keim and Madhavan (1996). 36Chan and Lakonishok (1993). 37Chan and Lakonishok (1993). 38Kavajecz and Odders-White (2001). 39Easley, Kiefer, O’Hara, and Paperman (1996).
12

in moderate size because a very large order attracts attention and a small order does not
allow the accumulation of enough shares.40 The source of these medium-sized trades that
generate most of the cumulative returns is institutions.41
An upstairs market is a market in which larger orders are given special handling.
On the NYSE brokers in the upstairs market can solicit counterparty orders, a practice not
permitted on the trading floor. On the Toronto Stock Exchange most of the orders that
are executed in the upstairs market are liquidity motivated so that they have no
information content. Orders for blocks that have information content are executed
through the normal computer process.42 The upstairs market plays an important role in
identifying liquidity-motivated orders, which then receive more favorable executions.43
In the U.S. a significant fraction of large-block trades in equities are accomplished
through the upstairs market. One study reports that for block trades executed in the
upstairs market:
�� there is significant price movement prior to the trade, indicating information
leakage as the block is shopped,
�� the market impact of Nasdaq trades is considerably greater than for trades
exposed to an exchange floor,
40Barclay and Warner (1993). 41Chakravarty (2001). 42Like many exchanges throughout the world, the Toronto Stock Exchange executes trades through a computerized central limit order book system and does not operate a trading floor. The Toronto Stock Exchange pioneered computer-based trading, launching the world's first computerized trading system in 1977, but thick (actively-traded) stocks continued to be traded on the exchange floor until it was closed in 1997. 43The Toronto Stock Exchange operates an electronic trading system. Dealers in the upstairs market can ask more questions about the parties initiating an order. As a result “the upstairs market almost entirely screens out any trades motivated by adverse information” Smith, Turnbull, and White (2001, p. 1724).
13

�� temporary price impacts are significant for seller-initiated trades, but not for
buyer-initiated trades, and
�� medium-sized trades had more market impact than larger- or smaller-sized
trades.44
A study of upstairs trading on the Paris Bourse45 finds strong evidence that: “(1)
upstairs brokers lower the risk of adverse selection by certifying block orders as
uninformed, (2) upstairs brokers are able to tap into pools of "hidden" or "unexpressed"
liquidity, (3) traders strategically choose across the upstairs and downstairs markets to
minimize expected execution costs, (4) trades are more likely to be routed upstairs if they
are large, or are in stocks with less overall liquidity, and (5) buyer-initiated trades are less
welcome and pay higher costs in the upstairs markets.” Further, “those trades selectively
routed upstairs pay lower execution costs.”46
Market architecture: Price improvement
On the New York Stock Exchange market orders frequently perform better than
the prevailing opposite side quote, indicating that these orders receive what the NYSE
terms “price improvement.”47 In markets where the spread equaled the minimum tick
size, at-the-quote limit orders achieved price performance superior to market orders, but
44Keim and Madhavan (1996). 45Bessembinder and Venkataraman (2001). 46Bessembinder and Venkataraman (2001). 47Harris and Hasbrouck (1996).
14
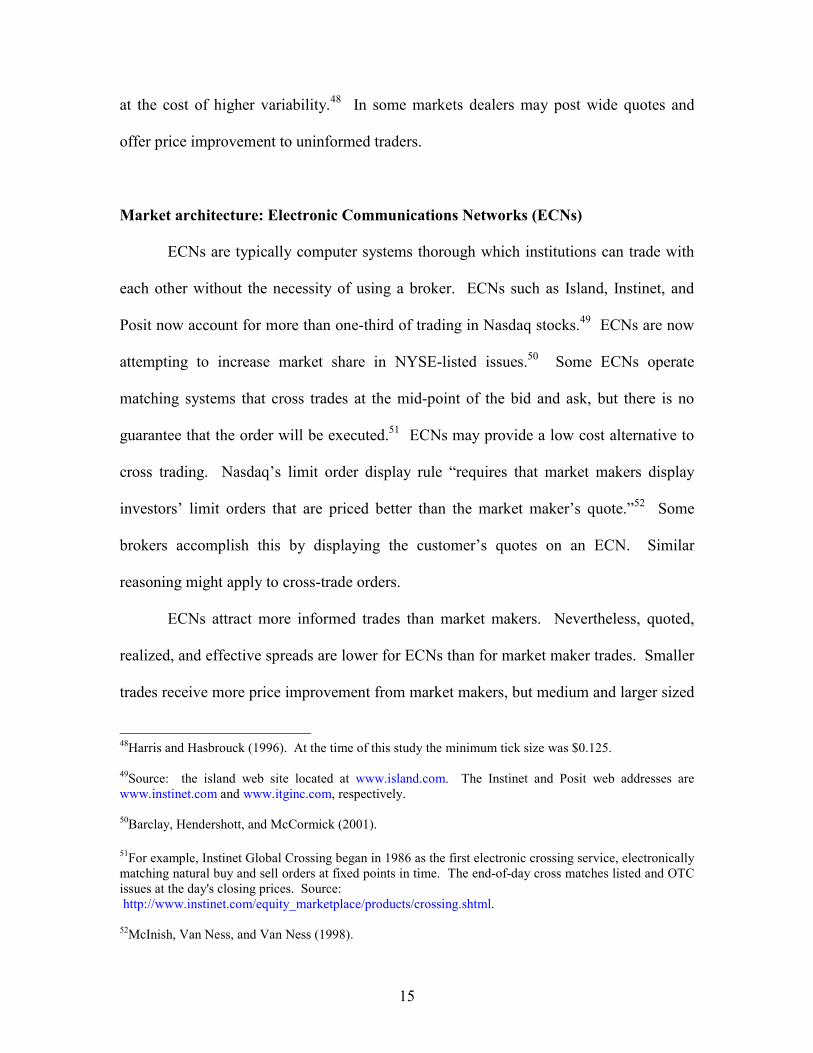
at the cost of higher variability.48 In some markets dealers may post wide quotes and
offer price improvement to uninformed traders.
Market architecture: Electronic Communications Networks (ECNs)
ECNs are typically computer systems thorough which institutions can trade with
each other without the necessity of using a broker. ECNs such as Island, Instinet, and
Posit now account for more than one-third of trading in Nasdaq stocks.49 ECNs are now
attempting to increase market share in NYSE-listed issues.50 Some ECNs operate
matching systems that cross trades at the mid-point of the bid and ask, but there is no
guarantee that the order will be executed.51 ECNs may provide a low cost alternative to
cross trading. Nasdaq’s limit order display rule “requires that market makers display
investors’ limit orders that are priced better than the market maker’s quote.”52 Some
brokers accomplish this by displaying the customer’s quotes on an ECN. Similar
reasoning might apply to cross-trade orders.
ECNs attract more informed trades than market makers. Nevertheless, quoted,
realized, and effective spreads are lower for ECNs than for market maker trades. Smaller
trades receive more price improvement from market makers, but medium and larger sized
48Harris and Hasbrouck (1996). At the time of this study the minimum tick size was $0.125. 49Source: the island web site located at www.island.com. The Instinet and Posit web addresses are www.instinet.com and www.itginc.com, respectively. 50Barclay, Hendershott, and McCormick (2001). 51For example, Instinet Global Crossing began in 1986 as the first electronic crossing service, electronically matching natural buy and sell orders at fixed points in time. The end-of-day cross matches listed and OTC issues at the day's closing prices. Source: http://www.instinet.com/equity_marketplace/products/crossing.shtml. 52McInish, Van Ness, and Van Ness (1998).
15

trades receive better prices for executions on ECNs. This suggests that institutions route
their orders dynamically to ECNs when depth is sufficient.53
Urgency of the order: Patient trading
One way to reduce transactions costs is to supply liquidity by executing orders
using limit orders rather than market orders. Limit orders are described in appendix 1
and the patient-trading program of RJR Investment Management is described in appendix
3. Many limit orders are not executed so that there is a trade-off between the better price
for executed orders and the loss due to unexecuted orders. Nevertheless, a study of the
trades of 37 large institutions found that investment styles that required less patient
execution of orders resulted in larger price impact and execution costs.54 One study
reports that the best limit order strategies for reducing transaction costs are the most
frequently used strategies.55
Monitoring transaction costs
ERISA stimulated an interest in measuring and monitoring transaction
costs. Several firms including Abel/Noser Corporation and Plexus Group provide
investment managers with analysis and tools for analyzing transaction costs. Plexus has
about 200 clients who collectively manage nearly $4.5 trillion dollars in equities. Plexus
clients also include a small number of plan sponsors. As mentioned above, many
53Barclay, Hendershott, and McCormick (2001). 54Chan and Lakonishok (1995). 55Harris and Hasbrouck (1996).
16

investment managers also have systems for monitoring other aspect of the trade process
such as the way transactions for multiple clients are mapped into specific accounts.
Investment managers subject to the Investment Company Act of 1940 are inspected by
the Securities and Exchange Commission.
4. Liquidity
Liquidity is the “the ability to buy and sell an asset readily without substantial
impact on its price and at low cost.”56 Liquidity is also closely connected with
transaction costs since liquidity determines market impact costs. And the liquidity of buy
and sell orders typically differs. The Chicago Board Options Exchange changed the
settlement price of many of its index contracts from the close to the open because of the
open’s greater liquidity. Liquidity is also a concern on international exchanges. Japanese
equities are traded on the Tokyo Stock Exchange in a morning and afternoon session.
Stock returns and spreads tend to be high at the beginning of trading in the morning and
at the end of trading in the afternoon. Volume tends to be higher at the beginning and
end of each of the two sessions.57 The Tokyo Stock Exchange operates an elaborate
system for advertising order imbalances, generating liquidity from its member firms and
slowing down the trading process when liquidity imbalances occur.58
56McInish (2000, p. 34). 57Hamao and Hasbrouck (1995). 58Lehmann and Modest (1994). The Tokyo Stock Exchange limits the size of price changes between consecutive trades and also the maximum price change from the precious close. If two orders arrive on the same side of the market that would require execution with a price change larger than the permitted price variation the orders will eventually be executed after one or more indicative quotes by an exchange official.
17

5. Intraday patterns
In the mid-1980s finance academics studying U.S. equities discovered that over
the trading day there are U-shaped patterns in returns (Figure 1), volatility of returns
(Figure 3), volume (Figure 5), bid-ask spreads (Figure 8), and the ask (Figure 10).
Returns are high at the beginning of the day, level off, and increase somewhat at the end
of the day. A majority of the market return is concentrated in the first thirty minutes of
the trading day.59
Similar patterns exist in non-U.S. equities (Figures 2, 4, 6, 7, 9, and 11),60 debt
(Figure 12),61 and foreign exchange (Figure 13).62 Liquidity is high at the beginning of
trading, levels off, and increases near the end of trading, but is still lower than at the
beginning of the trading day. Stocks that are traded on markets outside their home
country tend to follow the intraday pattern of the market on which trading occurs.63 The
existence of these intraday patterns raises a number of issues that are relevant to cross
trading.
59Wood, McInish, and Ord (1985), McInish and Wood (1990, 1992), and Jain and Joh (1988). 60See Hamao and Hasbrouck (1995) for Japanese evidence and McInish and Wood (1990) for Canadian evidence. 61Cyree and Winters ( 2001). 62Goodhart and Antomis (1991). 63Werner and Kleidon (1996).
18

The trading process
The existence of intraday patterns means that the decision of when to trade during
the day is a strategic decision made by the trader.64 Selection of an arbitrary time to trade
or to price a trade necessarily eliminates any potential gain from superior execution
strategy.
When an institutional investment manager makes a decision to buy or sell, the
order is typically given to the firm's trader for execution. Also, when a brokerage firm's
retail or institutional salesperson receives an order, that order is transmitted to the
brokerage firm's trader (traders work at a trading desk) for execution. Hence, in this
usage a trader is an employee of a firm charged with the task of executing a buy or sell
order.
The relative importance of brokerage commissions and indirect costs have
implications for the strategies portfolio managers use to minimize execution costs. In
evaluating the quality of execution services provided by brokerage firms, it must be kept
in mind that, despite their importance, transaction costs are not the only concern of
brokerage firm clients. Another and probably more important concern is best execution.
According to the National Association of Security Dealers:
“In any transaction for or with a customer, a member ... shall use reasonable
diligence to ascertain the best inter-dealer market for the subject security and buy
or sell in such market so that the resultant price to the customer is as favorable as
possible under prevailing market conditions.”65
64Many portfolio managers are not knowledgeable about these intraday patterns and, consequently, submit orders to traders late in the day, missing much of the day’s liquidity (Plexus Group, 2002). 65NASD Rules of Fair Practice, NASD Manual (CCH), Art. III, Sec. 1, ¶ 2151.03.
19

But best execution does not necessarily mean best price because the customer may have
other priorities such as speed of execution. Also, there may be differences from one firm
to another in the routing by which the order is conveyed from the customer to the trader
so that market conditions may cause customers who place orders with different firms to
receive different prices. In comparing the execution costs of one firm with another, an
inferior execution is an additional cost that must be taken into account.66
Wagner and Banks (1992, p. 9) identify four factors that increase transaction
costs:
�� “Speed: Faster trades may demand more supply than is readily available.
�� Size: Similarly, size of trade can overwhelm the marker's ability to
accommodate the transaction.
�� Momentum: It will be more expensive to buy a stock in a crowd of buyers
than in a crowd of sellers.
�� Liquidity: Thin or dull markets extract higher transaction costs than markets
that are robust and vibrant."
One study reports that there is a large stochastic component to quote exposure
costs relative to the deterministic intraday “U” shape. The implication is that trading
strategies must assess current market conditions rather than just focusing on the time of
the day.67
66 Macey and O'Hara (1996). 67Hasbrouck (1999).
20

U-shaped patterns and execution timing for cross trades
For actively managed accounts, decisions to buy or sell might be made following
an assessment of individual stock or market conditions. The occurrence of certain
triggers might motivate transactions for index and similar accounts. If buy and sell
decisions are made throughout the day, there is a likelihood that the two sides of a
potential cross will materialize at different times. If cross trades are available, managers
might be tempted to alter their strategies to synchronize the various decision points to the
detriment of certain plans.
End-of-day pricing
There are a number of problems associated with the choice of the end-of-the day
price as a benchmark. We focus on U.S. and Canadian equities markets, but similar
considerations might apply internationally and to non-equity assets. The intraday U-
shaped patterns in returns and spreads indicate that the closing price of the day comes
from a different distribution than other intraday prices.68 This may be explained, at least
in part, by the finding that the last trade of the day is more likely to be at the ask than at
the bid in both the U.S. and Canada (figures 10 and 11).69 70 Also, following stock splits
there are numerous small buyers and fewer small sellers, which causes closing prices to
occur more frequently at the ask price and specialists’ spreads to increase.71
68Wood, McInish, and Ord (1985), McInish and Wood (1992). 69Porter (1992). 70Lawrence (1989) and Porter (1992). 71Conrad and Conroy (1994). The increase in specialists’ spreads may be due to the need for increased inventory.
21

Liquidity is lower at the end of the trading day than at the beginning. In a thinner
market prices are more easily manipulated by the placing of small orders. The
problematic nature of using closing prices as benchmarks can be seen in that on the New
York Stock Exchange, orders executed at the open for small liquidity traders consistently
produce better prices than market or limit orders executed later in the day. Avoiding the
continuous market is so effective a strategy for small liquidity traders that it even pays to
wait overnight to execute at the next day’s open.72
ECNs account for a large share of transaction volume for many Nasdaq stocks,
but their prices are often not considered in determining end-of-the-day prices.
Moreover, according to the Option Clearing Corporation, “investors should also be aware
that there is no single opening or closing price for securities primarily traded on the
NASDAQ stock market.”73,74
72Brooks and Su (1997). 73Characteristics and Risks of Standardized Options (1994, p. 28). 74For the opening trade, the New York Stock Exchange and American Stock Exchange have a call market mechanism that batches all buy and sell orders accumulated overnight and executes them at a single price. In contrast, the Nasdaq opening prices are really the 9:29:59 a.m. inside bid and ask prices. Usually, the first trade price is at the ask if a buy execution is the first trade of the day or at the bid price if a sell execution is the first trade of the day. This is somewhat random, so there is no official Nasdaq opening trade price. Additionally, some Nasdaq market makers run their own opening batch. So, a trader who wants a batched opening price can send orders to the market makers that cross customer orders at the open on Nasdaq. It is not a market-wide mechanism like the NYSE or Amex, but orders can still get the benefit of crossing with other customers without the delays and costs associated with forcing every order through one market center. Greene and Watts (1996) find that the first trade on both Nasdaq and the NYSE account for most of the price response to overnight events. Traders can place a market-on-close order (MOC) order on the NYSE. These orders will be crossed, but any excess of supply or demand can be executed against the prevailing bid or ask, depending on the side of the imbalance, so that MOC orders may not actually receive the last trade price of the day. All Nasdaq securities have closing prices and it is possible to submit market on close orders to market makers that are executed at these prices (not all market makers accept market on close orders, however). Nasdaq does not have a closing call auction like the New York Stock Exchange and the American Stock Exchange, but you can still execute at the Nasdaq closing price using a market maker that accepts MOC orders. MOC orders are common on Nasdaq.
22

6. Discussion
To begin, it may be useful to consider how a transfer price for a cross trade might
be determined. Suppose that a dealer is bidding $50 for a particular security. As
discussed above, this quote is for a particular quantity. A larger quantity might result is
an inferior price, which is called market impact cost.75 On the other hand the $50 quote
is made not knowing anything about the potential counterparty and, hence, must cover
potential asymmetric information costs. If the dealer could be certain that the trader was
a liquidity trader, a higher price might be offered. This is the source of price
improvement achieved in many dealer markets, in the upstairs market (for large blocks),
and in ECN matching procedures. Both the quoted bid and ask are subject to these
considerations.
Consider two ERISA plans with a potential cross trade for a normal size block of
a liquid security. At a minimum the commission would be saved. Since both sides are
liquidity traders price improvement from the market would be warranted. However, such
price improvement might not be forthcoming. On the Stock Exchange of Singapore the
minimum tick size for many stock is ten cents (Singapore currency). Hence, the best
price that could be achieved would be a ten cent differential between the purchase and
sale price. Ability to cross trade insures saving not only the commission (which is fixed
and relatively high in many international markets) but also the asymmetric information
costs. A cross trade at the average of the bid and ask makes sense.
75An order for an odd lot might also receive an inferior price. An odd lot is a quantity that is less than the usual unit of trading. An order for $500,00 face amount of bonds might be an odd lot in some markets.
23

If both sides of the trade are equally motivated, it makes sense to simply use the
average of the bid and ask price as the cross trade price. However, in some
circumstances one side of the trade may be more motivated that the other. Consider a
manager of two ERISA plans, one of which needs to raise funds to pay participants and
plans to sell an illiquid security. The quoted market price is considered low. In fact the
price represents such a “good deal” that the ERISA manager would like to purchase the
security in a second ERISA plan. The second plan may not have sufficient cash, but can
sell very marketable securities to raise the needed funds. In this case, the second fund
incurs extra costs to purchase the securities and is motivated to make this investment only
because obtaining these securities at such a good price will enhance the return of the
fund. In this case the average of the quoted bid and ask in the market would not represent
a fair price for the second fund. Instead, the second fund should probably receive the
entire benefit of the “good price.”
Several conclusions can be made from the foregoing presentation in this section
and previously.
If cross trading were permitted, the realized savings to ERISA plans would no
doubt be economically substantial, amounting to many millions of dollars for all
plans together.
On the other hand there is risk of potential abuse of cross trades:
1. In the absence of an actual market trade, it will be impossible to know what
price each counterparty would have paid or received. There are simply too
many variables involved, including the extent of market impact costs, whether
24
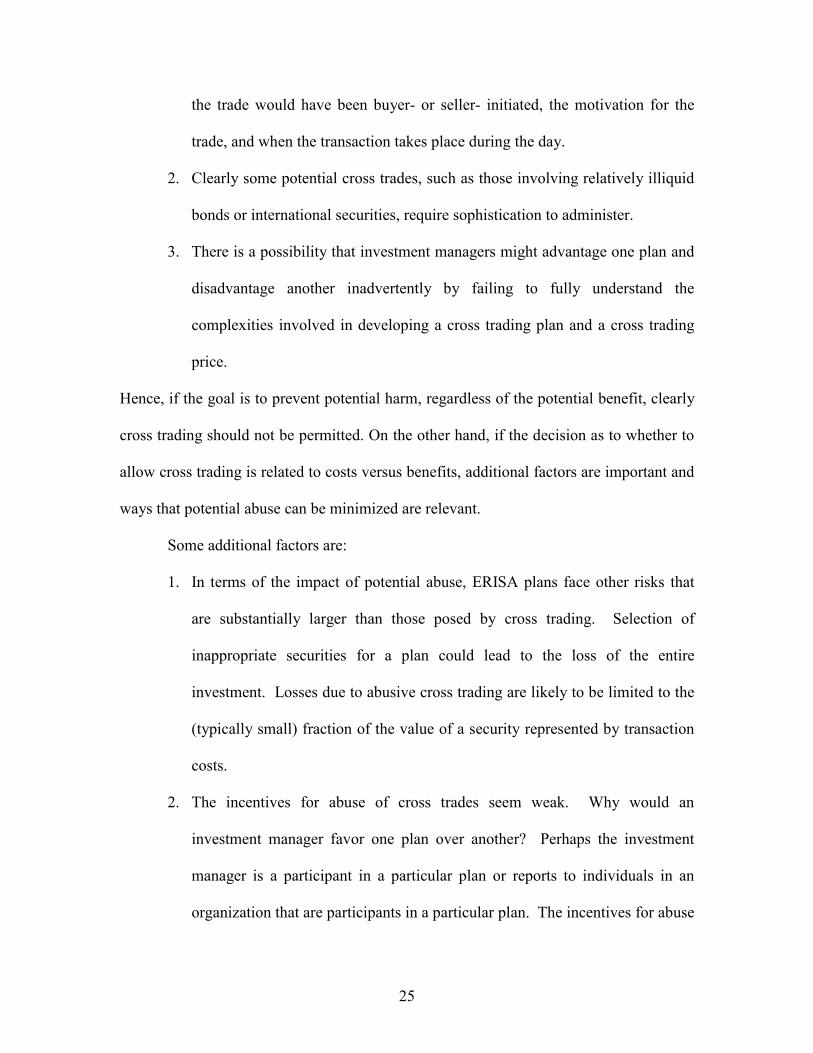
the trade would have been buyer- or seller- initiated, the motivation for the
trade, and when the transaction takes place during the day.
2. Clearly some potential cross trades, such as those involving relatively illiquid
bonds or international securities, require sophistication to administer.
3. There is a possibility that investment managers might advantage one plan and
disadvantage another inadvertently by failing to fully understand the
complexities involved in developing a cross trading plan and a cross trading
price.
Hence, if the goal is to prevent potential harm, regardless of the potential benefit, clearly
cross trading should not be permitted. On the other hand, if the decision as to whether to
allow cross trading is related to costs versus benefits, additional factors are important and
ways that potential abuse can be minimized are relevant.
Some additional factors are:
1. In terms of the impact of potential abuse, ERISA plans face other risks that
are substantially larger than those posed by cross trading. Selection of
inappropriate securities for a plan could lead to the loss of the entire
investment. Losses due to abusive cross trading are likely to be limited to the
(typically small) fraction of the value of a security represented by transaction
costs.
2. The incentives for abuse of cross trades seem weak. Why would an
investment manager favor one plan over another? Perhaps the investment
manager is a participant in a particular plan or reports to individuals in an
organization that are participants in a particular plan. The incentives for abuse
25
in these types of cases are no larger than numerous other decisions made in
the investment process.
Also, there are ways that ERISA plans can reduce the risk arising from cross
trades:
1. If permitted, limiting cross trading to large sophisticated plans such as
INHAMs will retain most of the savings while limiting risk.
a. Large plans will experience greater savings not only because
they are larger, but also because cross trading opportunities
increase at a faster rate than plan size.
b. If there were an abuse of cross trading by larger plans, the
aggregate size of the potential loss will also be larger, but there
is no reason to believe that this would result in a greater impact
on individual participants and beneficiaries because such
impact is related solely to the size of each of their accounts.
However, abuses by a larger plan might have a greater impact
on society as a whole.
2. Clearly, an ERISA plan engaging in cross trading will need a written
plan. Such a plan needs to include a description of the normal trading
strategy and normal holdings of the plan, how and under what
circumstances a decision to cross trade will be made, and how the
cross trading price will be calculated.
3. Since large INHAMS are associated with even larger organizations,
these firms would likely have the incentive and expertise to monitor
26
the INHAM investment managers. However, this monitoring may be
weaker than for mutual funds where stockholders, potential
stockholders, and independent organizations such as Morningstar
monitor performance. Moreover, mutual fund inflows and outflows,
which affect the compensation of the investment manager, often are
determined by performance. In contrast, incentives and capabilities
for individual plan participants to monitor ERISA plans are often
limited. Cross trading exemption might be contingent on certification
by the INHAM’s parent that it is monitoring cross trading. There is
also the possibility of requiring an outside entity, preferably one with
trading expertise, to monitor cross trading or even to certify the cross
trade price.
7. Conclusions
Cross-trades in which an investment manager exchanges assets between two
accounts without going through a public market are prohibited by ERISA unless
consummated pursuant to an exemption. There have been numerous requests for
exemptions motivated by a desire to reduce transaction costs, which typically range from
one to four percent.
Insights into the potential savings due to cross trades can be gleaned from
examination of mutual funds, which are permitted to cross trade under Rule 17a-7. Some
cross trading opportunities arise due to movements of funds from one fund to another.
Disagreements among managers about the desirability of holding given securities give
27
rise to many cross trading opportunities. Conversations with mutual fund managers reveal
that savings due to cross trades are economically substantial and amount to millions of
dollars for some funds.
The academic literature dealing with the way financial markets are organized and
how this organization affects prices, trading costs, and other market characteristics offers
insights relevant to cross-trading. A number of regularities in intraday prices, including
U-shaped patterns in returns and volume, have been discovered. There are other
systematic features of trading such as the tendency of the last trade of the day to be on the
ask. Collectively, these features of trading add to the possibility that cross-trading will
disadvantage one of the counterparties. The cost savings from allowing cross trades must
be balanced with the potential harm from disadvantaging one party.
28

Appendix 1
Types of orders and the supply of liquidity
A market order is an order to be executed immediately at the best possible price.
Traders placing market orders are demanding immediacy. In some markets under some
circumstances, two market orders may cross. But under most circumstances for a trade to
occur there must be a counterparty willing to supply immediacy. Immediacy can be
supplied by dealers who stand ready to buy and sell (Nasdaq and foreign exchange
dealers), by market participants designated by an exchange (NYSE specialists), by a
crowd of traders (Chicago Mercantile Exchange and the Chicago Board of Trade floor
traders), or by other traders through a limit order book. A limit order is an order to be
executed at a specified price or better (a better price is a lower price if buying and a
higher price if selling). A limit order with a specified price that allows for immediate
execution is called a marketable limit order. A limit order that cannot be executed
immediately must be held for later execution. The accumulated unexecuted limit orders
are called the limit order book. In market with a limit order book, individuals and
institutions that prefer to trade only when they can respond to a trade from the other side
rather than initiating a trade can also supply immediacy. These market participants are
referred to as patient traders. The patient-trading program of RJR Management is an
excellent illustration of this approach (see appendix 3).76
Some markets operate without limit order books (such as the foreign exchange
market and Nasdaq77). Limit order books may coexist along with other providers of
76Bodurtha and Quinn (1989). 77Nasdaq dealers are required to display customer limit orders, but these are not collected in a single location to form a central or consolidated limit order book.
29
immediacy such as specialists on the New York Stock Exchange. The goal of the
specialists and dealers is to make a profit from supplying immediacy.78 On computer-
based exchanges such as the Australian Stock Exchange the limit order book is typically
the sole source of immediacy. Orders executed on computer-based exchanges are always
between one party who placed a marketable limit order and another party who had an
order standing in the limit order book. Price improvement is not possible on computer-
based exchanges.
78On the New York Stock Exchange the specialist must stand ready to act as the counterparty to a market order if no other counterparty is available. On Nasdaq each stock must have a minimum of two dealers who are willing to act as counterparties to market orders to buy or sell.
30
Appendix 2
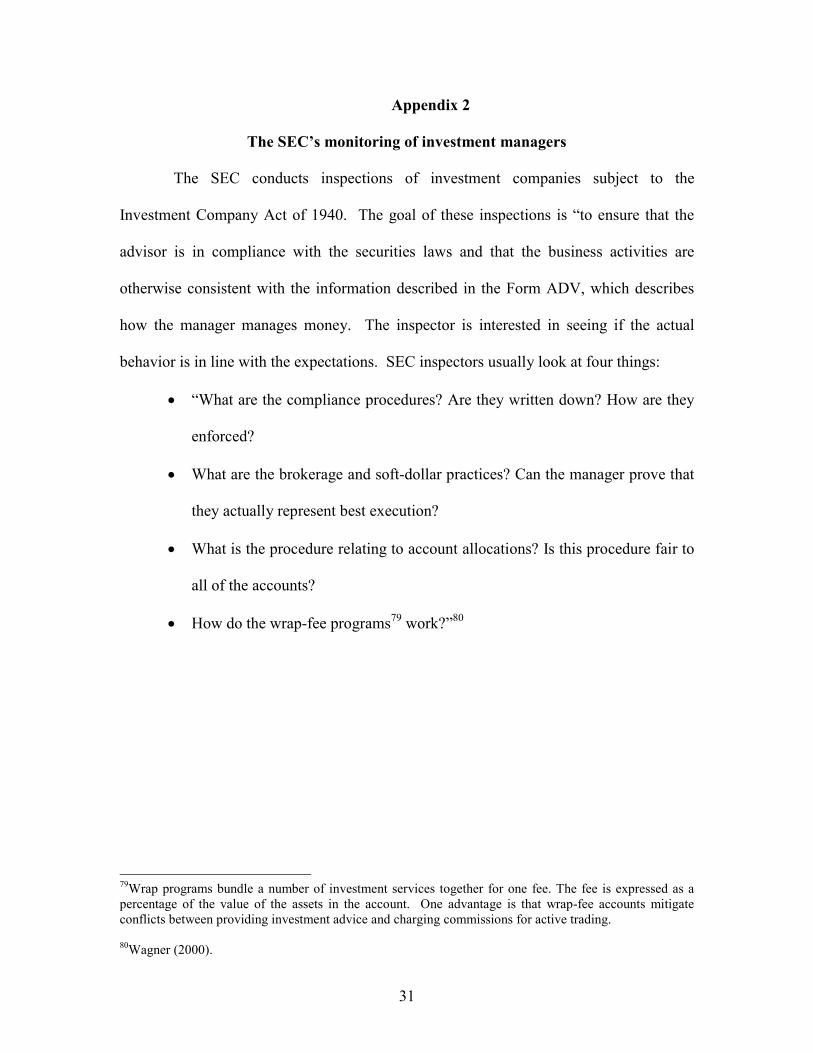
The SEC’s monitoring of investment managers
The SEC conducts inspections of investment companies subject to the
Investment Company Act of 1940. The goal of these inspections is “to ensure that the
advisor is in compliance with the securities laws and that the business activities are
otherwise consistent with the information described in the Form ADV, which describes
how the manager manages money. The inspector is interested in seeing if the actual
behavior is in line with the expectations. SEC inspectors usually look at four things:
�� “What are the compliance procedures? Are they written down? How are they
enforced?
�� What are the brokerage and soft-dollar practices? Can the manager prove that
they actually represent best execution?
�� What is the procedure relating to account allocations? Is this procedure fair to
all of the accounts?
�� How do the wrap-fee programs79 work?”80
79Wrap programs bundle a number of investment services together for one fee. The fee is expressed as a percentage of the value of the assets in the account. One advantage is that wrap-fee accounts mitigate conflicts between providing investment advice and charging commissions for active trading. 80Wagner (2000).
31

Appendix 3
RJR Investment Management patient trading strategy
When RJR Investment Management established a self-managed 40 million USD
small capitalization investment fund, the projected costs of acquiring the 250 stocks
sought for the portfolio were 2.5% to 3.5% of asset value.81 Instead of buying these
shares aggressively using market orders, the company developed a plan to buy the
portfolio using limit orders as much as possible. RJR used the Perold (1988)
implementation shortfall approach to evaluate the cost of acquiring the portfolio.
Following this methodology, RJR compared the performance of two portfolios. The first
comprised the stocks actually acquired at their actual acquisition prices and times. The
second comprised a hypothetical portfolio using prices that would have been paid if the
stocks had been purchased immediately. The difference between the two is the gain or
loss as a result of the trading decisions. The performance of the actual portfolio was
adjusted to reflect market movements comparable to those of the paper portfolio.
Comparing the actual cost with the expected cost of 2.5% to 3.5%, the patient program
saved 0.36% to 1.37% percentage points of the overall transaction costs.
81Bodurtha and Quinn (1989).
32

References
Barclay, Michael J., and Jerold B. Warner, 1993, Stealth trading and volatility: Which trades move prices? Journal of Financial Economics 34, 281-305. Barclay, Michael J., Terrance Hendershott, and D.Timothy McCormick, 2001, Electronic communications networks and market quality, Working paper, University of Rochester, Rochester, NY. Bessembinder, Hendrik, and Kumar Vankataraman, 2001, Does an electronic stock exchange need an upstairs market?, Working paper, University of Utah. Block, Stanley B., Dan W. French, and Thomas H. McInish, 1994, NYSE execution costs: A case study of a leading bank, Journal of Financial Research 8, 163-175. Bodurtha, Stephen G., and Thomas E. Quinn, 1989, The patient program trade: A case study in measuring and lowering portfolio trading costs, New York: Kidder, Peabody and Company. Brooks, Raymond M., and Tie Su, 1997, A simple cost reduction strategy for small liquidity trades: Trade at the opening, Journal of Financial and Quantitative Analysis 32, 525-540. Chakravarty, Sugato, 2001, Stealth-trading: Which traders’ trades move stock prices? Journal of Financial Economics 61, 289-307. Chan, Kalok, and Wai-Ming Fong, 2000, Trade size, order imbalance, and the volatility-volume relation, Journal of Financial Economics 57, 247-273. Chan, Louis K.C, and Joseph Lakonishok, 1993, Institutional trades and intraday stock price behavior, Journal of Financial Economics 33, 173-199. Chan, Louis K.C., and Joseff Lakonishok, 1995, The behavior of stock prices around institutional trades, Journal of Finance 50, 1147-1174. Chang, Rosita P., Toru Fukuda, S. Ghon Rhee, and Makoto Takana, 1993, Intraday and interday behavior of the TOPIX, Pacific Basin Finance Journal 1, 67-95. Conrad, Jennifer S., and Robert Conroy, 1994, Market microstructure and the ex-date return, Journal of Finance 49, 1507-1519. Copeland, Thomas E., and Daniel Galai, 1983, Information effects on the bid-ask spread, Journal of Finance 38, 1457-1469.
33

Cyree, Ken B., and Drew B. Winters, 2001, An intraday examination of the Federal Funds market: Implications for the theories of the reverse-J pattern, Journal of Business 72, 535-556. Department of Labor, Pension and Welfare Benefits Administration, (March 20) 1998, Cross-trades of securities by investment managers. Federal Register, volume 63, number 54 (notices), 13696-13701. This notice address exemptions for actively managed funds and also for index and model-driven funds. Dufour, Alfonso, and Robert F. Engle, 2000, Time and the price impact of a trade, Journal of Finance 55, 2467-2498. Easley, David, Nicholas M. Kiefer, Maureen O’Hara, and Joseph B. Paperman, 1996, Liquidity, information, and infrequently traded stocks, Journal of Finance 51, 1405-1436. Foster, F. Douglas, and S. Viswanathan, 1993, Variations in trading volume, return, volatility, and trading costs: Evidence on recent price formation models, Journal of Finance 48, 187-211. Glosten, Lawrence, and Paul Milgrom, 1985, Bid, ask and transaction prices in a specialist market with heterogeneously informed traders, Journal of Financial Economics 14, 71-100. Glosten, Larry R., and Lawrence E. Harris, 1988, Estimating the components of the bid-ask spread, Journal of Financial Economics 21, 123-142.
Goodhart, Charles, and Antomis Demos, 1991, Reuters screen images of the foreign exchange markets: The yen/dollar and the sterling/dollar spot market, Journal of International Securities Markets 28, 35-64. Greene, Jason T., and Susan G. Watts, 1996, Price discovery on the NYSE and the Nasdaq: The case of overnight and daytime news releases, Financial Management 25, 19-42. Hamao, Yasushi, and Joel Hasbrouck, 1995, Securities trading in the absence of dealers: Trades and quotes on the Tokyo Stock Exchange, Review of Financial Studies 8, 849-878. Harris, Frederick H. deB., and Thomas H. McInish, 2000, A regime-level empirical model of the specialist quote revision process, Review of Quantitative Finance and Accounting 14, 399-417. Harris, Frederick H. deB., Thomas H. McInish, and Ranjan R. Chakravarty, 1995, Bids and asks in disequilibrium market microstructure: The case of IBM, Journal of Banking and Finance 19, 323-345.
34

Harris, Lawrence, 1989, A day-end transactions price anomaly, Journal of Financial and Quantitative Analysis 24, 29-45.
Harris, Lawrence, and Joel Hasbrouck, 1996, Market vs. limit orders: The SuperDOT evidence on order submission strategy, Journal of Financial and Quantitative Analysis 31, 213-231. Harris, T. Britton, and Charissa H. Smith, 1999, Do you know your transaction costs?, Proceedings of the Conference on Best Execution. Association for Investment Management and Research, Charlottesville, VA. Hasbrouck, Joel, 1999, The dynamics of discrete bid and ask quotes, Journal of Finance 54, 2109-2142. Hasbrouck, Joel, and Robert Schwartz, 1988, Liquidity and execution costs in equity markets, Journal of Portfolio Management 14, 10-17. Ho, Thomas, and Hans R. Stoll, 1981, Optimal dealer pricing under transactions and return uncertainty, Journal of Financial Economics 9, 47-73. Jain, Prem, and Gun-Ho Joh, 1988, The dependence between hourly prices and trading volume, Journal of Financial and Quantitative Analysis 23, 99-117. Jones, Charles M., George Kaul, and Marc L. Lipson, 1994, Transactions, volume, and volatility, Review of Financial Studies 7, 631-651. Jones, Charles M., and Marc L. Lipson, 2001, Sixteenths: Direct evidence on institutional execution costs, Journal of Financial Economics 59, 253-278. Kaul, Aditya, Vikas Mehrotra, and Randall Morck, 2000, Demand curves for stocks do slope down: New evidence from an index weights adjustment, Journal of Finance 55, 893-912. Kavajecz, Kenneth A., and Elizabeth R. Odders-White, 2001, An examination of changes in specialists’ posted price schedules, Review of Financial Studies 14, 681-704. Keim, Donald B., and Ananth Madhavan, 1996, The upstairs market for large-block transactions: Analysis and measurement of price effects, Review of Financial Studies 9, 1-36. Koski, Jennifer Lynch, and Roni Michaely, 2000, Prices, liquidity, and the information content of trades, Review of Financial Studies 13, 659-696. Kraus, Alan, and Hans R. Stoll, 1972, Price impacts of block trading on the New York Stock Exchange, Journal of Finance 27, 569-588.
35
LaPlante, Michele, and Chris J. Muscarella, 1997, Do institutions receive comparable execution in the NYSE and Nasdaq markets? A transaction study of block trades, Journal of Financial Economics 45, 97-134. Lehmann, Bruce N., and David M. Modest, 1994, Trading and liquidity on the Tokyo Stock Exchange: A bird’s eye view, Journal of Finance 49, 951-984. Macey, Jonathan R., and Maureen O'Hara, 1996, The law and economics of best execution, Working paper, Cornell University, Ithica, NY. McInish, Thomas H., 2000, Capital Markets: A Global Perspective. Oxford: Blackwell. McInish, Thomas H., Bonnie Van Ness, and Robert A. Van Ness, 1998, The impact of the SEC's order handling rules on NASDAQ, Journal of Financial Research 21, 247-254. McInish, Thomas H., and Robert A. Wood, 1990a, An analysis of transactions data for the Toronto Stock Exchange, Journal of Banking and Finance 14, 441-458.
McInish, Thomas H., and Robert A. Wood, 1990b, A transactions data analysis of the variability of common stock returns during 1980-1984, Journal of Banking and Finance 14, 99-112. Mcinish, Thomas H., and Robert A. Wood, 1992, An analysis of intraday patterns in bid/ask spreads for NYSE stocks, Journal of Finance 47, 753-764. Plexus Group, 2002, Time of day effects on trading costs, Plexus Group Commentary 69, January. Porter, David C., 1992, The probability of a trade at the ask: An examination of interday and intraday behavior, Journal of Financial and Quantitative Analysis 27, 209-227. Saar, Gideon, 2001, Price impact asymmetry of block trades: An institutional trading explanation, Review of Financial Studies 14, 1153-1181. Schultz, Paul, 2001, Corporate bond trading costs: A peek behind the curtain, Journal of Finance 56, 677-698. Schwartz, Robert, and David K. Whitcomb, 1988, Transaction costs and institutional investor trading strategies, Monograph Series in Finance and Economics 1988-2/3, New York University, Stern School of Business. Seppi, Duane J., 1992, Block trading and information revelation around quarterly earnings announcement, Review of Financial Studies 5, 281-305.
36

Smith, Brian F., D, Alasdiar S, Turnbull, and Robert W. White, 2001, Upstairs market for principal and agency trades: Analysis of adverse information and price effects, Journal of Finance 56, 1723-1746. Van Ness, Bonnie F., Robert A. Van Ness, and Richard S. Warr, 2001, How well do adverse selection components measure adverse selection? Financial Management 30, 77-98. Wagner, Wayne H., and Michael Banks, 1992, Increasing portfolio effectiveness via transaction cost management, Journal of Portfolio Management 19, 6-11. Wagner, Wayne H., 2000, Measuring, controlling, and allocating trading costs in Ethical Issues for Today’s Firm, Association for Investment and Research, Charlottesville, VA, 35-42. Werner, Ingrid M., and Allan W. Kleidon, 1996, U.K. and U.S. trading of British cross-listed stocks: An intraday analysis of market integration, Review of Financial Studies 9, 619-664. Wood, Robert A., Thomas H. McInish, and J. Keith Ord, 1985, An investigation of transactions data for NYSE stocks, Journal of Finance 40, 723-739.
37
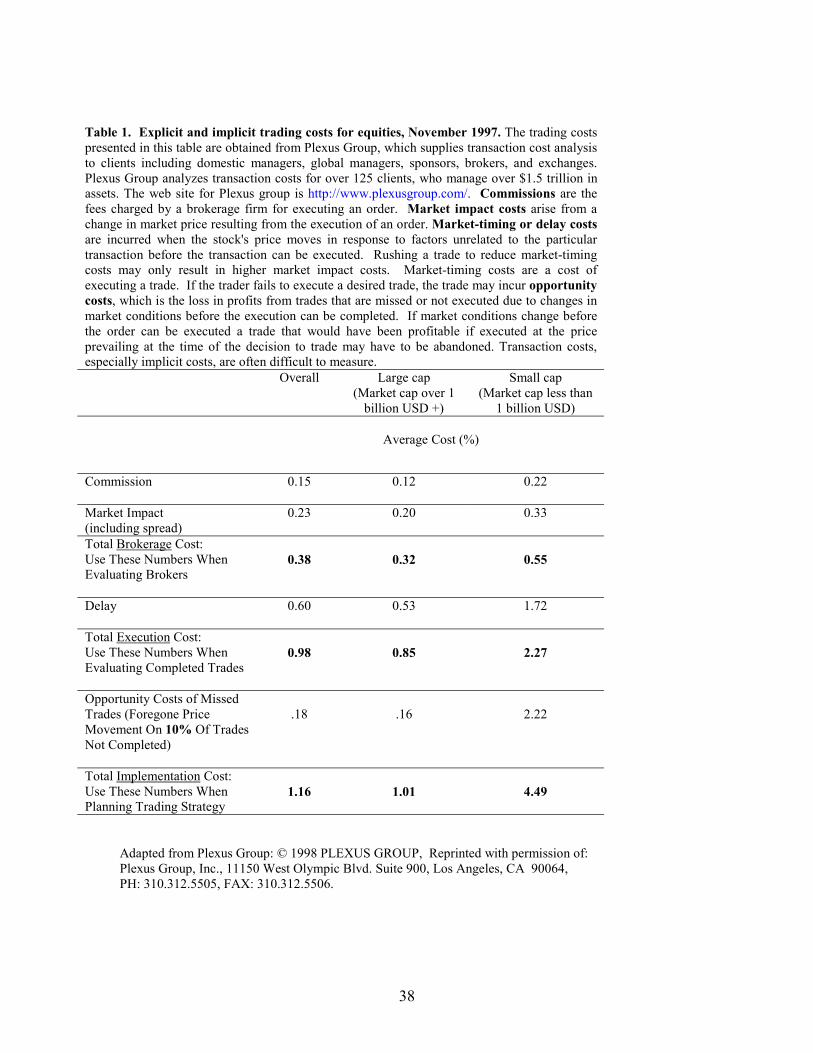
Table 1. Explicit and implicit trading costs for equities, November 1997. The trading costs presented in this table are obtained from Plexus Group, which supplies transaction cost analysis to clients including domestic managers, global managers, sponsors, brokers, and exchanges. Plexus Group analyzes transaction costs for over 125 clients, who manage over $1.5 trillion in assets. The web site for Plexus group is http://www.plexusgroup.com/. Commissions are the fees charged by a brokerage firm for executing an order. Market impact costs arise from a change in market price resulting from the execution of an order. Market-timing or delay costs are incurred when the stock's price moves in response to factors unrelated to the particular transaction before the transaction can be executed. Rushing a trade to reduce market-timing costs may only result in higher market impact costs. Market-timing costs are a cost of executing a trade. If the trader fails to execute a desired trade, the trade may incur opportunity costs, which is the loss in profits from trades that are missed or not executed due to changes in market conditions before the execution can be completed. If market conditions change before the order can be executed a trade that would have been profitable if executed at the price prevailing at the time of the decision to trade may have to be abandoned. Transaction costs, especially implicit costs, are often difficult to measure.
Overall Large cap
(Market cap over 1 billion USD +)
Small cap (Market cap less than
1 billion USD)
Average Cost (%)
Commission
0.15 0.12 0.22
Market Impact (including spread)
0.23 0.20 0.33
Total Brokerage Cost: Use These Numbers When Evaluating Brokers
0.38
0.32
0.55
Delay
0.60 0.53 1.72
Total Execution Cost: Use These Numbers When Evaluating Completed Trades
0.98
0.85
2.27
Opportunity Costs of Missed Trades (Foregone Price Movement On 10% Of Trades Not Completed)
.18
.16
2.22
Total Implementation Cost: Use These Numbers When Planning Trading Strategy
1.16
1.01
4.49
Adapted from Plexus Group: © 1998 PLEXUS GROUP, Reprinted with permission of: Plexus Group, Inc., 11150 West Olympic Blvd. Suite 900, Los Angeles, CA 90064, PH: 310.312.5505, FAX: 310.312.5506.
38
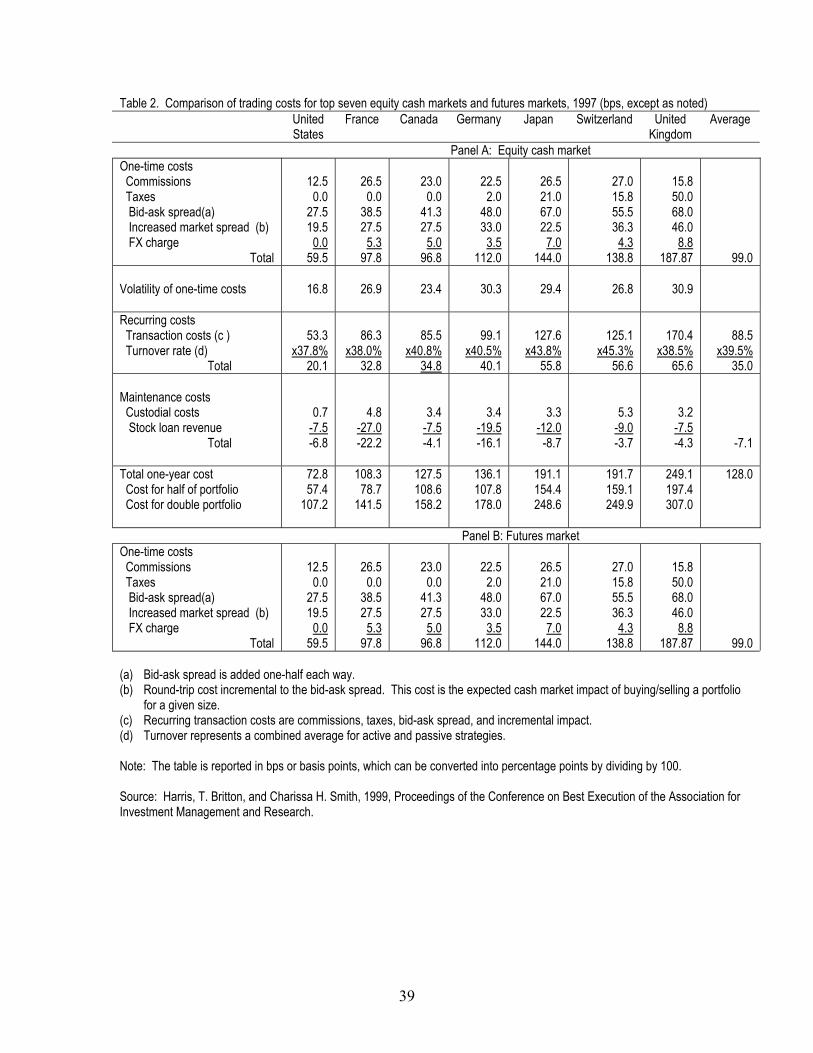
Table 2. Comparison of trading costs for top seven equity cash markets and futures markets, 1997 (bps, except as noted) United
States France Canada Germany Japan Switzerland United
Kingdom Average
Panel A: Equity cash market One-time costs Commissions Taxes Bid-ask spread(a) Increased market spread (b) FX charge
Total
12.5
0.0 27.5 19.5
0.0 59.5
26.5
0.0 38.5 27.5
5.3 97.8
23.0
0.0 41.3 27.5
5.0 96.8
22.5
2.0 48.0 33.0
3.5 112.0
26.5 21.0 67.0 22.5
7.0 144.0
27.0 15.8 55.5 36.3
4.3 138.8
15.8 50.0 68.0 46.0
8.8 187.87
99.0 Volatility of one-time costs
16.8
26.9
23.4
30.3
29.4
26.8
30.9
Recurring costs Transaction costs (c ) Turnover rate (d) Total
53.3
x37.8% 20.1
86.3
x38.0% 32.8
85.5
x40.8% 34.8
99.1
x40.5% 40.1
127.6
x43.8% 55.8
125.1
x45.3% 56.6
170.4
x38.5% 65.6
88.5
x39.5% 35.0
Maintenance costs Custodial costs Stock loan revenue Total
0.7 -7.5 -6.8
4.8 -27.0 -22.2
3.4 -7.5 -4.1
3.4 -19.5 -16.1
3.3 -12.0
-8.7
5.3 -9.0 -3.7
3.2 -7.5 -4.3
-7.1
Total one-year cost Cost for half of portfolio Cost for double portfolio
72.8 57.4
107.2
108.3 78.7
141.5
127.5 108.6 158.2
136.1 107.8 178.0
191.1 154.4 248.6
191.7 159.1 249.9
249.1 197.4 307.0
128.0
Panel B: Futures market One-time costs Commissions Taxes Bid-ask spread(a) Increased market spread (b) FX charge
Total
12.5
0.0 27.5 19.5
0.0 59.5
26.5
0.0 38.5 27.5
5.3 97.8
23.0
0.0 41.3 27.5
5.0 96.8
22.5
2.0 48.0 33.0
3.5 112.0
26.5 21.0 67.0 22.5
7.0 144.0
27.0 15.8 55.5 36.3
4.3 138.8
15.8 50.0 68.0 46.0
8.8 187.87
99.0 (a) Bid-ask spread is added one-half each way. (b) Round-trip cost incremental to the bid-ask spread. This cost is the expected cash market impact of buying/selling a portfolio
for a given size. (c) Recurring transaction costs are commissions, taxes, bid-ask spread, and incremental impact. (d) Turnover represents a combined average for active and passive strategies. Note: The table is reported in bps or basis points, which can be converted into percentage points by dividing by 100. Source: Harris, T. Britton, and Charissa H. Smith, 1999, Proceedings of the Conference on Best Execution of the Association for Investment Management and Research.
39
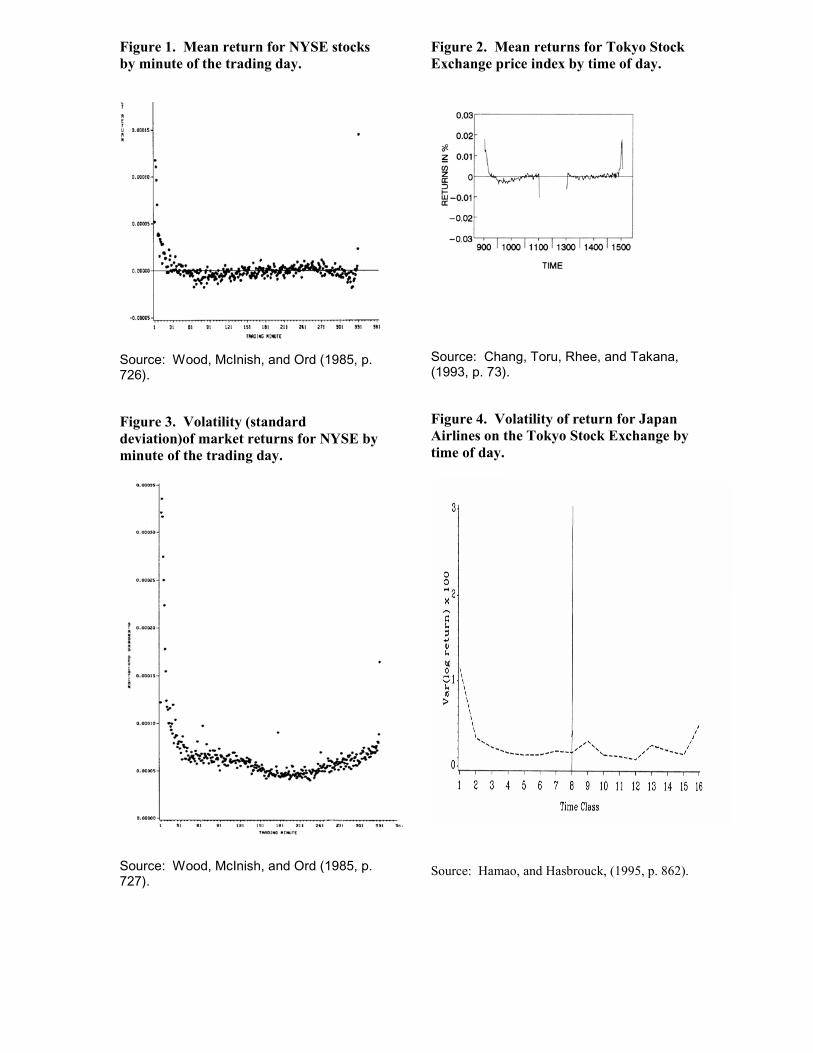
Figure 1. Mean return for NYSE stocks by minute of the trading day.
Source: Wood, McInish, and Ord (1985, p. 726). Figure 3. Volatility (standard deviation)of market returns for NYSE by minute of the trading day.
Source: Wood, McInish, and Ord (1985, p. 727).
Figure 2. Mean returns for Tokyo Stock Exchange price index by time of day.
Source: Chang, Toru, Rhee, and Takana, (1993, p. 73). Figure 4. Volatility of return for Japan Airlines on the Tokyo Stock Exchange by time of day.
Source: Hamao, and Hasbrouck, (1995, p. 862).
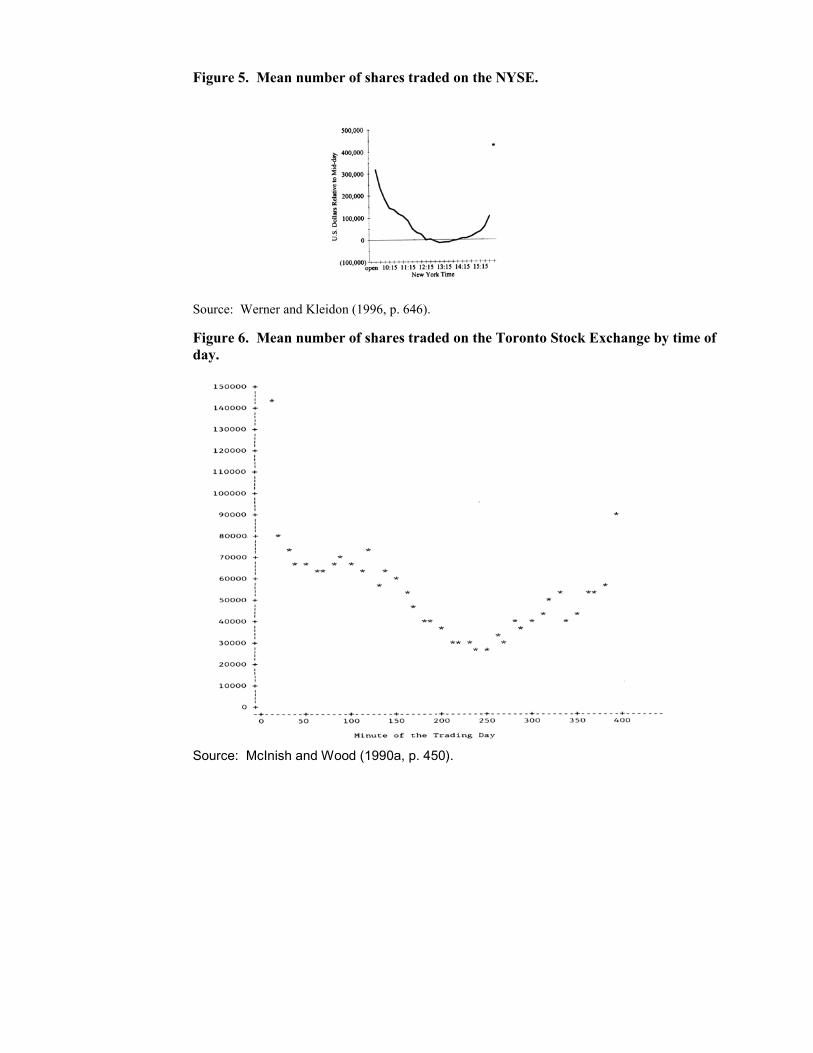
Figure 5. Mean number of shares traded on the NYSE.
Source: Werner and Kleidon (1996, p. 646).
Figure 6. Mean number of shares traded on the Toronto Stock Exchange by time of day.
Source: McInish and Wood (1990a, p. 450).

Figure 7. Intraday trading volume for Japan Airlines on the Tokyo Stock Exchange.
Source: Hamao and Hasbrouck (1995, p.864).
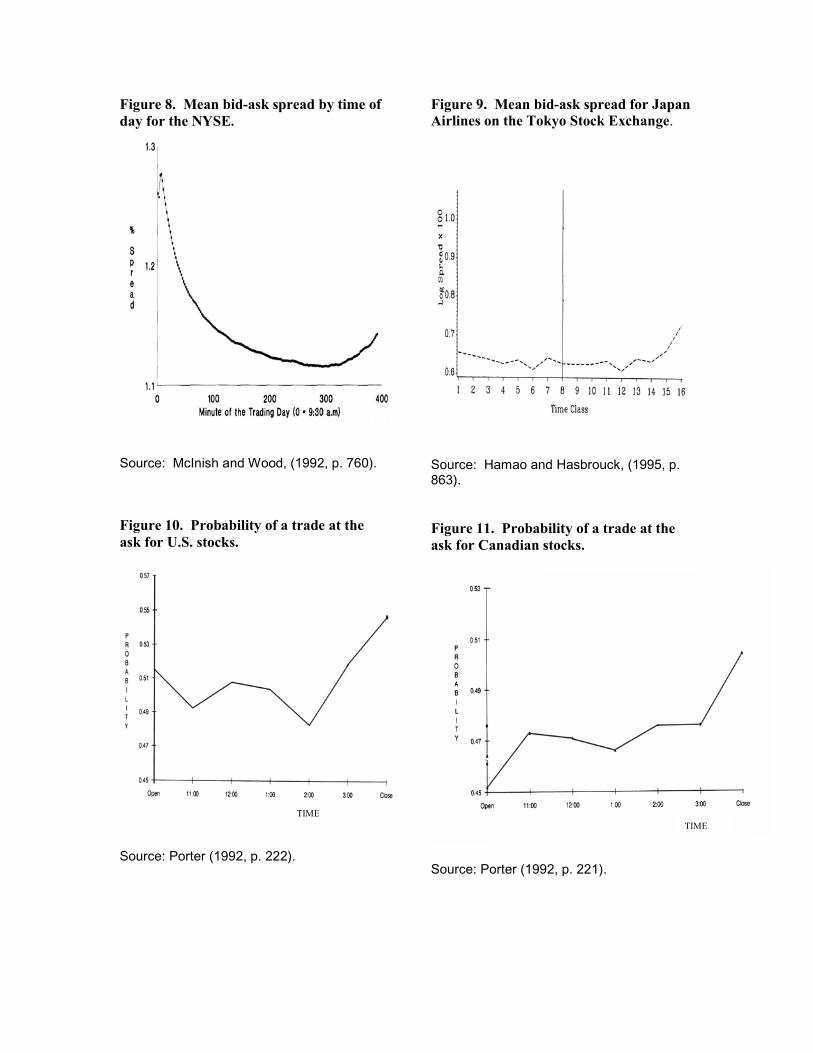
Figure 8. Mean bid-ask spread by time of day for the NYSE.
Figure 9. Mean bid-ask spread for Japan Airlines on the Tokyo Stock Exchange.
Source: McInish and Wood, (1992, p. 760). Source: Hamao and Hasbrouck, (1995, p.
863). Figure 10. Probability of a trade at the ask for U.S. stocks.
Figure 11. Probability of a trade at the ask for Canadian stocks.
TIME TIME
Source: Porter (1992, p. 222). Source: Porter (1992, p. 221).

Figure 12. Frequency of Japanese yen/U.S. dollar quotes in Tokyo, by half-hour intervals (GMT).
0
2000
4000
6000
8000
10000
12000
41 43 45 47 1 3 5 7 9 11 13 15 17 19 21 23 25 27 29 31 33 35 37 39
Half-Hour Intervals (GMT)
Freq
uenc
y
Source: Based on McInish (2000, p. 277).
Figure 13. Volatility of Federal Funds rate.
Source: Cyree and Winters (2001, p. 552).