
Cross-silo Intelligence to Optimize Your VI
17
Cross-Silo Intelligence to Optimize Virtual Infrastructures March 24, 2015 Don Chouinard Xangati Douglas Brown DABCC.com
-
Upload
xangati -
Category
Technology
-
view
36 -
download
0
Transcript of Cross-silo Intelligence to Optimize Your VI
Cross-Silo Intelligence to Optimize Virtual InfrastructuresMarch 24, 2015
Don ChouinardXangati
Douglas Brown
DABCC.com
1
2
3
4
5
6
7
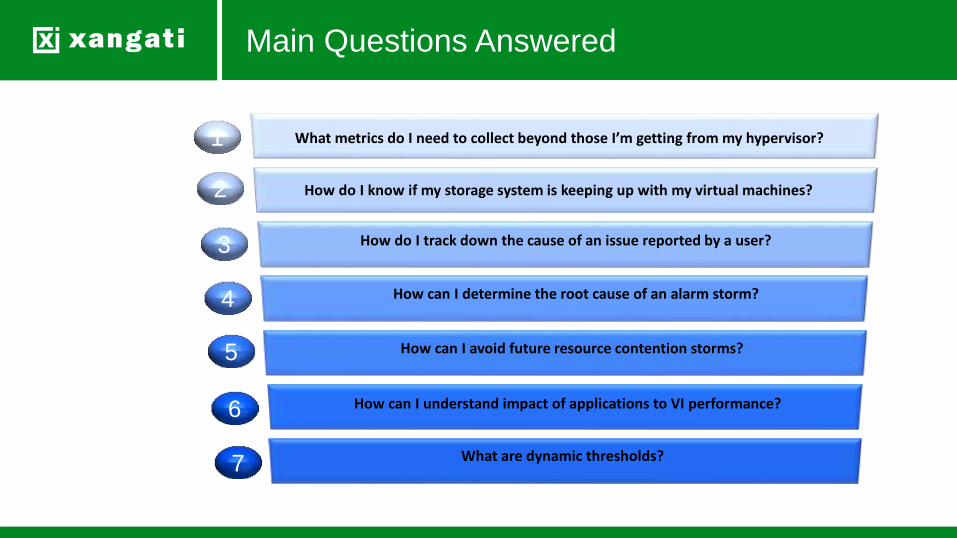
What metrics do I need to collect beyond those I’m getting from my hypervisor?
How do I know if my storage system is keeping up with my virtual machines?
How do I track down the cause of an issue reported by a user?
How can I determine the root cause of an alarm storm?
How can I avoid future resource contention storms?
What are dynamic thresholds?
How can I understand impact of applications to VI performance?
Main Questions Answered
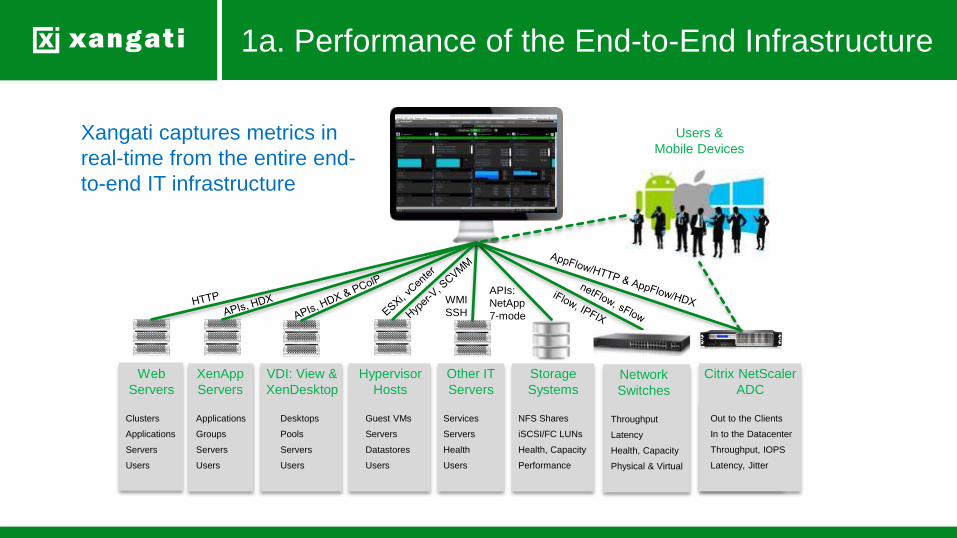
1a. Performance of the End-to-End Infrastructure
Clusters
Applications
Servers
Users
Xangati captures metrics in
real-time from the entire end-
to-end IT infrastructure
Web
Servers
XenApp
Servers
VDI: View &
XenDesktop
Hypervisor
Hosts
Storage
Systems
Other IT
Servers
Applications
Groups
Servers
Users
Desktops
Pools
Servers
Users
Guest VMs
Servers
Datastores
Users
Services
Servers
Health
Users
NFS Shares
iSCSI/FC LUNs
Health, Capacity
Performance
Network
Switches
Throughput
Latency
Health, Capacity
Physical & Virtual
Citrix NetScaler
ADC
Out to the Clients
In to the Datacenter
Throughput, IOPS
Latency, Jitter
Users &
Mobile Devices
APIs:
NetApp
7-mode
WMI
SSH
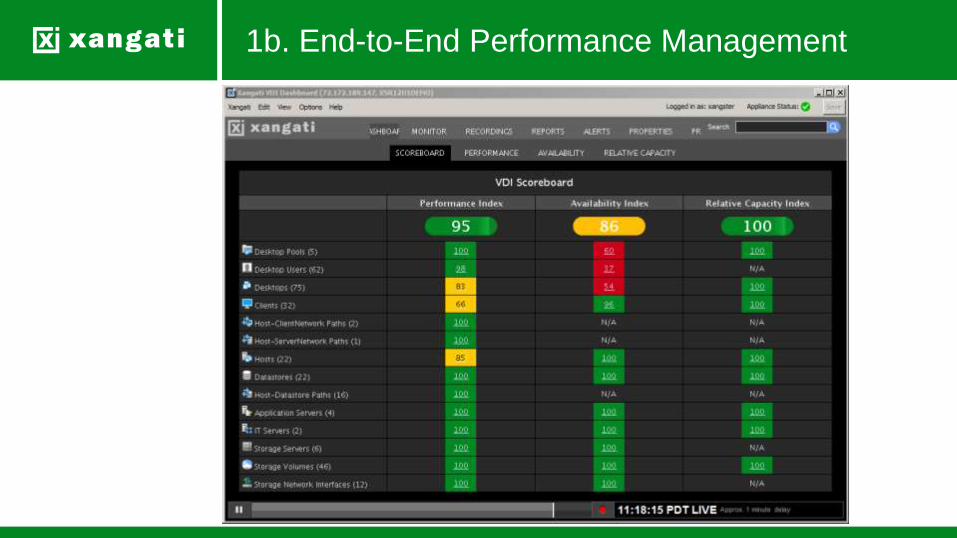
1b. End-to-End Performance Management
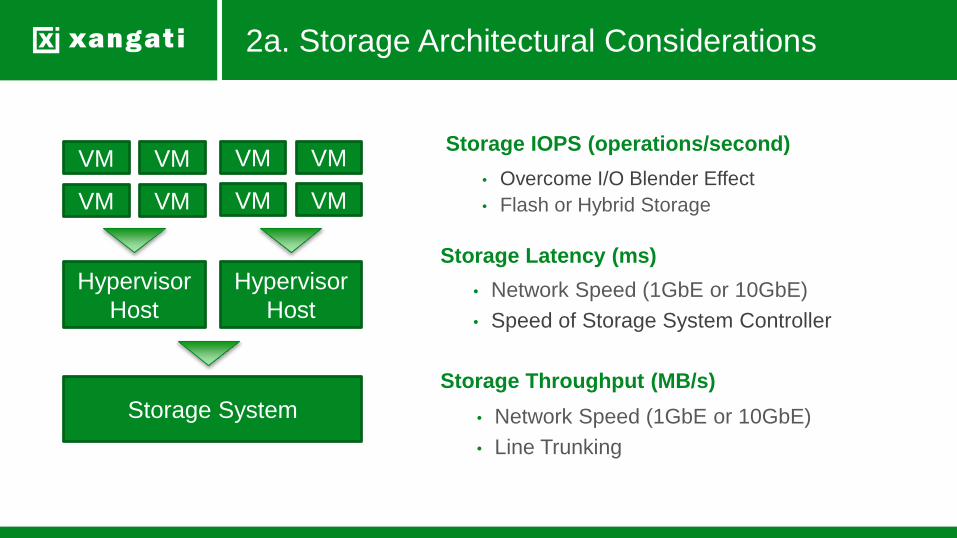
2a. Storage Architectural Considerations
Hypervisor
Host
Storage System
Storage Throughput (MB/s)
Storage Latency (ms)
Storage IOPS (operations/second)
Hypervisor
Host
VM VM VM VM
VM VM VM VM
• Network Speed (1GbE or 10GbE)
• Line Trunking
• Network Speed (1GbE or 10GbE)
• Speed of Storage System Controller
• Overcome I/O Blender Effect
• Flash or Hybrid Storage
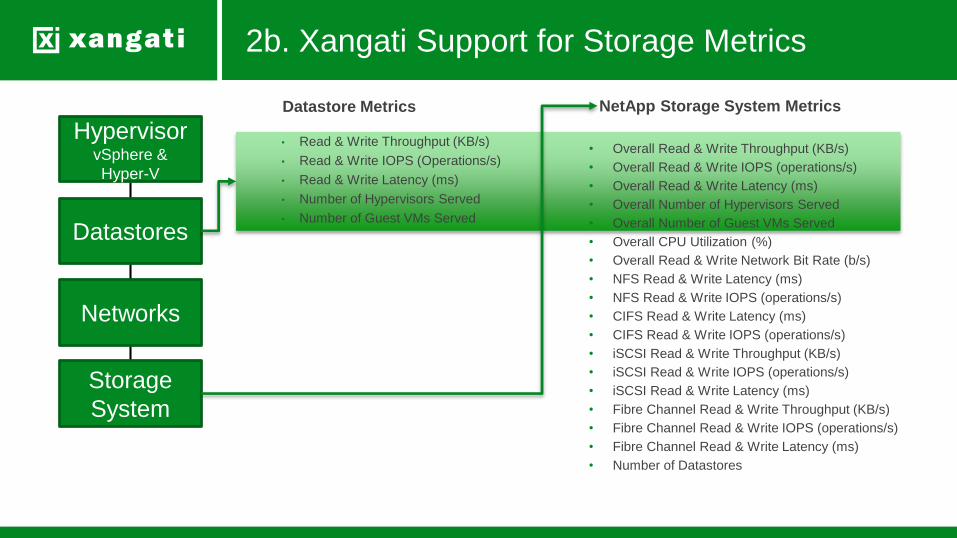
2b. Xangati Support for Storage Metrics
HypervisorvSphere &
Hyper-V
Datastores
Networks
Storage
System
• Read & Write Throughput (KB/s)
• Read & Write IOPS (Operations/s)
• Read & Write Latency (ms)
• Number of Hypervisors Served
• Number of Guest VMs Served
• Overall Read & Write Throughput (KB/s)
• Overall Read & Write IOPS (operations/s)
• Overall Read & Write Latency (ms)
• Overall Number of Hypervisors Served
• Overall Number of Guest VMs Served
• Overall CPU Utilization (%)
• Overall Read & Write Network Bit Rate (b/s)
• NFS Read & Write Latency (ms)
• NFS Read & Write IOPS (operations/s)
• CIFS Read & Write Latency (ms)
• CIFS Read & Write IOPS (operations/s)
• iSCSI Read & Write Throughput (KB/s)
• iSCSI Read & Write IOPS (operations/s)
• iSCSI Read & Write Latency (ms)
• Fibre Channel Read & Write Throughput (KB/s)
• Fibre Channel Read & Write IOPS (operations/s)
• Fibre Channel Read & Write Latency (ms)
• Number of Datastores
NetApp Storage System MetricsDatastore Metrics
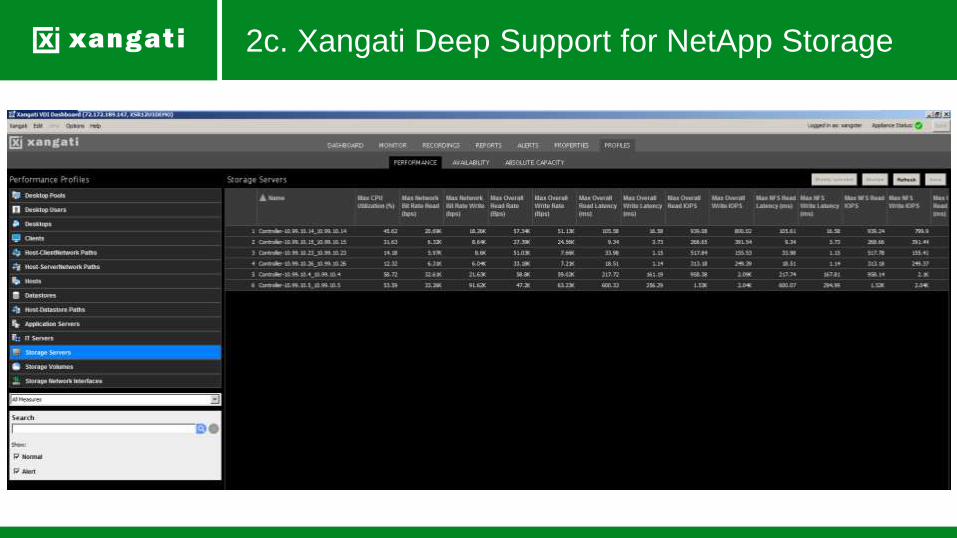
2c. Xangati Deep Support for NetApp Storage
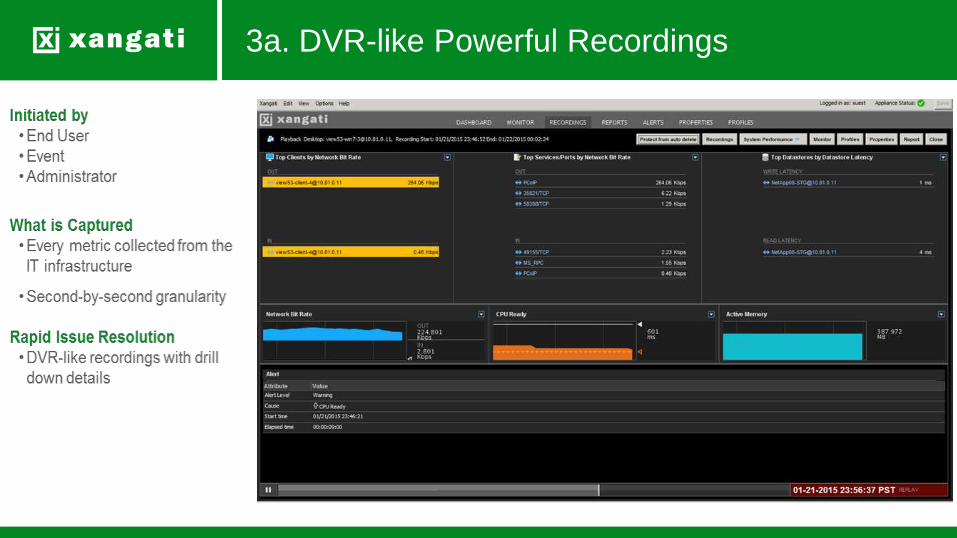
3a. DVR-like Powerful Recordings
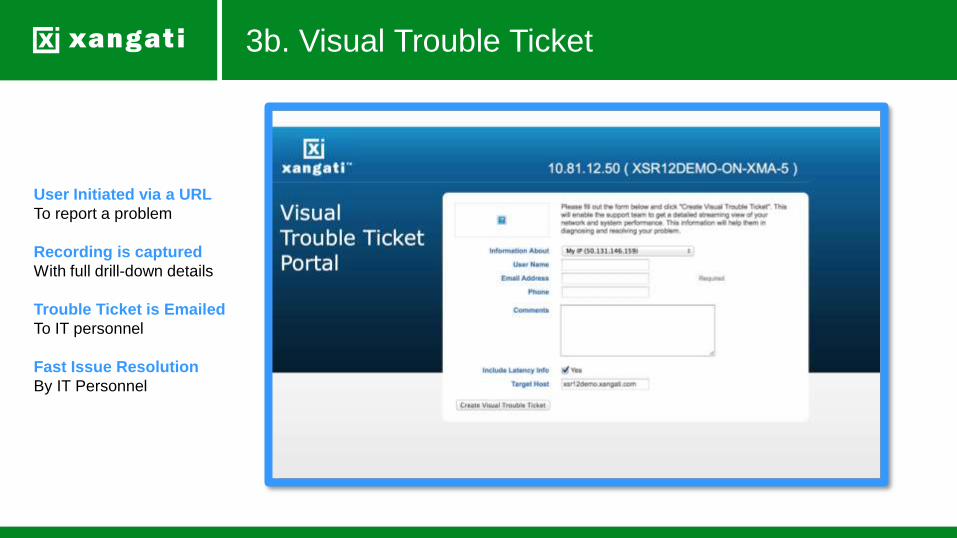
User Initiated via a URL
To report a problem
Recording is captured
With full drill-down details
Trouble Ticket is Emailed
To IT personnel
Fast Issue Resolution
By IT Personnel
3b. Visual Trouble Ticket
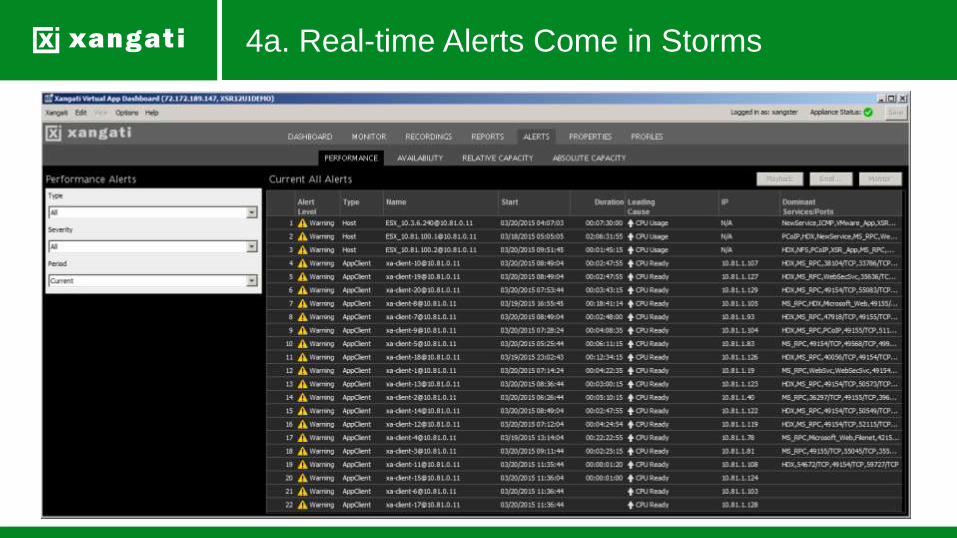
4a. Real-time Alerts Come in Storms
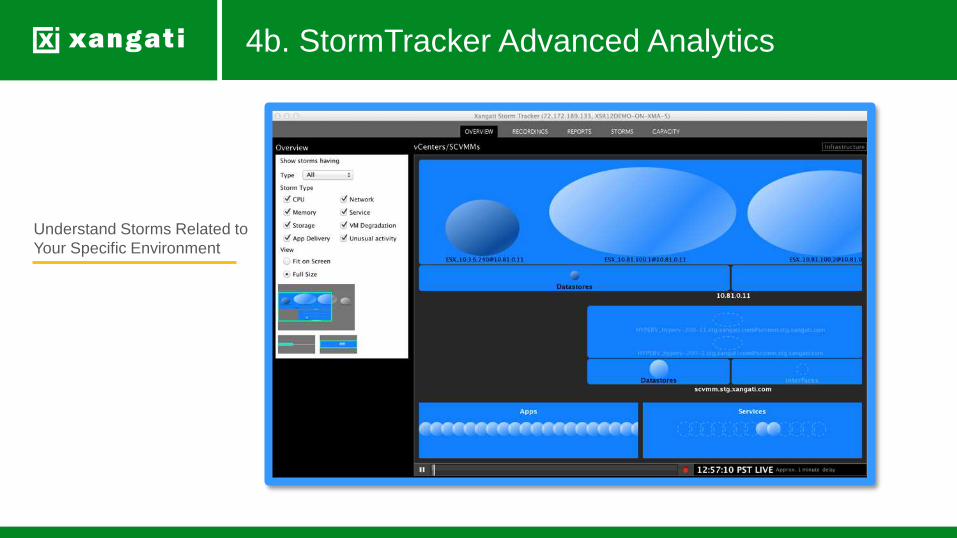
4b. StormTracker Advanced Analytics
Understand Storms Related to
Your Specific Environment

4c. Storm Tracker Provides Root Cause Analysis
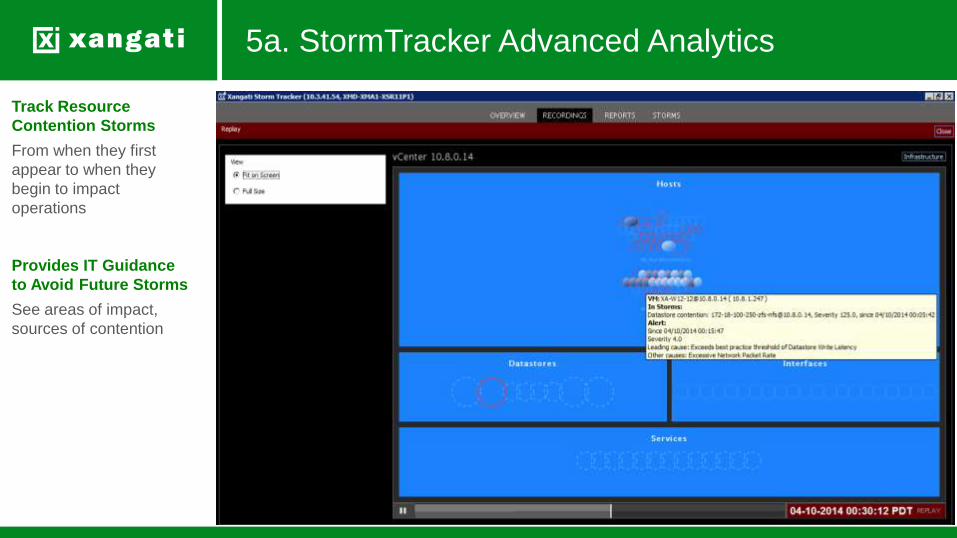
5a. StormTracker Advanced Analytics
Track Resource
Contention Storms
From when they first
appear to when they
begin to impact
operations
Provides IT Guidance
to Avoid Future Storms
See areas of impact,
sources of contention
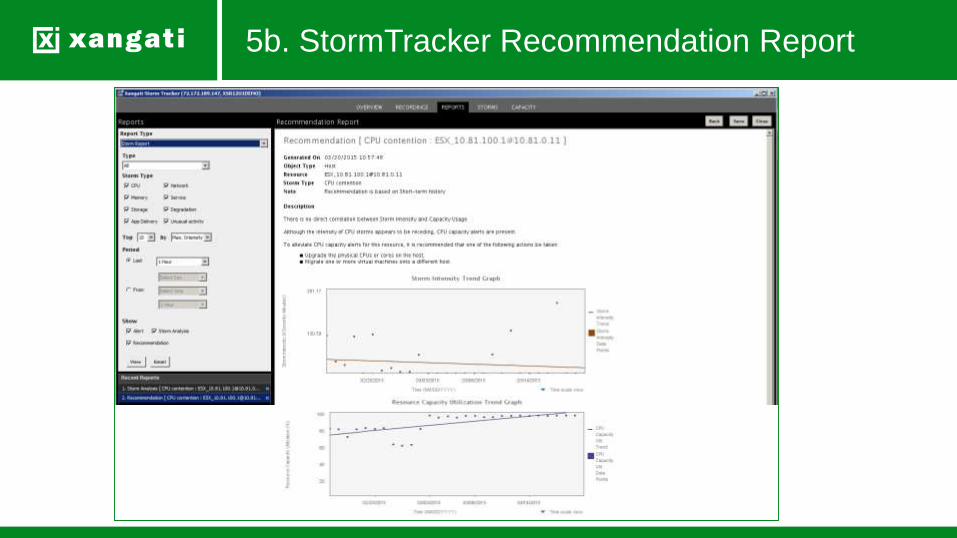
5b. StormTracker Recommendation Report
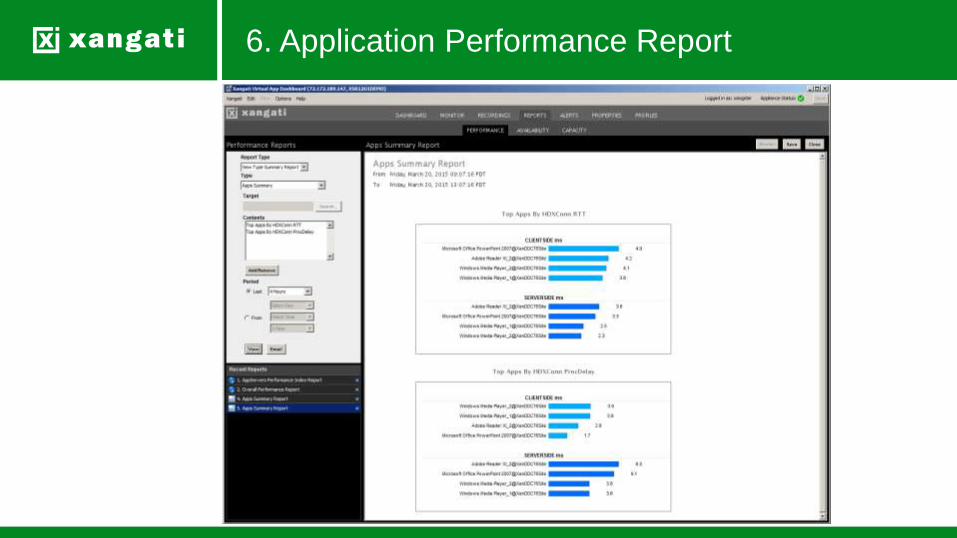
6. Application Performance Report
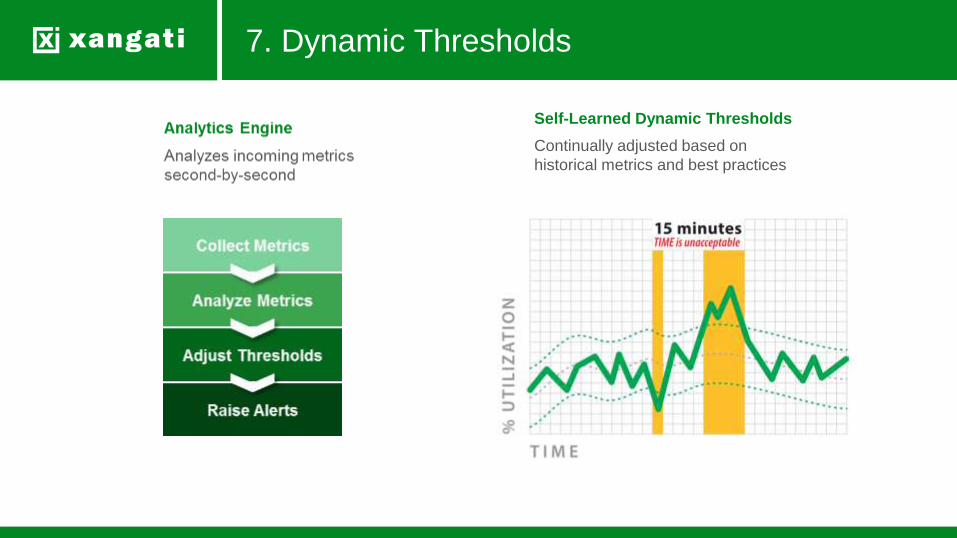
7. Dynamic Thresholds
Self-Learned Dynamic Thresholds
Continually adjusted based on
historical metrics and best practices

Xangati Key Features At-a-Glance
Reports for planning and communicating
Predict future resource contention storms
Recordings with the Root Cause Pinpointed
Dynamic thresholds learn from your environment
Dashboards with DVR-like playback to troubleshoot
Real-time End-to-End Metrics with NO Agents