HSS4303B – Intro to Epidemiology Mortality Rates, et al classes.deonandan.com/hss4303.
date post
20-Dec-2015Category
view
219download
0
Cross-Sectional, Cohort and Case-Control Studies
HSS4303B – Intro to Epidemiology
April 10, 2010
• Your big poster day• Is also a big epidemiology poster day for grad
students and other students on campus:– http://www.csebottawa.com/index.php/en/
research-day-2010
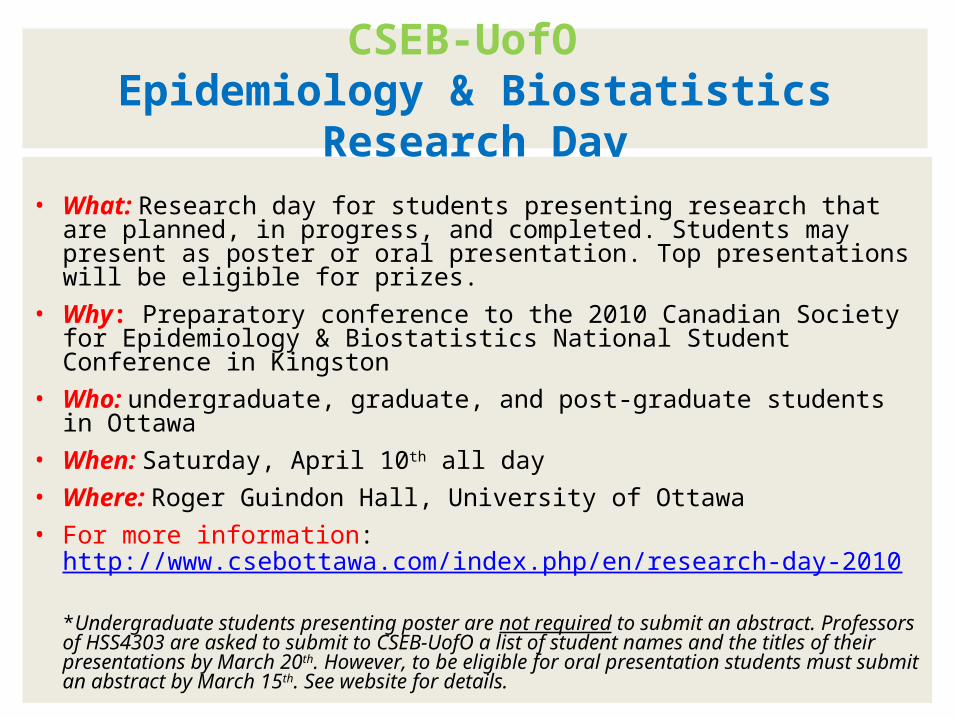
CSEB-UofO Epidemiology & Biostatistics Research Day
• What: Research day for students presenting research that are planned, in progress, and completed. Students may present as poster or oral presentation. Top presentations will be eligible for prizes.
• Why: Preparatory conference to the 2010 Canadian Society for Epidemiology & Biostatistics National Student Conference in Kingston
• Who: undergraduate, graduate, and post-graduate students in Ottawa• When: Saturday, April 10th all day• Where: Roger Guindon Hall, University of Ottawa• For more information:
http://www.csebottawa.com/index.php/en/research-day-2010
*Undergraduate students presenting poster are not required to submit an abstract. Professors of HSS4303 are asked to submit to CSEB-UofO a list of student names and the titles of their presentations by March 20th. However, to be eligible for oral presentation students must submit an abstract by March 15th. See website for details.

2010 Canadian Society for Epidemiology & Biostatistics (CSEB)
National Student Conference
• What: National conference for students to present research in the fields of epidemiology and biostatistics that are planned, in progress, and completed. Students may present as poster or oral presentation. Top presentations will be eligible for prizes.
• Who: undergraduate, graduate, and post-graduate students from across Canada and abroad
• When: May 27-28, 2010• Where: Queen’s University, Kingston, Ontario• For more information: www.studentcseb.ca
* All students are required to submit an abstract by March 1st, 2010. See website for details.
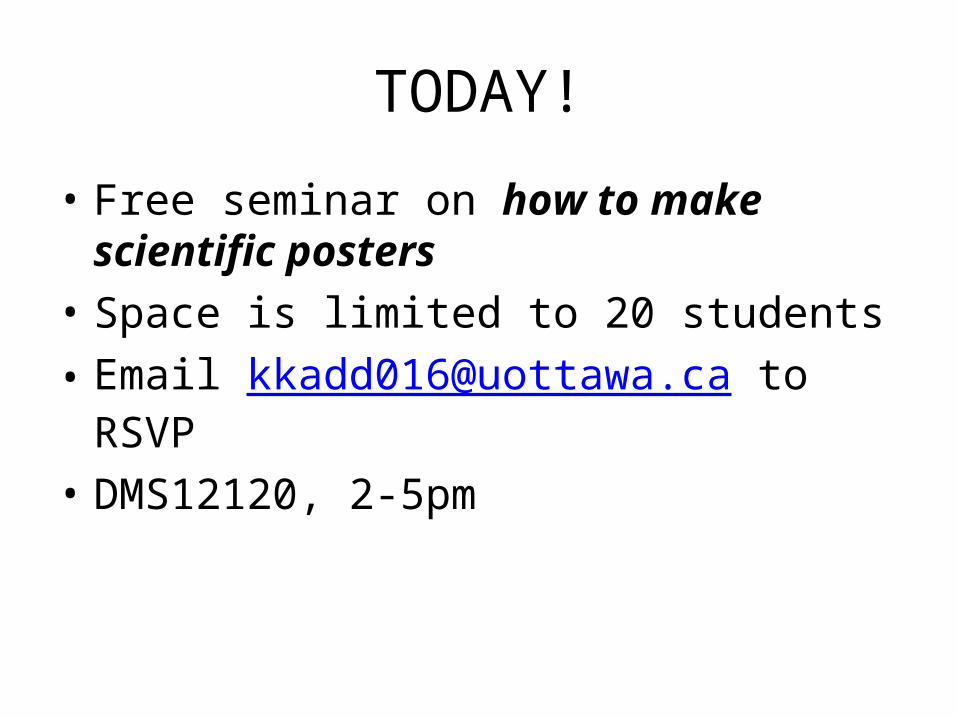
TODAY!
• Free seminar on how to make scientific posters
• Space is limited to 20 students• Email [email protected] to RSVP• DMS12120, 2-5pm

Your poster assignments
• “Intent to submit” must be submitted by March 11
• See website for description of content and instructions
• Marking scheme will be updated

Qualitative vs. Quantitative
Descriptive vs. Analytic
Observational vs. Experimental
Case-controlCohortCross-sectional
InterventionsClinical trials
Who gets the disease?When do they get it?Where do they get it?

Hierarchy of Laziness
From most easy to most difficult:
1. Cross-sectional study2. Cohort study3. Case-control study4. Experimentation
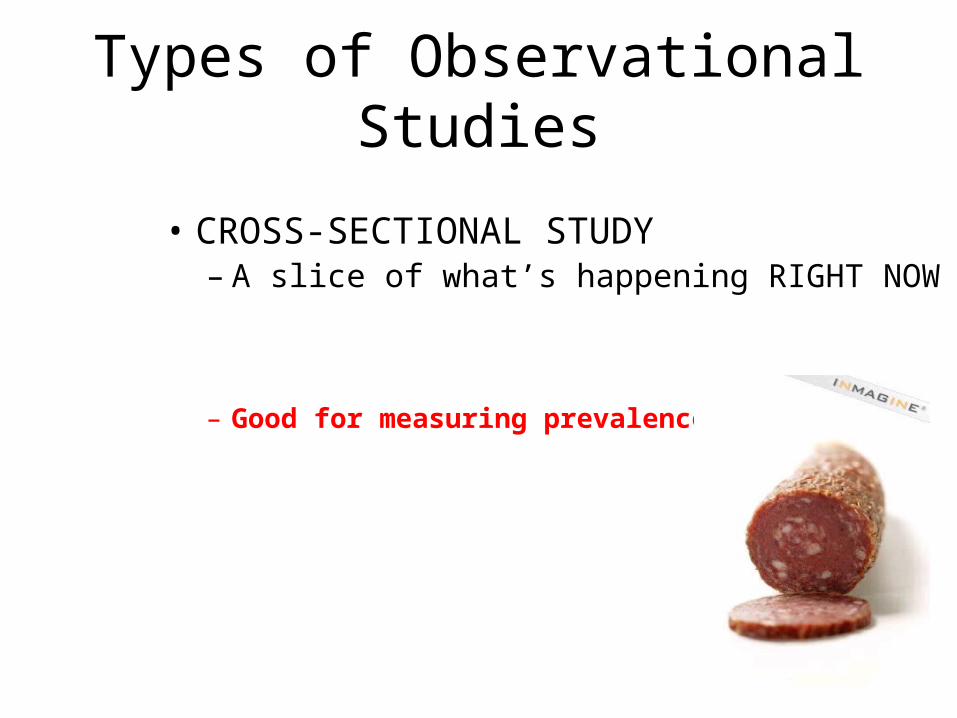
Types of Observational Studies
• CROSS-SECTIONAL STUDY– A slice of what’s happening RIGHT NOW
– Good for measuring prevalence

Cross-Sectional Studies
• example:– People who currently live in farms are more
likely to have Gonnakillyasoon Flu right now than are people who don’t live in farms
• How is this done?We look at all the people, compute the percentage who have the flu and who live in farms, and compute the percentage who have the flu who don’t live in farms, and see which number is higher.
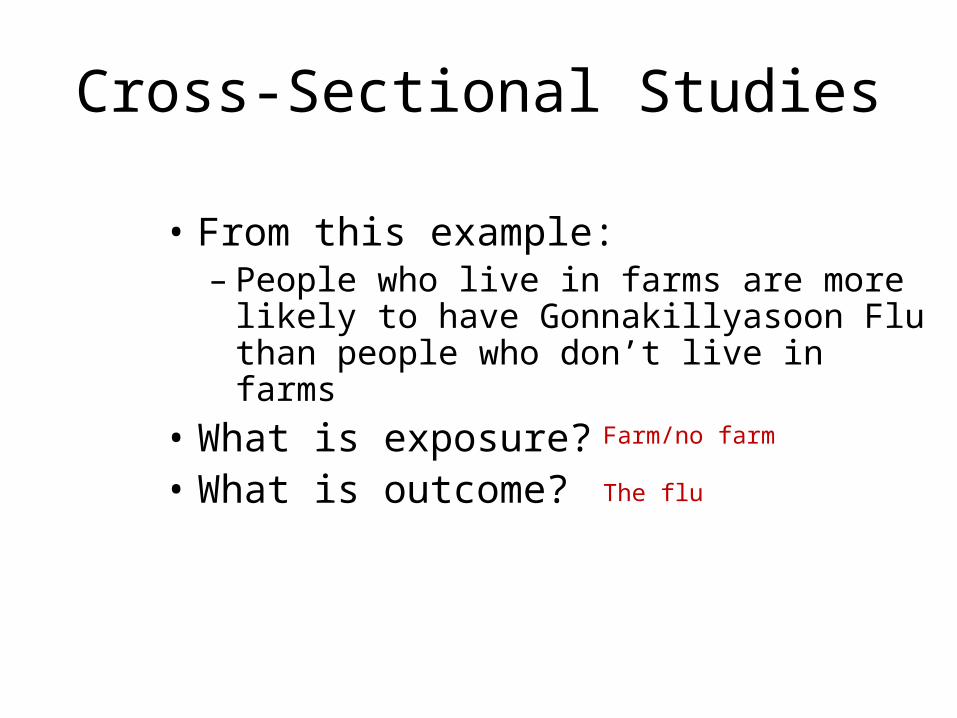
Cross-Sectional Studies
• From this example:– People who live in farms are more likely to
have Gonnakillyasoon Flu than people who don’t live in farms
• What is exposure?• What is outcome?
Farm/no farm
The flu
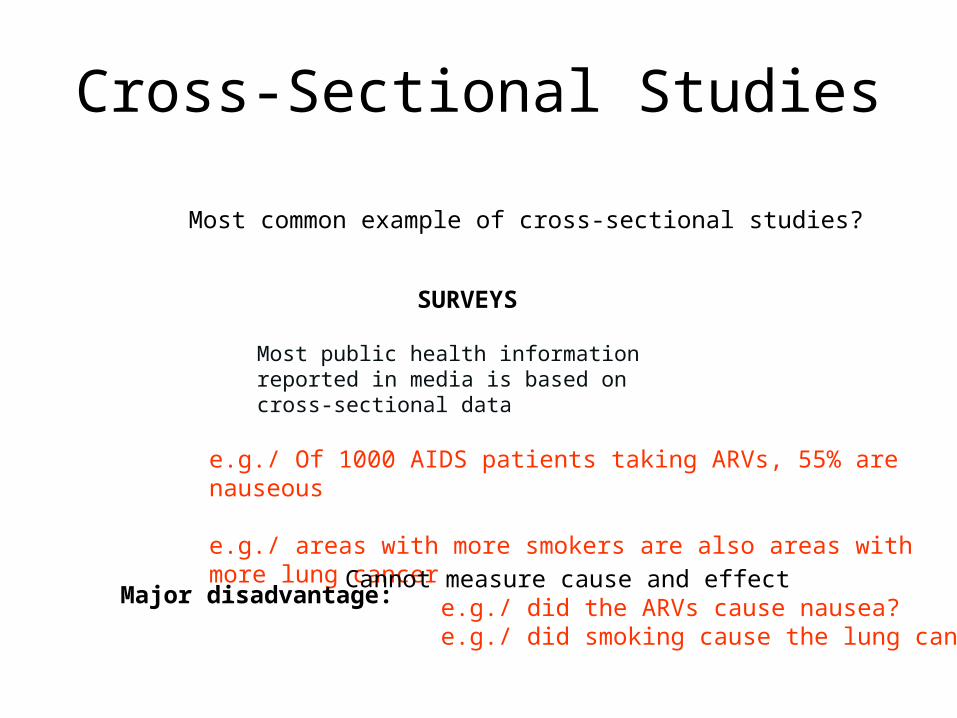
Cross-Sectional Studies
Most common example of cross-sectional studies?
e.g./ Of 1000 AIDS patients taking ARVs, 55% are nauseous
e.g./ areas with more smokers are also areas with more lung cancer
SURVEYS
Most public health information reported in media is based on cross-sectional data
Major disadvantage:Cannot measure cause and effect
e.g./ did the ARVs cause nausea?e.g./ did smoking cause the lung cancer?

2. Case-Control Studies
– Subjects are selected based on whether or not that they have the outcome you’re interested in
• You find people who have the outcome –cases• You choose people who don’t – controls• You look backwards to see what they were
exposed to– Challenge: selecting “controls” accordingly
A case-control study begins with the outcome(s) and works backwards to find the exposure(s)
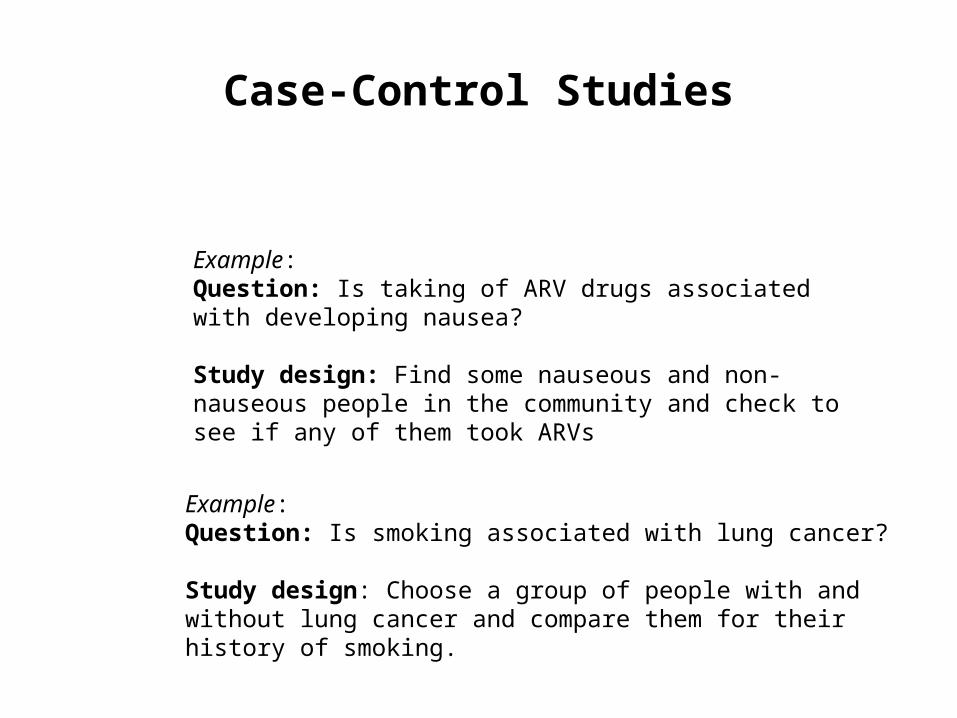
Case-Control Studies
Example: Question: Is taking of ARV drugs associated with developing nausea?
Study design: Find some nauseous and non-nauseous people in the community and check to see if any of them took ARVs
Example: Question: Is smoking associated with lung cancer?
Study design: Choose a group of people with and without lung cancer and compare them for their history of smoking.
Case-Control Studies
Example:Question: Is getting a tetanus vaccination associated with developing autism
among 4 year olds?
Choose a group of 4 year olds with autism and a group of 4 year olds without autism and compare them for their history of vaccination
Case-Control Studies
• Great for studies in which the outcome (disease) is rare
• Cannot measure incidence

Cohort Studies
• But first…..
A brief definition
• What is a “cohort”– Group of people defined has having a shared
event• Eg, Irish women born in 1954 are a cohort• 3rd year students at the University of Ottawa are a
cohort
• (based on Latin “cohort”, which was a military unit in the Roman army)
Cohort
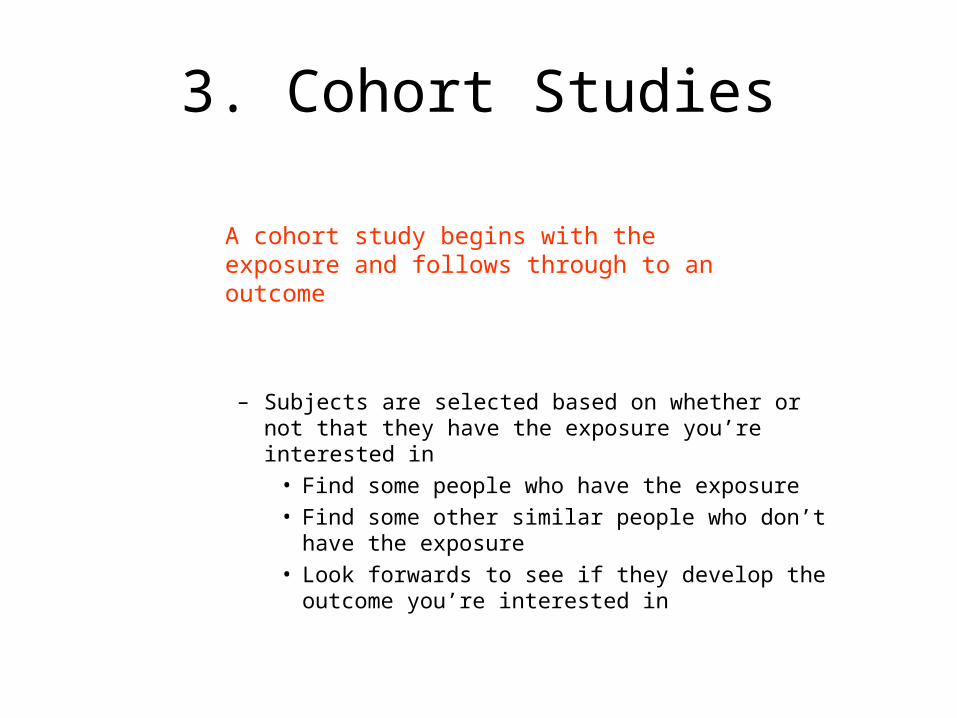
3. Cohort Studies
A cohort study begins with the exposure and follows through to an outcome
– Subjects are selected based on whether or not that they have the exposure you’re interested in
• Find some people who have the exposure• Find some other similar people who don’t have the
exposure • Look forwards to see if they develop the outcome
you’re interested in
Example: Question: Do ARV drugs cause nausea?
Study design: look at group taking ARV and another group not taking ARV and see who develops nausea from each group.
Cohort Studies
Example:Question: In this class, which study method is best for performing well on the
exam, studying the slides or studying the textbook?
Follow those who study only the slides and those who only study the textbook and see how they do on the exam
Cohort Studies
• Great for studies in which the exposure (risk factor) is rare
• Can determine incidence

Summary of Advantages
Exposure Outcome Study Type
Rare Common Cohort
Common Rare Case-control
Does moonwalking cause diabetes?
Does eating rice cause hermaphroditism?
In which study type can you measureincidence of disease?
Cohort
Case-control
Cohort
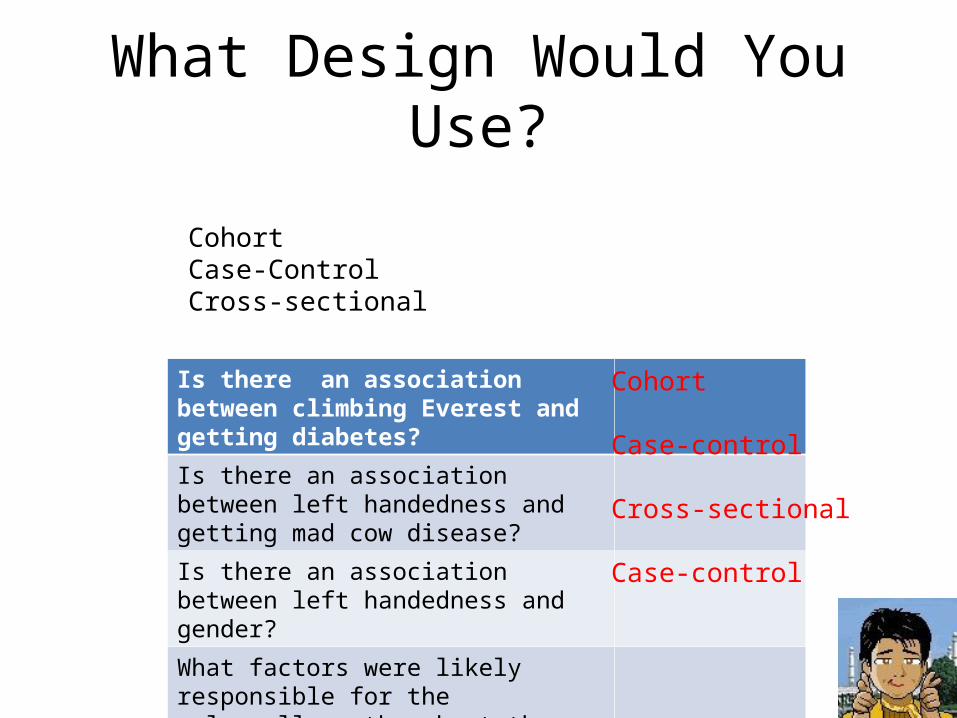
What Design Would You Use?
Is there an association between climbing Everest and getting diabetes?
Is there an association between left handedness and getting mad cow disease?
Is there an association between left handedness and gender?
What factors were likely responsible for the salmonella outbreak at the office Xmas party?
CohortCase-ControlCross-sectional
Cohort
Case-control
Cross-sectional
Case-control
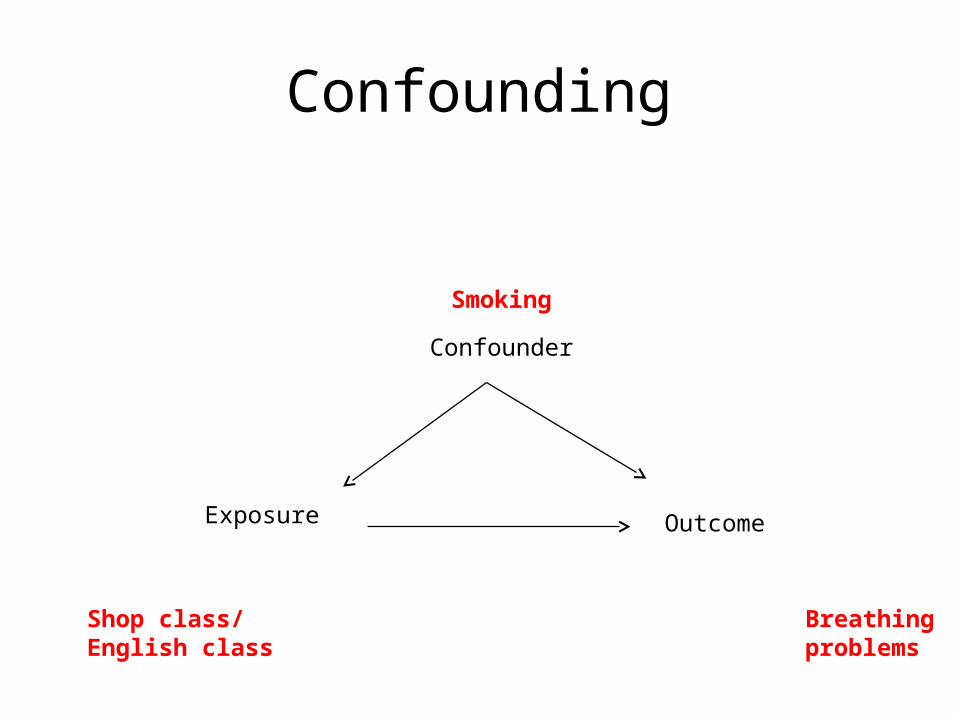
Confounding
Exposure Outcome
Confounder
Shop class/ BreathingEnglish class problems
Smoking

Classic Confounders
AgeSexSocioeconomic statusSmoking status
That’s why, often analyses are stratified by these variables

Confounding
A confounder is not in the causal pathway
Example:
Exposure: diet Outcome: heart disease
cholesterol
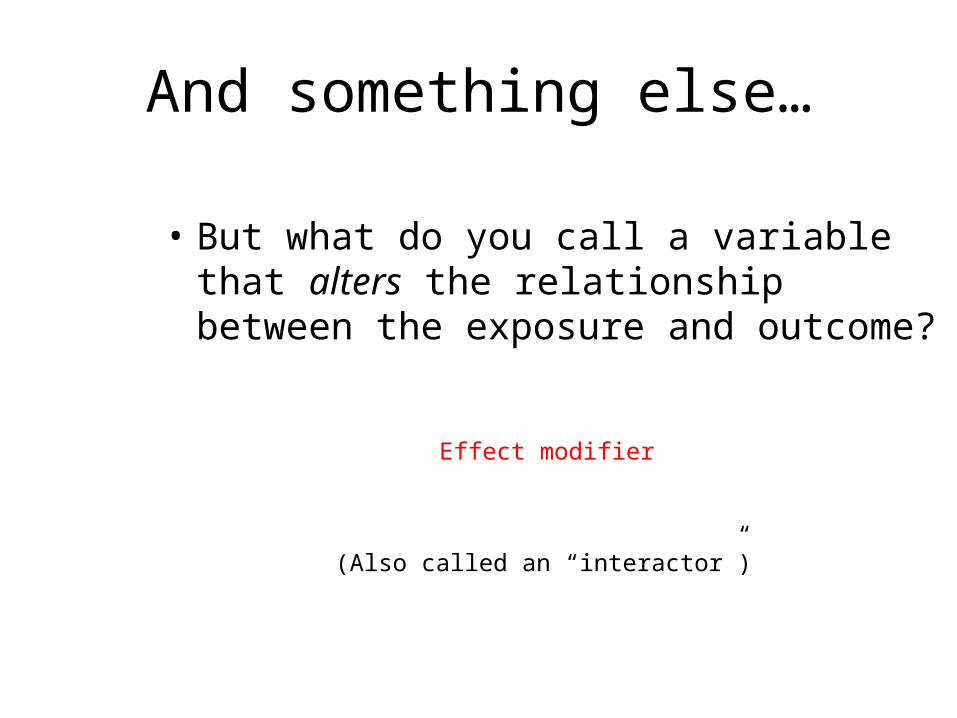
And something else…
• But what do you call a variable that alters the relationship between the exposure and outcome?
Effect modifier
(Also called an “interactor”)

Effect Modifier
• Factor that modifies the effect of the putative causal factor(s) under study
• Different from a confounder– Does not mask or create a relationship– Modifies the nature or direction of the
relationship

Example of Effect Modification
• The association between intense exercise and joint mobility:
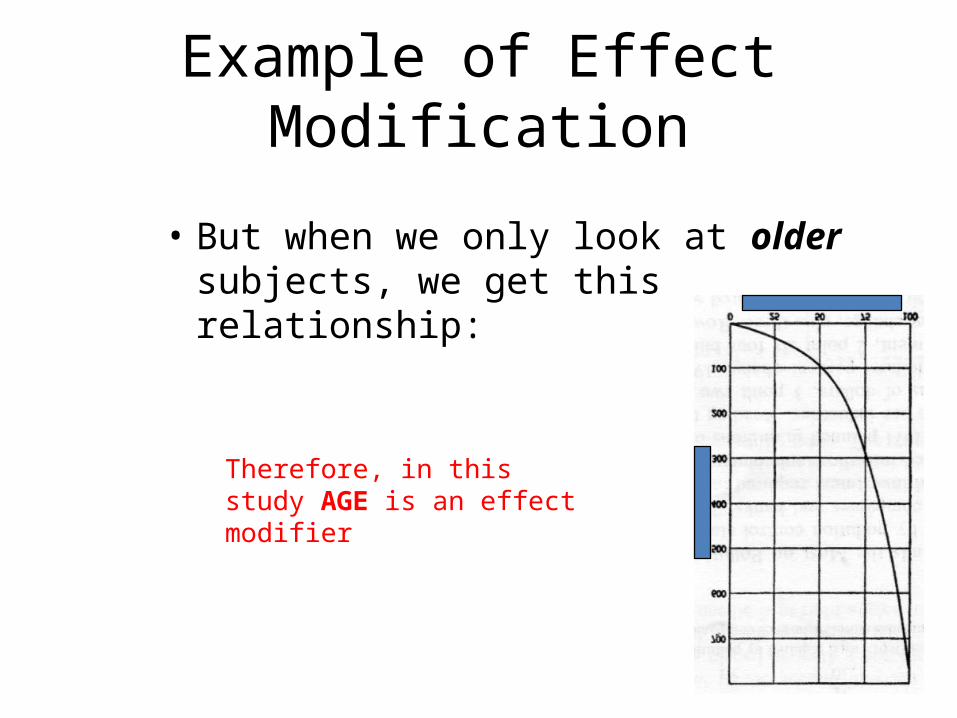
Example of Effect Modification
• But when we only look at older subjects, we get this relationship:
Therefore, in this study AGE is an effect modifier

Effect Modifier

Gender is an Age-Specific Effect Modifier for Papillary Cancers of the Thyroid Gland
Cancer Epidemiol Biomarkers Prev 2009;18(4):1092–100
Background: Thyroid cancer incidence rates have increased worldwide for decades, although more for papillary carcinomas than other types and more for females than males. There are few known thyroid cancer risk factors except female gender, and the reasons for the increasing incidence and gender differences are unknown. Methods: We used the National Cancer Institute's Surveillance, Epidemiology, and End Results 9 Registries Database for cases diagnosed during 1976-2005 to develop etiological clues regarding gender-related differences in papillary thyroid cancer incidence. Standard descriptive epidemiology was supplemented with age-period-cohort (APC) models, simultaneously adjusted for age, calendar-period and birth-cohort effects. Results: The papillary thyroid cancer incidence rate among females was 2.6 times that among males (9.2 versus 3.6 per 100,000 person-years, respectively), with a widening gender gap over time. Age-specific rates were higher among women than men across all age groups, and the female-to-male rate ratio declined quite consistently from more than five at ages 20-24 to 3.4 at ages 35-44 and approached one at ages 80+. APC models for papillary thyroid cancers confirmed statistically different age-specific effects among women and men (P < 0.001 for the null hypothesis of no difference by gender), adjusted for calendar-period and birth-cohort effects. Conclusion: Gender was an age-specific effect modifier for papillary thyroid cancer incidence. Future analytic studies attempting to identify the risk factors responsible for rising papillary thyroid cancer incidence should be designed with adequate power to assess this age-specific interaction among females and males.

Measures of Association
• What do we mean when we say “Smoking is associated with lung cancer”?
• There are three main measures:– Relative Risk (RR)– Odds Ratio (OR)– Attributable Risk (AR)
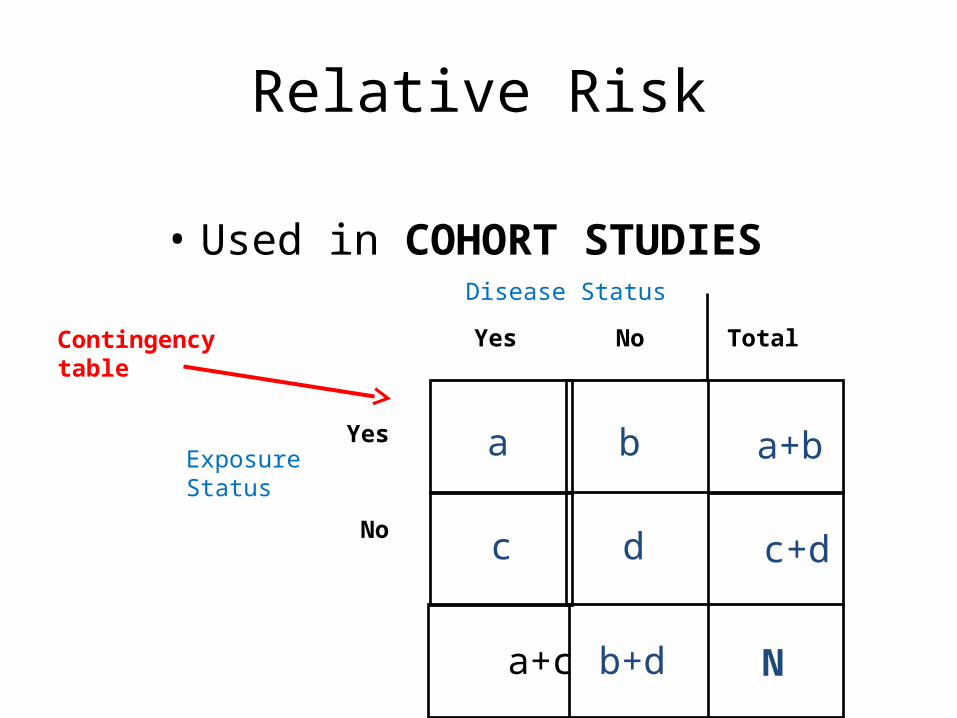
Relative Risk
• Used in COHORT STUDIES
N
dc
ba
Yes No
Disease Status
Yes
No
Exposure Status
a+b
c+d
b+d a+c
TotalContingencytable
N
dc
ba
Yes No
Disease Status
Yes
No
Exposure Status
a+b
c+d
b+d a+c
Total
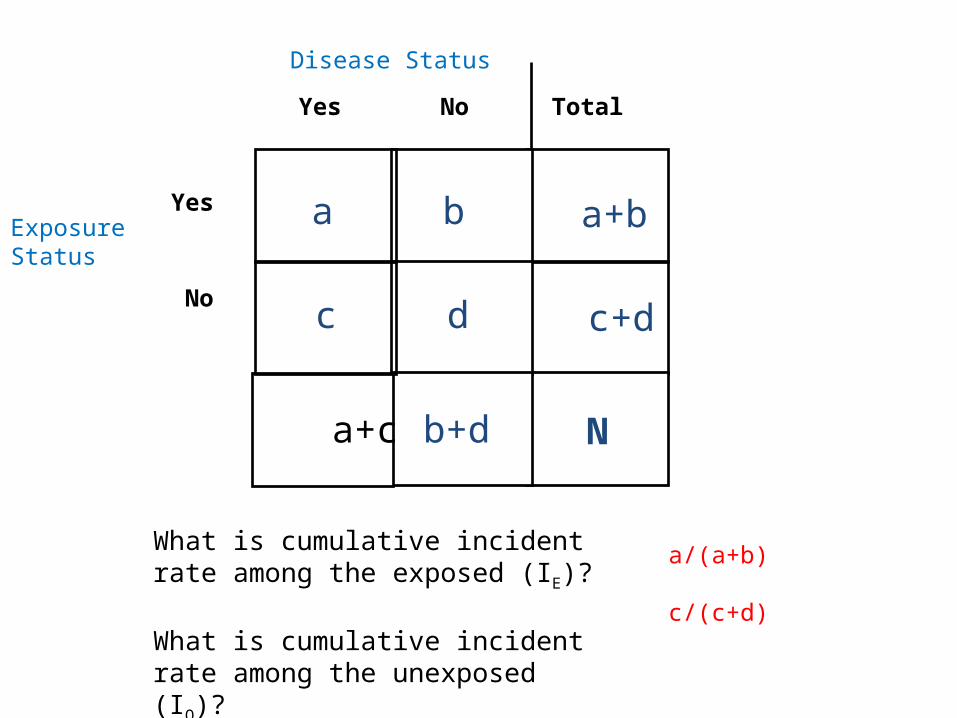
What is cumulative incident rate among the exposed (IE)?
What is cumulative incident rate among the unexposed (IO)?
a/(a+b)
c/(c+d)

N
dc
ba
Yes No
Disease Status
Yes
No
Exposure Status
a+b
c+d
b+d a+c
Total
RR = IE / IO
a/(a+b)= --------- c/(c+d)
Example
• A cohort study follows 100 smokers and 100 non-smokers over a 10 year period to determine who ends up with lung cancer

200
9010
2575
Yes No
Lung Cancer
Yes
No
Smoking 100
100
115 85
Total
RR = IE / IO
75/100= --------- 10/100
=7.5

A Quick Lesson in Logic• Necessary
– A necessary condition of a statement must be satisfied for the statement to be true.
– i.e., before B can be true, A must happen• Sufficient
– A sufficient condition is one that, if satisfied, assures the statement's truth
– i.e., whenever A happens, B must follow
Being a mammal is necessary, but not sufficient, to being human.
A leads to B
HIV is necessary to cause AIDS. But HIV is not sufficient to causing AIDs (since lots of people have HIV, but don’t get AIDS)
Decapitation is sufficient to cause death; however, people can die in many other ways, so decapitation is not necessary to cause death
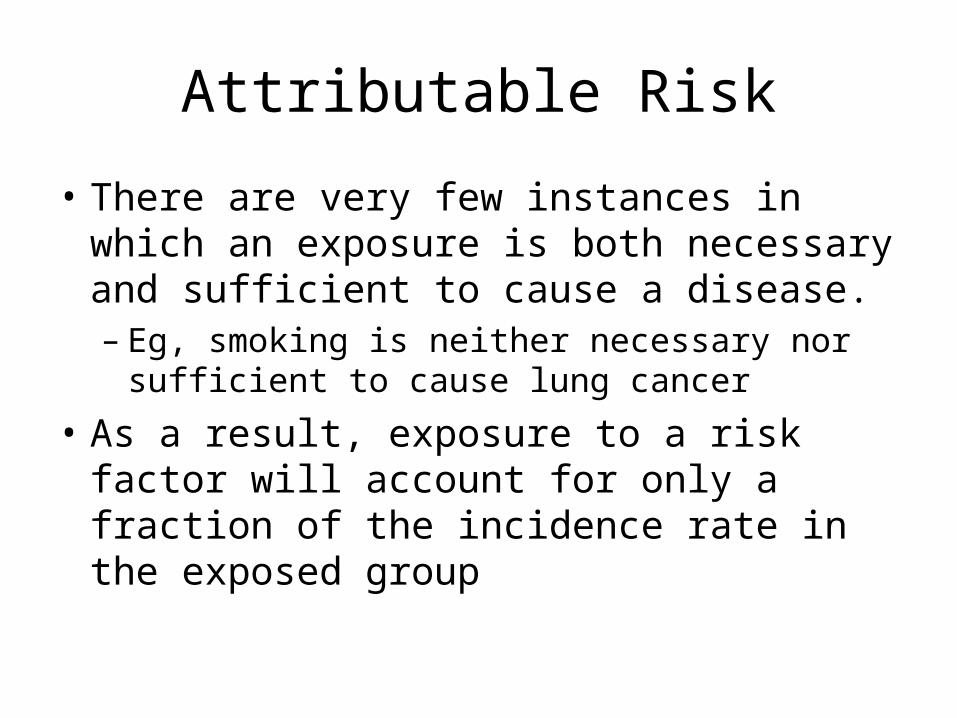
Attributable Risk
• There are very few instances in which an exposure is both necessary and sufficient to cause a disease.– Eg, smoking is neither necessary nor sufficient to
cause lung cancer
• As a result, exposure to a risk factor will account for only a fraction of the incidence rate in the exposed group
Attributable Risk
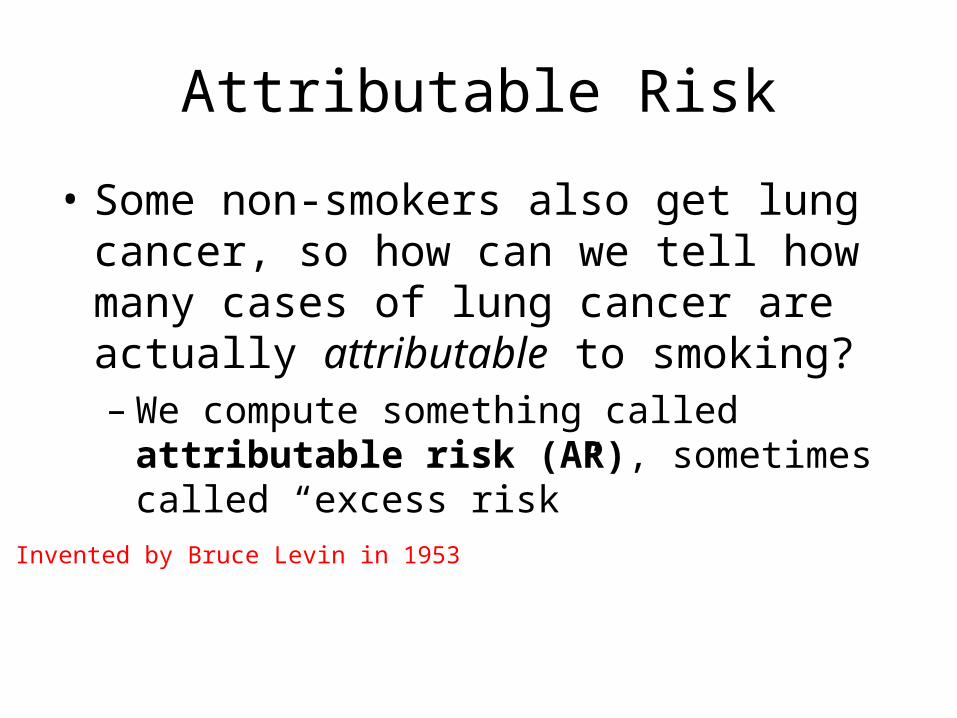
• Some non-smokers also get lung cancer, so how can we tell how many cases of lung cancer are actually attributable to smoking?– We compute something called attributable risk
(AR), sometimes called “excess risk”
Invented by Bruce Levin in 1953
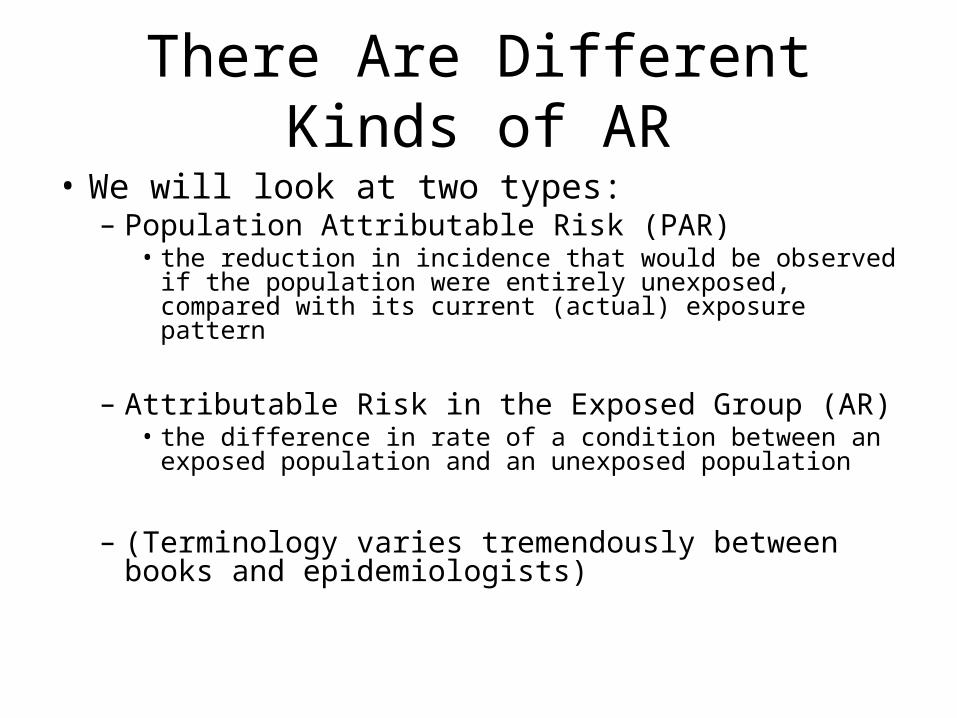
There Are Different Kinds of AR• We will look at two types:
– Population Attributable Risk (PAR)• the reduction in incidence that would be observed if the
population were entirely unexposed, compared with its current (actual) exposure pattern
– Attributable Risk in the Exposed Group (AR)• the difference in rate of a condition between an exposed
population and an unexposed population
– (Terminology varies tremendously between books and epidemiologists)

N
dc
ba
Yes No
Disease Status
Yes
No
Exposure Status
a+b
c+d
b+d a+c
Total
PAR = (IT – IO) / IT
Population AttributableRisk (PAR)
= [(a+c)/N + c/(c+d)] / [(a+c)/N]
N
dc
ba
Yes No
Disease Status
Yes
No
Exposure Status
a+b
c+d
b+d a+c
Total
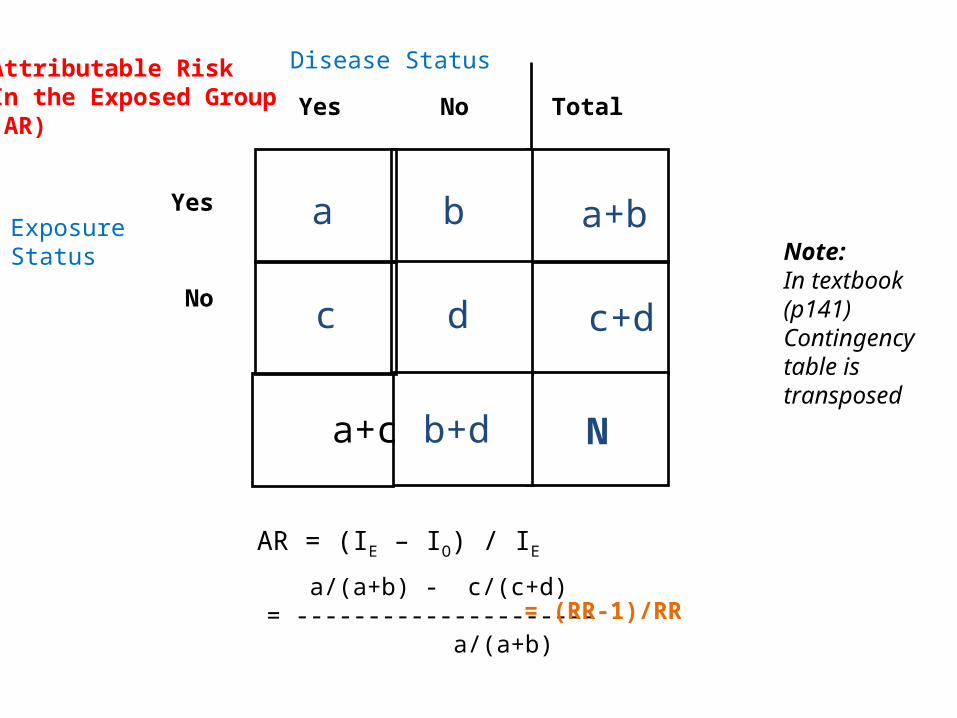
AR = (IE – IO) / IE
a/(a+b) - c/(c+d) = --------------------- a/(a+b)
= (RR-1)/RR
Attributable RiskIn the Exposed Group(AR)
Note:In textbook (p141)Contingency table is transposed
200
9010
2575
Yes No
Lung Cancer
Yes
No
Smoking 100
100
115 85
Total
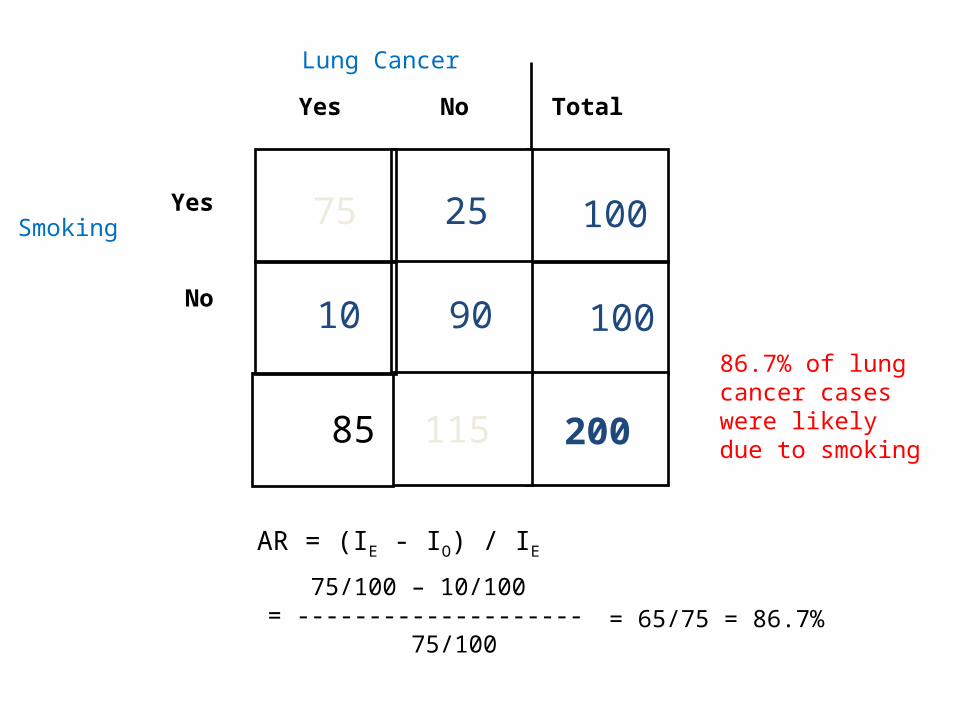
AR = (IE - IO) / IE
75/100 – 10/100= -------------------- 75/100
= 65/75 = 86.7%
86.7% of lung cancer cases were likely due to smoking
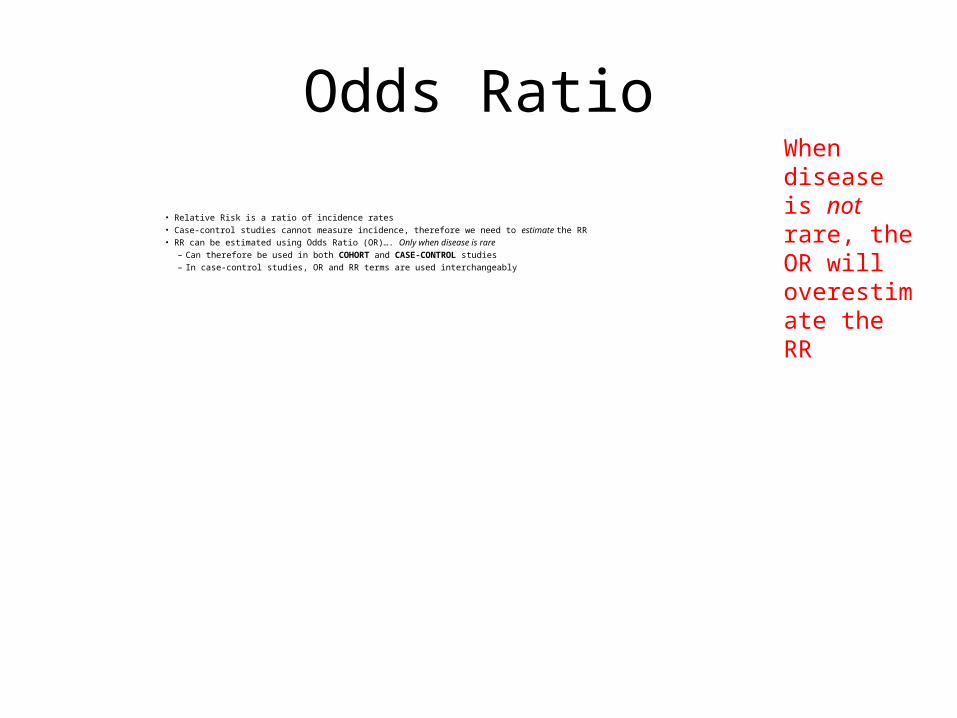
Odds Ratio
• Relative Risk is a ratio of incidence rates• Case-control studies cannot measure incidence, therefore we need to estimate the RR• RR can be estimated using Odds Ratio (OR)…. Only when disease is rare
– Can therefore be used in both COHORT and CASE-CONTROL studies– In case-control studies, OR and RR terms are used interchangeably
When disease is not rare, the OR will overestimate the RR
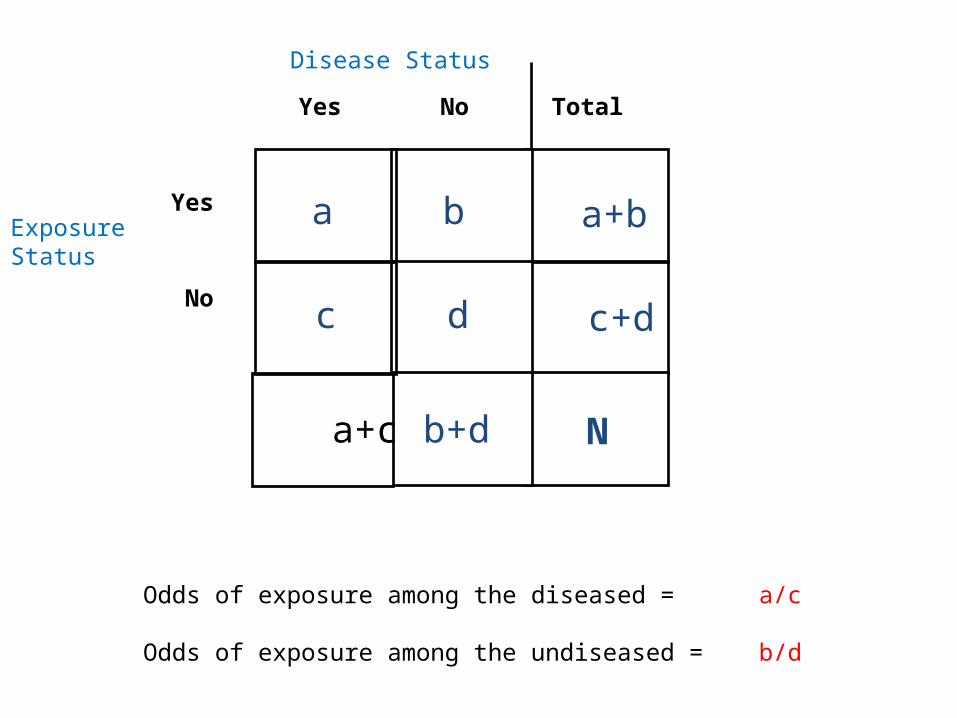
N
dc
ba
Yes No
Disease Status
Yes
No
Exposure Status
a+b
c+d
b+d a+c
Total
Odds of exposure among the diseased =
Odds of exposure among the undiseased =
a/c
b/d
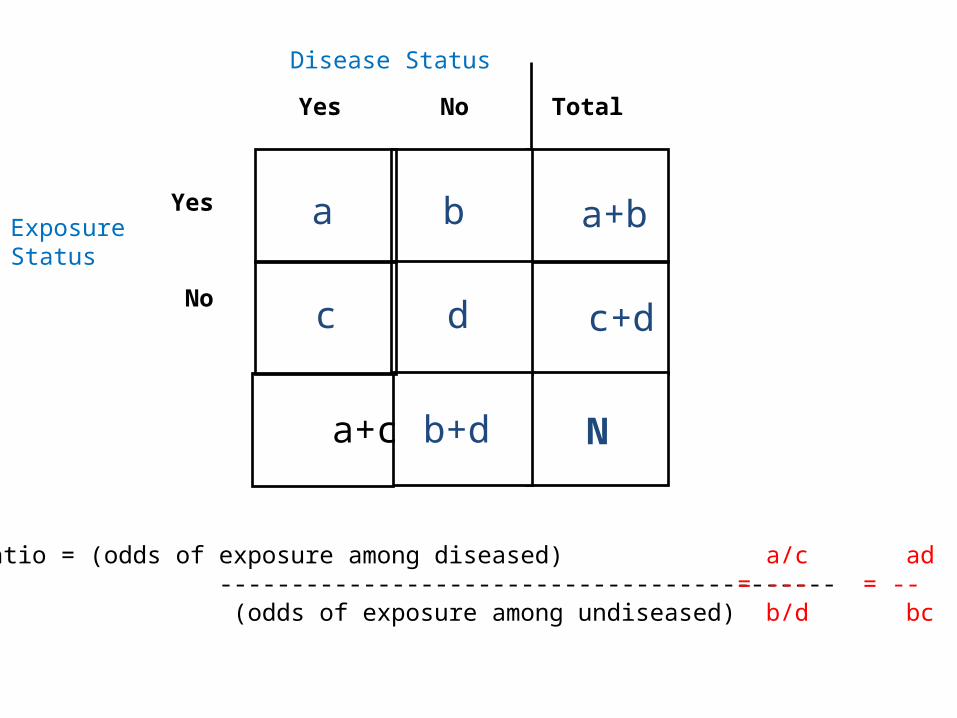
N
dc
ba
Yes No
Disease Status
Yes
No
Exposure Status
a+b
c+d
b+d a+c
Total
Odds Ratio = (odds of exposure among diseased) ------------------------------------------- (odds of exposure among undiseased)
a/c= --- b/d
ad= -- bc

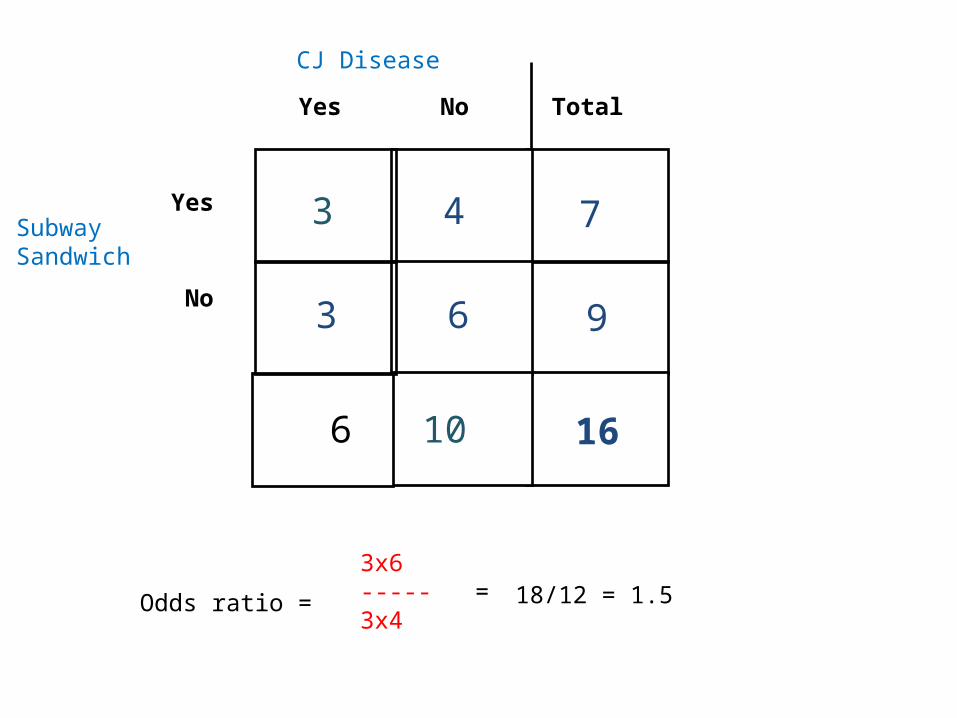
Example
• A study looks at 6 dudes with Creutzfeld-Jakob disease, and 10 dudes without… and looks back to see how many were exposed to Subway Sante Fe chicken sandwiches with double meat, extra dijon mustard, hot peppers and a pickle on the side.
What kind of study is this? Case-control
16
63
43
Yes No
CJ Disease
Yes
No
SubwaySandwich
7
9
10 6
Total
Odds ratio =
3x6----- =3x4
18/12 = 1.5
An example
• A study was done on 210 smokers and 240 no-smokers to see if smoking is associated with super-hot disease….

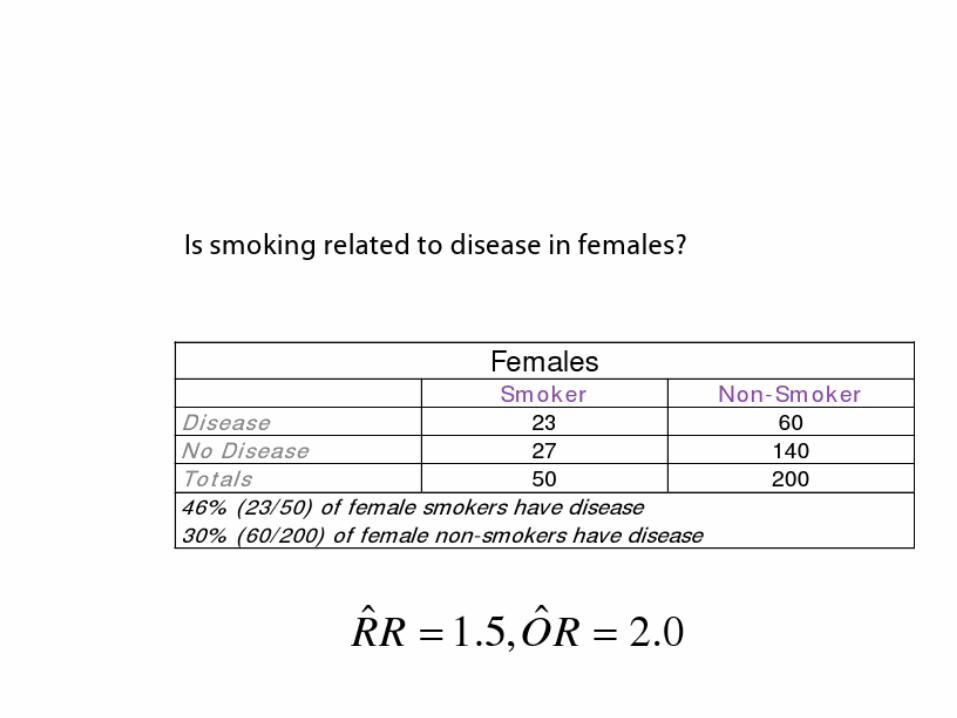
Smoking is not associated with being super hot

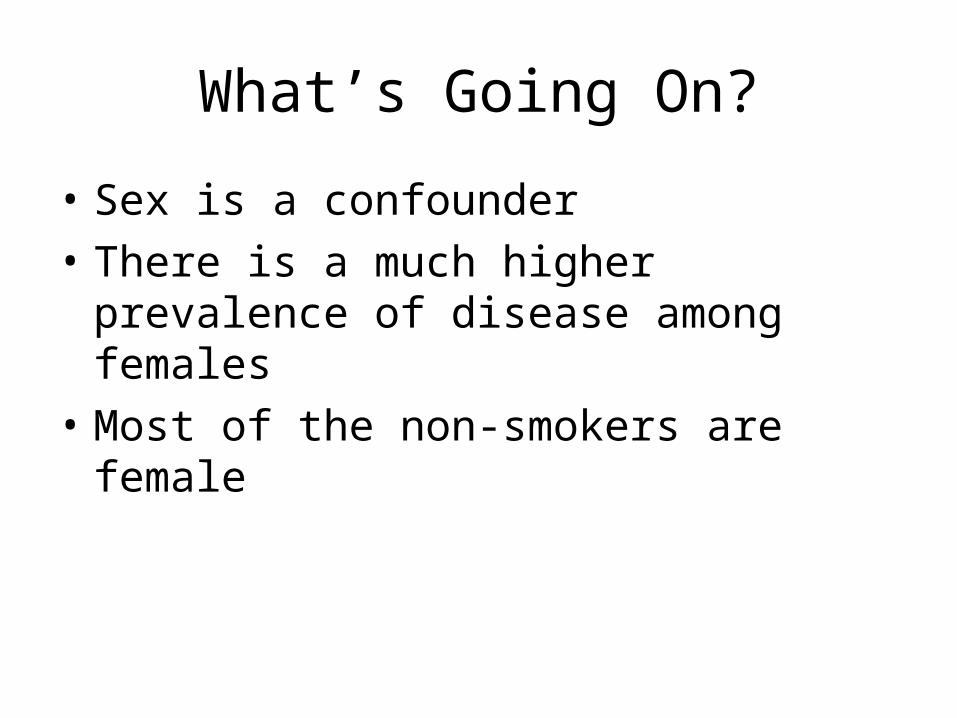
What’s Going On?
• Sex is a confounder• There is a much higher prevalence of disease
among females• Most of the non-smokers are female
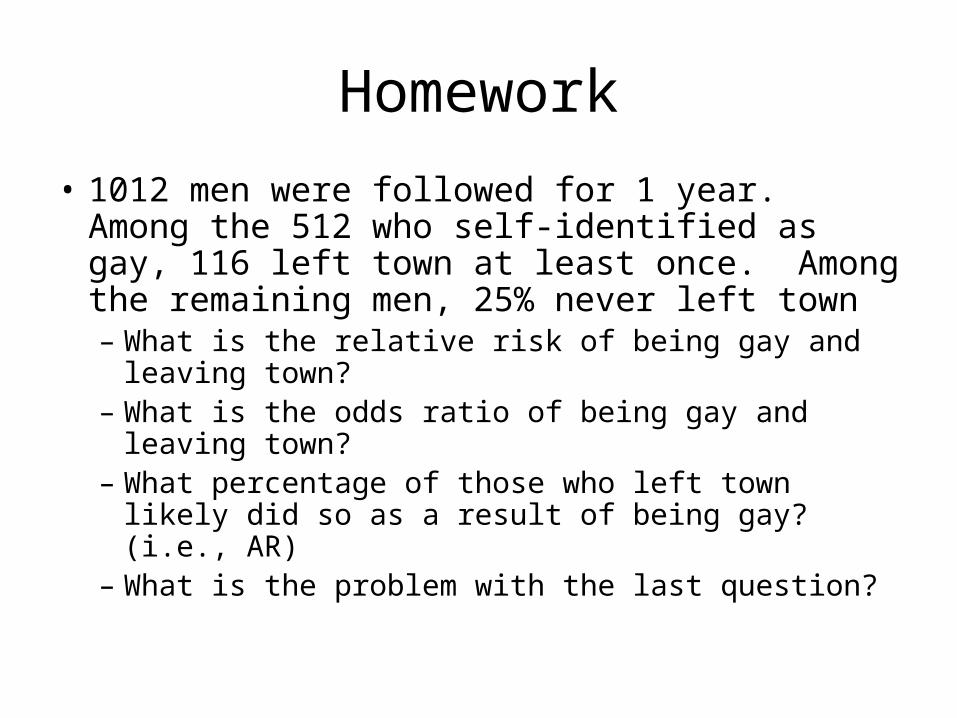
Homework
• 1012 men were followed for 1 year. Among the 512 who self-identified as gay, 116 left town at least once. Among the remaining men, 25% never left town– What is the relative risk of being gay and leaving
town?– What is the odds ratio of being gay and leaving town?– What percentage of those who left town likely did so
as a result of being gay? (i.e., AR)– What is the problem with the last question?