Longitudinal and Cross-Sectional Sequences in the Study of Age ...

Trinity University Trinity University
Digital Commons @ Trinity Digital Commons @ Trinity
Psychology Faculty Research Psychology Department
1-2010
Cross-Sectional Analysis of the Association Between Age and Cross-Sectional Analysis of the Association Between Age and
Corpus Callosum Size in Chimpanzees (Corpus Callosum Size in Chimpanzees (Pan troglodytes) )
William D. Hopkins
Kimberley A. Phillips Trinity University, [email protected]
Follow this and additional works at: https://digitalcommons.trinity.edu/psych_faculty
Part of the Psychology Commons
Publication Details Developmental Psychobiology
Repository Citation Repository Citation Hopkins, W. D., & Phillips, K. A. (2010). Cross-sectional analysis of the association between age and corpus callosum size in chimpanzees (Pan troglodytes). Developmental Psychobiology, 52(2), 133-141. doi: 10.1002/dev.20421
This Post-Print is brought to you for free and open access by the Psychology Department at Digital Commons @ Trinity. It has been accepted for inclusion in Psychology Faculty Research by an authorized administrator of Digital Commons @ Trinity. For more information, please contact [email protected].
Cross-Sectional Analysis of the Association Between Age and Corpus Callosum Size in Chimpanzees (Pan troglodytes)
William D. Hopkins1,2 and Kimberley A Phillips3
1 Department of Psychology, Agnes Scott College, Decatur, Georgia 30030
2 Division of Psychobiology, Yerkes National Primate Research Center, 954 Gatewood Road, Atlanta, Georgia 30329
3 Department of Psychology, Trinity University, San Antonio, Texas 78212
Abstract
The CC is the major white matter tract connecting the cerebral hemispheres and provides for
interhemispheric integration of sensory, motor and higher-order cognitive information. The
midsagittal area of the CC has been frequently used as a marker of brain development in humans.
We report the first investigation into the development of the corpus callosum and its regional
subdivisions in chimpanzees (Pan troglodytes). Magnetic resonance images were collected from
104 chimpanzees (female n = 63, male n = 41) ranging in age from 6 years (pre-pubescent period)
to 54 years (old age). Sustained linear growth was observed in the area of the CC subdivision of
the genu; areas of the the posterior midbody and anterior midbody displayed non-linear growth
during development. After adjusting for total brain size, we observed linear growth trajectories of
the total CC and CC subdivisions of the genu, posterior midbody, isthmus and splenium, and non-
linear growth trajectories of the rostral body and anterior midbody. These developmental patterns
are similar to the development of the CC in humans. As the growth curves of the CC mirrors
growth seen in the percentage of white matter in humans, our results suggest chimpanzees show
continued white matter development in regions related to cognitive development.
The well-known characteristics that distinguish humans from chimpanzees and other
primates include an enlargement of the brain, enhancement of capacities for cognition and
tool making, habitual bipedal walking, and an elongated potential lifespan (Carroll, 2003).
Another distinguishing characteristic concerns the susceptibility to neurological disease, as
humans appear to be particularly vulnerable to both neurodevelopmental and
neurodegenerative diseases such as Alzheimer's Disease, Parkinson's and HIV progression
into AIDS (Gearing et al., 1994; Hof et al., 2002; Olson & Varki, 2003 (but see Rosen et al.,
2008)). Determining the degree to which human brain development and aging differs from
chimpanzees and other primates is likely to further our understanding of not only
neurodevelopmental disorders and neurodegenerative disease but also differences in
cognitive and motor functions.
Correspondence regarding this paper can be sent to: William Hopkins, Department of Psychology, Agnes Scott College, 141 E. College Avenue, Decatur, Georgia 30030. [email protected].
HHS Public AccessAuthor manuscriptDev Psychobiol. Author manuscript; available in PMC 2015 June 13.
Published in final edited form as:Dev Psychobiol. 2010 March ; 52(2): 133–141. doi:10.1002/dev.20421.
Author M
anuscriptA
uthor Manuscript
Author M
anuscriptA
uthor Manuscript

The CC is the major white matter tract connecting the cerebral hemispheres and provides for
interhemispheric integration of sensory, motor and higher-order cognitive information. The
midsagittal area of the CC has been frequently used as a marker of brain development
(Rakic & Yakovlev, 1968; LaMantia & Rakic, 1990; Giedd et al., 1996; Snook et al., 2005;
Keshevan et al., 2002), hemispheric lateralization (Witelson & Goldsmith, 1991), and
connectivity and function (Luders et al., 2007; Muetzel et al., 2008; Ringo et al., 1994; Wahl
et al., 2007).
The CC can be subdivided into regions based on microstructure and functional connectivity
with cortical areas (Alexander et al., 2007; Aboitiz et al., 1992; Hofer & Frahm, 2006). A
commonly used approach is to divide the CC into seven subdivisions: rostrum, genu, rostral
body, anterior midbody, posterior midbody, isthmus and splenium (Aboitiz et al., 1992;
Witelson & Goldsmith, 1991). The anterior regions of the rostrum, genu and rostral body
connect primarily higher-order cognitive regions; the anterior and posterior midbody
connect primarily sensorimotor regions; the posterior regions of the isthmus and splenium
integrate visuospatial regions of the cortex.
The CC undergoes significant developmental changes throughout the human lifespan (Allen
et al., 1991; Pujol et al., 1993; Giedd et al., 1999; Lenroot et al., 2007). Across the lifespan,
the midsagittal CC area growth curve follows an inverted U-shaped developmental pattern
(Allen et al., 1991; Cowell et al., 1992; Hayakawa et al., 1989; Pujol et al., 1993; Hasan,
Ewing-Cobbs et al., 2008). The growth trajectories of the CC subdivisions are also nonlinear
and vary at the macrostructural and microstructural levels by subdivision (Hasan, Kamali et
al., 2008). While some have reported sex differences in growth rates of the CC, with males
having higher growth rates than females (De Bellis et al., 2001; Pujol et al., 1993), others
have not (Giedd et al.1999; Hasan, Kamali et al., 2008; Lenroot et al., 2007; Rajapakse et
al., 1996).
Despite being our closest primate relative, little is known about brain development in
chimpanzees except that postnatal brain growth accounts for approximately 65 – 75% of
total brain size (Vinicius, 2005). One reason for this lack of information includes the
difficulty in obtaining either in vivo or post mortem samples for analysis. For the past 12
years, systematic collection of magnetic resonance images have been obtained in a sample
of chimpanzees housed at the Yerkes National Primate Research Center. Though a
moratorium on breeding chimpanzees in U.S. research facilities has been in place for 10
years and therefore very young chimpanzees were not available for imaging, the long term
acquisition of these brain data provides an opportunity to consider age-related changes in the
size of the CC from a cross-sectional perspective beginning with the juvenile period of life
into adulthood and old age. In this report we describe the development of the chimpanzee
CC from a cross-sectional sample, ranging in age from 6 years to 54 years, from non-
invasive MR imaging. Because our sample varied in sex and handedness and these variables
might be confounded with variation in relative CC size (Witselson & Goldsmith, 1991), we
statistically controlled for them., Handedness was assessed using a task requiring
coordinated bimanual actions referred to as the TUBE task and has been described in detail
elsewhere (Hopkins, 1995).
Hopkins and Phillips Page 2
Dev Psychobiol. Author manuscript; available in PMC 2015 June 13.
Author M
anuscriptA
uthor Manuscript
Author M
anuscriptA
uthor Manuscript

Method
Subjects
Magnetic resonance images were collected from 104 chimpanzees (Pan troglodytes; female
n = 63, male n = 41), ranging in age from 6 years to 54 years (Mean = 22.64, s.d. = 11.83).
As male chimpanzees enter puberty around 9 years, and females at 8 years (Pusey, 1990) our
sample begins at the pre-pubescent period and extends through aged chimpanzees. All the
chimpanzees were members of a captive colony housed at Yerkes National Primate
Research Center (YNPRC) in Atlanta, Georgia.
Image Collection and Procedure
In vivo and post-mortem MRI scans were obtained in this study. All postmortem scans were
of chimpanzees that had died from natural causes. In total, 22 chimpanzees were scanned
post-mortem while the remaining 82 subjects were scanned in vivo. For the chimpanzees
scanned in vivo, the apes were first immobilized by ketamine injection (10 mg/kg) and
subsequently anaesthetized with propofol (40–60 mg/(kg/h)) following standard procedures
at the YNPRC. Subjects were then transported to the MRI facility. The subjects remained
anaesthetized for the duration of the scans as well as the time needed to transport them
between their home cage and the imaging facility (total time ~ 1.5 h). Subjects were placed
in the scanner chamber in a supine position with their head fitted inside the human-head
coil. Scan duration ranged between 40 and 80 min as a function of brain size.
Forty-seven chimpanzees were scanned on the same 3.0 Tesla scanner (Siemens Trio)
located at YNPRC. T1-weighted images were collected using a 3D gradient echo sequence
(pulse repetition = 2300 ms, echo time = 4.4 ms, number of signals averaged = 3, matrix size
= 320 x 320). The remaining 35 chimpanzees were scanned using a 1.5 T machine. T1-
weighted images were collected in the transverse plane using a gradient echo protocol (pulse
repetition =19.0 ms, echo time = 8.5 ms, number of signals averaged 8, and a 256 X 256
matrix). For the 22 postmortem scans, T2-weighted images were collected in the transverse
plane using a gradient echo protocol (pulse repetition = 22.0 s, echo time = 78.0 ms, number
of signals averaged = 8-12, and a 256 × 192 matrix reconstructed to 256 × 256).
After completing MRI procedures, the subjects scanned in vivo were returned to the YNPRC
and temporarily housed in a single cage for 6–12 h to allow the effects of the anesthesia to
wear off, after which they were returned to their home cage. The archived MRI data were
stored on optical diskettes and transported to an ANALYZE workstation for post-image
processing.
Image Quantification Method
Corpus callosum area measurements were taken from the midsagittal slice using a method
described by Witelson (1989) and others (Phillips, Sherwood, & Lilak, 2007; Pierre,
Hopkins, Taglialatela, Lees, & Bennett, 2008) . The method divides the CC into seven
segments which are roughly associated with different sets of fiber projections to various
cortical regions of the brain (Pandya, Karol, & Heilbronn, 1971; Witelson, 1989) (see Figure
1). ANALYZE 7.0, an MRI analysis software program distributed by the Mayo Clinic, was
Hopkins and Phillips Page 3
Dev Psychobiol. Author manuscript; available in PMC 2015 June 13.
Author M
anuscriptA
uthor Manuscript
Author M
anuscriptA
uthor Manuscript

used to divide and measure the corpus callosum. To subdivide the CC, the entire length of
the CC was first measured, then divided into thirds. The anterior third was further divided
into three regions by tracing a vertical line through the point where the anterior CC began to
curve back slightly. This resulted in three subdivisions: rostrum (1), genu (2), and the rostral
body (3). The middle third of the overall CC was subdivided into equal sections, resulting in
the anterior midbody (4) and posterior midbody (5). Finally, the posterior third of the overall
CC was subdivided into the isthmus (6) and splenium (7). The splenium was defined as the
posterior fifth of the entire CC; the remaining area within the posterior third was defined as
the isthmus. Using the tracing tool, the area (in mm2) of the CC lying within each outlined
region was measured in each individual.
Individual brain volumes were also determined for each subject using an automated
segmentation program. Each individual MRI scan was segmented into grey, white and CSF
tissue using FSL (Analysis Group, FMRIB, Oxford, UK) (Smith et al., 2004; Zhang, Brady,
& Smith, 2001). Brain volumes were calculated by adding the summed grey and white
matter volumes, thereby omitting all CSF in the calculation of the volume.
Handedness Measurement
As noted above, we sought to statistically control for individual differences in handedness as
well as the chimpanzee sex in our assessment of age-related changes in relative CC size. For
this study, we used handedness data for a task requiring coordinated bimanual actions,
referred to as the TUBE task (Hopkins, 1995). Though we were not specifically interested in
the association between handedness and CC size in this paper, here we provide a brief
description of the procedure used to assess handedness. For the TUBE task, peanut butter is
smeared on the inside edges of poly-vinyl-chloride (PVC) tubes approximately 15 cm in
length and 2.5 cm in diameter. Peanut butter is smeared on both ends of the PVC pipe and is
placed far enough down the tube such that the subjects cannot lick the contents completely
off with their mouths but rather must use one hand to hold the tube and the other hand to
remove the substrate. The PVC tubes were handed to the subjects in their home cages and a
focal sampling technique was used to collect individual data from each subject. The hand of
the finger used to extract the peanut butter was recorded as either right or left by the
experimenter. Each time the subjects reached into the tube with their finger, extracted peanut
butter and brought it to their mouth, the hand used was recorded as left or right. For each
chimpanzee, a handedness index (HI) was derived by subtracting the number of left-handed
responses from the number of right-handed responses and dividing by the total number of
responses: HI = (R – L) / (R + L). Positive values reflect right-hand preference and negative
values represent left-hand preference. In the analysis of age related changes in CC size, the
HI values served as a predictor variable in order to account for this variable in the regression
analyses.
Data analysis
We analyzed growth of the CC using both the raw area measures of the total CC and its
subdivisions, and the size of the total CC and its subdivisions after adjusting for brain size.
To statistically adjust the CC data for total brain volume, we followed a recommendation by
Smith (2005) wherein the square root of the CC area was divided by the cube root of the
Hopkins and Phillips Page 4
Dev Psychobiol. Author manuscript; available in PMC 2015 June 13.
Author M
anuscriptA
uthor Manuscript
Author M
anuscriptA
uthor Manuscript

brain volume (grey and white matter only) for each individual to bring all measures into the
same geometric dimensionality. Additionally, we applied this adjustment to the various
subdivisions of the CC following the same formula. Analyses of total CC area and CC
subdivision areas were conducted using a one-way MANCOVA to determine the effect of
sex on these areas while controlling for age. F- tests were then used to determine whether
linear or quadratic growth models best fit the developmental change in these regions (Hasan
et al., 2008; McLaughlin et al., 2007; Phillips & Sherwood, 2008; Pujol et al., 1993; Rauch
& Jinkins, 1994). SPSS 15.0 was used for conducting all analyses.
Results
Because we obtained MRI scans on both cadaver and in vivo specimens, we initially ran an
analysis to assess whether the relative sizes in the 7 CC regions differed significantly
between the two cohorts using MANCOVA. Sex (male, female) and specimen type
(cadaver, in vivo) were the independent variables while the ratio values for each CC region
served as the dependent variable. Age was a covariate. Neither sex nor specimen type were
significant main effects in the MANCOVA nor was the interaction between these two
variables significant; however, the covariate (age) significantly influenced the combined
DV, Wilks’ Λ = .789, F (7, 91) = 3.469, P = .003, multivariate partial η2 = .211. Univariate
ANOVA results indicated the total CC midsagittal area (F (1, 97) = 10.82, P < .000, η2 = .
10) and callosal subdivisions of the genu (F (1, 97) = 4.03, P =.05, η2 = .04), rostral body (F
(1, 97) = 6.49, P =.016, η2 = .06), anterior midbody (F (1, 97) = 8.09, P = .008, η2 = .08),
posterior midbody (F (1, 97) = 10.46, P = .001, η2 = .10), isthmus (F (1, 97) = 15.01, P < .
000, η2 = .14), and splenium (F (1, 97) = 7.10, P = .017, η2 = .07) were all significantly
affected by the covariate age.
We conducted similar analyses on the raw area measures to assess whether CC size differed
significantly between the two cohorts. Neither sex nor specimen type were significant main
effects in the MANCOVA nor was the interaction between these two variables significant;
however, there was a borderline significant effect of the covariate (age) on the combined
DV, Wilks’ Λ = .876, F (7, 93) = 1.86, P = .08, multivariate partial η2 = .124. Univariate
ANOVA results indicated the total CC midsagittal area (F (1, 97) = 10.82, P < .000, η2 = .
10) and callosal subdivisions of the rostral body (F (1, 97) = 4.44, P =.038, η2 = .04),
anterior midbody (F (1, 97) = 5.27, P = .024, η2 = .05), posterior midbody (F (1, 97) = 4.51,
P = .036, η2 = .05), and isthmus (F (1, 97) = 8.39, P = .005, η2 = .08 were all significantly
affected by the covariate age.
To further assess the nature of the relationship between age and CC size, we used the curve
fit function in SPSS to evaluate whether linear or quadratic changes best explained the
developmental change. To control for the subjects sex and handedness, the HI values for the
TUBE task and the dummy coded sex scores (−1= female, 1 = male) were entered as
predictor variables in a stepwise multiple regression analysis. Following the entry of these
two variables, the linear and quadratic age predictor variables were subsequently entered in
to the regression model. This analysis was conducted on the raw and adjusted CC area
measures.
Hopkins and Phillips Page 5
Dev Psychobiol. Author manuscript; available in PMC 2015 June 13.
Author M
anuscriptA
uthor Manuscript
Author M
anuscriptA
uthor Manuscript

The cumulative R values for the predictor variables of sex, handedness and the linear and
quadratic age components when regressed on each adjusted CC region are shown in Table 1.
Sex accounted for a significant proportion of variance in relative CC size for the total CC
and the subdivisions of the rostral body, anterior midbody, posterior midbody, isthmus and
splenium. Handedness on the TUBE task accounted for a borderline significant proportion
of variance for the subdivision of the genu. Additionally, a significant proportion of
variability in relative CC size in relation to age was explained by either the linear or
quadratic equation for all regions, save the rostrum. Linear equations best explained
variability in the total CC, genu, posterior midbody, isthmus and splenium. Quadratic
equations explained a significant proportion of variance, over and above that of the linear
equation, for the rostral body and anterior midbody. These best fit parameters were used to
generate the growth curves that are illustrated in Figures 2a and 3.
The cumulative R values for the predictor variables of sex, handedness and the linear and
quadratic age components when regressed on each raw CC region are shown in Table 2. Sex
accounted for a significant proportion of variance for the total CC and subdivisions of
anterior midbody, posterior midbody, and isthmus. Handedness did not account for a
significant proportion of variance in CC size for any of the regions. A significant proportion
of variability in CC size in relation to age was explained by either the linear or quadratic
equation for the total CC, isthmus and anterior midbody. Linear equations best explained
variability in the total CC and isthmus; quadratic equations explained a significant
proportion of variance, over and above that of the linear equation, for the rostral body and
anterior midbody. It should noted though that the multiple R value for the rostral midbody
was not significant, thus the significant quadratic association found between age and this CC
region should be interpreted cautiously. These best fit parameters were used to generate the
growth curves that are illustrated in Figures 2b and 4.
Discussion
Our results show growth trajectories of the total CC and CC subdivisions in chimpanzees
that vary by region and continue to increase in midsagittal area well into adulthood. The CC
has been widely viewed as an ideal structure for quantifying brain development as growth
trajectories of the human CC correspond to lifespan growth curves of white matter volume
(Sowell et al., 2003; Hasan et al., 2007). These results thus suggest that chimpanzees display
continued development of cortical white matter into adulthood.
The area of the genu showed linear growth, increasing in area across the juvenile – late
adulthood period. For the rostral body and anterior midbody areas, the quadratic equation
accounted a significantly greater amount of variability in CC size compared to the linear
equation, indicating that these subdivisions displayed non-linear growth. These growth
trajectories are similar to reports of human CC growth during development (Allen et al.,
1991; Cowell et al., 1993; Hasan et al., 2008; Hayakawa et al., 1989; Pujol et al., 1993;
Rauch & Jinkins, 1994). One difference between humans and chimpanzees concerning life-
span development of the CC is that humans show decreases in CC size during old age
(Hasan et al., 2008). Our chimpanzee sample did not display this decrease.
Hopkins and Phillips Page 6
Dev Psychobiol. Author manuscript; available in PMC 2015 June 13.
Author M
anuscriptA
uthor Manuscript
Author M
anuscriptA
uthor Manuscript

In humans, the growth curve of the CC mirrors growth curves in the percentage of white
matter (Hasan et al., 2007; Sowell et al., 2003). Furthermore, there is an increasing
accumulation of data supporting that maturation of white matter is related to the
development of cognitive functions including bimanual coordination (Muetzel et al., 2008),
proficiency in reading ability (Beaulieu et al., 2005; Deutsch et al., 2005; Klingberg et al.,
2000; Niogi & McCandliss, 2006), reaction time (Liston et al., 2006) and visuospatial
working memory (Mabbott et al., 2006; Nagy et al., 2004; Olesen et al., 2003). While
similar studies correlating the development of both cognitive function and brain
development are lacking in chimpanzees, an ongoing longitudinal study of chimpanzee brain
development indicated rapid growth in the prefrontal cortex from age 1.5 to 6 years which
continued to develop into adulthood, similar to humans (Sakai et al., 2008). Our failure to
detect significant developmental trajectories in the rostrum, corresponding to one region of
white matter growth associated with prefrontal cortex, is likely explained by the absence of
subjects less than 6 years. However, the genu did display significant linear growth,
indicating continued development of fibers connecting higher-order cognitive regions into
adulthood. This suggests that, similar to humans, chimpanzees show continued white matter
development related to cognitive development well into adulthood.
Sex differences in the growth of the chimpanzee CC were detected in this sample for total
CC and subdivisions of anterior midbody, posterior midbody, and isthmus when considering
both the adjusted CC measures and the raw area measures. While some have reported sex
differences in humans in the growth trajectories of the CC and its subdivisions (De Bellis et
al., 2001; Pujol et al., 1993), others have not (Giedd et al., 1999; Hasan et al., 2008; Lenroot
et al., 2007; Rajapakse et al., 1996). However, it is important to note that the current sample
was not matched with respect to age and sex; in particular there were few older males in the
dataset.
Increases in midsagittal area of the human CC appear to be related to increased myelination
more than increased axonal density (Aboitiz et al., 1992; LaMantia & Rakic, 1990);
presumably similar mechanisms underlie these increases in chimpanzees but postmortem
histological data are necessary to evaluate this hypothesis. A microstructural analysis of the
chimpanzee CC across the lifespan would allow for examination of the fiber tracts
connecting prefrontal cortical regions (higher association areas) to determine if these areas
in particular show greater myelination during development. Unfortunately, due to the
difficulty of obtaining chimpanzee post-mortem tissue samples, it seems unlikely that such
an analysis will be completed anytime in the immediate future. As an alternative approach to
measuring myelination development, in chimpanzees (and indeed in many primate species)
perhaps some tests of interhemispheric transfer could be beneficial.
The sustained growth in midsagittal area of the CC might also reflect the relative proportion
of white matter in brain region corresponding to terminal homotopic regions within the
cortex. Studies of the proportion of white to gray matter in chimpanzees have shown that the
central regions corresponding to primary motor and somatosensory cortex have relatively
large proportion of white matter compared to premotor and prefrontal cortex (Hopkins,
Taglialatela, Dunham, & Pierre, 2007). Thus, the different developmental trajectory may
Hopkins and Phillips Page 7
Dev Psychobiol. Author manuscript; available in PMC 2015 June 13.
Author M
anuscriptA
uthor Manuscript
Author M
anuscriptA
uthor Manuscript

simply reflect the number of connections that must form between these regions relative to
other cortical areas during development.
In summary, our results provide the first data on development of the CC from the juvenile
period through adulthood in chimpanzees. Our study statistically controlled for the possible
confounds of sex and handedness effects. Ideally, longitudinal studies would provide a more
accurate means of tracking the development of the CC in chimpanzees and other primates
for comparison to humans. This may lead to important discoveries on the similarities and
differences that may underlie the development and evolution of higher order cognitive and
motor functions in primates, including humans.
Acknowledgement
This research was supported in part by NIH grants NS-36605, NS-42867, and HD-56232. The Yerkes Center is fully accredited by the American Association for Accreditation of Laboratory Animal Care. American Psychological Association guidelines for the ethical treatment of animals were adhered to during all aspects of this study and institutional animal care and use approval was obtained before conducting this work.
References
Aboitiz F, Scheibel AB, Fisher RS, Zaidel E. Fiber composition of the human corpus callosum. Brain Research. 1992; 11:143–153. [PubMed: 1486477]
Alexander AL, Lee JE, Lazar M, Boudos R, Dubray MB, Oakes TR, Miller JN, Lu J, Jeong EK, McMahon WM, Bigler ED, Lainhart JE. Diffusion tensor imaging of the corpus callosum in Autism. Neuroimage. 2007; 34:61–73. [PubMed: 17023185]
Allen LS, Richey MF, Chai YM, Gorskiu RA. Sex differences in the corpus callosum of the living human being. Journal of Neuroscience. 1991; 11:933–942. [PubMed: 2010816]
Beaulieu C, Plewes C, Paulson LA, Roy D, Snook L, Concha L, Phillips L. Imaging brain connectivity in children with diverse reading ability. NeuroImage. 2005; 25:1266–1271. [PubMed: 15850744]
Carroll SB. Genetics and the making of Homo sapiens. Nature. 2003; 422:849–857. [PubMed: 12712196]
Cowell PE, Allen LS, Zalatimo NS, Denenberg VH. A developmental study of sex and age interactions in the human corpus callosum. Developmental Brain Research. 1992; 66:187–192. [PubMed: 1606684]
De Bellis MD, Keshavan MS, Beers SR, Hall J, Frustaci K, Masalehdan A, Noll J, Boring AM. Sex differences in brain maturation during childhood and adolescence. Cerebral Cortex. 2001; 11:552–557. [PubMed: 11375916]
Deutsch GK, Dougherty RF, Bammer R, Siok WT, Gabrieli JDE, Wandell B. Children's reading performancfe in correlated with white matter structure measured by diffusion tensor imaging. Cortex. 2005; 41:354–363. [PubMed: 15871600]
Gearing M, Rebeck GW, Hyman BT, Tigges J, Mirra SS. Neuropathology and apolipoprotein E profile of aged chimpanzees: implications for Alzheimer disease. Proceedings of the National Academy of Sciences. 1994; 91:9382–9386.
Giedd JN, Blumenthal J, Jeffries NO, Castellanos FX, Liu H, Zijdenbos A, Paus T, Evans AC, Rapoport JL. Brain development during childhood and adolescence: a longitudinal MRI study. Nature Neuroscience. 1999; 2:861–863.
Giedd JN, Snell JW, Lange N, Rajapakse JC, Casey BJ, Kozuch PL, et al. Quantitative magnetic resonance imaging of human brain development: Ages 4 – 18. Cerebral Cortex. 1996; 6:551–560. [PubMed: 8670681]
Hasan KM, Ewing-Cobbs L, Kramer LA, Fletcher JM, Narayana PA. Diffusion tensor quantification of the macrostructure and microstructure of human midsagittal corpus callosum across the lifespan. NMR in Biomedicine. 2008; 21:1094–1101. [PubMed: 18615857]
Hopkins and Phillips Page 8
Dev Psychobiol. Author manuscript; available in PMC 2015 June 13.
Author M
anuscriptA
uthor Manuscript
Author M
anuscriptA
uthor Manuscript

Hasan KM, Kamali A, Kramer LA, Papnicolaou AC, Fletcher JM, Ewing-Cobbs L. Diffusion tensor quantification of the human midsagittal corpus callosum subdivisions across the lifespan. Brain Research. 2008; 1227:52–67. [PubMed: 18598682]
Hasan KM, Sankar A, Halphen C, Kramer LA, Brandt ME, Juranek J, Cirino PT, Fletcher JM, Papanicolaou AC, Ewing-Cobbs L. Development and organization of the human brain tissue compartments across the lifespan using diffusion tensor imaging. Neuroreport. 2007; 18:1735–1739. [PubMed: 17921878]
Hawakawa K, Konishi Y, Matsuda T, Kuriyama M, Konishi K, Yamashita K, et al. Development and aging of brain midline structures: Assessment with MR imaging. Radiology. 1989; 172:171–177. [PubMed: 2740500]
Hof, PR.; Gilissen, EP.; Sherwood, CC.; Duan, H.; Lee, PWH.; Delman, BD.; Naidich, TP.; Gannon, PJ.; Perl, DP.; Erwin, JM. Comparative neuropathology of brain aging in primates.. In: Erwin, JM.; Hof, PR., editors. Aging in Nonhuman Primates. Basel; Karger: 2002. p. 130-154.
Hofer S, Frahm J. Topography of the human corpus callosum revisited - comprehensive fiber tractography using diffusion tensor magnetic resonance imaging. NeuroImage. 2006; 32:989–994. [PubMed: 16854598]
Hopkins WD. Hand preferences for a coordinated bimanual task in 110 chimpanzees: Cross-sectional analysis. Journal of Comparative Psychology. 1995; 109:291–297. [PubMed: 7554825]
Hopkins WD, Taglialatela JP, Dunham L, Pierre P. Behavioral and neuroanatomical correlates of white matter asymmetries in chimpanzees (Pan troglodytes). European Journal of Neuroscience. 2007; 25:2565–2570. [PubMed: 17445252]
Keshavan MS, Diwadkar VA, DeBellis M, Dick E, Kotwal R, Rosenberg DR, Sweeney JA, Minshew N, Pettegrew JW. Development of the corpus callosum in childhood, adolescence and early adulthood. Life Sci. 2002; 70:1909–1922. [PubMed: 12005176]
Klingberg T, Hedehus M, Temple E, Salz T, Gabrieli JD, Moseley ME, Poldrack RA. Microstructure of temporo-parietal white matter as a basis for reading ability: Evidence from diffusion tensor magnetic resonance imaging. Neuron. 2000; 25:493–500. [PubMed: 10719902]
LaMantia AS, Rakic P. Axon overproduction and elimination in the corpus callosum of the developing rhesus monkey. Journal of Neuroscience. 1990; 10:2156–2175. [PubMed: 2376772]
Lenroot RK, Gogtay N, Greenstein DK, Wells EM, Wallace GL, Clasen LS, Blumenthal JD, Lerch J, Zijdenbos AP, Evans AC, Thompson PM, Giedd JN. Sexual dimorphism of brain developmental trajectories during childhood and adolescence. NeuroImage. 2007; 36:1065–1073. [PubMed: 17513132]
Liston C, Watts R, Tottenham N, Davidson MC, Niogi S, Ulus AM, et al. Frontostriatal microstructure modulates efficient recruitment of cognitive control. Cerebral Cortex. 2006; 16:553–560. [PubMed: 16033925]
Luders E, Narr KL, Bilder RM, Thompson PM, Szeszko PR, Hamilton L, Toga AW. Positive correlations between corpus callosum thickness and intelligence. Neuroimage. 2007; 37:1457–1464. [PubMed: 17689267]
Mabbott DJ, Noseworthy M, Bouffet E, Laughlin S, Rockel C. White matter growth as a mechanism of cognitive development in children. NeuroImage. 2006; 33:936–946. [PubMed: 16978884]
McLaughlin NC, Paul RH, Grieve SM, Williams LM, Laidlaw D, DiCarlo M, et al. Diffusion tensor imaging of the corpus callosum: A cross-sectional study across the lifespan. International Journal of Developmental Neuroscience. 2007; 25:215–221. [PubMed: 17524591]
Muetzel RL, Collins PF, Mueller BA, Schissel AM, Lim KO, Luciana M. The development of corpus callosum microstructure and associations with bimanual task performance in healthy adolescents. Neuroimage. 2008; 39:1918–1925. [PubMed: 18060810]
Nagy Z, Westerberg H, Klingberg T. Maturation of white matter is associated with the development of cognitive functions during childhood. Journal of Cognitive Neuroscience. 2004; 16:1227–1233. [PubMed: 15453975]
Niogi SN, McCandliss BD. Left lateralized white matter microstructure accounts for individual differences in reading ability and disability. Neuropsychologia. 2006; 44:2178–2188. [PubMed: 16524602]
Hopkins and Phillips Page 9
Dev Psychobiol. Author manuscript; available in PMC 2015 June 13.
Author M
anuscriptA
uthor Manuscript
Author M
anuscriptA
uthor Manuscript

Olesen PJ, Nagy Z, Westerberg H, Klingberg T. Combined analysis of DTI and fMRI data reveals a joint maturation of white and grey matter in a fronto-parietal network. Cognitive Brain Research. 2003; 18:48–57. [PubMed: 14659496]
Olson MV, Varki A. Sequencing the chimpanzee genome: Insights into human evolution and disease. Nature Reviews Genetics. 2003; 4:20–28.
Pandya DN, Karol EA, Heilbronn D. The topographical distribution of interhemispheric projections in the corpus callosum of the rhesus monkey. Brain Research. 1971; 32:31–43. [PubMed: 5000193]
Phillips KA, Sherwood CC. Cortical development in brown capuchin monkeys: A structural MRI study. Neuroimage. 2008; 43:657–664. [PubMed: 18805494]
Phillips KA, Sherwood CC, Lilak AL. Corpus callosum morphology in capuchin monkeys is influenced by sex and handedness. PLosONE. 2007; 2(8):1–7.
Pierre PJ, Hopkins WD, Taglialatela JP, Lees CJ, Bennett AJ. Age-related neuroanatomical differences from the juvenile period to adulthood in mother-reared macaques (Macaca radiata). Brain Research. 2008; 1226:56–60. [PubMed: 18619575]
Pujol J, Vendrell P, Junque C, Marti-Vilalta JL, Capdevila A. When does human brain development end? Evidence of corpus callosum growth up to adulthood. Ann. Neurolology. 1993; 34:71–75.
Rajapakse JC, Giedd JN, Rumsey JM, Vaituzis AC, Hamburger SD, Rapoport JL. Regional MRI measurements of the corpus callosum: A methodological and developmental study. Brain Development. 1996; 18:379–388. [PubMed: 8891233]
Rakic P, Yakovlev PI. Development of the corpus callosum and cavum septi in man. Journal of Comparative Neurology. 1968; 132:45–72. [PubMed: 5293999]
Rauch RA, Jinkins JR. Analysis of cross-sectional area measurements of the corpus callosum adjusted for brain size in male and female subjects from childhood to adulthood. Behavioral Brain Research. 1994; 64:65–78.
Ringo JL, Doty RW, Demeter S, Simard PY. Time is of the essence: A conjecture that hemispheric specialization arise from interhemispheric conduction delay. Cerebral Cortex. 1994; 4:331–343. [PubMed: 7950307]
Rosen RF, Farberg AS, Gearing M, Dooyema J, Long PM, Anderson DC, et al. Tauopathy with paired helical filaments in an aged chimpanzee. The Journal of Comparative Neurology. 2008; 509:259–270. [PubMed: 18481275]
Sakai, T.; Mikami, A.; Nishimura, T.; Toyoda, H.; Miwa, T.; Matsui, M., et al. Development of the prefrontal area in chimpanzees.. XXII Congress of the International Primatological Society; Edinburgh, Scotland. 3 – 8 August; 2008.
Smith SM, Jenkinson M, Woolrich MW, Beckmann CF, Behrens TEJ, Johansen-Berg H, et al. Advances in functional and structural MR image analysis and implementation of FSL. NeuroImage. 2004; 23(S1):208–219.
Smith RJ. Relative size versus controlling for size. Current Anthropology. 2005; 46:249–273.
Snook L, Paulson LA, Roy D, Phillips L, Beaulieu C. Diffusion tensor imaging of neurodevelopment in children and young adults. Neuroimage. 2005; 26:1164–1173. [PubMed: 15961051]
Sowell ER, Peterson BS, Thompson PM, Welcome SE, Henkenius AL, Toga AW. Mapping cortical change across the human life span. Nature Neuroscience. 2003; 6:309–315.
Vinicius L. Human encephalization and developmental timing. Journal of Human Evolution. 2005; 49:762–776. [PubMed: 16226789]
Wahl M, Lauterbach-Soon B, Hattingen E, Jung P, Singer O, Volz S, Klein JC, Steinmetz H, Ziemann U. Human motor corpus callosum: Topography, somatography, and link between microstructure and function. Journal of Neuroscience. 2007; 27:12132–12138. [PubMed: 17989279]
Witelson SF. Hand and sex differences in the isthmus and genu of the human corpus callosum. Brain. 1989; 112:799–835. [PubMed: 2731030]
Witelson SF, Goldsmith. The relationship of hand preference to anatomy of the corpus callosum in man. Brain Research. 1991; 545:175–182. [PubMed: 1860044]
Zhang Y, Brady M, Smith SM. Segmentation of the brain MR images through hidden Markov random filed model and expectation-maximization algorithm. IEEE Transactions on Medical Imaging. 2001; 20(1):45–57. [PubMed: 11293691]
Hopkins and Phillips Page 10
Dev Psychobiol. Author manuscript; available in PMC 2015 June 13.
Author M
anuscriptA
uthor Manuscript
Author M
anuscriptA
uthor Manuscript

Figure 1. Anatomical subdivision of the chimpanzee corpus callosum from MRI sagittal view. The
total midsagittal area was divided into seven equally spaced subdivisions: 1 = rostrum, 2 =
genu, 3 = rostral body, 4 = anterior midbody, 5 = posterior midbody, 6 = isthmus, and 7 =
splenium.
Hopkins and Phillips Page 11
Dev Psychobiol. Author manuscript; available in PMC 2015 June 13.
Author M
anuscriptA
uthor Manuscript
Author M
anuscriptA
uthor Manuscript

Figure 2. a. Growth trajectory of the total midsagittal CC area (adjusted for brain size) in a sample of
104 chimpanzees from 6 – 54 years.
Figure 2b. Growth trajectory of the total midsagittal CC area (raw area measures) in a
sample of 104 chimpanzees from 6 – 54 years.
Hopkins and Phillips Page 12
Dev Psychobiol. Author manuscript; available in PMC 2015 June 13.
Author M
anuscriptA
uthor Manuscript
Author M
anuscriptA
uthor Manuscript

Hopkins and Phillips Page 13
Dev Psychobiol. Author manuscript; available in PMC 2015 June 13.
Author M
anuscriptA
uthor Manuscript
Author M
anuscriptA
uthor Manuscript

Hopkins and Phillips Page 14
Dev Psychobiol. Author manuscript; available in PMC 2015 June 13.
Author M
anuscriptA
uthor Manuscript
Author M
anuscriptA
uthor Manuscript
Hopkins and Phillips Page 15
Dev Psychobiol. Author manuscript; available in PMC 2015 June 13.
Author M
anuscriptA
uthor Manuscript
Author M
anuscriptA
uthor Manuscript

Hopkins and Phillips Page 16
Dev Psychobiol. Author manuscript; available in PMC 2015 June 13.
Author M
anuscriptA
uthor Manuscript
Author M
anuscriptA
uthor Manuscript

Hopkins and Phillips Page 17
Dev Psychobiol. Author manuscript; available in PMC 2015 June 13.
Author M
anuscriptA
uthor Manuscript
Author M
anuscriptA
uthor Manuscript

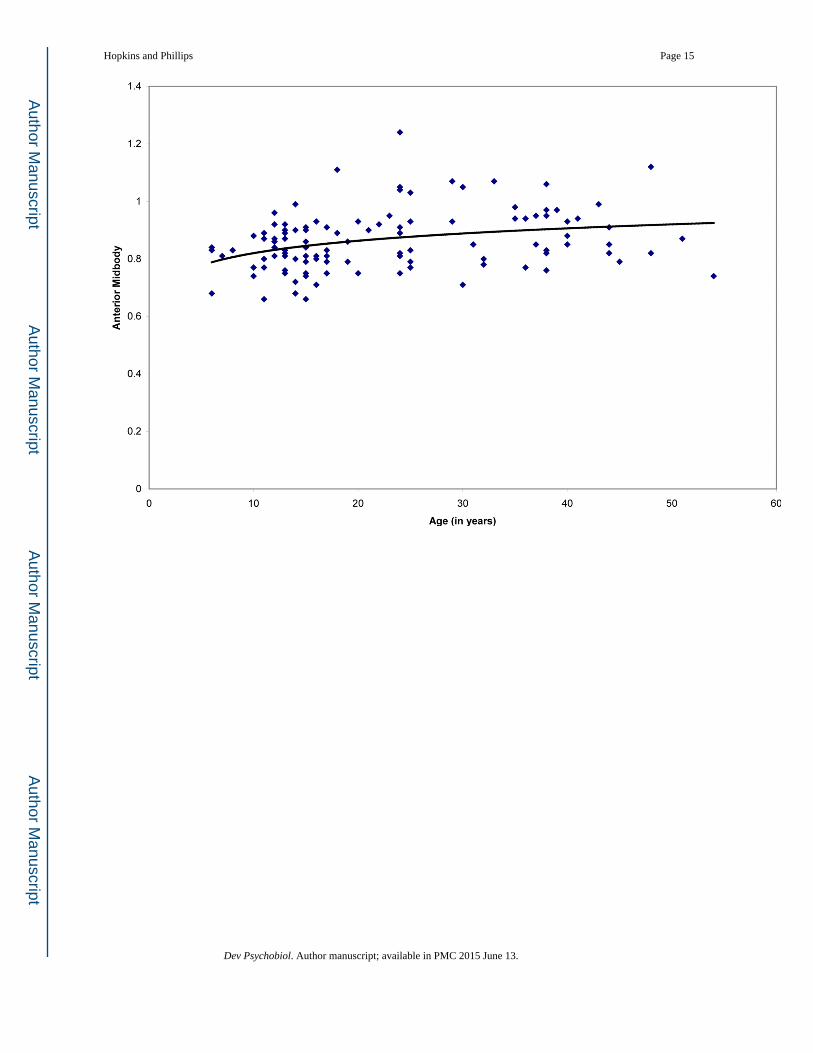
Figure 3. Growth trajectories of CC subdivisions adjusted for total brain size in a sample of
chimpanzees from 6 – 54 years: (a) genu, (b) rostral body, (c) anterior midbody, (d)
posterior midbody, (e) isthmus, and (f) splenium. Quadratic equations best explained growth
in the rostral body and anterior midbody; linear equations best explained growth in the genu,
posterior midbody, isthmus and splenium.
Hopkins and Phillips Page 18
Dev Psychobiol. Author manuscript; available in PMC 2015 June 13.
Author M
anuscriptA
uthor Manuscript
Author M
anuscriptA
uthor Manuscript

Figure 4. Growth trajectories of CC subdivisions in a sample of chimpanzees aged 6 – 54 years: (a)
rostral body, (b) anterior midbody, and (c) isthmus. Growth in the isthmus was best
explained by linear equations; growth in the rostral body and anterior midbody was best
explained by quadratic equations.
Hopkins and Phillips Page 19
Dev Psychobiol. Author manuscript; available in PMC 2015 June 13.
Author M
anuscriptA
uthor Manuscript
Author M
anuscriptA
uthor Manuscript

Author M
anuscriptA
uthor Manuscript
Author M
anuscriptA
uthor Manuscript
Hopkins and Phillips Page 20
Tab
le 1
R-v
alue
s an
d A
ssoc
iate
d F
-val
ues
for
the
Pred
icto
r V
aria
bles
of
Sex,
Han
dedn
ess
(HI)
, and
Age
for
the
Step
wis
e R
egre
ssio
n B
est F
it M
odel
s fo
r T
otal
CC
and
eac
h C
C S
ubdi
visi
on, A
djus
ted
for
Bra
in V
olum
e
RSe
xF
HI
FA
ge (
L)
FA
ge(Q
)F
TO
TA
L.4
98.0
940.
90.1
120.
38.4
7226
.78
.498
3.22
Ros
trum
.205
.137
1.93
.176
1.26
.201
0.97
.205
0.19
Gen
u.2
71.0
680.
46.1
82.
89.2
684.
22.2
710.
13
Ros
tral
bod
y.4
01.0
040.
01.0
840.
71.3
039.
21.4
018.
12
Ant
erio
r m
idbo
dy.4
47.1
041.
10.1
060.
04.3
2310
.29
.447
11.7
0
Post
erio
r m
idbo
dy.4
01.1
321.
79.1
761.
41.3
9214
.32
.401
0.87
Isth
mus
.401
.024
0.06
.053
0.23
.398
18.3
3.4
010.
22
Sple
nium
.339
.153
2.41
.157
0.14
.338
9.97
.339
0.09
Bol
ded
valu
es in
dica
te s
igni
fica
nt F
-val
ues
at p
< .0
5. I
tali
cize
d va
lues
indi
cate
p <
.10.
R in
dica
tes
the
mul
tiple
R v
alue
fro
m th
e re
gres
sion
ana
lysi
s.
Dev Psychobiol. Author manuscript; available in PMC 2015 June 13.

Author M
anuscriptA
uthor Manuscript
Author M
anuscriptA
uthor Manuscript
Hopkins and Phillips Page 21
Tab
le 2
R-v
alue
s an
d A
ssoc
iate
d F-
valu
es f
or th
e Pr
edic
tor
Var
iabl
es o
f Se
x, H
ande
dnes
s (H
I), a
nd A
ge f
or th
e St
epw
ise
Reg
ress
ion
Bes
t Fit
Mod
els
for
Tot
al
CC
and
eac
h C
C S
ubdi
visi
on
RSe
xF
HI
FA
ge (
L)
FA
ge(Q
)F
TO
TA
L.2
90.1
031.
09.1
591.
49.2
835.
91.2
900.
43
Ros
trum
.201
.097
0.97
.141
1.06
.192
1.74
.207
0.62
Gen
u.2
05.0
720.
53.1
933.
32.2
040.
47.2
050.
38
Ros
tral
bod
y.2
55.0
140.
19.0
540.
28.1
501.
98.2
554.
46
Ant
erio
r m
idbo
dy.3
50.1
181.
41.1
330.
38.2
253.
44.3
508.
05
Post
erio
r m
idbo
dy.2
46.1
512.
36.1
640.
41.2
463.
54.2
460.
04
Isth
mus
.306
.020
0.04
.021
0.05
.306
10.1
7.3
060.
01
Sple
nium
.206
.144
2.12
.162
0.57
.202
1.50
.206
0.18
Bol
ded
valu
es in
dica
te s
igni
fica
nt F
-val
ues
at p
< .0
5. I
tali
cize
d va
lues
indi
cate
p <
.10.
Age
(L)
= li
near
, Age
(Q)=
qua
drat
ic. R
indi
cate
s th
e m
ultip
le R
val
ue f
rom
the
regr
essi
on a
naly
sis.
Dev Psychobiol. Author manuscript; available in PMC 2015 June 13.