
Cross-Reactive Chemical Sensor...
32
Cross-Reactive Chemical Sensor Arrays Keith J. Albert, ² Nathan S. Lewis,* ,‡ Caroline L. Schauer, ² Gregory A. Sotzing, ‡ Shannon E. Stitzel, ² Thomas P. Vaid, ‡ and David R. Walt* ,² The Max Tishler Laboratory for Organic Chemistry, Department of Chemistry, Tufts University, Medford, Massachusetts 02155, and Division of Chemistry and Chemical Engineering, California Institute of Technology, Pasadena, California 91125 Received August 17, 1999 Contents I. Introduction 2595 II. Tin Oxide Arrays 2598 A. Theory 2598 B. Tin Oxide Characteristics 2599 C. Array Design 2600 D. Applications 2600 E. Analysis 2601 III. MOSFET Arrays 2602 A. Principles of Operation 2602 B. Fabrication and Operation 2602 C. Applications 2603 D. Alternative Implementations of MOSFETs 2604 E. Hybrid Metal Oxide Containing Arrays 2605 IV. Intrinsically Conductive Polymer Chemiresistor Arrays 2605 A. Principles of Operation 2605 B. Array Fabrication 2606 C. Applications 2607 D. Future Directions 2608 V. Conductive Polymer Composite Chemiresistor Arrays 2609 A. Theory 2609 B. Fabrication 2609 C. Applications 2611 VI. Optical Vapor Sensing Arrays 2611 A. Introduction 2611 B. Polymer-Deposited Optical Sensor Arrays 2611 1. Array Fabrication 2611 2. Sensor Diversity 2612 C. Self-Encoded Bead Sensors 2613 D. Sensor Sensitivity 2613 E. Data Processing for Optical Sensor Arrays 2614 VII. Electrochemical Sensor Arrays 2614 A. Introduction 2614 B. Potentiometric (Equilibrium) Measurements 2615 1. Principles of Operation 2615 2. Examples of Potentiometric Arrays 2616 C. Voltammetric (Nonequilibrium) Measurements 2618 1. Principles of Operation 2618 2. Examples of Voltammetric Arrays 2618 VIII. Acoustic Wave Devices 2620 A. Introduction 2620 B. TSM Arrays 2620 C. SAW Arrays 2621 D. Response Prediction 2622 IX. Conclusions and Future Prospects 2622 X. Acknowledgments 2623 XI. References 2623 I. Introduction Conventional approaches to chemical sensors have traditionally made use of a “lock-and-key” design, wherein a specific receptor is synthesized in order to strongly and highly selectively bind the analyte of interest. 1-6 A related approach involves exploiting a general physicochemical effect selectively toward a single analyte, such as the use of the ionic effect in the construction of a pH electrode. In the first approach, selectivity is achieved through recognition of the analyte at the receptor site, and in the second, selectivity is achieved through the transduction process in which the method of detection dictates which species are sensed. Such approaches are ap- propriate when a specific target compound is to be identified in the presence of controlled backgrounds and interferences. However, this type of approach requires the synthesis of a separate, highly selective sensor for each analyte to be detected. In addition, this type of approach is not particularly useful for analyzing, classifying, or assigning human value judgments to the composition of complex vapor mixtures such as perfumes, beers, foods, mixtures of solvents, etc. An emerging strategy that is complementary to the conventional chemical sensing approach involves the use of sensor arrays. The utilization of sensor arrays is inspired by the superb performance of biological olfactory systems in odor detection, identification, tracking, and location tasks. Recent work has shown that the mammalian olfactory system contains ap- proximately 1000 different olfactory receptor genes and that, upon odor stimulation, responses from many receptors are sent to the olfactory bulb and then on to the olfactory cortex for processing. 7-10 Furthermore, recent experiments have shown that the olfactory receptors are not highly selective toward specific analytes; in fact, one receptor responds to many analytes and many receptors respond to any given analyte. 8,10-12 Pattern recognition methods are thus thought to be a dominant mode of olfactory ² Tufts University. ‡ California Institute of Technology. 2595 Chem. Rev. 2000, 100, 2595-2626 10.1021/cr980102w CCC: $35.00 © 2000 American Chemical Society Published on Web 06/24/2000
Transcript of Cross-Reactive Chemical Sensor...

Cross-Reactive Chemical Sensor Arrays
Keith J. Albert,† Nathan S. Lewis,*,‡ Caroline L. Schauer,† Gregory A. Sotzing,‡ Shannon E. Stitzel,†Thomas P. Vaid,‡ and David R. Walt*,†
The Max Tishler Laboratory for Organic Chemistry, Department of Chemistry, Tufts University, Medford, Massachusetts 02155, andDivision of Chemistry and Chemical Engineering, California Institute of Technology, Pasadena, California 91125
Received August 17, 1999
ContentsI. Introduction 2595II. Tin Oxide Arrays 2598
A. Theory 2598B. Tin Oxide Characteristics 2599C. Array Design 2600D. Applications 2600E. Analysis 2601
III. MOSFET Arrays 2602A. Principles of Operation 2602B. Fabrication and Operation 2602C. Applications 2603D. Alternative Implementations of MOSFETs 2604E. Hybrid Metal Oxide Containing Arrays 2605
IV. Intrinsically Conductive Polymer ChemiresistorArrays
2605
A. Principles of Operation 2605B. Array Fabrication 2606C. Applications 2607D. Future Directions 2608
V. Conductive Polymer Composite ChemiresistorArrays
2609
A. Theory 2609B. Fabrication 2609C. Applications 2611
VI. Optical Vapor Sensing Arrays 2611A. Introduction 2611B. Polymer-Deposited Optical Sensor Arrays 2611
1. Array Fabrication 26112. Sensor Diversity 2612
C. Self-Encoded Bead Sensors 2613D. Sensor Sensitivity 2613E. Data Processing for Optical Sensor Arrays 2614
VII. Electrochemical Sensor Arrays 2614A. Introduction 2614B. Potentiometric (Equilibrium) Measurements 2615
1. Principles of Operation 26152. Examples of Potentiometric Arrays 2616
C. Voltammetric (Nonequilibrium) Measurements 26181. Principles of Operation 26182. Examples of Voltammetric Arrays 2618
VIII. Acoustic Wave Devices 2620A. Introduction 2620B. TSM Arrays 2620C. SAW Arrays 2621D. Response Prediction 2622
IX. Conclusions and Future Prospects 2622X. Acknowledgments 2623XI. References 2623
I. Introduction
Conventional approaches to chemical sensors havetraditionally made use of a “lock-and-key” design,wherein a specific receptor is synthesized in order tostrongly and highly selectively bind the analyte ofinterest.1-6 A related approach involves exploiting ageneral physicochemical effect selectively toward asingle analyte, such as the use of the ionic effect inthe construction of a pH electrode. In the firstapproach, selectivity is achieved through recognitionof the analyte at the receptor site, and in the second,selectivity is achieved through the transductionprocess in which the method of detection dictateswhich species are sensed. Such approaches are ap-propriate when a specific target compound is to beidentified in the presence of controlled backgroundsand interferences. However, this type of approachrequires the synthesis of a separate, highly selectivesensor for each analyte to be detected. In addition,this type of approach is not particularly useful foranalyzing, classifying, or assigning human valuejudgments to the composition of complex vapormixtures such as perfumes, beers, foods, mixtures ofsolvents, etc.
An emerging strategy that is complementary to theconventional chemical sensing approach involves theuse of sensor arrays. The utilization of sensor arraysis inspired by the superb performance of biologicalolfactory systems in odor detection, identification,tracking, and location tasks. Recent work has shownthat the mammalian olfactory system contains ap-proximately 1000 different olfactory receptor genesand that, upon odor stimulation, responses frommany receptors are sent to the olfactory bulb andthen on to the olfactory cortex for processing.7-10
Furthermore, recent experiments have shown thatthe olfactory receptors are not highly selective towardspecific analytes; in fact, one receptor responds tomany analytes and many receptors respond to anygiven analyte.8,10-12 Pattern recognition methods arethus thought to be a dominant mode of olfactory
† Tufts University.‡ California Institute of Technology.
2595Chem. Rev. 2000, 100, 2595−2626
10.1021/cr980102w CCC: $35.00 © 2000 American Chemical SocietyPublished on Web 06/24/2000
signal processing in the broadly responsive portionof the olfactory system of higher mammals.
In the array approach, the strict “lock-and-key”design criterion of traditional sensing devices isabandoned. Instead, in this alternative sensor archi-tecture, an array of different sensors is used, withevery element in the sensor array chosen to respondto a number of different chemicals or classes ofchemicals. The elements of such an array need notbe individually highly selective toward any givenanalyte, so this stressing constraint on sensor designis relaxed. Instead, the collection of sensors shouldcontain as much chemical diversity as possible, sothat the array responds to the largest possible cross-section of analytes. In practice, most chemical sensors
suffer from some interference by responding tochemical species that are structurally or chemicallysimilar to the desired analyte. This interference isan inevitable consequence of the “lock” being able tofit a number of imperfect “keys”. Differentially re-sponsive arrays take advantage of this interferenceor “cross reactivity” by deliberately attempting to usethe nonspecific response patterns for analyte recogni-tion. In this design, identification of an analytecannot be accomplished from the response of a singlesensor element; a distinct pattern of responses pro-
Keith Albert was born in Lewiston, ME in 1974. He attended Colby Collegewhere he did a one year exchange program at UCC in Cork, Ireland. Hereceived his bachelor’s degree in 1996 and is presently a graduate studentat Tufts University with Prof. David Walt. His research interests includeoptical sensors, explosives-like vapor detection with microsensor arrayplatforms, and instrumental designs for field use.
Dr. Nathan Lewis has been on the faculty at the California Institute ofTechnology since 1988 and has served as Professor since 1991. He hasalso served as the Principal Investigator of the Beckman Institute MolecularMaterials Resource Center at Caltech since 1992. From 1981 to 1986,he was on the faculty at Stanford, as an Assistant Professor from 1981to 1985 and a tenured Associate Professor from 1986 to 1988. Dr. Lewisreceived his Ph.D in Chemistry from the Massachusetts Institute ofTechnology. Dr. Lewis has been an Alfred P. Sloan Fellow, a Camilleand Henry Dreyfus Teacher−Scholar, and a Presidential Young Investiga-tor. He received the Frensenius Award in 1990 and the ACS Award inPure Chemistry in 1991. He has published over 170 papers and hassupervised approximately 50 graduate students and postdoctoral associ-ates. His research interests include semiconductor electrochemistry andphotochemistry, scanning tunneling microscopy of organic monolayers,and artificial olfactory systems using arrays of chemical sensors.
Caroline Schauer was born in Washington, DC, and graduated in 1991from Beloit College in Beloit, WI with a B.S. degree in Chemistry. Shecompleted her M.S. and Ph.D. from State University of New York at StonyBrook under the direction of Professors Frank W. Fowler and Joseph W.Lauher working on organic synthesis and small-molecule crystallography.She spent 9 months in the laboratory of David N. Reinhoudt as apostdoctoral fellow at the University of Twente, The Netherlands, workingon hydrogen-bonded polymers. Currently she is a postdoctoral fellow inthe laboratory of David R. Walt at Tufts University working on enzymaticbiosensors. Her research interests include structural chemistry and biology,biosensors for proteins, development of an optical array for the diagnosesof disease states, and crystallography.
Gregory Sotzing was born in Fredericksburg, VA and graduated in 1993from Mary Washington College with a B.S. degree in Chemistry withhighest honors. He received the ACS Polyed Undergraduate PolymerChemistry Award for his work on the synthesis of fluorinated polyimides.After completing his Ph.D. degree in 1997 under the advisement of JohnReynolds in the George and Josephine Bulter Polymer ResearchLaboratory at the University of Florida, he accepted a postdoctoral positionat the California Institute of Technology working jointly with Nathan Lewisand Robert Grubbs. Presently, Greg is an Assistant Professor of Chemistryin the Institute of Materials Science, Polymer Program, at the Universityof Connecticut, Storrs, CT. His research interests are primarily directedtoward the application fields of sensors and actuators with an emphasison materials design and polymer synthesis (www.mail.ims.uconn.edu/∼sotzing).
2596 Chemical Reviews, 2000, Vol. 100, No. 7 Albert et al.
duced over the collection of sensors in the array canprovide a fingerprint that allows classification andidentification of the analyte (Figure 1). The patterncan be obtained from equilibrium or kinetic responseswith the latter often providing additional discrimi-nating power. The response mechanism for suchsystems is highly varied, as described in the sectionsbelow. Both binding and colligative properties can beinterrogated with such arrays. For example, broadlyresponsive receptors can be employed to allow arange of structurally similar molecules to bind,membranes may be used that are size selective, andpolymers may be employed that select on the basisof polarity. All these recognition mechanisms, as wellas others described in this review, are often employedsimultaneously in these arrays. These types of sys-tems, which are the topic of this review, are thuscommonly designated as artificial or electronic noses.
The advantage of this approach is that it can yieldresponses to a variety of different analytes, includingthose for which the array was not necessarily origi-nally designed to detect. An array of sensors natu-
rally performs an integration to yield a unique signalfor complex but distinctive odors (e.g., cheeses, beers,etc.) without requiring that the mixture be brokendown into its individual components prior to, orduring, the analysis. This is a disadvantage when theprecise chemical composition of a complex mixtureis required but is advantageous when the onlyrequired information is the composite composition ofthe odor of concern. Some additional information canalso be obtained by identifying unique spatial and/or temporal characteristics of certain analytes, sothat the composition of even modestly complex mix-tures can sometimes be obtained from sensor arraysignals using such methods. Another potential dis-advantage to an array system is the possibility thatother unknowns may give the same “unique” signalas a specific analyte of interest. However, thesearrays are no different from other sensor types, inthat there is always the potential for species otherthan the analyte of interest to provide a response thatmay be misconstrued as the target analyte. As willbe described later in this review, cross-reactive arrayscan be trained to evaluate more complex aspects ofa sample, such as “freshness”, and the fidelity of suchan analysis may pose additional stringencies on thequality of the information produced by the array inorder for it to not be “fooled”. The sensors themselvesare typically low power and simple in concept andoperate at ambient or near ambient temperature andpressure. Their simplicity eliminates the need tosolve the power and complexity challenges involvedin miniaturizing traditional laboratory analyticalchemical systems that involve high power and highvacuum (mass spectrometers, for example), highpressures and/or gas flows (e.g., gas chromatogra-phy), or other operational constraints that presentsevere mismatches between the optimal instrumentaloperating conditions and those likely to be encoun-tered in an out-of-lab setting.
Shannon Stitzel was born in Mons, Belgium, in 1975. She received herB.S. in Chemistry from Davidson College in 1997. Presently she is agraduate student in Chemistry at Tufts University with Prof. David Walt.Her research interests include designing fiber-optic chemical sensors forvapor and liquid-phase analytes and alternative fuel sources.
Thomas Vaid was born in 1971 in Elk Grove, IL. He received his B.S. inChemistry from the University of Illinois at Urbana-Champaign in 1992.His graduate work was with Prof. Peter T. Wolczanski at Cornell University,where he received his Ph.D. in 1997. Since then he has been apostdoctoral scholar at the California Institute of Technology with Prof.Nathan Lewis. In the fall of 2000, he will join the faculty of WashingtonUniversity in St. Louis as an Assistant Professor in Chemistry. His researchinterests include the synthesis and study of new inorganic and organicmaterials with unusual magnetic ordering or electrical transport properties.
Dr. David R. Walt is Robinson Professor of Chemistry at Tufts University.He received a B.S. in Chemistry from the University of Michigan and aPh.D. in Organic Chemistry and Pharmacology from SUNY at Stony Brook.After postdoctoral studies at MIT, he joined the chemistry faculty at Tufts.Dr. Walt served as Chemistry Department Chairman from 1989 to 1996.Dr. Walt serves on many government advisory panels and editorial advisoryboards. He has received numerous national and international awards andhonors recognizing his work. Dr. Walt has published over 120 papers,holds over 30 patents, and has given hundreds of invited scientificpresentations. His research interests include micro and nano sensors,genomics and organized assembly of nano materials.
Cross-Reactive Chemical Sensor Arrays Chemical Reviews, 2000, Vol. 100, No. 7 2597
Signal processing methods and algorithms areintimately associated with the performance of broadlycross-reactive sensor arrays as a vapor detectionsystem. Signal processing algorithms can comprisestatistically based chemometric methods, patternrecognition algorithms, neural networks, or somecombination thereof. One of the design tradeoffs indeploying any specific sensor array system for a givenvapor detection task will thus clearly involve assess-ment of the computational needs to achieve a robustclassification of the desired target analyte in thepresence of background, environmental variability,and interfering signals.
There is some controversy in the literature regard-ing whether it is advantageous to use large numbersof sensors in an array device. This arises becauseapproximately five fundamental molecular descrip-tors have been sufficient to describe much of thevariance in the gas-solid partition coefficients forsorption of vapors into various polymers. Althoughit is possible to describe the gross features of suchpartitioning with a small number of descriptors, wenote that there are over 1000 olfactory genes inhumans and over 100 million olfactory cells in acanine’s nose. Even if the dimensionality of odorspace is fairly small, say on the order of 101, it is notlikely that ideal sensors that produce optimal resolu-tion along the fundamental directions of odor spacecould be identified. In practice, correlations betweenthe elements of a sensor array will likely necessitatea much larger number of sensors to distinguishsuccessfully between any two molecules in a complexenvironment. Also, it is beneficial to measure thesame property in many different ways due to noiselimitations in a practical system. For example, ifsufficient precision could be obtained, it might bepossible to identify uniquely any molecule merelyfrom a 38 bit precision measurement of two param-eters, perhaps its dipole moment and its polarizabil-ity. But of course, it is not practical to make suchmeasurements with this precision; hence at lowerprecision, useful information on the nature of theanalyte is gained by making measurements of themolecular parameters through many independentdeterminations on different sensor elements. Thedimensionality of odor space will depend on thesensor array and the recognition mechanism em-ployed. The dimensionality of odor space is thusinherently coupled to the precision of the sensor arraythat is being used to make the determination as wellas to the diversity in the analytes that is being used
to define the space as a whole. Furthermore, theabove arguments on needing a limited number ofsensors only hold if one is tasked to distinguishbetween a series of pure substances that are main-tained at one fixed, known concentration. In contrast,if the background is unknown, if mixtures arepresent, or if the background gases are changing inconcentration, many more sensors are needed simplyto avoid ambiguity in interpreting the output signalpattern, and even more are needed if optimal dis-crimination is to be accomplished between a giventarget signature and a wide possible range of back-ground clutter and false alarm signatures. Havinglarge numbers of sensors also allows redundancy,which improves the signal-to-noise ratio and providesthe ability to veto the output of poorly performingsensors. Redundancy is clearly important in biologicalsystems where each odorant receptor type is ex-pressed clonally on thousands of individual cells.Because of all of these issues, the number of sensorsrequired to successfully span odor space in a practicaldevice will rapidly multiply from the minimum valuedefined by the rank of smell space, and this is arequirement that is readily met using versatilesensor array architectures that can incorporate highlevels of chemical diversity and redundancy into thesystem.
Sensor types for electronic noses can be quitediverse. Sensor array elements that will be discussedin this review include metal oxide devices, intrinsi-cally conducting organic polymers, conducting poly-mer composites, dye-impregnated polymers coatedonto optical fibers, electrochemical devices, and poly-mer-coated surface or bulk acoustic wave oscillators.While the focus of this review is primarily on thechemistry of these arrays, there are a number ofapplication areas for the technology that will be ofinterest to the reader. These cross-reactive arrayshave a wide variety of application areas includingfood and beverages, fragrances, environmental moni-toring, chemical and biochemical processing, medicaldiagnostics, transportation, and a host of others.Some aspects of these areas as well as specificexamples from each will be illustrated in the ap-propriate sections of the text that follows.
II. Tin Oxide Arrays
A. TheoryTin oxide (SnO2) gas sensors were first demon-
strated in the early 1960s. Since that time, SnO2
Figure 1. Response of a collection of incrementally different but nonspecific sensors, used to generate a complex pattern,or fingerprint, characteristic of a given analyte. Pattern recognition processing, including neural networks, can then beused to identify analytes on the basis of these patterns.
2598 Chemical Reviews, 2000, Vol. 100, No. 7 Albert et al.
sensors have become commercially available fordetecting fuel gas, carbon monoxide, general purposecombustible gases, ammonia, water vapor, etc.13,14 Asearly as 1954, the concept of a cross-reactive arrayof sensors for odor detection was discussed in theliterature.15 However, it was not until 1982 that across-reactive array of SnO2 sensors was demon-strated by Persaud and Dodd to mimic olfaction.16
This publication started the “modern era” of cross-reactive arrays and electronic noses that combinebroad sensitivity with convergent signal processingto perform a wide range of analyte identification.Although many different arrays have been fabricated,the sensing mechanism is similar for all SnO2 ele-ments.
The general mechanism for vapor sensing with tinoxide is a change in the resistance (or conductance)of the sensor when it is exposed to an analyte relativeto the sensor resistance in background air. Thischange in resistance is due to irreversible reactionsbetween the analyte and oxygen-derived adsorbatessuch as O-, O2
-, and O2- on the semiconductorsurface. The most reactive of these species is O-,which tends to dominate the resistance of the semi-conductor through chemical control of vacancy sitesin the SnO2. Oxygen adsorbs to the semiconductorsurface according to the following equation:
With n-type semiconductors, adsorption of O- createsa space-charge layer on the surface of each SnO2grain, which creates a potential barrier to conductionat each grain boundary. The depth of the spacecharge layer changes in relation to the concentrationof oxygen adsorbates on the surface. Therefore, whenthe surface is exposed to air, the oxygen concentra-tion is high and the material displays a high electricalresistivity. In contrast, when the sensor is exposedto a reducing gas X, the gas reacts with someadsorbed oxygen species Om
- as follows:
This leads to oxygen consumption, the return ofelectrons to the oxide grains, and a decrease in thesemiconductor resistance (Figure 2). When the sensoris exposed to an oxidizing gas such as NO2, the
resistance increases as the gas chemisorbs as anegatively charged species to the semiconductorsurface. The change in resistance is therefore due tothe chemisorption of the oxidizing gas, assuming thatthe concentration of oxygen adsorbates remainsconstant.13,14,17 Another hypothesis for the mecha-nism of conductivity change in SnO2 is that reducinggases react with the material and thereby reduce thenumber of oxygen vacancies in the material, loweringits conductance, while oxidizing environments regen-erate the oxygen-derived vacancies and thus restorethe electrical conductivity of the film.
B. Tin Oxide CharacteristicsVarious properties of tin oxide arrays have been
manipulated in attempts to enhance and/or broadenthe sensitivities of such devices. The sensitivities ofSnO2 sensors to various gases can be enhanced bydoping with metals. Metals promote the catalyticactivity of the semiconductor surface with gases,leading to chemical sensitization. The addition of ametal to SnO2 also causes electronic sensitization dueto the effects on the space charge layer. Metals thathave work functions greater than the electron affinityof the semiconductor take electrons from the semi-conductor, leading to even greater resistances in air.Because oxygen adsorbs to both the metal andsemiconductor surfaces, when it desorbs from bothsurfaces due to gas interactions, an enhanced sensi-tivity is produced in the resistance change of thesemiconductor.14 Typical doping metals include Ptand Pd, but others have also been used, such as Al18
and Au19 (although neither Al nor Au has providedmuch improvement in sensitivity). Doping with Ptand Pd has been shown to increase the sensitivity oftin oxide sensors to gases such as benzene andtoluene, with lower doping concentrations leading togreater sensitivity. Doped sensors have demonstratedgreater sensitivity to oxygenated volatile organicsthan to aliphatic, aromatic, or chlorinated com-pounds.18
Temperature is another factor that affects thesensitivity of tin oxide sensor arrays. Typically, thesearrays are operated at temperatures greater than 300°C to increase the reactivity of the semiconductorsurfaces. Tin oxide sensors are also operated atelevated temperatures to desorb water produced fromthe reactions on the catalyst surface. One studylooked at the effect of various temperatures between300 and 450 °C on an array of three elements.20 Itwas determined that if a sensor’s response changedlinearly with change in temperature, it did not affectthe array’s overall performance. An approach toutilize the change in sensitivity with temperature isto use a thermal cycling technique to extract moreinformation from each sensor. This approach wasfirst demonstrated by Heilig et al.21 and then usedby Corcoran et al., who cycled an eight sensor arraybetween 250 and 500 °C. These workers used thedata in conjunction with feature extraction tech-niques to classify teas. The thermally cycled arrayhad a 90% classification rate, whereas the same arrayat a fixed temperature only had a 69% classificationrate.22
Figure 2. Potential barrier at the grain boundary (a) inair and (b) in a reducing gas.
1/2O2 + e- f O- (ad.) (1)
X + Om- f XOm + e- (2)
Cross-Reactive Chemical Sensor Arrays Chemical Reviews, 2000, Vol. 100, No. 7 2599
Another study investigated the response and re-covery times of tin oxide sensors.19 Some generalconclusions could be drawn, for example, that asanalyte concentration increased, response time de-creased while sensor recovery times increased. Forconcentrations between 0 and 400 ppm, the responsetimes varied from 5 to 35 s, while recovery timesranged from 15 to 70 s, depending on the analyte. Acomparison between tin oxide, conducting organicpolymers and carbon-black polymers found that tinoxide sensors responded more quickly (∼7 s) than theother sensor types (20-200 s). Tin oxide sensors werealso found to have larger responses in general butwere not found to be as good at resolving volatileorganic compounds as carbon black-polymer com-posites.23
C. Array DesignThe first array developed with tin oxide sensors
used commercially available sensor elements (Figure3).16 A typical commercially available element has a
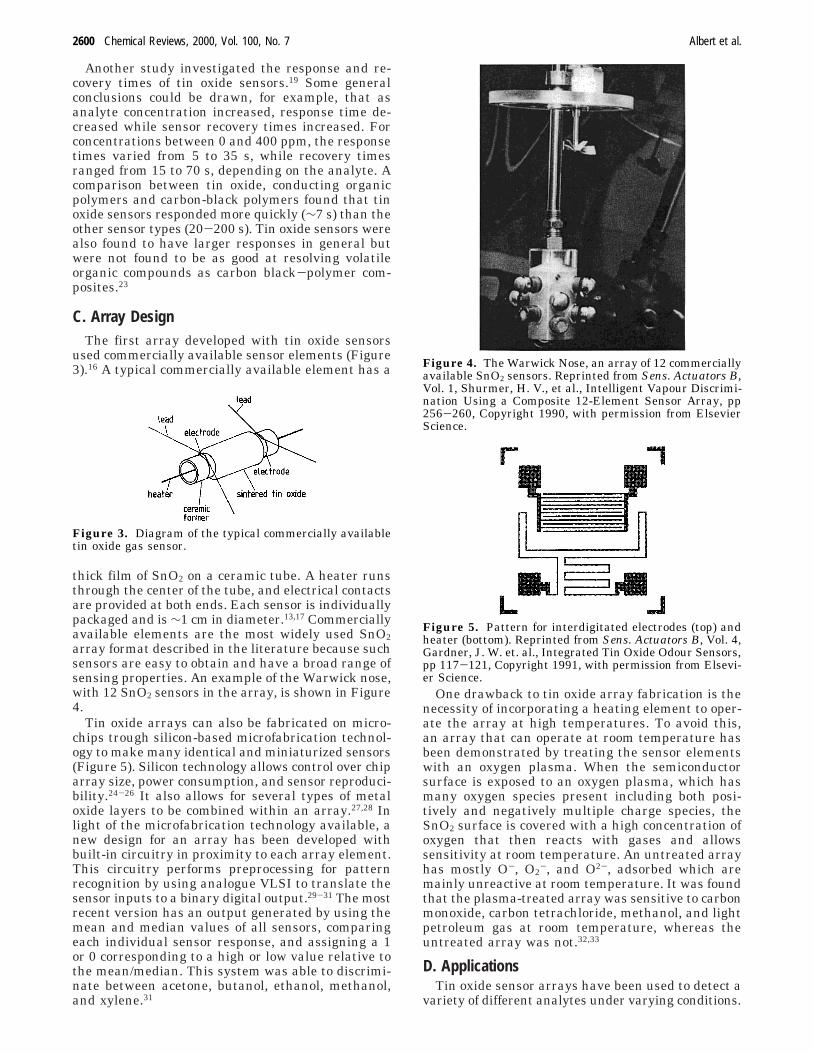
thick film of SnO2 on a ceramic tube. A heater runsthrough the center of the tube, and electrical contactsare provided at both ends. Each sensor is individuallypackaged and is ∼1 cm in diameter.13,17 Commerciallyavailable elements are the most widely used SnO2array format described in the literature because suchsensors are easy to obtain and have a broad range ofsensing properties. An example of the Warwick nose,with 12 SnO2 sensors in the array, is shown in Figure4.
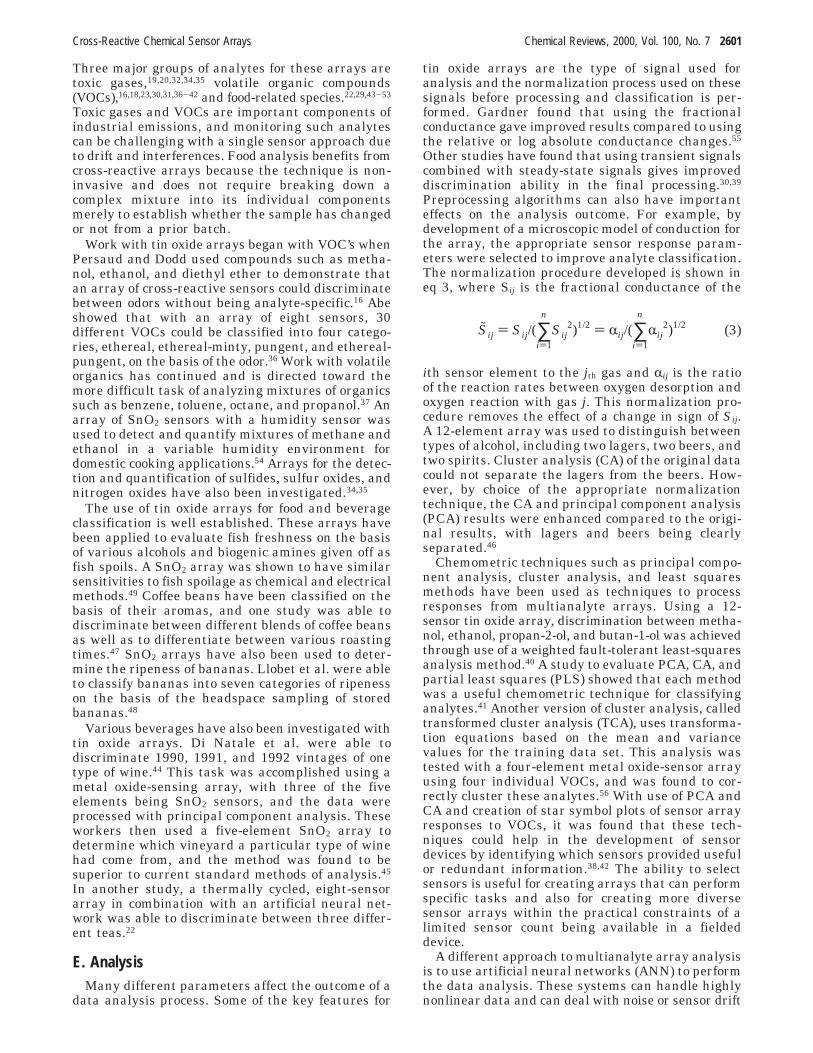
Tin oxide arrays can also be fabricated on micro-chips trough silicon-based microfabrication technol-ogy to make many identical and miniaturized sensors(Figure 5). Silicon technology allows control over chiparray size, power consumption, and sensor reproduci-bility.24-26 It also allows for several types of metaloxide layers to be combined within an array.27,28 Inlight of the microfabrication technology available, anew design for an array has been developed withbuilt-in circuitry in proximity to each array element.This circuitry performs preprocessing for patternrecognition by using analogue VLSI to translate thesensor inputs to a binary digital output.29-31 The mostrecent version has an output generated by using themean and median values of all sensors, comparingeach individual sensor response, and assigning a 1or 0 corresponding to a high or low value relative tothe mean/median. This system was able to discrimi-nate between acetone, butanol, ethanol, methanol,and xylene.31
One drawback to tin oxide array fabrication is thenecessity of incorporating a heating element to oper-ate the array at high temperatures. To avoid this,an array that can operate at room temperature hasbeen demonstrated by treating the sensor elementswith an oxygen plasma. When the semiconductorsurface is exposed to an oxygen plasma, which hasmany oxygen species present including both posi-tively and negatively multiple charge species, theSnO2 surface is covered with a high concentration ofoxygen that then reacts with gases and allowssensitivity at room temperature. An untreated arrayhas mostly O-, O2
-, and O2-, adsorbed which aremainly unreactive at room temperature. It was foundthat the plasma-treated array was sensitive to carbonmonoxide, carbon tetrachloride, methanol, and lightpetroleum gas at room temperature, whereas theuntreated array was not.32,33
D. ApplicationsTin oxide sensor arrays have been used to detect a
variety of different analytes under varying conditions.
Figure 3. Diagram of the typical commercially availabletin oxide gas sensor.
Figure 4. The Warwick Nose, an array of 12 commerciallyavailable SnO2 sensors. Reprinted from Sens. Actuators B,Vol. 1, Shurmer, H. V., et al., Intelligent Vapour Discrimi-nation Using a Composite 12-Element Sensor Array, pp256-260, Copyright 1990, with permission from ElsevierScience.
Figure 5. Pattern for interdigitated electrodes (top) andheater (bottom). Reprinted from Sens. Actuators B, Vol. 4,Gardner, J. W. et. al., Integrated Tin Oxide Odour Sensors,pp 117-121, Copyright 1991, with permission from Elsevi-er Science.
2600 Chemical Reviews, 2000, Vol. 100, No. 7 Albert et al.
Three major groups of analytes for these arrays aretoxic gases,19,20,32,34,35 volatile organic compounds(VOCs),16,18,23,30,31,36-42 and food-related species.22,29,43-53
Toxic gases and VOCs are important components ofindustrial emissions, and monitoring such analytescan be challenging with a single sensor approach dueto drift and interferences. Food analysis benefits fromcross-reactive arrays because the technique is non-invasive and does not require breaking down acomplex mixture into its individual componentsmerely to establish whether the sample has changedor not from a prior batch.
Work with tin oxide arrays began with VOC’s whenPersaud and Dodd used compounds such as metha-nol, ethanol, and diethyl ether to demonstrate thatan array of cross-reactive sensors could discriminatebetween odors without being analyte-specific.16 Abeshowed that with an array of eight sensors, 30different VOCs could be classified into four catego-ries, ethereal, ethereal-minty, pungent, and ethereal-pungent, on the basis of the odor.36 Work with volatileorganics has continued and is directed toward themore difficult task of analyzing mixtures of organicssuch as benzene, toluene, octane, and propanol.37 Anarray of SnO2 sensors with a humidity sensor wasused to detect and quantify mixtures of methane andethanol in a variable humidity environment fordomestic cooking applications.54 Arrays for the detec-tion and quantification of sulfides, sulfur oxides, andnitrogen oxides have also been investigated.34,35
The use of tin oxide arrays for food and beverageclassification is well established. These arrays havebeen applied to evaluate fish freshness on the basisof various alcohols and biogenic amines given off asfish spoils. A SnO2 array was shown to have similarsensitivities to fish spoilage as chemical and electricalmethods.49 Coffee beans have been classified on thebasis of their aromas, and one study was able todiscriminate between different blends of coffee beansas well as to differentiate between various roastingtimes.47 SnO2 arrays have also been used to deter-mine the ripeness of bananas. Llobet et al. were ableto classify bananas into seven categories of ripenesson the basis of the headspace sampling of storedbananas.48
Various beverages have also been investigated withtin oxide arrays. Di Natale et al. were able todiscriminate 1990, 1991, and 1992 vintages of onetype of wine.44 This task was accomplished using ametal oxide-sensing array, with three of the fiveelements being SnO2 sensors, and the data wereprocessed with principal component analysis. Theseworkers then used a five-element SnO2 array todetermine which vineyard a particular type of winehad come from, and the method was found to besuperior to current standard methods of analysis.45
In another study, a thermally cycled, eight-sensorarray in combination with an artificial neural net-work was able to discriminate between three differ-ent teas.22
E. AnalysisMany different parameters affect the outcome of a
data analysis process. Some of the key features for
tin oxide arrays are the type of signal used foranalysis and the normalization process used on thesesignals before processing and classification is per-formed. Gardner found that using the fractionalconductance gave improved results compared to usingthe relative or log absolute conductance changes.55
Other studies have found that using transient signalscombined with steady-state signals gives improveddiscrimination ability in the final processing.30,39
Preprocessing algorithms can also have importanteffects on the analysis outcome. For example, bydevelopment of a microscopic model of conduction forthe array, the appropriate sensor response param-eters were selected to improve analyte classification.The normalization procedure developed is shown ineq 3, where Sij is the fractional conductance of the
ith sensor element to the jth gas and Rij is the ratioof the reaction rates between oxygen desorption andoxygen reaction with gas j. This normalization pro-cedure removes the effect of a change in sign of Sij.A 12-element array was used to distinguish betweentypes of alcohol, including two lagers, two beers, andtwo spirits. Cluster analysis (CA) of the original datacould not separate the lagers from the beers. How-ever, by choice of the appropriate normalizationtechnique, the CA and principal component analysis(PCA) results were enhanced compared to the origi-nal results, with lagers and beers being clearlyseparated.46
Chemometric techniques such as principal compo-nent analysis, cluster analysis, and least squaresmethods have been used as techniques to processresponses from multianalyte arrays. Using a 12-sensor tin oxide array, discrimination between metha-nol, ethanol, propan-2-ol, and butan-1-ol was achievedthrough use of a weighted fault-tolerant least-squaresanalysis method.40 A study to evaluate PCA, CA, andpartial least squares (PLS) showed that each methodwas a useful chemometric technique for classifyinganalytes.41 Another version of cluster analysis, calledtransformed cluster analysis (TCA), uses transforma-tion equations based on the mean and variancevalues for the training data set. This analysis wastested with a four-element metal oxide-sensor arrayusing four individual VOCs, and was found to cor-rectly cluster these analytes.56 With use of PCA andCA and creation of star symbol plots of sensor arrayresponses to VOCs, it was found that these tech-niques could help in the development of sensordevices by identifying which sensors provided usefulor redundant information.38,42 The ability to selectsensors is useful for creating arrays that can performspecific tasks and also for creating more diversesensor arrays within the practical constraints of alimited sensor count being available in a fieldeddevice.
A different approach to multianalyte array analysisis to use artificial neural networks (ANN) to performthe data analysis. These systems can handle highlynonlinear data and can deal with noise or sensor drift
Sij ) Sij/(∑i)1
n
Sij2)1/2 ) Rij/(∑
i)1
n
Rij2)1/2 (3)
Cross-Reactive Chemical Sensor Arrays Chemical Reviews, 2000, Vol. 100, No. 7 2601
with less of a negative impact than classical ap-proaches such as PCA and PLS.55 As with most dataanalysis approaches, there are many variations onthe ANN theme. Back-propagation networks havebeen useful to discriminate between similar ana-lytes39,55 and to analyze gas mixtures containinghydrogen, methane, and carbon monoxide.57 Self-organizing artificial neural networks (SOM) createunsupervised, statistical descriptions of the environ-ment with no supplementary information. Thesesystems have been shown to perform gas classifica-tion well and have been investigated for their abilityto learn while operating and thereby counteractsensor drift.58,59 Fuzzy logic has been incorporatedinto some neural networks to provide them with theability to give more than just a yes or no response.This type of neural net in combination with a sixelement, tin oxide array has been shown to discrimi-nate between carbon monoxide, ethanol, and meth-ane.60 Fuzzy ARTMAPs seem to be superior to back-propagation networks and learning vector quanti-zation, due to their ability to learn incrementallywithout forgetting previous information. This featurecombined with the ability to classify as well or betterthan these other techniques could make fuzzy neuralnets the best choice for cross-reactive SnO2 arrayanalysis.48
III. MOSFET Arrays
A. Principles of OperationMetal oxide semiconductor field effect transistors
(MOSFET) have been studied as sensors since 1975when Lundstrom et al. reported a hydrogen-sensitiveMOSFET with palladium as the gate metal.61 Thesegas sensitive MOSFETs are sometimes referred toas GASFETs. In GASFETs, the structure is the sameas a MOSFET, but the traditional aluminum gate isreplaced with a catalytically active metal. Since 1975,a significant amount of research has been directedtoward finding the best materials for the gate to givebetter sensitivity and selectivity for a variety ofanalytes. Several other variations on MOSFETs havebeen developed, such as open gate field effect transis-tors (OGFET), ion sensitive field effect transistors(ISFET) (which have an electrolyte solution as theconducting layer), and CHEMFETs (which are IS-FETs coated with an organic membrane).62,63 Al-though many variations on MOSFETs have beendeveloped, the GASFET seems to be the only typethat has been fabricated into cross-reactive arrays.
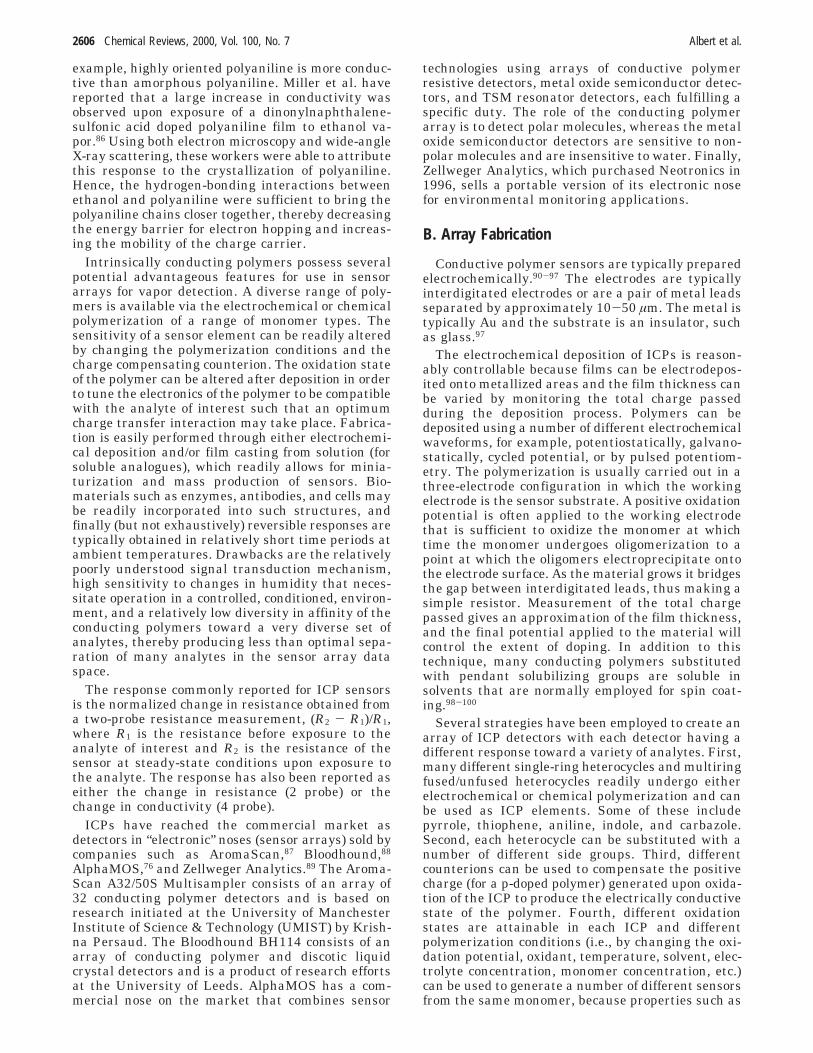
The MOSFET structure consists of a metal gateon top of an oxide layer, typically SiO2, and a p-typesilicon base with n-doped channels on either side ofthe gate (Figure 6). The surface potential, æs, of thesemiconductor layer is dependent on the applied gatevoltage VG and the work function of both the metal,Wm, and semiconductor, Ws, materials.
According to eq 4, a change in Wms leads to a changein the surface potential. Therefore, to maintain aconstant surface potential, the applied gate voltage
must be adjusted in relation to the change in thework function.62,64
GASFETs operate on the principle that the workfunctions of the metal and semiconductor are affectedby gases adsorbed to the surfaces. The manner inwhich the Wms is affected depends on whether themetal gate is continuous (thick film) or discontinuous(thin film). On a continuous surface, the metalsurface catalyzes dehydrogenation reactions of hy-drogen-containing gases using O2 as the electronacceptor. The hydrogen adsorbs to the metal surfaceand can diffuse through the metal to the SiO2/metalinterface where a dipole layer is created. The hydro-gen dipole layer leads to a change in Wms. On adiscontinuous surface, changes are due not only to ahydrogen dipole layer but, in addition, the workfunction is affected by adsorbates on the metalsurface and on exposed portions of the SiO2 layer.62,64
B. Fabrication and OperationAlthough many variations on the actual fabrication
details for MOSFET sensor arrays are possible, someguidelines are generally followed. Dry oxidation at1100-1200 °C is first used to create an oxide layer∼100 nm thick.65,66 The gate metal can be thermallyevaporated onto the oxide surface through a mask,to produce either a layer ∼100-400 nm thick or anultrathin metal 3-30 nm in thickness.65,67 The dis-tance between the n-regions of the gate is usually1-10 µm, while the gate depth is between 10 and100 µm. The actual design of the array can varysignificantly, depending on the application. Arrayshave been designed with 2-12 MOSFET sensors, andsome hybrid arrays have been made with MOSFETsand other sensors (such as tin oxide sensors) com-bined into the same array.
It is well-known that the type of gate metal as wellas the temperature at which the MOSFET is oper-ated will affect the catalytic properties of the sensor.Platinum, palladium, and iridium are the three mostcommon catalytic metals used as gate materials. Pdis a good hydrogen sensor, while Pt and Ir havesensitivities for analytes such as ammonia and etha-nol. Modifying the device operating temperature cansometimes enhance the catalytic activity of a sensortoward particular analytes. For example, Pt has ahigher affinity for ethylene at 200 °C than at 100 °C(Figure 7).64
æs ) f1(VG - Wms/q) Wms ) Wm - Ws (4)
Figure 6. Typical MOSFET structure.
2602 Chemical Reviews, 2000, Vol. 100, No. 7 Albert et al.

C. Applications
One of the early MOSFET arrays was developedby Muller and Lange and consisted of four palladiumgate MOSFET elements. Three of the four elementshad zeolite layers with different pore sizes depositedon top of the Pd gate. This array was used to identifyhydrogen, methane, and acetylene on the basis of thecharacteristic changes in capacitance with time. Byusing correlation coefficients, the three differentgases could be classified, regardless of concentration.This approach was only used with single-componentgas samples.66 Muller modified the array to identifybinary mixtures of hydrogen and methanol vapors.The cross-sensitivity of a single sensor was comparedto the sensitivity of a two element, Pd and PtMOSFET array. Using the transformed least-squaresmethod, the cross-reactivity patterns of the arraycould be deconvoluted to determine the concentrationof hydrogen within the binary mixture.68
Much of the work with MOSFET cross-reactivearrays has been performed at the Linkoping Instituteof Technology in Sweden. In 1990, Sundgren et al.showed that an array of commercially availableMOSFETs could be used to identify components in aquaternary mixture of gases. The six-element arrayused in that work consisted of three pairs of Pd andPt MOSFETs, with each pair operated at differenttemperatures, 100, 150, and 200 °C. The array wastested with a mixture of hydrogen, ammonia, ethyl-ene, and ethanol in a carrier gas of air and argon.The change in the gate voltage due to exposure ofthe array to the gas mixtures was monitored overtime. The three characteristics of this curve used foranalysis were the difference between the pre- andpost-exposure values of the gate voltage, the maxi-mum positive derivative, and the maximum nega-tive derivative of the signal with time. Data wereanalyzed by using three different versions of partialleast squares. Using these methods, the concentra-tion of hydrogen and ammonia in the gas mixturescould be predicted, while ethanol and ethylene couldnot be separated.67 Figure 8 shows the predicted vsactual concentrations of hydrogen and ammonia with
Figure 7. Responses of GASFETs with different gatemetals ∼100 nm Pd, ∼5 nm Pt, and ∼5 nm Ir. Each devicetype was tested with four analytes at 50 ppm in syntheticair and at six temperatures: 75, 100, 125, 150, 175 and200 °C running from left to right in the diagrams. Theresponses are the change in gate voltage during a 5 minvapor pulse. Reprinted from ref 64 with kind permissionfrom Kluwer Academic Publishers.
Figure 8. Predicted vs actual concentration of (a) H2 and(b) NH3 for the 1PLS, nPLS, and mPLS models. Reprintedfrom Sens. Actuators B, Vol. 2, Sundgren, H., et al.,Evaluation of a Multiple Gas Mixture with a SimpleMOSFET Gas Sensor Array and Pattern Recognition, pp115-123, Copyright 1990, with permission from ElsevierScience.
Cross-Reactive Chemical Sensor Arrays Chemical Reviews, 2000, Vol. 100, No. 7 2603

the three versions of PLS. A 45° line through theorigin represents a perfect prediction.
An essential aspect to any type of cross-reactivearray is the pattern recognition method employed todetermine the composition of the analyte. One studyby Sundgren et al. compared the analysis of two typesof MOSFET arrays with PLS and an artificial neuralnetwork (ANN). The first array was identical to thepreviously described array67 and was tested with amixture of hydrogen, ammonia, ethanol, and ethyl-ene. PLS was able to predict the concentrations ofhydrogen and ammonia. ANN could not achieveaccurate predictions for ethanol or ethylene eitherbut made closer predictions to the true concentrationsof hydrogen and ammonia than PLS. The second testwas to use a six-element array consisting of threetypes of gate materials, Pt, Pd, and Ir. This arraywas tested with a binary mixture of hydrogen andacetone. Both PLS and ANN were able to makereasonable predictions of the hydrogen and acetoneconcentrations in these mixtures, with ANN againgiving the more accurate prediction. Although ANNwas more accurate than PLS in both tests, theauthors warned that this might not be the generalcase.69
One other data analysis technique was used withthe previously described two type array data.69 Anadaptive learning network using the abductory in-duction mechanism (AIM) was used to predict thehydrogen and ammonia concentrations. This methodwas found to have similar prediction capabilities asPLS and ANN, but it was unable to predict theconcentration of ethanol and ethylene. This softwareis relatively fast because it develops the networks ina feed-forward fashion that allows for faster learningthan feed-backward ANNs. AIM was found easier touse than PLS or ANN to ascertain which sensorinformation is being used for each analyte. Since eachanalyte has its own network, this method of analysisis well suited for analyzing single components of amixture.70 A later comparison of ANN and AIMpoints out that while AIM is faster, ANN can providea more accurate prediction over a wider concentrationrange.71
D. Alternative Implementations of MOSFETsLundstrom et al. have also taken a completely
different approach to MOSFET arrays by employinga method called the scanning light-pulse tech-nique.64,65,72,73 The premise of this approach is thatwhen light is shined on the surface of a MOSFETcoated with a thin metal film, the light will penetratethe metal and induce a photocapacitive current (iph)in the semiconductor. The depletion layer determinesthis current similar to the surface potential. Tomaintain a constant iph, the applied gate voltage mustbe varied in response to changes in the Wms, just asit would to maintain a constant surface potential.Therefore, when the change in the gate voltage ismonitored a map of ∆V (x, y) over the sensing surfacecan be obtained by taking the difference between thegate voltage in air vs in gas at the same iph. In thisapproach, the MOSFET array employed three con-tinuous strips of Pt, Pd, and Ir along a 4 mm × 6
mm rectangle, instead of separately defined sensorelements. The sensor surface was divided into an 18× 18 grid, and a temperature gradient (110-180 °C)was established down the length of the sensorsurface. This temperature variation allowed for dif-ferent sensitivity and selectivity at each point of thesensor grid. Hydrogen, ammonia, and ethanol weretested individually as mixtures with air. The changein voltage (∆V) was determined for each point of thesensor grid, and the plot of ∆V for each gas was thenprocessed by taking the average of the ∆V for eachpoint and its eight nearest neighbors. An averagehigher than 65 mV was assigned white, and loweraverages were assigned black. In this manner, threedistinct image maps of the gases were created (Figure9). The possible uses for such image mapping includegas mixture identification, investigation of new sens-ing materials simultaneously with the same gassample, and mapping spatially inhomogeneous reac-tions.64,65
Light-pulsed sensing combines many types of in-formation, including the catalytic activity of the gatemetals, gas flow turbulence, edge effects, etc. Dis-tributed chemical sensing was inspired by the light-pulsed technique but sought to separate only theeffects of catalysis. A cell was designed with acontinuous catalytic surface of Pd, with seven MOS-FET sensors spaced 2.8 mm apart along the lengthof the cell. The top and/or bottom of the cell werecoated with thick Pd layers and served as continuouscatalytic surfaces along the length of the cell. Hy-drogen and ethanol were mixed with O2 and N2 andwere passed through the cell at a constant flow of 10mL min-1. The monitored response was the changein gate voltage prior to gas exposure and at the endof a gas exposure. Ethanol and hydrogen could bediscriminated on the basis of their different catalyticprofiles by using information only from the first andlast sensors in the cell.74 A recent paper on distrib-uted chemical sensing utilized two types of MOSFETsand two catalyst surfaces for a total of four differentsensor/catalyst combinations. Each array had fiveidentical MOSFET sensors evenly distributed alongthe length of the cell. The four different arraycombinations were tested with a quaternary mixtureof hydrogen, ammonia, ethyne, and ethanol. Informa-tion from all four array types were combined andanalyzed with PCA and ANN, and used to estimateall four components of the gas mixture. It was alsofound that using information from various positionsin the cell afforded improved results compared tousing only the first and last sensors of the arrays.75
Figure 9. Image maps of (a) ammonia, (b) hydrogen, and(c) ethanol. Reprinted from Sens. Actuators B, Vol. 6,Winquist, F., et al., Visual Images of Gas MixturesProduced with Field-Effect Structures, pp 157-161, Copy-right 1992, with permission from Elsevier Science.
2604 Chemical Reviews, 2000, Vol. 100, No. 7 Albert et al.

E. Hybrid Metal Oxide Containing Arrays
Since the early 1990s, interest has been increasingin creating hybrid arrays, or arrays that combinemore than one type of sensing element. Some of thesehybrid arrays are already commercially available aselectronic noses. Alpha MOS sells The Fox systemwhich is a hybrid array of tin oxide, conductingpolymer, and thickness shear mode (TSM) sensors.76
Another nose available is the eNOSE 5000 from EEVLimited, which consists of conducting polymer, metaloxide, and TSM sensors.77 In the semiconductor-based sensing area, combining MOSFETs and tinoxide sensors has been especially popular. A commonhybrid array setup is using ten MOSFETs, four tinoxide, and one CO2 sensor. At Linkoping Universitythese types of arrays have been used to investigatevarious food products. For example, these arrayswere used to both estimate the storage time of groundpork and beef and to tell these two meats apart.50,52
Ninety percent of the wheat, barley, and oat samplestested were correctly classified as good or bad basedon the mold/musty smells of the grains. This clas-sification rate exceeded the agreement of the twograin inspectors who originally classified the grains.53
They have also used this array to classify fivedifferent types of cardboard, although the best dis-crimination was found using only 4 of the 15 sensorelements.78 Recently, this 15-element hybrid arrayformat was used to monitor the different stages ofrecombinant bioprocesses. The array followed thecultivation of mammalian cells secreting the bloodcoagulant factor VIII. In combination with PCA, fourdifferent stages of the process were determined, beingcell growth, draining the reactor, growth mediumexchange, and production of blood coagulant.79
A slightly smaller hybrid array of eight FETs andfour tin oxide sensors combined with a neural net-work was able to identify 9 out of 10 different typesof cheese correctly.52 A modular approach to hybridarrays was presented by Ulmer et al. and utilized avariety of sensors such as MOSFET, tin oxide, TSM,and electrochemical sensors. This system was dem-onstrated to discriminate between different olive oils,whiskeys, tobaccos, coffees, and plastics.51 A recentpaper from the Linkoping University has utilized ahybrid array in parallel with a conductive polymerarray. A 32-element conductive polymer array wasused in parallel with a hybrid array comprised of 10MOSFETs and 6 tin oxide sensors. This parallelarray was used to predict the fermentation of woodhydrolysates and to estimate quantities of compo-nents of the hydrolysates. Although some success wasdemonstrated, the problem was nontrivial.80
IV. Intrinsically Conductive PolymerChemiresistor Arrays
A. Principles of Operation
The experimental and theoretical behaviors ofintrinsically conducting polymers (ICP’s) have beendiscussed in several reviews and books,81-84 so onlythe basic properties of ICP’s that are required to
understand the operation of ICP-based sensor arraysare discussed in this section. Typically, the funda-mental structural unit of an ICP is a linear backbonecomprised of repeating conjugated organic monomerssuch as acetylene, pyrrole, thiophene, or aniline(Figure 10).
These materials are insulating in their neutralstate. However, chemical or electrochemical reduction(n-doping) or oxidation (p-doping) of these materialsrenders the polymers electrically conductive. Theconductivity is produced through band structuretransformation and/or the generation of charge car-riers. A vast majority of ICPs act as one-dimensionalconductors because the electrons in an n-type ICP(or holes in a p-type ICP) mainly travel through thelinear conjugated chains. Formally, the materials areusually electrical semiconductors as opposed to me-tallic conductors because the materials have anelectronic energy state band gap at room temperaturebetween their valence and conduction bands so thattheir intrinsic electrical conductivity decreases as thetemperature is lowered.
ICPs are useful as chemical sensors because theelectrical properties, typically the dc electrical resist-ance of these systems, are responsive to the presenceof a diverse set of analytes in the vapor phase.Sorption of a vapor into an ICP will induce physicalswelling of the material and will affect the electrondensity on the polymeric chains. The change in dcconductivity, ∆σ, that results from sorption of ananalyte can be divided conceptually into three com-ponents:
Here, ∆σc is the overall change in intrachain conduc-tivity of the ICP, ∆σh is the change in intermolecularconduction due to electron hopping across polymerchains modulated by the presence of the analyte inthe film, and ∆σi is the change in ionic conductivitybetween chains upon analyte sorption. The value of∆σi is not only a function of the ion migration uponcondensation of analyte but also is a function ofproton tunneling rates if hydrogen bonding to the ICPbackbone is significant.85 These conductivity changesmay, or may not, be linearly dependent on theconcentration of analyte presented to the sensor,depending on the particular transduction mechanisminvolved in the ICP of concern.
The pathway for conduction through the conductivepolymer backbone is more favorable energeticallythan across polymer backbones. Therefore, largechanges in conductivity can be attributed to changesin the extrinsic conductivity of the material. For
Figure 10. Structure of four intrinsically conductivepolymers in their insulating form.
∆σ ) (∆σc-1 + ∆σh
-1 + ∆σi-1)-1 (5)
Cross-Reactive Chemical Sensor Arrays Chemical Reviews, 2000, Vol. 100, No. 7 2605
example, highly oriented polyaniline is more conduc-tive than amorphous polyaniline. Miller et al. havereported that a large increase in conductivity wasobserved upon exposure of a dinonylnaphthalene-sulfonic acid doped polyaniline film to ethanol va-por.86 Using both electron microscopy and wide-angleX-ray scattering, these workers were able to attributethis response to the crystallization of polyaniline.Hence, the hydrogen-bonding interactions betweenethanol and polyaniline were sufficient to bring thepolyaniline chains closer together, thereby decreasingthe energy barrier for electron hopping and increas-ing the mobility of the charge carrier.
Intrinsically conducting polymers possess severalpotential advantageous features for use in sensorarrays for vapor detection. A diverse range of poly-mers is available via the electrochemical or chemicalpolymerization of a range of monomer types. Thesensitivity of a sensor element can be readily alteredby changing the polymerization conditions and thecharge compensating counterion. The oxidation stateof the polymer can be altered after deposition in orderto tune the electronics of the polymer to be compatiblewith the analyte of interest such that an optimumcharge transfer interaction may take place. Fabrica-tion is easily performed through either electrochemi-cal deposition and/or film casting from solution (forsoluble analogues), which readily allows for minia-turization and mass production of sensors. Bio-materials such as enzymes, antibodies, and cells maybe readily incorporated into such structures, andfinally (but not exhaustively) reversible responses aretypically obtained in relatively short time periods atambient temperatures. Drawbacks are the relativelypoorly understood signal transduction mechanism,high sensitivity to changes in humidity that neces-sitate operation in a controlled, conditioned, environ-ment, and a relatively low diversity in affinity of theconducting polymers toward a very diverse set ofanalytes, thereby producing less than optimal sepa-ration of many analytes in the sensor array dataspace.
The response commonly reported for ICP sensorsis the normalized change in resistance obtained froma two-probe resistance measurement, (R2 - R1)/R1,where R1 is the resistance before exposure to theanalyte of interest and R2 is the resistance of thesensor at steady-state conditions upon exposure tothe analyte. The response has also been reported aseither the change in resistance (2 probe) or thechange in conductivity (4 probe).
ICPs have reached the commercial market asdetectors in “electronic” noses (sensor arrays) sold bycompanies such as AromaScan,87 Bloodhound,88
AlphaMOS,76 and Zellweger Analytics.89 The Aroma-Scan A32/50S Multisampler consists of an array of32 conducting polymer detectors and is based onresearch initiated at the University of ManchesterInstitute of Science & Technology (UMIST) by Krish-na Persaud. The Bloodhound BH114 consists of anarray of conducting polymer and discotic liquidcrystal detectors and is a product of research effortsat the University of Leeds. AlphaMOS has a com-mercial nose on the market that combines sensor
technologies using arrays of conductive polymerresistive detectors, metal oxide semiconductor detec-tors, and TSM resonator detectors, each fulfilling aspecific duty. The role of the conducting polymerarray is to detect polar molecules, whereas the metaloxide semiconductor detectors are sensitive to non-polar molecules and are insensitive to water. Finally,Zellweger Analytics, which purchased Neotronics in1996, sells a portable version of its electronic nosefor environmental monitoring applications.
B. Array Fabrication
Conductive polymer sensors are typically preparedelectrochemically.90-97 The electrodes are typicallyinterdigitated electrodes or are a pair of metal leadsseparated by approximately 10-50 µm. The metal istypically Au and the substrate is an insulator, suchas glass.97
The electrochemical deposition of ICPs is reason-ably controllable because films can be electrodepos-ited onto metallized areas and the film thickness canbe varied by monitoring the total charge passedduring the deposition process. Polymers can bedeposited using a number of different electrochemicalwaveforms, for example, potentiostatically, galvano-statically, cycled potential, or by pulsed potentiom-etry. The polymerization is usually carried out in athree-electrode configuration in which the workingelectrode is the sensor substrate. A positive oxidationpotential is often applied to the working electrodethat is sufficient to oxidize the monomer at whichtime the monomer undergoes oligomerization to apoint at which the oligomers electroprecipitate ontothe electrode surface. As the material grows it bridgesthe gap between interdigitated leads, thus making asimple resistor. Measurement of the total chargepassed gives an approximation of the film thickness,and the final potential applied to the material willcontrol the extent of doping. In addition to thistechnique, many conducting polymers substitutedwith pendant solubilizing groups are soluble insolvents that are normally employed for spin coat-ing.98-100
Several strategies have been employed to create anarray of ICP detectors with each detector having adifferent response toward a variety of analytes. First,many different single-ring heterocycles and multiringfused/unfused heterocycles readily undergo eitherelectrochemical or chemical polymerization and canbe used as ICP elements. Some of these includepyrrole, thiophene, aniline, indole, and carbazole.Second, each heterocycle can be substituted with anumber of different side groups. Third, differentcounterions can be used to compensate the positivecharge (for a p-doped polymer) generated upon oxida-tion of the ICP to produce the electrically conductivestate of the polymer. Fourth, different oxidationstates are attainable in each ICP and differentpolymerization conditions (i.e., by changing the oxi-dation potential, oxidant, temperature, solvent, elec-trolyte concentration, monomer concentration, etc.)can be used to generate a number of different sensorsfrom the same monomer, because properties such as
2606 Chemical Reviews, 2000, Vol. 100, No. 7 Albert et al.

morphology, molecular weight (conjugation length),connectivity of monomers, conductivity, band gap,etc., are dependent upon the polymerization condi-tions.
Polypyrrole is the predominant polymer in theNeotronics NOSE. Chemical variation is achieved byeither changing the dopant ion or changing thepolymerization conditions. The use of 12 differentpolypyrrole-based sensors produces classification be-tween chemically similar samples over a wide rangeof analytes.94 In a separate paper, Pearce et al.constructed a 12-element electronic nose.101 Table 1lists the 12 different sensors and the electrochemicalconditions used to prepare them.
Ten of the elements consisted of polypyrrole pre-pared with different counterions and polymerizationconditions while the eleventh and twelfth elementswere a polyaniline and a poly(3-hexylthiophene) film,respectively. Hatfield et al. have reported the con-struction of a 20-element sensor array composed ofderivatized polypyrroles, thiophenes and other het-erocyclic polymers.102 Serra et al. have reported thedifferences in sensitivities of various analytes to threedifferent poly(3,3′-dipentoxy-2,2′-bithiophene) sen-sors.103 Chemical variation in these films was achievedby performing the vapor phase polymerization of themonomer in the presence of different oxidizing salts.Serra et al. conclude that, under different oxidizingconditions, different sensors are prepared with sen-sitivities (percentage variation of the resistance)ranging from -6.22 to 1.77.
Jahnke et al. utilized an array of poly(2,5-furylenevinylene) sensors to construct an electronic nose85
using a soluble precursor route involving an aldoladdition reaction of 5-methylfuran-2-carbaldehydewith a basic catalyst to obtain the precursor poly-(2,5-furylenehydroxyethylene). The polymers werethen spin-coated onto the sensor substrate andthermally dehydrated to varying degrees, thus mak-ing different sensors by the amount of eliminationthat occurred. In a similar approach, De Wit et al.prepared an array of poly(2,5-thenylene vinylene)copolymer conductometric sensors.98 Preparation in-
volved making a sulfonium precursor polymer, dis-solving this polymer in acetone, and spin casting itonto the substrate. Thermal elimination and chemicaldoping yielded the conductive PTV. The authorsprepared both the unsubstituted PTV and a methoxy-substituted derivative. Thermal elimination to vary-ing degrees created chemically different sensors inthat the conjugation lengths of the conductive seg-ments were different. Sensors were reported toexhibit an extreme baseline drift that rendered theminoperable after ca. 1 month, although they could beregenerated by redoping the polymers with iodinevapor. The responses were reported to be linear withconcentration between 5% and 100% of the saturatedvapor pressure for a series of nine test vapors(toluene, water, propanol, acetone, acetic acid, diethylether, ethyl acetate, methanol, and ethanol). In usingboth the relative response and the recovery timeresponse, a single detector was able to distinguishbetween six of the nine analytes.
C. ApplicationsOne of the more prevalent fields of application
presented in the literature for the ICP electronicnoses is monitoring the quality of foods and bever-ages.104 A nose consisting of four different poly-thiophene sensor elements was used in conjunctionwith a taste sensor consisting of eight differentpolymer/lipid membranes. Using principal componentanalysis, four different wines were correctly identifiedand discrimination was successfully performed amongfive aged samples of the same wine. The authorsconcluded that sensor fusion of both the smell andtaste sensor arrays led to enhanced discrimination.99
Numerous papers have been published on usingthe electronic nose to monitor the quality ofbeer.101,105,106 In a detailed analysis performed byPearce and Gardner, an array of 21 conductingpolymers was used to predict organoleptic scores. Inthis study, a control lager beer was spiked withdifferent reference compounds (diacetyl, dimethylsulfide, and hop essence). For high concentrations ofthe reference compound in beer (>40 ppb), the
Table 1. Twelve Conductive Polymers That Constitute an ICP Sensor Array That Were Prepared byElectrochemical Polymerization Using a Conventional 3-Electrode Electrochemical Cella
sensorno. polymer system
monomer concn(mol/dm-3)
electrolyte concn(mol dm-3) solvent
growthpotential (V)
finalpotential (V)
resistance(Ω)
1 PPy-BSA Py 0.1 0.1 H2O 0.85 0.00 16502 PPy-PSA Py 0.1 0.1 H2O 0.85 0.00 1933 PPy-HxSA Py 0.1 0.1 H2O 0.85 0.00 274 PPy-HpSA Py 0.1 0.1 H2O 0.85 0.00 165 PPy-OSA Py 0.1 0.1 H2O 0.85 0.00 356 PPy-DSA Py 0.1 0.1 H2O 0.85 0.00 377 PPy-TSA (Na) Py 0.1 0.1 H2O 0.80 0.80 198 PPy-TSA (m) Py 0.1 0.1 EtOH 1.20 0.00 709 PPy-TEATS Py 0.1 0.1 H2O 0.75 0.00 34
10 PPy-TEATS Py 0.1 0.1 PC 1.10 0.00 3711 PAN-NaHSO4 AN 0.44 0.1 H2O 0.90 0.90 4412 P3MT-TEATFB 3MT 0.1 0.1 CH3CN 1.65 1.65 13
a Reproduced from ref 101. The distance between gold electrodes was 15 µm. PPy is polypyrrole, BSA is butanesulfonic acid,HXSA is hexanesulfonic acid, HPSA is heptane sulfonic acid, OSA is octane sulfonic acid, DSA is decanesulfonic acid, TSA (Na)is p-toluenesulfonic acid sodium salt, TSA (m) is p-toluenesulfonic acid monohydrate, TEATs is tetraethylammonium toluene-sulfonate, PAN is polyaniline, NaHSO4 is sodium hydrogen sulfate, P3MT is poly(3-methylthiophene), TEATFB is tetraethyl-ammonium tetrafluoroborate, Py is pyrrole, AN is aniline, 3MT is 3-methylthiophene, EtOH is ethanol, PC is propylene carbonate,and CH3CN is acetonitrile.
Cross-Reactive Chemical Sensor Arrays Chemical Reviews, 2000, Vol. 100, No. 7 2607

electronic nose performed worse than both gas chro-matography and flavor profile analysis; whereas, atlow concentrations, the accuracies were reported tobe similar.107
The Aroma Scanner has been reported to be anefficient instrument which complements gas chro-matography/mass spectrometry in the analysis ofvolatiles from both earth-almond and carob, whichwere both analyzed raw and roasted for differentperiods of time.108 The correlation between the sen-sors and the GC/MS was reported to be 0.98 for earth-almond; whereas a lower correlation of 0.74 wasobtained for carob. Schaller et al. reported that anelectronic nose consisting of ICPs exhibited poorsensitivity to the volatile components of cheese withthe main problem being attributed to sensor drift.109
The Neotronics e-nose has been successfully appliedto discriminate between different levels of boartaint.110
Many microorganisms are known to expel volatilechemicals. Work at the University of Leeds has ledto both the detection and discrimination of 13 differ-ent types of microorganisms utilizing a 16-componentsensor array.111 Through use of a three layer percep-tron network on data arising from 244 sampleresponses, a majority of the microorganisms werereported to be classified with a quoted success rateof 100%. Arnold et al. have investigated the use ofan artificial nose to assess bacteria isolated fromprocessed poultry.112
Conducting polymer-based electronic nose technol-ogy also has been reported to offer a rapid, reproduc-ible, and objective method for sewage odor assess-ment.113-116 In averaging all of the data from 10different sewage treatment plants, the authors re-ported that at low concentration ranges (below 4000odor units (ou)/m3) the Neotronics eNOSE outputcorrelated well with olfactometry data.113 However,this was not the case at higher concentrations, dueto saturation of the polypyrrole sensors. The datafrom a single sewage treatment plant exhibited arelationship between the electronic nose responsesand the threshold odor number (TON) over a rangeof concentrations from 125 to 781 066 ou/m3. Furtherwork was carried out by Stuetz et al. using theeNOSE114 in which canonical discriminant analysiswas used to distinguish between different sewagesamples from different treatment works. In thisstudy, linear correlations were established betweenthe electronic nose responses and the 5 day biochemi-cal oxygen demand (BOD5) over time intervals ofabout 1 month. This array could be used for measur-ing chemical activity, making it a useful processcontrol since it has been estimated that about 40%of the energy could be saved by using an on-lineaeration control system. The e-NOSE has also beenused to discriminate between untainted water samplesand water tainted with geosmin, methylisoborneol,2-chlorophenol, phenol, diesel, and 2-chloro-6-meth-ylphenol.115
Researchers have utilized the electronic nose tomonitor air quality in relation to the assessment ofmalodor in agriculture. Fresh liquid pig slurry wasanalyzed using GC/MS to identify the major compo-
nents in the vapor phase. A 20-element ICP sensorarray exhibited a linear response to methanol vapor,whereas nonlinear behavior was reported for aceticacid. Using Sammon mapping, each of the individualcomponents and both basic and acidic pig slurry werediscriminated.117 Byun et al. have reported that thebest way to visualize the data obtained from pigslurry is to combine both principal component anal-ysis and Sammon mapping.118 Furthermore, theAromaScanner has also been used to assess malodorconcentration after the application of cattle slurry tograssland.119 Masila et al. have demonstrated theusefulness of the Aroma Scanner to detect environ-mentally unfriendly halogenated organic compoundssuch as 2,4,5-trichlorophenol, pentachlorophenol, 1,1-bis(4-chlorophenyl)-2,2,2-trichloroethane (DDT), and2,2-bis(4-chlorophenyl)-1,1-dichloroethylene (DDE),just to name a few. Using cluster and Euclideandistance analysis, both the identification and thequantification of these organic compounds werereported.120
The electronic nose has been successfully appliedto several medical and veterinary science applica-tions. To increase the likelihood of successful artificialinsemination in cows it is beneficial to detect theoccurrence of estrus. Lane et al. have been able toutilize the Neotronics eNose to associate odors withthe estrus period.121 For five Holstein-Friesian cows,both the luteal phase and the estrus phase werediscriminated using principal components analysis.121
The AromaScanner was used to identify the sourceof an off-odor from a pharmaceutical inhalant.122
Furthermore, the AromaScanner was used to screenfor bacterial vaginosis.123 Following training of thenose to four positive and four negative cases, 16 ofthe 17 cases were recognized as being positive. Ofthe 43 negative cases, 33 were correctly identified asbeing negative. Thus, the positive predictive valueof the test was calculated to be 61.5%.123
Recently, a conducting polymer sensor array hasbeen used for monitoring the environment of aconfined system. An artificial nose consisting of anarray of 20 conducting polymer (UMIST) and 6 TSMresonators (HKR Sensor Systems) was utilized in theMIR-95 mission and was reactivated in the DARA-MIR 97 mission.124 In this work, it was concludedthat the artificial nose was useful in detecting a fluidleak of ethylene glycol in the cooling system, whichultimately led to contamination of the water supply.The sensor array was also was useful in monitoringthe atmospheric quality after a small fire. Further-more, it was reported that after 1.5 years in the MIRspace station, the system showed little drift ordegradation.124
D. Future DirectionsAmrani et al. have carried out numerous studies
investigating the use of impedance techniques toincrease both the sensitivity and selectivity of ICPsensor arrays.125-129 In this work, the authors reportboth the relative changes in resistance and therelative changes in reactance upon sweeping themeasurement frequency for each sensor in a 20-element ICP array. Both the resistance and reactance
2608 Chemical Reviews, 2000, Vol. 100, No. 7 Albert et al.

were reported to give a linear regression when therelative values versus the concentration of the ana-lyte were plotted. The specificity of the array wasenhanced when the dissipation factor as a functionof frequency were plotted.129
The dissipation factor can be expressed as the ratioof the energy dissipated (purely resistive) per cycledivided by the energy stored (purely reactive) percycle. Therefore, it was calculated as the ratio of theresistive part of the impedance divided by the reac-tive part of the impedance of the sensor. When thedissipation factor vs the applied frequency was plot-ted characteristic resonances were observed for asingle sensor exposed to air, acetone, methanol, andethyl acetate. Not only was excellent discriminationachieved but these resonances were claimed to beuseful to identify components of mixtures of ana-lytes.129 Furthermore, in using alternating current(ac) techniques, sensitivity to a particular analytewas increased 18-fold. The authors noted that theimpedance analyzer is not practical for real applica-tions due to the time that it would take to make ahigh-resolution scan across a range of frequencies.129
They suggested that a way to overcome this draw-back would be to employ periodic signals containingmany different frequencies such that all of thefrequencies are presented to the sensor at once.Furthermore, it was suggested that Fourier trans-form techniques could be used to isolate the responseof a sensor at any number of specific frequencies.129
V. Conductive Polymer Composite ChemiresistorArrays
A. Theory
Electronic noses based on an array of polymercomposite sensors have been developed using eithercarbon black130 or polypyrrole131 as a conductive fillerand nonconductive organic polymers as the insulatingmatrix. The transduction mechanism for the poly-pyrrole composites is potentially quite complex inthat the analyte can interact with both the insulatingmatrix and the conductive polymer; whereas thetransduction mechanism of the carbon black com-posite sensors has been described on the basis ofpercolation theory. Upon exposure to an odorant, thecomposites will swell to varying degrees dependingon the polymer-odorant interactions, and this swell-ing results in a change in the conductivity of thecomposite film. This response can be easily monitoredusing a conventional ohmmeter. Therefore, eachsensor element in the array, consisting of a chemi-cally unique insulating matrix, responds differentlyto a given odorant, resulting in a distinctive pattern.For example, carbon black composite sensor arraysconsisting of 17 sensor elements can easily distin-guish between a chemically diverse set of analytesand mixtures consisting of two chemically similaranalytes.
Percolation theory132,133 predicts that the resistiv-ity, F, of a conducting composite will be given by
where
and where Fc is the resistivity of the conductive filler,Fm is the resistivity of the insulating matrix, νc is thevolume fraction of the conductive filler in the com-posite, z is the coordination number of the conductivefiller particles, and f is their total packing fraction(νc < f). Since these sensors are believed to operateby this percolation conduction, it is possible tofabricate high gain sensors by working close to thepercolation threshold, νp, which is given by 2f/z, suchthat a small volume change would induce a largeresistance change.
B. Fabrication
Sensor fabrication entails casting a thin film of thecomposite over two electrical leads. For polypyrrole-based sensors this was achieved by chemically poly-merizing pyrrole using phosphomolybdic acid in asolution containing the insulating polymer. The solu-tion was then used to dip coat the substrate, a cut22 µF capacitor (interdigitated electrode pair with alead separation of 15 µm).131 Carbon black compositesensors were prepared simply by either dip coatingan interdigitated electrode capacitor or by either dipcoating or spin casting onto a glass substrate con-taining two gold leads separated by a 5 mm spac-ing.130
Lonergan et al. prepared a diverse carbon black-based conducting polymer composite sensor arrayconsisting of 17 chemically different insulating poly-mers as listed in Table 2.130 Responses were typicallymeasured as the maximum relative differential re-sistance (R2 - R1)/R1, where R1 is the baselineresistance of the film prior to exposure and R2 is themaximum resistance upon exposure to the analyte.Each of the analyte exposures produced an increasein the resistance of the sensor, which is consistentwith percolation theory. However, this was notalways the case with polypyrrole composite sensors,indicating a more complex transduction mechanismthat involves both the swelling of the insulatingmatrix and/or the polypyrrole or specific electronicinteractions of the analyte with the conductingpolymer, which would change its intrinsic conductiv-ity.96
The normalized, relative differential resistancedata for a set of carbon black sensors produced adifferent pattern upon exposure to nine differentanalytes as would be expected by the chemical natureof both the insulating phase of the composite and theanalyte. For instance, sensor 16 (poly(ethylene-co-vinyl acetate)/carbon black) is hydrophobic and therebyresponds best to benzene, whereas sensor 6 (poly(N-vinylpyrrolidone)/carbon black) is hydrophilic andresponds very well to methanol. Principal component
F )(z - 2)FcFm
A + B + [(A + B)2 + 2(z - 2)FcFm]1/2(6)
A ) Fc[-1 + (z/2)[1 - (νc/f))] (7)
B ) Fm[(zνc/2f) - 1] (8)
Cross-Reactive Chemical Sensor Arrays Chemical Reviews, 2000, Vol. 100, No. 7 2609
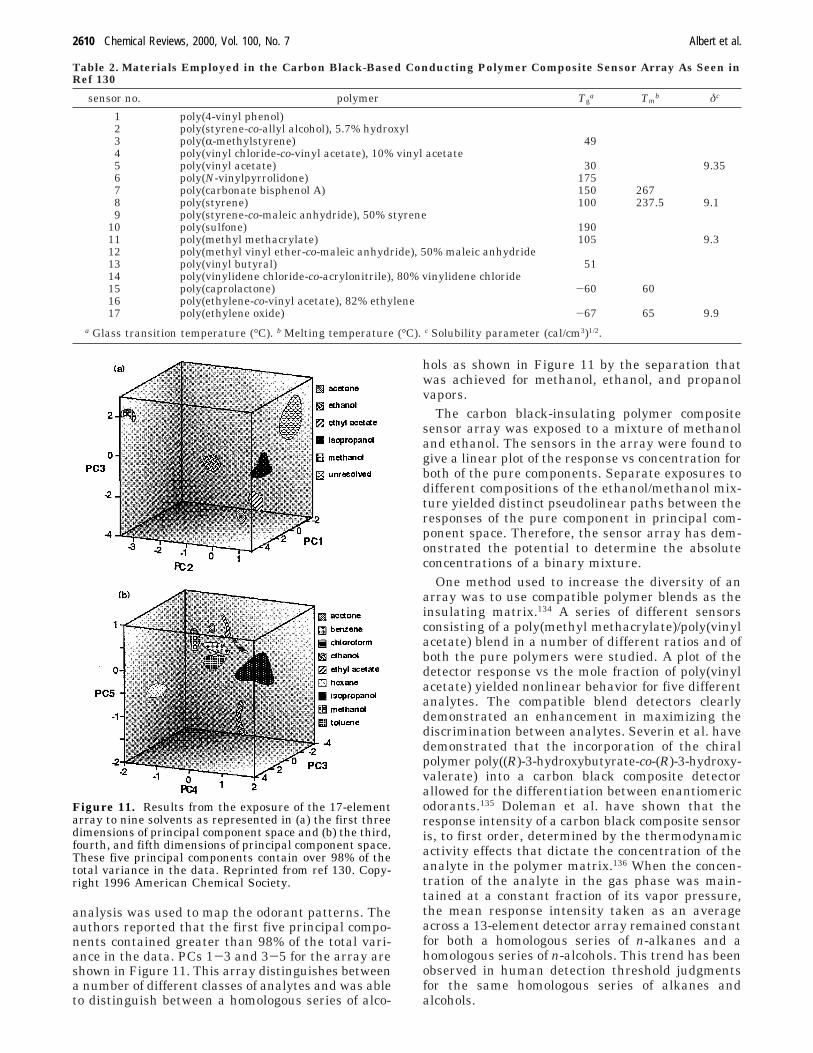
analysis was used to map the odorant patterns. Theauthors reported that the first five principal compo-nents contained greater than 98% of the total vari-ance in the data. PCs 1-3 and 3-5 for the array areshown in Figure 11. This array distinguishes betweena number of different classes of analytes and was ableto distinguish between a homologous series of alco-
hols as shown in Figure 11 by the separation thatwas achieved for methanol, ethanol, and propanolvapors.
The carbon black-insulating polymer compositesensor array was exposed to a mixture of methanoland ethanol. The sensors in the array were found togive a linear plot of the response vs concentration forboth of the pure components. Separate exposures todifferent compositions of the ethanol/methanol mix-ture yielded distinct pseudolinear paths between theresponses of the pure component in principal com-ponent space. Therefore, the sensor array has dem-onstrated the potential to determine the absoluteconcentrations of a binary mixture.
One method used to increase the diversity of anarray was to use compatible polymer blends as theinsulating matrix.134 A series of different sensorsconsisting of a poly(methyl methacrylate)/poly(vinylacetate) blend in a number of different ratios and ofboth the pure polymers were studied. A plot of thedetector response vs the mole fraction of poly(vinylacetate) yielded nonlinear behavior for five differentanalytes. The compatible blend detectors clearlydemonstrated an enhancement in maximizing thediscrimination between analytes. Severin et al. havedemonstrated that the incorporation of the chiralpolymer poly((R)-3-hydroxybutyrate-co-(R)-3-hydroxy-valerate) into a carbon black composite detectorallowed for the differentiation between enantiomericodorants.135 Doleman et al. have shown that theresponse intensity of a carbon black composite sensoris, to first order, determined by the thermodynamicactivity effects that dictate the concentration of theanalyte in the polymer matrix.136 When the concen-tration of the analyte in the gas phase was main-tained at a constant fraction of its vapor pressure,the mean response intensity taken as an averageacross a 13-element detector array remained constantfor both a homologous series of n-alkanes and ahomologous series of n-alcohols. This trend has beenobserved in human detection threshold judgmentsfor the same homologous series of alkanes andalcohols.
Table 2. Materials Employed in the Carbon Black-Based Conducting Polymer Composite Sensor Array As Seen inRef 130
sensor no. polymer Tga Tm
b δc
1 poly(4-vinyl phenol)2 poly(styrene-co-allyl alcohol), 5.7% hydroxyl3 poly(R-methylstyrene) 494 poly(vinyl chloride-co-vinyl acetate), 10% vinyl acetate5 poly(vinyl acetate) 30 9.356 poly(N-vinylpyrrolidone) 1757 poly(carbonate bisphenol A) 150 2678 poly(styrene) 100 237.5 9.19 poly(styrene-co-maleic anhydride), 50% styrene
10 poly(sulfone) 19011 poly(methyl methacrylate) 105 9.312 poly(methyl vinyl ether-co-maleic anhydride), 50% maleic anhydride13 poly(vinyl butyral) 5114 poly(vinylidene chloride-co-acrylonitrile), 80% vinylidene chloride15 poly(caprolactone) -60 6016 poly(ethylene-co-vinyl acetate), 82% ethylene17 poly(ethylene oxide) -67 65 9.9
a Glass transition temperature (°C). b Melting temperature (°C). c Solubility parameter (cal/cm3)1/2.
Figure 11. Results from the exposure of the 17-elementarray to nine solvents as represented in (a) the first threedimensions of principal component space and (b) the third,fourth, and fifth dimensions of principal component space.These five principal components contain over 98% of thetotal variance in the data. Reprinted from ref 130. Copy-right 1996 American Chemical Society.
2610 Chemical Reviews, 2000, Vol. 100, No. 7 Albert et al.
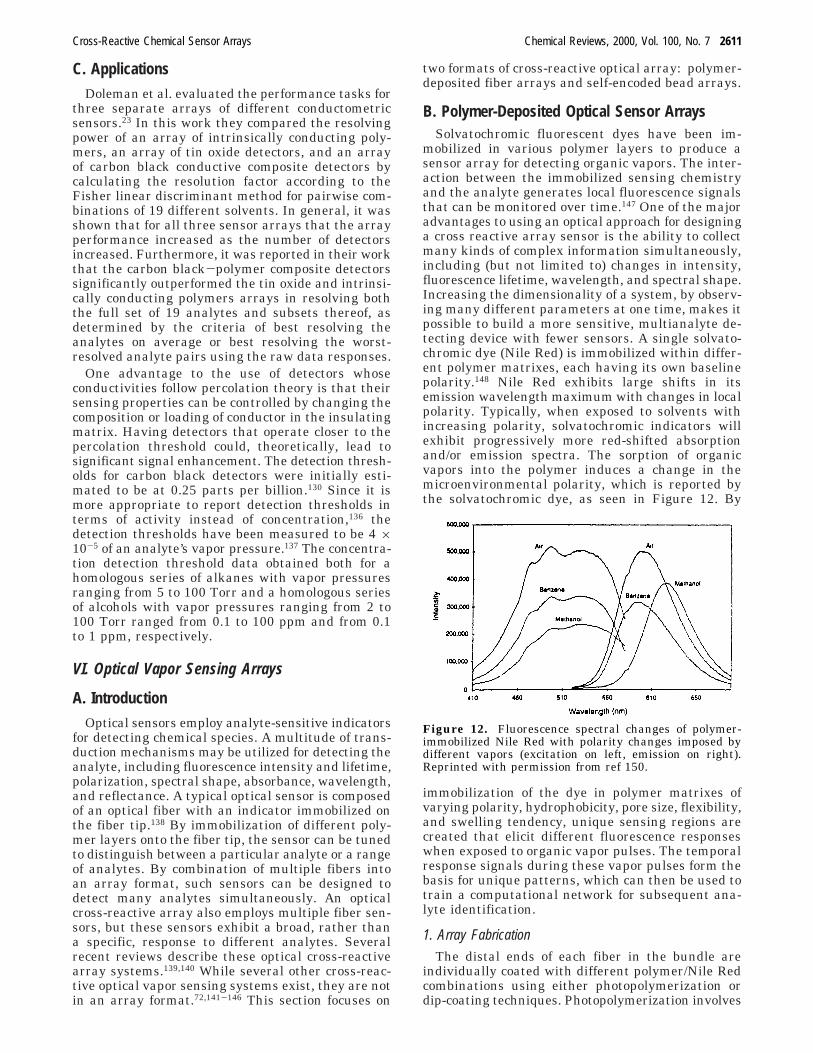
C. ApplicationsDoleman et al. evaluated the performance tasks for
three separate arrays of different conductometricsensors.23 In this work they compared the resolvingpower of an array of intrinsically conducting poly-mers, an array of tin oxide detectors, and an arrayof carbon black conductive composite detectors bycalculating the resolution factor according to theFisher linear discriminant method for pairwise com-binations of 19 different solvents. In general, it wasshown that for all three sensor arrays that the arrayperformance increased as the number of detectorsincreased. Furthermore, it was reported in their workthat the carbon black-polymer composite detectorssignificantly outperformed the tin oxide and intrinsi-cally conducting polymers arrays in resolving boththe full set of 19 analytes and subsets thereof, asdetermined by the criteria of best resolving theanalytes on average or best resolving the worst-resolved analyte pairs using the raw data responses.
One advantage to the use of detectors whoseconductivities follow percolation theory is that theirsensing properties can be controlled by changing thecomposition or loading of conductor in the insulatingmatrix. Having detectors that operate closer to thepercolation threshold could, theoretically, lead tosignificant signal enhancement. The detection thresh-olds for carbon black detectors were initially esti-mated to be at 0.25 parts per billion.130 Since it ismore appropriate to report detection thresholds interms of activity instead of concentration,136 thedetection thresholds have been measured to be 4 ×10⁻⁵ of an analyte’s vapor pressure.137 The concentra-tion detection threshold data obtained both for ahomologous series of alkanes with vapor pressuresranging from 5 to 100 Torr and a homologous seriesof alcohols with vapor pressures ranging from 2 to100 Torr ranged from 0.1 to 100 ppm and from 0.1to 1 ppm, respectively.
VI. Optical Vapor Sensing Arrays
A. IntroductionOptical sensors employ analyte-sensitive indicators
for detecting chemical species. A multitude of trans-duction mechanisms may be utilized for detecting theanalyte, including fluorescence intensity and lifetime,polarization, spectral shape, absorbance, wavelength,and reflectance. A typical optical sensor is composedof an optical fiber with an indicator immobilized onthe fiber tip.138 By immobilization of different poly-mer layers onto the fiber tip, the sensor can be tunedto distinguish between a particular analyte or a rangeof analytes. By combination of multiple fibers intoan array format, such sensors can be designed todetect many analytes simultaneously. An opticalcross-reactive array also employs multiple fiber sen-sors, but these sensors exhibit a broad, rather thana specific, response to different analytes. Severalrecent reviews describe these optical cross-reactivearray systems.139,140 While several other cross-reac-tive optical vapor sensing systems exist, they are notin an array format.72,141-146 This section focuses on
two formats of cross-reactive optical array: polymer-deposited fiber arrays and self-encoded bead arrays.
B. Polymer-Deposited Optical Sensor ArraysSolvatochromic fluorescent dyes have been im-
mobilized in various polymer layers to produce asensor array for detecting organic vapors. The inter-action between the immobilized sensing chemistryand the analyte generates local fluorescence signalsthat can be monitored over time.147 One of the majoradvantages to using an optical approach for designinga cross reactive array sensor is the ability to collectmany kinds of complex information simultaneously,including (but not limited to) changes in intensity,fluorescence lifetime, wavelength, and spectral shape.Increasing the dimensionality of a system, by observ-ing many different parameters at one time, makes itpossible to build a more sensitive, multianalyte de-tecting device with fewer sensors. A single solvato-chromic dye (Nile Red) is immobilized within differ-ent polymer matrixes, each having its own baselinepolarity.148 Nile Red exhibits large shifts in itsemission wavelength maximum with changes in localpolarity. Typically, when exposed to solvents withincreasing polarity, solvatochromic indicators willexhibit progressively more red-shifted absorptionand/or emission spectra. The sorption of organicvapors into the polymer induces a change in themicroenvironmental polarity, which is reported bythe solvatochromic dye, as seen in Figure 12. By
immobilization of the dye in polymer matrixes ofvarying polarity, hydrophobicity, pore size, flexibility,and swelling tendency, unique sensing regions arecreated that elicit different fluorescence responseswhen exposed to organic vapor pulses. The temporalresponse signals during these vapor pulses form thebasis for unique patterns, which can then be used totrain a computational network for subsequent ana-lyte identification.
1. Array FabricationThe distal ends of each fiber in the bundle are
individually coated with different polymer/Nile Redcombinations using either photopolymerization ordip-coating techniques. Photopolymerization involves
Figure 12. Fluorescence spectral changes of polymer-immobilized Nile Red with polarity changes imposed bydifferent vapors (excitation on left, emission on right).Reprinted with permission from ref 150.
Cross-Reactive Chemical Sensor Arrays Chemical Reviews, 2000, Vol. 100, No. 7 2611
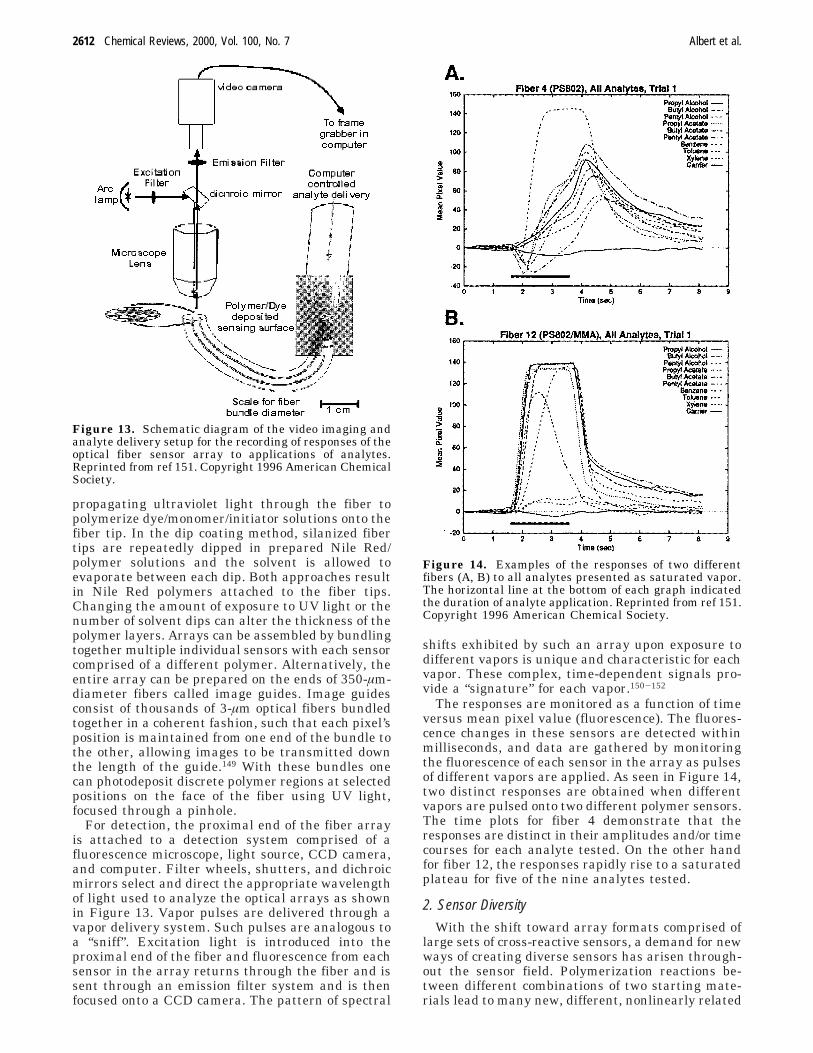
propagating ultraviolet light through the fiber topolymerize dye/monomer/initiator solutions onto thefiber tip. In the dip coating method, silanized fibertips are repeatedly dipped in prepared Nile Red/polymer solutions and the solvent is allowed toevaporate between each dip. Both approaches resultin Nile Red polymers attached to the fiber tips.Changing the amount of exposure to UV light or thenumber of solvent dips can alter the thickness of thepolymer layers. Arrays can be assembled by bundlingtogether multiple individual sensors with each sensorcomprised of a different polymer. Alternatively, theentire array can be prepared on the ends of 350-µm-diameter fibers called image guides. Image guidesconsist of thousands of 3-µm optical fibers bundledtogether in a coherent fashion, such that each pixel’sposition is maintained from one end of the bundle tothe other, allowing images to be transmitted downthe length of the guide.149 With these bundles onecan photodeposit discrete polymer regions at selectedpositions on the face of the fiber using UV light,focused through a pinhole.
For detection, the proximal end of the fiber arrayis attached to a detection system comprised of afluorescence microscope, light source, CCD camera,and computer. Filter wheels, shutters, and dichroicmirrors select and direct the appropriate wavelengthof light used to analyze the optical arrays as shownin Figure 13. Vapor pulses are delivered through avapor delivery system. Such pulses are analogous toa “sniff”. Excitation light is introduced into theproximal end of the fiber and fluorescence from eachsensor in the array returns through the fiber and issent through an emission filter system and is thenfocused onto a CCD camera. The pattern of spectral
shifts exhibited by such an array upon exposure todifferent vapors is unique and characteristic for eachvapor. These complex, time-dependent signals pro-vide a “signature” for each vapor.150-152
The responses are monitored as a function of timeversus mean pixel value (fluorescence). The fluores-cence changes in these sensors are detected withinmilliseconds, and data are gathered by monitoringthe fluorescence of each sensor in the array as pulsesof different vapors are applied. As seen in Figure 14,two distinct responses are obtained when differentvapors are pulsed onto two different polymer sensors.The time plots for fiber 4 demonstrate that theresponses are distinct in their amplitudes and/or timecourses for each analyte tested. On the other handfor fiber 12, the responses rapidly rise to a saturatedplateau for five of the nine analytes tested.
2. Sensor Diversity
With the shift toward array formats comprised oflarge sets of cross-reactive sensors, a demand for newways of creating diverse sensors has arisen through-out the sensor field. Polymerization reactions be-tween different combinations of two starting mate-rials lead to many new, different, nonlinearly related
Figure 13. Schematic diagram of the video imaging andanalyte delivery setup for the recording of responses of theoptical fiber sensor array to applications of analytes.Reprinted from ref 151. Copyright 1996 American ChemicalSociety.
Figure 14. Examples of the responses of two differentfibers (A, B) to all analytes presented as saturated vapor.The horizontal line at the bottom of each graph indicatedthe duration of analyte application. Reprinted from ref 151.Copyright 1996 American Chemical Society.
2612 Chemical Reviews, 2000, Vol. 100, No. 7 Albert et al.

sensing materials. This approach has been demon-strated in two ways: (a) the use of discrete polymersensing cones each comprised of a specific monomercombination, (b) the fabrication of polymer gradientsensors. Gradient sensors were formed by scanninga pinhole-focused UV light beam across the proximalface of the fiber while steadily changing the concen-trations of the two monomers in the solution beingphotopolymerized. The distal tip of the fiber resides,in the solutions, so that a polymer “stripe” forms asthe photopolymerization occurs. The resulting poly-mer stripe contains all combinations of the startingand ending monomer concentrations. Responses fromvarious regions of the gradient sensor were found topossess a far higher degree of diversity than did thecorresponding region of a single component controlstripe. In addition, responses from adjacent regionsprogressing down the length of the gradient stripeare not related to each other in a logical, linearfashion. One might expect different combinations oftwo monomers to yield sensors with responses thatare simply related to the proportion of the twomonomers used to construct the sensor. In actuality,such a progression is not observed: mixture re-sponses do not appear to be linear combinations ofthe individual polymer responses. This individualityis most likely due to variation in polymerizationkinetics and microstructure formation in the finalpolymer layer caused by the monomer ratio changes.In this way, it is possible to generate large collectionsof different sensing matrixes simply and efficientlyfrom a limited set of starting materials.
C. Self-Encoded Bead SensorsDecreasing the size of the sensor has enormous
advantages in terms of both response time as wellas the number of potential uses for such a device.Thousands of tiny beads (3.2 µm) can be immobilizedin individual, acid-etched wells at the tip of animaging fiber.153 By introducing vapor-sensitive dyesinto beads constructed from a wide range of polymericand/or ceramic materials, it is possible to build an“ensemble” comprised of as many different types ofsensor beads as necessary. Nile Red can be attachedto different beads with the responses of all the beadsfrom a particular preparation displaying nearlyidentical response behavior. Each bead class has aunique, well-defined response allowing individualbeads to be easily identified after they have beendeposited into wells. Since each bead type has its ownunique response to a given vapor, the beads caneasily be recognized after they have been placed intothe image guide wells by simply exposing the arrayto a known test vapor and matching the resultingtemporal response plots to those obtained beforehandfor each bead class (Figure 15). In this way, the beadsensors are “self-encoding”. The ability to prepareliterally billions of identical beads in a single prepa-ration should enable the computational networktraining to be transferred from one image guideensemble to another.154
By using microspheres as sensor matrixes, the sizeof the overall array can be drastically reduced. Thisdecrease in size in turn significantly shortens sensor
response times while simultaneously enhancing sen-sor sensitivity. Silica bead sensors, for instance, werefound to have response times on the order of ∼150ms, with signal changes of up to 1700%. On average,a 5-s experiment is ample time for most beads to fullyrespond to and recover from a pulse of vapor at anygiven concentration.
The recent development of an “electronic tongue”,which is selective for the individual solutions, but notspecific in their recognition properties, is an impor-tant step in the progress of optical cross-reactivesensor arrays.155 Four taste categories, sweet, sour,salty, and bitter, were created from four differentbead types, which measure combinations of pH, Ca+,Ce+, and simple sugars. Red, green, and blue lightintensities were acquired for the each of the indi-vidual beads and used for the analyte quantification.The polymer response times were under 1 min, andthe array was integrated allowing for continuousmeasurements of the bead-analyte response. Theuse of the red, green, and blue light intensities is anovel approach to sensor fabrication and provides abasis for combining an “artificial nose” with an“electric tongue” to gather both vapor and solutioninformation.
D. Sensor SensitivityAn important feature of any artificial nose is its
ability to detect and quantify low concentrations ofodors. In an effort to improve sensor sensitivity,common adsorbents have been incorporated directlyinto the sensing layers.156 The most effective ap-proach has been to directly adsorb dye molecules tothe surface of alumina and silica particles. Theseparticles are then adhered to fiber distal tips usingvarious polymers and epoxies. The resulting sensors
Figure 15. Schematic depiction of the self-encoded beadarrays concept. A mixture of sensor beads is prepared bycombining aliquots from three stock solutions, each con-taining a different type of polymer/dye sensor suspendedin a Nanopure water/0.01% Tween solution. A drop of thefinal mixture is then placed onto the distal tip of an etchedimaging fiber. After they have settled in random locationsthroughout the well array, the beads are identified andcategorized by their characteristic responses to a test vaporpulse, without the need for any additional encoding schemes.Reprinted from ref 154. Copyright 1999 American ChemicalSociety.
Cross-Reactive Chemical Sensor Arrays Chemical Reviews, 2000, Vol. 100, No. 7 2613
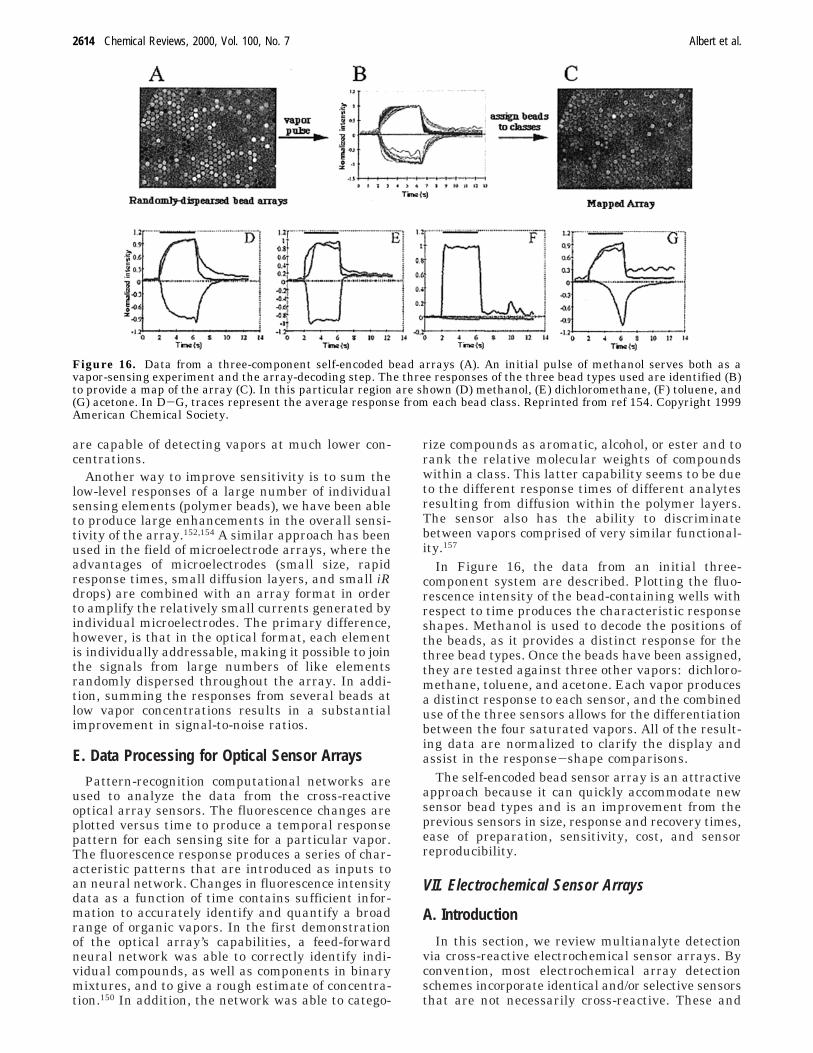
are capable of detecting vapors at much lower con-centrations.
Another way to improve sensitivity is to sum thelow-level responses of a large number of individualsensing elements (polymer beads), we have been ableto produce large enhancements in the overall sensi-tivity of the array.152,154 A similar approach has beenused in the field of microelectrode arrays, where theadvantages of microelectrodes (small size, rapidresponse times, small diffusion layers, and small iRdrops) are combined with an array format in orderto amplify the relatively small currents generated byindividual microelectrodes. The primary difference,however, is that in the optical format, each elementis individually addressable, making it possible to jointhe signals from large numbers of like elementsrandomly dispersed throughout the array. In addi-tion, summing the responses from several beads atlow vapor concentrations results in a substantialimprovement in signal-to-noise ratios.
E. Data Processing for Optical Sensor Arrays
Pattern-recognition computational networks areused to analyze the data from the cross-reactiveoptical array sensors. The fluorescence changes areplotted versus time to produce a temporal responsepattern for each sensing site for a particular vapor.The fluorescence response produces a series of char-acteristic patterns that are introduced as inputs toan neural network. Changes in fluorescence intensitydata as a function of time contains sufficient infor-mation to accurately identify and quantify a broadrange of organic vapors. In the first demonstrationof the optical array’s capabilities, a feed-forwardneural network was able to correctly identify indi-vidual compounds, as well as components in binarymixtures, and to give a rough estimate of concentra-tion.150 In addition, the network was able to catego-
rize compounds as aromatic, alcohol, or ester and torank the relative molecular weights of compoundswithin a class. This latter capability seems to be dueto the different response times of different analytesresulting from diffusion within the polymer layers.The sensor also has the ability to discriminatebetween vapors comprised of very similar functional-ity.157
In Figure 16, the data from an initial three-component system are described. Plotting the fluo-rescence intensity of the bead-containing wells withrespect to time produces the characteristic responseshapes. Methanol is used to decode the positions ofthe beads, as it provides a distinct response for thethree bead types. Once the beads have been assigned,they are tested against three other vapors: dichloro-methane, toluene, and acetone. Each vapor producesa distinct response to each sensor, and the combineduse of the three sensors allows for the differentiationbetween the four saturated vapors. All of the result-ing data are normalized to clarify the display andassist in the response-shape comparisons.
The self-encoded bead sensor array is an attractiveapproach because it can quickly accommodate newsensor bead types and is an improvement from theprevious sensors in size, response and recovery times,ease of preparation, sensitivity, cost, and sensorreproducibility.
VII. Electrochemical Sensor Arrays
A. Introduction
In this section, we review multianalyte detectionvia cross-reactive electrochemical sensor arrays. Byconvention, most electrochemical array detectionschemes incorporate identical and/or selective sensorsthat are not necessarily cross-reactive. These and
Figure 16. Data from a three-component self-encoded bead arrays (A). An initial pulse of methanol serves both as avapor-sensing experiment and the array-decoding step. The three responses of the three bead types used are identified (B)to provide a map of the array (C). In this particular region are shown (D) methanol, (E) dichloromethane, (F) toluene, and(G) acetone. In D-G, traces represent the average response from each bead class. Reprinted from ref 154. Copyright 1999American Chemical Society.
2614 Chemical Reviews, 2000, Vol. 100, No. 7 Albert et al.
other array systems will only be discussed here if thesensor array was specifically designed to be cross-reactive in nature or if the cross-reactive responsesfrom the sensor array are considered in the analy-sis.158-174 Electrochemical arrays designed for thedetermination of one analyte,175-178 multianalytedetection systems such as stripping voltammetry,179-187
detection systems in which electrochemical sensorarrays are employed for chromatographic or electro-phoresis separations,188-200 or biosensor-related sys-tems201-203 will not be discussed. Individual sensorswithin a cross-reactive electrochemical array shouldshow cross-sensitivity and/or cross-selectivity to mul-tiple targets. As is the case for all the different cross-reactive arrays, it is also advantageous if individualsensors are sensitive or selective to varying degreesto target analytes so that different response patternscan be generated.
Over the last two decades, there has been a relaxeddemand for highly selective sensors. More emphasishas been placed on sensor reproducibility, sensorstability, and the computational analysis soft-ware to retain the level of accuracy and/or detec-tion limits for cross-reactive electrochemical sensorarrays.158-163,166,169-174 Glass et al. has calculated thatby incorporating a cross-reactive electrochemicalsensor array in combination with a computationalanalysis program one can increase the amount ofinformation content by at least 25% as compared toa single sensing element.172 Thus, a cross-reactivearray may supply the information necessary topredict target concentrations of multiple compoundsin a known or an unknown matrix. As always, theinformation patterns generated by the sensor arrayare directly linked to the calibration techniques andexperimental setup of the cross-reactive electrochemi-cal array. There are also many variables whichgovern these response patterns, such as sensor mate-rial and size, solution or vapor composition, whetherthe reaction reaches equilibrium, and variation insensor response, diffusion, and fluid dynamics (mix-ing, stirring, flow-injection, heat, etc.). There havebeen recent reviews in dynamic electrochemistry204
and on chemical sensors205 so many of these variableswill not be discussed further, except where necessary.
B. Potentiometric (Equilibrium) Measurements
1. Principles of Operation
By definition, potentiometry refers to the differencein potential between two electrodes of a galvanic cellunder the condition of zero current.206 The indicatorelectrode is chosen so that it is responsive to thesolution’s target analyte and the reference electrodeis invariant. This is an equilibrium measurementprocess because no current passes through the cellwhile the potential is measured. The potential of anelectrochemical cell (Ecell) is
where Eind and Eref are the half-cell potentials for theindicator and reference electrodes, respectively, and
Elj is the potential at the electrode’s liquid-junctioninterface. By employment of the Nernst equation,potentiometric measurements can provide accurateresults for the concentration and activity coefficientsof a target analyte. For example, in a general chemi-cal reaction comprised of two half-cell redox reactions,aA + bB T cC + dD, the Nernst equation would be
where Ecell° is the standard cell potential, R is thegas constant, T is the temperature, n is number ofelectrons involved in the reaction, F is the Faradayconstant, and a is the activity of each chemicalspecies. Many parameters affect the cell overpotentialincluding temperature fluctuations, change of solu-tion, electrode selectivity and sensitivity, and re-sponse to nontarget and interfering species in solu-tion. Complexity in an electrochemical response isalso related to adsorption of specific or nonspecificanalytes on the electrodes and the nature of theelectron transfer. Therefore employment of a “lock-and-key” sensor approach might only be feasible ifthe system is highly controlled. One may choose tocontrol the temperature, employ solvents that mini-mize adsorption, or employ ion-selective electrodes(ISEs) to eliminate some of these variables. Theoreti-cally, ISEs are “lock-and-key” sensors where each ISEis designed for one target ion. The ultimate goal, andbiggest challenge in this field, is to build highlyselective sensors that are not affected by interferents.However, nearly all ISEs developed to date havesome cross-sensitivity (referred to as interferences)and respond in some fashion to other chemicalspecies; herein lies the reason to employ thesesensors in a cross-reactive array.
To discuss the use of ISEs in cross-reactive arrays,it is important to know how they generally operateand their original purpose. More background for thiselectroanalysis field can be found in a recent re-view.207 ISEs are potentiometric sensors containingan ion-selective membrane that coats the electrodeand sets up a potential due to transport of a singleion. The magnitude of this potential change is directlyrelated to the specificity of the membrane for a targetion. A general schematic of an ISE is shown in Figure17.
For an ISE, the potential of the membrane isconsidered and this changes eq 9 to
where Eref,ext - Eref,int is the potential differencebetween the external and internal reference elec-trodes, respectively, and Emem is the potential gener-ated at the membrane. Usually the activity of theinternal reference electrolyte is fixed and a plot ofEcell vs log(activity of analyte)206 should be linear overthe working range of the electrode according to eqs12 and 14,
where z is the charge on the ion and (ai)samp and(ai)internal are the potentials that develop on either side
Ecell ) Eind - Eref + Elj (9)
Ecell ) Ecell° - (RT/nF) ln[(aCc aD
d)/(aAa aB
b)] (10)
Ecell ) Eref,ext - Eref,int + Emem + Elj (11)
Emem ) (RT/zF) ln[(ai)samp/(ai)internal] (12)
Cross-Reactive Chemical Sensor Arrays Chemical Reviews, 2000, Vol. 100, No. 7 2615

of the membrane for the target ion (i). For simplicity,the slope term (S) in eq 12 can be abbreviated
Assuming a fixed internal potential (ai) and pluggingEmem into eq 11 produces the potential of the elec-trochemical cell as
The terms Eref, ext - Eref, int and Elj are constant sothe only variables in the system are the target (i) ionactivity and/or slope variation. These systems canstill suffer from nontarget selectivities, interferents,and species buildup on the membrane. Therefore,ISEs find common application in solutions wherethere are low levels of interfering ions or where theconcentrations are fixed to match those of calibrationsamples unless an ISE’s cross-selectivity is used asan advantage. Many ISEs may be employed in thesame sensor array. If each ISE within the array hasvarying degrees of selectivity/sensitivity for targetanalytes, this cross-reactivity can be an advantageand response patterns for each sensor can then beused to train a system for target determination. Anarray of ISEs may be used for multianalyte detectionschemes as long as some type of computationalanalysis is employed. After modeling of an array ofISEs, the observed potential in the solution of un-known composition can be decoupled into thosecontributions arising from the target analytes andthose arising from the interferents. This can improveprecision when linked to an analysis scheme. Thepush to develop more sophisticated and intelligentsystems involves acquiring the total analytical signalfor accurate determination of the individual compo-nents. However, the acquisition of redundant (andnonuseful) information for such arrays does notbenefit a system’s prediction ability. Therefore, em-ploying a variety of differentially responsive electro-chemical sensors into an array and monitoring eachsensor’s response to a given analyte or analytemixture will generate more useful information fortarget determination.
2. Examples of Potentiometric Arrays
As briefly stated above, ISEs are often uninten-tionally cross-reactive in nature because bindinginteractions between the membrane and nontargetchemical species. In this review, ISE array-types arenot considered cross-reactive unless each electrode’snontarget responses and/or cross-selectivity are ex-amined and/or incorporated into the analysis. Forexample, ISE arrays employing more than one typeof sensor-element may be suited for multianalytedetection208,209 but if sensor cross-selectivity is notconsidered or factored into the analysis these will notbe discussed.
The membrane of the ISE will directly determinethat sensor element’s degree of cross-selectivity.Systems can be designed to be cross-reactive accord-ing to known membrane-analyte interactions.207 Foran ISE array to be considered cross-reactive, it mustincorporate two or more ISE-types, be employed todetermine more than one analyte, and use theelectrochemical responses from many or all speciesin solution. Some groups have employed arrays ofsemiselective or sparingly selective electrodes in theircross-reactive arrays.158-160 Sparingly selective elec-trodes are nonspecific ISEs and have been used forthe specific purpose of generating more cross-reactiv-ity within a sensor array because they respond tomany analytes in varying degrees of selectivity. Ottoand Thomas158 may have been the first to performthese types of experiments in which nonspecific ISEswere employed in combination with a chemometricsprogram to identify concentrations of multiple targetswithin a mixture. They report on the simultaneousdetermination of free metal ions (Ca2+, Mg2+, K+,Na+) at physiological concentration levels. Suchresponse data cause eq 14 to be transformed into amuch more complicated system for each electrode-analyte response and can be thought of as anextended Nernst (Nicholski) equation
These notations are employed in Beebe et al.’s159
work where Eij is the potential of the jth electrode,measured in the ith sample with respect to thereference electrode. Ej° is the intercept potentialwhen the analyte activity aik is 1 M and the inter-ferent levels, ail, for all l interfering ions, are zero;Kjk is the selectivity coefficient of the jth electrodefor kth ion, and Sj is the measured slope of theelectrode in the absence of interferents. In the uniquecase where an ISE is not cross-reactive or there isno cross-selectivity toward nontarget ions, a selectiv-ity coefficient for all lth ions would be zero, es-sentially eliminating the summation factor in eq 15.A more complicated version of this equation wouldbe needed if ions of mixed valences affected themembrane potential, as suggested in eq 12. However,Otto and Thomas158 found that they could use thevalence (z) of the ion (i) regardless of the valences ofthe lth interfering ions. The most difficult problemthat they encountered was the direct identificationof Mg2+ in the presence of Ca2+ because the Mg2+ ISE
Figure 17. Basic schematic of an ion-selective electrode(ISE) used for potentiometric measurements. Upon interac-tion between the ion-selective membrane and the analyte,the potential across the membrane is altered. This potentialchange is dependent on the membrane specificity for atarget ion in solution according to eq 11.
S ) (RT/zF) (13)
Ecell ) Eref,ext - Eref,int + (S) ln[(ai)samp] + Elj (14)
Eij ) Ej° + Sj ln(aik + ∑l
Kjkail) (15)
2616 Chemical Reviews, 2000, Vol. 100, No. 7 Albert et al.
lacked selectivity for magnesium over that of calcium.They overcame this difficulty by employing moreISEs than they had targets, i.e., an overdeterminedsystem, in combination with multiple regressionanalysis based on partial least squares (PLS). In afour component solution which simulated concentra-tion levels in bodily fluids (blood serum or urine), theywere still able to determine Mg2+ in the presence ofCa2+ using the responses from the cross-reactivearray. Incorporating more sensors than they hadtarget analytes, i.e., eight sensors, and incorporatingPLS analysis, the prediction errors were approxi-mately 4.5% (Ca2+), 6.8% (Mg2+), 2.3% (Na+), and1.4% (K+).
Otto and Thomas158 based their measurements onEj° and Kjk and calibrated their sensors with knowl-edge of their slopes, as opposed to the work by Beebeet al.159 who extended this work to see if they couldcalibrate an array of sensors without prior knowledgeof sensor slope. Otto and Thomas158 noted thatmultivariate calibration for the ISE array is hinderedby the need to employ a constant overall ionicstrength of the solution (fixed boundary conditions)while simultaneously varying the concentrations foreach ion-type. However, they also used calibrationsolutions that did not contain interferents that mayhave caused some problems when moving to testsolutions. Any errors associated with the calibrationwould also be incorporated into the test set. Beebeet al.159 avoided these methods by varying the Nerns-tian slopes which led to an advantage in the calibra-tion process where less error was predicted in the testset. They employed five to eight nonspecific ISEs intheir cross-reactive array, and without having anypotassium-selective sensors, they detected K+ (2-10mM) in the presence of much higher Na+ levels (135-155 mM) in the matrix. According to their calibrationmethods, their use of only sparingly selective elec-trodes, and their analysis scheme, they attainedlower prediction errors than Otto and Thomas;158
however, unlike Otto and Thomas, they did notemploy ions of mixed valences. Table 3 shows theresults of Beebe et al.’s study.
This experiment demonstrated the feasibility ofusing a nonspecific sensor array to determine ionconcentrations with reasonable accuracy. Beebe et al.went on to analyze their data to see if each of thefive employed electrodes could be used alone topredict sodium concentration levels when potassiumions were ignored. For the single-sensor system(s),
the prediction errors for nine samples varied between0 and 38%, further emphasizing the benefit of cross-reactive electrochemical arrays and the increase ininformation content for analyte detection. Beebe andKowalski160 then attempted to expand this work bycalibrating their cross-reactive array without a prioriinformation about the functional relations betweenthe responses and the ion concentrations. Unlikeprevious work158,159 they did not base their calibrationmodels on the assumption that the electrodes obey acertain equation. They merely used their array ofnonspecific ISEs to prove their algorithms had theability to determine binary mixtures of Na+ (0.120-0.165 M) and K+ (2.0-8.4 mM) in aqueous solutionwith average prediction errors lower than 5.3%.
Forster et al.162 employed three highly specific ISEsin combination with one sparingly selective electrodein their cross-reactive array for determining sodium,potassium, and calcium ions in tertiary mixtures.They used this overdetermined system to poll resultswhich enhanced the amount of information gainedthrough cross-talk between sensors without introduc-ing significant error from unmodeled interferents. Itshould be noted that although they employed threehighly specific ISEs, the determined selectivity coef-ficients for the sodium, potassium, and sparinglyselective electrodes suggested that these electrodeswere not as selective as the calcium electrode (notedifferent valence) in the presence of interferents. Byincorporation of the sparingly selective electrode withthe 3 selective sensor elements into an array, theirprediction errors for 12 samples were improved from4.5% to 2.8%, relative to the prediction errors for the3 selective-element array alone. The array was ableto determine each ion in a high interference back-ground when the solutions did not contain unmodeledinterferents. Forster and Diamond163 used the samecross-reactive array model and analyte targets incombination with flow injection to improve predictionperformance for mineral water and human plasmasamples. They attributed the results to the kineticfactors (not equilibrium) associated with the flowinjection sample delivery. Their array showed en-hanced sensitivity for the target ions and they wereable to determine these ions, without worrying aboutresponses from unmodeled ion interferents such asMg2+.
In a related model, Diamond and Forster164 em-ployed three specific ISEs (for Na+, K+, Ca2+) with amultiple ionophore electrode. They tailored the fourthelectrode’s selectivity by incorporating an ionophorefor each of the target ions into the membrane. Thisarray system, though more specifically designed,meets the cross-reactive array criteria. The array wasmore responsive to the three target ions relative tothe multiple ionophore electrode as seen in previouswork163 with a sparingly selective electrode. However,even though this array was cross-reactive, the cali-bration and tests were specific for particular definedreaction conditions and could not be implementedinto unknown systems. Finally, Legin et al.165 usedan array of electrodes to detect zinc ions in abackground with three other metals (Cu2+, Pb2+,Cd2+) even though there was no zinc-selective elec-
Table 3. Prediction of Remaining Nine Samplesa
predicted concns (% error)
sample i [Na+], M [K+], mM
2 0.1198 (0.2) 3.73 (2.4)4 0.1198 (0.1) 6.86 (2.0)7 0.1351 (0.1) 3.89 (1.8)9 0.1349 (0.1) 7.15 (2.1)
11 0.1498 (0.1) 2.03 (1.5)14 0.1497 (0.1) 7.00 (0.0)15 0.1486 (0.9) 8.45 (0.6)17 0.1665 (0.9) 3.69 (3.4)19 0.1641 (0.5) 7.03 (0.4)
a Reproduced from ref 159. Copyright 1993 American Chemi-cal Society.
Cross-Reactive Chemical Sensor Arrays Chemical Reviews, 2000, Vol. 100, No. 7 2617

trode employed. The sensors were incorporated intoan array, and the system was trained on complexsolutions of heavy metals (Cu2+, Pb2+, Cd2+, Zn2+, Cl-,F-, and SO4
2-) in concentration ranges typical ofindustrial waste. All the species were identified evenwithout having specific sensors for each of the targetanalytes, i.e., zinc and sulfate.
C. Voltammetric (Nonequilibrium) Measurements
1. Principles of Operation
In contrast to potentiometry, where there is noapplied current, voltammetry is the measurement ofthe current-potential relationship in an electro-chemical cell where equilibrium is not established.There are many voltammetric methods: squarewave, staircase, pulse and differential pulse, cyclic,anodic stripping, and amperometric titrations. Again,we will only deal with those areas that employ cross-reactive sensor arrays. In voltammetric measure-ments, information about a target analyte is gener-ated from the measurement of the current as afunction of the applied potential under conditions,which enhance polarization of the working elec-trode.210 The reference electrode’s potential is con-stant, and the working electrode assumes the valueof the applied potential. Therefore, the workingelectrode is the site where electrolysis occurs and thisgenerates the measured current. The current isquantitatively related to the speed of the electrolyticprocess, which in its simplest form, is a redox half-cell reaction:
Here Mn+ is the electroactive species which is reducedto M(n-1)+ (or the reverse reaction where M(n-1)+ isthe electroactive species oxidized to Mn+). Sensorsbased on detecting the current flow caused by oxidiz-ing or reducing an analyte are highly successfulbecause of their selectivity and high sensitivitycoupled to the wide range of organic and inorganicanalytes that can be detected using this technique.211
If one were to employ an array of working electrodes,each element could generate an independent meas-urement signal. An important feature of many vol-tammetric-type arrays is the movement toward min-iaturization. Arrays of microelectrodes used in vol-tammetry can have either all the electrodes intercon-nected to produce one overall measured current, oreach of the electrodes can have different appliedvoltages and allow individual electrodes to registera current. These arrays can also offer significantimprovements in sensitivity, S/N ratios, and detec-tion limits so combining these advantages into across-reactive array with an incorporated computa-tional analysis program can lead to highly effectiveand intelligent detection systems. One can use thetime response or even use different potentials fordifferent sensors to generate more information thatcan be used for target discrimination. Considerableeffort has been applied to controlling the reactivityof amperometric sensors by modifying the surfaceswith thin films, metal layers, polymers, or biological
materials. Therefore, cross-reactive voltammetric ar-rays can be generated by employing different poten-tials to the individual elements, employing an arrayof different electrode types, modifying the electrodes,or using a combination of these approaches.
2. Examples of Voltammetric Arrays
An array of cross-reactive amperometric sensorswas employed by Stetter et al.166 to detect 22 organicvapors (20-300 ppm) in a portable system. Thissystem consisted of four uncoated electrodes, eachoperating at a different potential and preceded bydifferent filament catalysts to pretreat the incomingvapor flow before presentation to the array. The foursensors with their applied potentials were the fol-lowing: (a) Au, -200 mV; (b) Au, +300 mV; (c) Pt,+200 mV; (d) Pt black, 0 mV. As noted, the sensorswere set at different oxidation and reduction poten-tials and the four modes used to acquire data werethe following: (1) no filament used; (2) platinumfilament at fixed temperature; (3) rhodium filamentat fixed temperature; (4) rhodium filament at asecond fixed temperature. The heated filaments canpartially oxidize some of the vapors as they flow tothe amperometric sensors. In all, 16 separate chan-nels of information were generated for each of thechemical species in the test set. Many of these datachannels contained unique information that wasanalyzed with pattern recognition software.
One goal of Stetter et al.’s work was to detect anddiscriminate the vapors in the test set and minimizethe number of sensors employed. The amperometricsensors used were known to fluctuate by as much as(25% over the course of 1 month so they incorporated(25% random noise into the response patterns to seehow their prediction errors varied. When they re-moved redundant data and incorporated nonlinearmapping to check the original data set in combinationwith two sets containing random errors, only twoanalyte vapor pairs overlapped in the cluster analysis(nitrobenzene/acetone; cyclohexane/acetic acid).
Though more sensors need to be incorporated forbetter discrimination, these results show that byemploying a four-element cross-reactive amperomet-ric array, nearly 22 vapors could be discriminatedand detected at ranges between 20 and 300 ppmusing pattern recognition analysis even when (25%random error was incorporated into the array. In arelated study with the same array model and patternrecognition, Stetter et al.169 classified grain qualityaccording to patterns for “good”, “sour”, or “insect”wheat classes with good accuracy. In another similarapproach, Schweizer-Berberich et al.170 characterizedfish freshness vs time with an eight-element cross-reactive array employing a filament catalyst variedover five temperatures. Forty channels of data weregenerated, and principal component analysis (PCA)and principal component regression (PCR) were usedfor data analysis.
Using the same four-element array model, Stetteret al.167 aimed to use only one sensor’s response fromthe array to perform analysis. In the defined system,it was determined that sufficient information wasgenerated from the one-sensor/one-filament in order
Mn+ + e- T M(n-1)+ (16)
2618 Chemical Reviews, 2000, Vol. 100, No. 7 Albert et al.
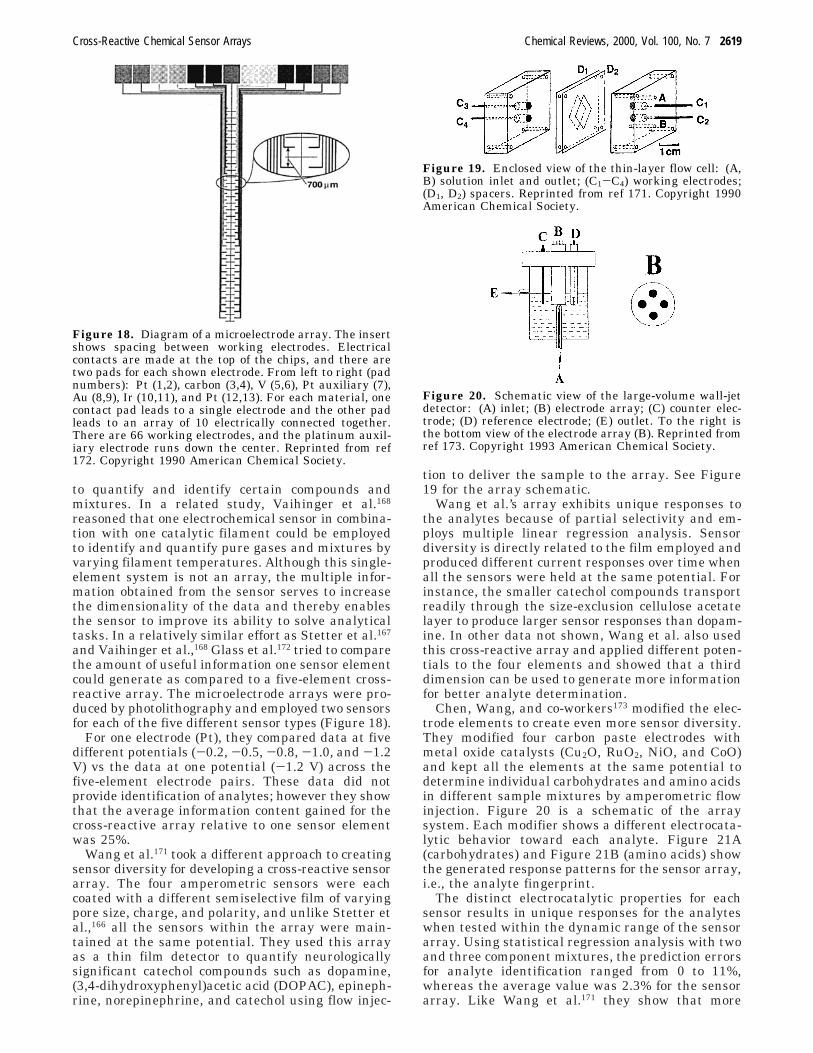
to quantify and identify certain compounds andmixtures. In a related study, Vaihinger et al.168
reasoned that one electrochemical sensor in combina-tion with one catalytic filament could be employedto identify and quantify pure gases and mixtures byvarying filament temperatures. Although this single-element system is not an array, the multiple infor-mation obtained from the sensor serves to increasethe dimensionality of the data and thereby enablesthe sensor to improve its ability to solve analyticaltasks. In a relatively similar effort as Stetter et al.167
and Vaihinger et al.,168 Glass et al.172 tried to comparethe amount of useful information one sensor elementcould generate as compared to a five-element cross-reactive array. The microelectrode arrays were pro-duced by photolithography and employed two sensorsfor each of the five different sensor types (Figure 18).
For one electrode (Pt), they compared data at fivedifferent potentials (-0.2, -0.5, -0.8, -1.0, and -1.2V) vs the data at one potential (-1.2 V) across thefive-element electrode pairs. These data did notprovide identification of analytes; however they showthat the average information content gained for thecross-reactive array relative to one sensor elementwas 25%.
Wang et al.171 took a different approach to creatingsensor diversity for developing a cross-reactive sensorarray. The four amperometric sensors were eachcoated with a different semiselective film of varyingpore size, charge, and polarity, and unlike Stetter etal.,166 all the sensors within the array were main-tained at the same potential. They used this arrayas a thin film detector to quantify neurologicallysignificant catechol compounds such as dopamine,(3,4-dihydroxyphenyl)acetic acid (DOPAC), epineph-rine, norepinephrine, and catechol using flow injec-
tion to deliver the sample to the array. See Figure19 for the array schematic.
Wang et al.’s array exhibits unique responses tothe analytes because of partial selectivity and em-ploys multiple linear regression analysis. Sensordiversity is directly related to the film employed andproduced different current responses over time whenall the sensors were held at the same potential. Forinstance, the smaller catechol compounds transportreadily through the size-exclusion cellulose acetatelayer to produce larger sensor responses than dopam-ine. In other data not shown, Wang et al. also usedthis cross-reactive array and applied different poten-tials to the four elements and showed that a thirddimension can be used to generate more informationfor better analyte determination.
Chen, Wang, and co-workers173 modified the elec-trode elements to create even more sensor diversity.They modified four carbon paste electrodes withmetal oxide catalysts (Cu2O, RuO2, NiO, and CoO)and kept all the elements at the same potential todetermine individual carbohydrates and amino acidsin different sample mixtures by amperometric flowinjection. Figure 20 is a schematic of the arraysystem. Each modifier shows a different electrocata-lytic behavior toward each analyte. Figure 21A(carbohydrates) and Figure 21B (amino acids) showthe generated response patterns for the sensor array,i.e., the analyte fingerprint.
The distinct electrocatalytic properties for eachsensor results in unique responses for the analyteswhen tested within the dynamic range of the sensorarray. Using statistical regression analysis with twoand three component mixtures, the prediction errorsfor analyte identification ranged from 0 to 11%,whereas the average value was 2.3% for the sensorarray. Like Wang et al.171 they show that more
Figure 18. Diagram of a microelectrode array. The insertshows spacing between working electrodes. Electricalcontacts are made at the top of the chips, and there aretwo pads for each shown electrode. From left to right (padnumbers): Pt (1,2), carbon (3,4), V (5,6), Pt auxiliary (7),Au (8,9), Ir (10,11), and Pt (12,13). For each material, onecontact pad leads to a single electrode and the other padleads to an array of 10 electrically connected together.There are 66 working electrodes, and the platinum auxil-iary electrode runs down the center. Reprinted from ref172. Copyright 1990 American Chemical Society.
Figure 19. Enclosed view of the thin-layer flow cell: (A,B) solution inlet and outlet; (C1-C4) working electrodes;(D1, D2) spacers. Reprinted from ref 171. Copyright 1990American Chemical Society.
Figure 20. Schematic view of the large-volume wall-jetdetector: (A) inlet; (B) electrode array; (C) counter elec-trode; (D) reference electrode; (E) outlet. To the right isthe bottom view of the electrode array (B). Reprinted fromref 173. Copyright 1993 American Chemical Society.
Cross-Reactive Chemical Sensor Arrays Chemical Reviews, 2000, Vol. 100, No. 7 2619
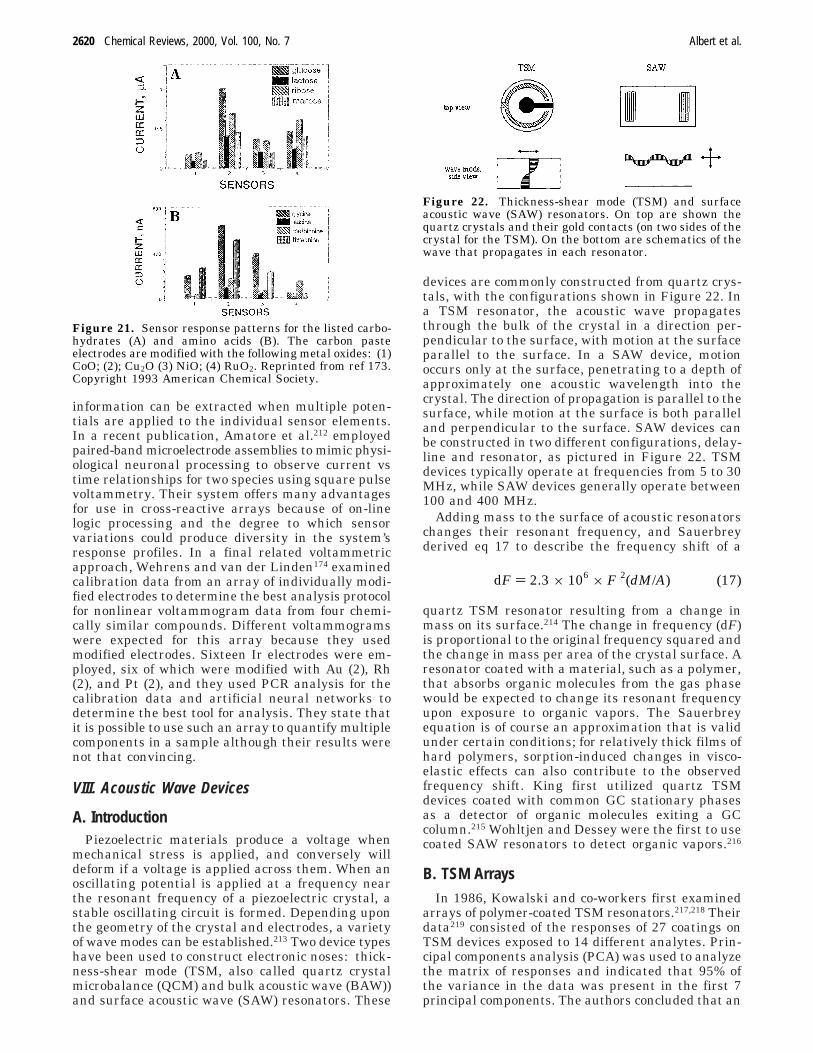
information can be extracted when multiple poten-tials are applied to the individual sensor elements.In a recent publication, Amatore et al.212 employedpaired-band microelectrode assemblies to mimic physi-ological neuronal processing to observe current vstime relationships for two species using square pulsevoltammetry. Their system offers many advantagesfor use in cross-reactive arrays because of on-linelogic processing and the degree to which sensorvariations could produce diversity in the system’sresponse profiles. In a final related voltammetricapproach, Wehrens and van der Linden174 examinedcalibration data from an array of individually modi-fied electrodes to determine the best analysis protocolfor nonlinear voltammogram data from four chemi-cally similar compounds. Different voltammogramswere expected for this array because they usedmodified electrodes. Sixteen Ir electrodes were em-ployed, six of which were modified with Au (2), Rh(2), and Pt (2), and they used PCR analysis for thecalibration data and artificial neural networks todetermine the best tool for analysis. They state thatit is possible to use such an array to quantify multiplecomponents in a sample although their results werenot that convincing.
VIII. Acoustic Wave Devices
A. IntroductionPiezoelectric materials produce a voltage when
mechanical stress is applied, and conversely willdeform if a voltage is applied across them. When anoscillating potential is applied at a frequency nearthe resonant frequency of a piezoelectric crystal, astable oscillating circuit is formed. Depending uponthe geometry of the crystal and electrodes, a varietyof wave modes can be established.213 Two device typeshave been used to construct electronic noses: thick-ness-shear mode (TSM, also called quartz crystalmicrobalance (QCM) and bulk acoustic wave (BAW))and surface acoustic wave (SAW) resonators. These
devices are commonly constructed from quartz crys-tals, with the configurations shown in Figure 22. Ina TSM resonator, the acoustic wave propagatesthrough the bulk of the crystal in a direction per-pendicular to the surface, with motion at the surfaceparallel to the surface. In a SAW device, motionoccurs only at the surface, penetrating to a depth ofapproximately one acoustic wavelength into thecrystal. The direction of propagation is parallel to thesurface, while motion at the surface is both paralleland perpendicular to the surface. SAW devices canbe constructed in two different configurations, delay-line and resonator, as pictured in Figure 22. TSMdevices typically operate at frequencies from 5 to 30MHz, while SAW devices generally operate between100 and 400 MHz.
Adding mass to the surface of acoustic resonatorschanges their resonant frequency, and Sauerbreyderived eq 17 to describe the frequency shift of a
quartz TSM resonator resulting from a change inmass on its surface.214 The change in frequency (dF)is proportional to the original frequency squared andthe change in mass per area of the crystal surface. Aresonator coated with a material, such as a polymer,that absorbs organic molecules from the gas phasewould be expected to change its resonant frequencyupon exposure to organic vapors. The Sauerbreyequation is of course an approximation that is validunder certain conditions; for relatively thick films ofhard polymers, sorption-induced changes in visco-elastic effects can also contribute to the observedfrequency shift. King first utilized quartz TSMdevices coated with common GC stationary phasesas a detector of organic molecules exiting a GCcolumn.215 Wohltjen and Dessey were the first to usecoated SAW resonators to detect organic vapors.216
B. TSM ArraysIn 1986, Kowalski and co-workers first examined
arrays of polymer-coated TSM resonators.217,218 Theirdata219 consisted of the responses of 27 coatings onTSM devices exposed to 14 different analytes. Prin-cipal components analysis (PCA) was used to analyzethe matrix of responses and indicated that 95% ofthe variance in the data was present in the first 7principal components. The authors concluded that an
Figure 21. Sensor response patterns for the listed carbo-hydrates (A) and amino acids (B). The carbon pasteelectrodes are modified with the following metal oxides: (1)CoO; (2); Cu2O (3) NiO; (4) RuO2. Reprinted from ref 173.Copyright 1993 American Chemical Society.
Figure 22. Thickness-shear mode (TSM) and surfaceacoustic wave (SAW) resonators. On top are shown thequartz crystals and their gold contacts (on two sides of thecrystal for the TSM). On the bottom are schematics of thewave that propagates in each resonator.
dF ) 2.3 × 10⁶ × F 2(dM/A) (17)
2620 Chemical Reviews, 2000, Vol. 100, No. 7 Albert et al.
array of seven sensors comprised of those with thegreatest contribution to each of the first seven PCswould represent a near-optimal array.217 The samedata set was analyzed to determine what subset ofsensors could provide the best sensitivity, selectivity,signal-to-noise ratio, and limit of detection. Since theoriginal data consisted of only one response for eachsensor-analyte pair, an estimated random noise wasadded to the data. One seven-sensor array consistedof the most sensitive individual sensors, while asecond array consisted of seven sensors chosen usingPCA as outlined above. A set of equations developedby Lorber220 that describe the sensitivity and selec-tivity of an array of partially selective sensors toparticular analytes was used to compare the twosensor arrays. It was found that while the two arrayshad similar overall selectivities, the PCA-selectedarray was substantially more sensitive to all theanalytes tested. For one sensor, a detection limit canbe defined, commonly at the analyte concentrationat which the signal-to-noise ratio is three. For anarray of sensors, an analogous limit of determination(LOD) can be defined for an analyte in the presenceof other possible interfering components. The LODfor a variety of analytes were generally lower for thePCA-selected array of sensors. A comparison of thedetermined case (seven sensors, seven analytes) andthe overdetermined case (seven sensors, three ana-lytes) shows that in the overdetermined case the LODdecreased by nearly 2 orders of magnitude.
Kowalski and co-workers constructed a nine-sensorarray and determined the concentration of individualanalytes in two- and three-component mixtures.221
The methods of multiple linear regression (MLR)222
and partial least squares (PLS)223 were used. For thetwo-component mixtures, PLS predicted concentra-tions approximately 5 times better than MLR did.The relative prediction error of PLS for two-compo-nent mixtures was 4.6%, while individual sensorshave a 3-6% relative response error. For the three-component case, the average PLS prediction errorwas 10.1%, while that of MLR was 18.6%. Carey andKowalski used a similar six-sensor array to monitorthe solvent vapors exiting an industrial process dryersimulator.224 Principal component regression (PCR)was used to calculate the concentrations of vaporsexiting the chamber, and the values agree with thosethat would be expected.
Gopel and co-workers first investigated arrays ofTSM resonators coated with both polymer and non-polymer materials in 1991.225 A variety of function-alized polysiloxanes on TSM resonators were exposedto a series of organic molecules, and the strengths oftheir various interactions were discussed.226,227 Acorrelation was noted between log K (K is thepolymer-gas partition coefficient) and Tb/T′ (Tb is thesolvent’s boiling point, and T′ is the temperature atwhich the measurements are made). After the boilingpoint correlation was corrected for, the expectedtrends were observed: relatively nonpolar organicmolecules were absorbed strongly by poly(dimethyl-siloxane), polar organic molecules were most stronglyabsorbed by poly(cyanopropylmethylsiloxane), andpolarizable molecules were relatively well absorbed
by polyphenylmethylsiloxane. Cellulose derivativeswere also used as coating materials.228 Both PLS andartificial neural networks (ANN) were tested for theirability to predict concentrations of analytes in mix-tures, and ANN were found to slightly outperformPLS.229,230 Neural networks were also used to dy-namically monitor an analyte stream.231 An array ofTSM devices coated with siloxane polymer, metalcomplex-modified siloxane polymer, or pure metalcomplex was used to sense organic vapors and wasfound to be particularly sensitive to oxygen- andnitrogen-containing molecules.232 A hybrid arraycontaining polymer-coated TSM resonators, tin oxidegas sensors, electrochemical sensors, and metal oxidesemiconductor field effect transistors (MOSFETs)was used to discriminate coffees, olive oils, tobaccos,and whiskeys.51 Chiral GC stationary phases thatconsist of polysiloxanes with chiral side chains werecoated on TSM resonators, and small arrays of thesedevices were used to discriminate enantiomeric odor-ants.233,234 In another study, the coating materialsconsisted of γ-cyclodextrin derivatives dissolved in apolysiloxane matrix.235 Polymer emulsions were usedto create porous coatings on TSM resonators, and theporous polymers were subsequently coated with avariety of lipids.236
In 1989 Nakamoto, Moriizumi, and co-workersused an array of six TSM resonators coated with bothpolymeric and nonpolymeric materials to analyze 11kinds of liquors.237 Neural networks were 73% suc-cessful in categorizing the liquors. In another study,8 coating materials were selected from a library of18, in an attempt to find an optimized array. Thisarray was used to discriminate 10 whiskys.238,239
Flavors and fragrances were also studied.240,241
One group has used polymer and nonpolymer filmsthat were applied via radio frequency sputtering ofthe materials.242,243 Plasma-deposited organic filmshave properties significantly different from the origi-nal polymers because of the loss of atoms andfragments and the presence of dangling bonds in thedeposited film. Conducting polymers have also beenused as TSM resonator coating materials.244-246
There has been a second study on the discrimina-tion of enantiomers.247 Another compared the re-sponses of a TSM resonator-based nose to those ofhuman subjects.248 Other examples of TSM resonator-based noses have also been studied.249-252
C. SAW ArraysThe first application of pattern recognition methods
to data from an array of SAW devices was by Grateand co-workers in 1986.253 A total of 12 differentsensor coatings were exposed to 11 vapors. Principalcomponents analysis was used to display in twodimensions the separation of various analytes. Hi-erarchical clustering categorized both the vapors andthe sensor coatings. Clusterings were rationalizedthrough their solubility parameters, including hy-drogen bonding donor and acceptor ability and di-polarity/polarizability. On the basis of the classifica-tion methods used, four coatings were selected thatcould completely separate two classes of vapors.Mixtures of analytes were also studied.254 An array
Cross-Reactive Chemical Sensor Arrays Chemical Reviews, 2000, Vol. 100, No. 7 2621

of four temperature-controlled SAW devices success-fully detected and classified organophosphorus andorganosulfur vapors.255
A total of 20 polymers on SAW devices wereexposed to 5 organic vapors.256 Three of the sensorswere exposed to ternary mixtures of toluene, acetone,and dichloromethane. Partial least squares regres-sion predicted the vapor concentrations, with errorsof a few percent. In another study, four sensors wereused to analyze ternary mixtures of water, methanol,and automotive fuel.257 The experimental and knownmethanol concentrations agreed quite well. A simpletwo-sensor array was able to monitor H2O and CO2levels in air.258 An array of four polymer-coated SAWdevices was employed to measure small amounts oftetrachloroethylene, trichloroethylene, and methoxy-furane in humid air.259 The samples were meant toimitate exhaled breath containing trace amounts oforganic contaminants; actual breath samples spikedwith one of the analytes were also examined. Limitsof detection were estimated to be 0.7, 0.6, and 4 ppmfor tetrachloroethylene, trichloroethylene, and meth-oxyflurane, respectively. In a follow-up to this work,several adsorbents were tested as desorbable pre-concentrators to increase the response to organicvapors in simulated exhaled breath.260
A combination of plasma-polymerized films, plasma-grafted films, and self-assembled monolayers wasapplied to SAW devices, and they were exposed to avariety of organic vapors.261 The newly developedvisually empirical region-of-influence (VERI) patternrecognition algorithm was used to analyze and cat-egorize the data. The authors found that the bestthree-film array comprised one coating from eachcategory, while the optimal arrays consisted of fiveto seven sensors. The same group has investigatedthe use of dendrimers as sensor coatings.262
The effects of temperature and humidity on arraysof polymer-coated SAW sensors have been stud-ied.263,264 Ultraviolet light-cross-linked polysiloxaneswere found to have better long-term stability thannoncross-linked polysiloxanes.265
Arrays of SAW devices coated with nonpolymericmaterials have also been investigated, includingliquid crystals,266 Langmuir-Blodgett-deposited phos-pholipids and fatty acids,267 self-assembled mono-layers,268 covalently bound organic molecules,269 crownethers,270 and other nonvolatile organic molecules.271
D. Response PredictionThe frequency change of a TSM or SAW device
depends on how much vapor is absorbed by thepolymer film, which in turn is proportional to K, thepolymer-vapor partition coefficient of the analyte.The frequency response of polymer-coated SAWresonators was predicted on the basis of the analyte’sboiling point, solubility parameter, and linear solva-tion energy relationships.272 The expected linearcorrelation was observed between log K and thevapor’s boiling point, although the correlation wasnot as good for polar coatings. A modification of thepredictions on the basis of the solvation parametersin linear solvation energy relationships (LSERs) gavethe best results. Grate, Abraham, and co-workers
have also extensively utilized LSERs in the predic-tion of sensor responses.273-275 Hydrogen bond acidicpolymers have been used specifically to improvedetection and discrimination of basic vapors.276 Othermolecular orbital and molecular mechanics param-eters have been used to predict SAW sensor re-sponses.277
It has been found that, under certain conditions,SAW devices do not act solely as gravimetric sensorsbut also respond to the modulus change in polymerswhen a vapor is sorbed.278 For thin films with lowmodulus, both SAW and TSM devices act only asgravimetric sensors, while, for polymers with initiallyhigh modulus, the SAW devices are also sensitive tothe modulus change, but TSM resonators still actprimarily as gravimetric sensors.279,280 Under certainconditions, TSM resonators are also sensitive tomodulus changes.280
Once a method for estimating responses is estab-lished, it is possible to choose the best array ofsensors for detecting specific analytes or mixtures ofanalytes. Monte Carlo simulations of sensor re-sponses allowed such a selection.281
Only one paper has been published that comparesthe actual analytical performance of polymer-coatedTSM and SAW resonators.282 TSM devices withfrequencies of 10 and 30 MHz and SAW resonatorswith frequencies of 80 and 433 MHz were investi-gated. The influences of temperature and film thick-ness were studied. For each device, the thickestcoating that could be applied without quenching theoscillation was applied, since thicker coatings willprovide larger responses. The higher the frequencyof the resonator, the less polymer could be applied.The 30 MHz TSM device had the best signal-to-noiseratio (S/N) and limits of detection (LOD) for the twopolymers and two analytes that were tested.
The LOD (where S/N ) 3) for n-octane for the 30MHz TSM device and the 80 MHz SAW device coatedwith poly(dimethylsiloxane) was determined to be 2ppm.282 The other coating, poly(ether urethane), hadLODs of 3-15 ppm. A comparable LOD of 0.6 ppmwas found for n-octane on the carbon black-polymercomposite nose (for the best detector in the array).137
IX. Conclusions and Future ProspectsCross-reactive chemical sensor arrays are a prom-
ising alternative to conventional chemical sensors.By relying on patterns of response over a multisensorarray, such systems have reduced the need to obtainthe exquisite specificity of conventional sensors. The“electronic nose” or “artificial nose” moniker that hasbeen given to such systems stems from the use ofpattern recognition applied to the complex signalsderived from the arrays. While not entirely mis-nomers, these terms do not do justice to the remark-able process of biological olfaction. Mammalian olfac-tory systems are continuously replacing dead cellswhile maintaining fidelity of the intricate neuralwiring necessary to conserve responses. Signal am-plification is a signature of such systems with mul-tiples at each stage in the signal transduction proc-ess. The geometric complexity of turbinates in thenasal epithelium, the complex sniffing patterns when
2622 Chemical Reviews, 2000, Vol. 100, No. 7 Albert et al.

animals are exposed to odors, and the convergenceof similar receptor cell axons onto the olfactory bulbas well as the complex “wiring” patterns of theprocessing anatomy all contribute to the high sensi-tivity and discriminating power of the mammalianolfactory system. The systems described in thisreview are only rudimentary mimics of the biologicalsystem. By continuing to incorporate the operatingprinciples of biological systems into the artificial ones,chemists may eventually be able to approach someof the capabilities of the olfactory system with thesecross-reactive arrays.
As discussed in the review, there are many impor-tant and potentially exciting areas where existingarrays are beginning to have an impact. In particular,the food processing industry is relying increasinglyon electronic nose systems to make determinationsabout quality and freshness. In addition, theseindustries are evaluating packaging material beforeadding products to make sure that such materialsdo not impart an off taste or odor to the food. Onecan imagine that as such systems get smaller, theywill begin to show up as consumer items for evaluat-ing meat, fish and dairy freshness in the kitchen aswell as for monitoring potential home and workplacehazards. Such systems, by nature of their broad-bandedness, could be used for chemical and/or bio-logical weapons detection; they could be anticipatoryin the sense that they would not necessarily be keyedto particular agents but could look for responseslikely to be correlated with toxicity or virulence. Oneday, such systems may be used to perform medicaldiagnostics using a simple breath test. More far-fetched, but within the realm of possibility, perhapsthey may be used to recognize individuals by theirsignature odors. After all, dogs are able to recognizetheir owners by odor cues.
For purposes of discussion, this review deliberatelyseparated the different sensor transduction mecha-nisms. Each of these different mechanisms offerspotentially unique information about the samplesbeing tested. The basis for the discriminating powerof these arrays is the information content containedin the responses. In the ultimate manifestation of thetechnology, it is likely that hybrid systems will be ofvalue because they offer the most information-richsignals.
Finally, before such systems can have a majorimpact, they must be manufacturable in large quan-tities. Because such systems rely on training com-putational networks on sensor response patterns,there is a need to maintain robust responses overextended time periods, otherwise retraining will berequired as sensors change. Similarly, sensors mustbe able to be manufactured reproducibly and in largequantities so that training is transferable from onearray to the next. The oldest of all chemical sensorsis the pH electrode, yet today’s pH electrodes are along way from meeting such a requirement-they mustbe calibrated regularly (ideally before each use).Thus, there are practical impediments that must beovercome before these devices are used as routineanalytical systems.
X. AcknowledgmentsWe acknowledge the Army Research Office, NASA,
and DARPA for support of sensor array work atCaltech and acknowledge DARPA, the Office of NavalResearch, the National Institutes of Health, and theDepartment of Energy for support at Tufts that madepreparation of this review, along with some of theexamples discussed herein, possible.
XI. References(1) Elghanian, R.; Storhoff, J. J.; Mucic, R. C.; Letsinger, R. L.;
Mirkin, C. A. Science 1997, 277, 1078.(2) Gopel, W. Mikrochim. Acta 1997, 125, 179.(3) Gopel, W. Microelectron. Eng. 1996, 32, 75.(4) Zhu, S. S.; Carroll, P. J.; Swager, T. M. J. Am. Chem. Soc. 1996,
118, 8713.(5) Rickert, J.; Weiss, T.; Gopel, W. Sens. Actuators B 1996, 31, 45.(6) Schierbaum, K. D. Sens. Actuators B 1994, 18, 71.(7) Buck, L. B.; Axel, R. Cell 1991, 65, 175.(8) Malnic, B.; Hirono, J.; Sato, T.; Buck, L. B. Cell 1999, 96, 713.(9) Axel, R. Sci. Am. 1995, 273, 154.
(10) Breer, H.; Wanner, I.; Strotmann, J. Behav. Genet. 1996, 26, 209.(11) Lancet, D.; Ben-Arie, N. Curr. Biol. 1993, 3, 668.(12) Ostrowski, J. C.; Kjelsberg, M. A.; Caron, M. G.; Lefkowitz, R.
J. Annu. Rev. Pharmacol. Toxicol. 1992, 32, 167.(13) Bartlett, P. N.; Gardner, J. W. NATO Advanced Research
Workshop on Sensors and Sensory Systems for an ElectronicNose, Reykjavik, Iceland, 1991; Plenum Press: New York, 1991;p 31.
(14) Shimizu, Y.; Egashira, M. MRS Bull. 1999, 24(6), 18.(15) Hartman, J. Proc. Am. Soc. Hortic. Sci. 1954, 64, 335.(16) Persaud, K. C.; Dodd, G. H. Nature 1982, 299, 352.(17) Gardner, J. W.; Bartlett, P. N. Electronic Noses Principles and
Applications; Oxford University Press: Oxford, U.K., 1999.(18) Gutierrez, J.; Getino, J.; Horrillo, M. C.; Ares, L.; Robla, J. I.;
Garcia, C.; Sayago, I. Thin Solid Films 1998, 317, 429.(19) Mishra, V. N.; Agarwal, R. P. Microelectron. J. 1998, 29, 861.(20) Di Natale, C.; Davide, F. A. M.; Faglia, G.; Nelli, P. Sens.
Actuators B 1995, B23, 187.(21) Heilig, A.; Barsan, N.; Weimar, U.; Schweizer-Berberich, M.;
Gardner, J. W.; Gopel, W. Sens. Actuators B 1997, 43, 45.(22) Corcoran, P.; Lowery, P.; Anglesea, J. Sens. Actuators B 1998,
48, 448.(23) Doleman, B. J.; Lonergan, M. C.; Severin, E. J.; Vaid, T. P.;
Lewis, N. S. Anal. Chem. 1998, 70, 4177.(24) Gardner, J. W.; Pike, A.; Rooij, N. F.; Koudelka-Hep, M.; Clerc,
P. A.; Hierlemann, A.; Gopel, W. Sens. Actuators B 1995, 26-27, 135.
(25) Gotz, A.; Gracia, I.; Cane, C.; Lora-Tamayo, E.; Horillo, M. C.;Getino, J.; Garcia, C.; Gutierrez, J. Sens. Actuators B 1997, 44,483.
(26) Gardner, J. W.; Shurmer, H. V.; Corcoran, P. Sens. Actuators B1991, B4, 117.
(27) Hong, H.-K.; Shin, H. W.; Park, H. S.; Yun, D. H.; Kwon, C. H.;Lee, K.; Kim, S.-T.; Moriizumi, T. Sens. Actuators B 1996, 33,68.
(28) Wang, X. D.; Yee, S.; Carey, P. Sens. Actuators B 1993, 13, 458.(29) Bednarczyk, D.; DeWeerth, S. P. Sens. Actuators B 1995, 27,
271.(30) Wilson, D. M.; DeWeerth, S. P. Sens. Actuators B 1995, 28, 123.(31) Wilson, D. M.; Deweerth, S. P. Sens. Mater. 1998, 10, 169.(32) Chaturvedi, A.; Mishra, V. N.; Dwivedi, R.; Srivastava, S. K.
Microelectron. J. 1999, 30, 259.(33) Srivastava, R.; Dwivedi, R.; Srivastava, S. K. Sens. Actuators B
1998, 50, 175.(34) Di Natale, C.; D’Amico, A.; Davide, F. A. M.; Faglia, G.; Nelli,
P.; Sberveglieri, G. Sens. Actuators B 1994, 20, 217.(35) Getino, J.; Gutierrez, J.; Ares, L.; Robla, J. I.; Horrillo, M. C.;
Sayago, I.; Agapito, J. A. Sens. Actuators B 1996, 33, 128.(36) Abe, H.; Yoshimura, T.; Kanaya, S.; Takahashi, Y.; Miyashita,
Y.; Sasaki, S. Anal. Chim. Acta 1987, 194, 1.(37) Getino, J.; Horrillo, M. C.; Gutierrez, J.; Ares, L.; Robla, J. I.;
Garcia, C.; Sayago, I. Sens. Actuators B 1997, 43, 200.(38) Haswell, S. J.; Walmsley, A. D. Anal. Proc. 1991, 28, 115.(39) Llobet, E.; Brezmes, J.; Vilanova, X.; Sueiras, J. E.; Correig, X.
Sens. Actuators B 1997, 41, 13.(40) Shurmer, H. V.; Gardner, J. W.; Corcoran, P. Sens. Actuators B
1990, 1, 256.(41) Walmsley, A. D.; Haswell, S. J.; Metcalfe, E. Anal. Chim. Acta
1991, 250, 257.(42) Walmsley, A. D.; Haswell, S. J.; Metcalfe, E. Anal. Chim. Acta
1991, 242, 31.
Cross-Reactive Chemical Sensor Arrays Chemical Reviews, 2000, Vol. 100, No. 7 2623
(43) Alexander, P. W.; Di Benedetto, L. T.; Hibbert, D. B. Field Anal.Chem. Technol. 1998, 2, 145.
(44) Di Natale, C.; Davide, F. A. M.; D′Amico, A.; Sberveglieri, G.;Nelli, P.; Faglia, G.; Perego, C. Sens. Actuators B 1995, 25, 801.
(45) Di Natale, C.; Davide, F. A. M.; D′Amico, A.; Nelli, P.; Groppelli,S.; Sberveglieri, G. Sens. Actuators B 1996, 33, 83.
(46) Gardner, J. W. Sens. Actuators B 1991, 4, 109.(47) Gardner, J. W.; Shurmer, H. V.; Tan, T. T. Sens. Actuators B
1992, 6, 71.(48) Llobet, E.; Hines, E. L.; Gardner, J. W.; Franco, S. Meas. Sci.
Technol. 1999, 10, 538.(49) Olafsson, R.; Martinsdottir, E.; Olafsdottir, G.; Sigfusson, P. I.;
Gardner, J. W. NATO Advanced Research Workshop on Sensorsand Sensory Systems for an Electronic Nose, Reykjavik, Iceland,1991; Plenum Press: New York, 1991; p 257.
(50) Winquist, F.; Hornsten, E.; Sundgren, H.; Lundstrom, I. Meas.Sci. Technol. 1993, 4, 1493.
(51) Ulmer, H.; Mitrovics, J.; Noetzel, G.; Weimar, U.; Gopel, W. Sens.Actuators B 1997, 43, 24.
(52) Winquist, F.; Sundgren, H.; Lundstrom, I. Spec. Publ.sR. Soc.Chem. 1998, 167, 170.
(53) Borjesson, T.; Eklov, T.; Jonsson, A.; Sundgren, H.; Schurer, J.Cereal Chem. 1996, 73, 457.
(54) Faglia, G.; Bicelli, F.; Sberveglieri, G.; Maffezzoni, P.; Gubian,P. Sens. Actuators B 1997, 44, 517.
(55) Gardner, J. W.; Hines, E. L.; Tang, H. C. Sens. Actuators B 1992,9, 9.
(56) Nayak, M. S.; Dwivedi, R.; Srivastava, S. K. Sens. Actuators B1993, 12, 103.
(57) Moore, S. W.; Gardner, J. W.; Hines, E. L.; Gopel, W.; Weimar,U. Sens. Actuators B 1993, 16, 344.
(58) Marco, S.; Ortega, A.; Pardo, A.; Samitier, J. IEEE Trans.Instrum. Meas. 1998, 47, 316.
(59) Davide, F. A. M.; Di Natale, C.; D’Amico, A. Sens. Actuators B1994, 18-19, 244.
(60) Vlachos, D. S.; Avaritsiotis, J. N. Sens. Actuators B 1996, 33,77.
(61) Lundstrom, I.; Shivaraman, M. S.; Svenson, C. S.; Lundkvist,L. Appl. Phys. Lett. 1975, 26, 55.
(62) Bergveld, P. Sens. Actuators 1985, 8, 109.(63) Vlasov, Y. G. Mikrochim. Acta 1991, 2, 363.(64) Lundstrom, I.; Hedborg, E.; Spetz, A.; Sundren, H.; Winquist,
F. NATO Advanced Research Workshop on Sensors and SensorySystems for an Electronic Nose, Reykjavik, Iceland, 1991; PlenumPress: New York, 1991; p 303.
(65) Winquist, F.; Sundgren, H.; Hedborg, E.; Spetz, A.; Lundstrom,I. Sens. Actuators B 1992, B6, 157.
(66) Muller, R.; Lange, E. Sens. Actuators 1986, 9, 39.(67) Sundgren, H.; Lundstrom, I.; Winquist, F.; Lukkari, I.; Carlsson,
R.; Wold, S. Sens. Actuators B 1990, 2, 115.(68) Gall, M.; Muller, R. Sens. Actuators 1989, 17, 583.(69) Sundgren, H.; Winquist, F.; Lukkari, I.; Lundstrom, I. Meas. Sci.
Technol. 1991, 2, 464.(70) Sundgren, H.; Lundstrom, I.; Vollmer, H. Sens. Actuators B 1992,
9, 127.(71) Sommer, V.; Tobias, P.; Kohl, D.; Sundgren, H.; Lundstrom, I.
Sens. Actuators B 1995, 28, 217.(72) Lundstrom, I.; Erlandsson, R.; Frykman, U.; Hedborg, E.; Spetz,
A.; Sundgren, H.; Welin, S.; Winquist, F. Nature 1991, 352, 47.(73) Lundstrom, I.; Sundgren, H.; Winquist, F. J. Appl. Phys. 1993,
74, 6953.(74) Eklov, T.; Sundgren, H.; Lundstrom, I. Sens. Actuators B 1997,
45, 71.(75) Eklov, T.; Lundstrom, I. Anal. Chem. 1999, 71, 3544.(76) www.alpha-mos.com.(77) www.eev.com.(78) Holmberg, M.; Winquist, F.; Lundstrom, I.; Gardner, J. W.;
Hines, E. L. Sens. Actuators B 1995, 27, 246.(79) Mandenius, C.-F.; Hagman, A.; Dunas, F.; Sundgren, H.; Lund-
strom, I. Biosens. Bioelectron. 1998, 13, 193.(80) Mandenius, C.-F.; Liden, H.; Ekloev, T.; Taherzadeh, M. J.;
Liden, G. Biotechnol. Prog. 1999, 15, 617.(81) Reddinger, J. L.; Reynolds, J. R. Adv. Polym. Sci. 1999, 145, 57.(82) Handbook of Conducting Polymers; 2nd ed.; Skotheim, T. A.,
Elsenbaumer, R. L., Reynolds, J. R., Eds.; Marcel Dekker: NewYork, 1998; Vol. 1.
(83) Roncali, J. Chem. Rev. 1992, 92, 711.(84) Epstein, A. J.; Macdiarmid, A. G. Makromol. Chem. Macromol.
Symp. 1991, 51, 217.(85) Jahnke, S. A.; Niemann, J.; Kautek, W.; Bischoff, R.; Pfeiffer,
C.; Kossmehl, G. Int. J. Environ. Anal. Chem. 1997, 67, 223.(86) Svetlicic, V.; Schmidt, A. J.; Miller, L. L. Chem. Mater. 1998,
10, 3305.(87) www.aromascan.com.(88) www.bloodhound.co.uk.(89) www.zelana.com.(90) Swann, M. J.; Glidle, A.; Cui, L.; Barker, J. R.; Cooper, J. M. J.
Chem. Soc., Chem. Commun. 1998, 2753.
(91) Partridge, A. C.; Harris, P. D.; Andrews, M. K. Analyst 1996,121, 1349.
(92) Gardner, J. W.; Bartlett, P. N. Sens. Actuators A 1995, 51, 57.(93) Gardner, J. W.; Pike, A.; de Rooij, N. F.; Koudelka-Hep, M.; Clerc,
P. A.; Hierlemann, A.; Gopel, W. Sens. Actuators B 1995, 26,135.
(94) Hodgins, D. M. Sens. Actuators B 1995, 27, 255.(95) Slater, J. M.; Paynter, J.; Watt, E. J. Analyst 1993, 118, 379.(96) Slater, J. M.; Watt, E. J.; Freeman, N. J.; May, I. P.; Weir, D. J.
Analyst 1992, 117, 1265.(97) Bartlett, P. N.; Gardner, J. W.; Whitaker, R. G. Sens. Actuators
A 1990, 23, 911.(98) De Wit, M.; Vanneste, E.; Geise, H. J.; Nagels, L. J. Sens.
Actuators B 1998, 50, 164.(99) Baldacci, S.; Matsuno, T.; Toko, K.; Stella, R.; De Rossi, D. Sens.
Mater. 1998, 10, 185.(100) Kawai, T.; Kojima, S.; Tanaka, F.; Yoshino, K. Jpn. J. Appl.
Phys., Part 1 1998, 37, 6237.(101) Pearce, T. C.; Gardner, J. W.; Friel, S.; Bartlett, P. N.; Blair, N.
Analyst 1993, 118, 371.(102) Hatfield, J. V.; Neaves, P.; Hicks, P. J.; Persaud, K. C.; Travers,
P. J. Sens. Actuators B 1994, 18, 221.(103) Serra, G.; Stella, R.; De Rossi, D. Mater. Sci. Eng., C 1998, 5,
259.(104) Hodgins, D. M.; Simmonds, D. J. J. Autom. Chem. 1995, 17, 179.(105) Bailey, T. P.; Hammond, R. V.; Persaud, K. C. J. Am. Soc. Brew.
Chem. 1995, 53, 39.(106) Gardner, J. W.; Pearce, T. C.; Friel, S.; Bartlett, P. N.; Blair, N.
Sens. Actuators B 1994, 18, 240.(107) Pearce, T. C.; Gardner, J. W. Analyst 1998, 123, 2047.(108) Cantalejo, M. J. Z. Lebensmittel Untersuchung Forschung A
1999, 208, 373.(109) Schaller, E.; Bosset, J. O.; Escher, F. Chimia 1999, 53, 98.(110) Annor-Frempong, I. E.; Nute, G. R.; Wood, J. D.; Whittington,
F. W.; West, A. Meat Sci. 1998, 50, 139.(111) Gibson, T. D.; Prosser, O. C.; Hulbert, J. N.; Marshall, R. W.;
Corcoran, P.; Lowery, P.; Ruck-Keene, E. A.; Heron, S. Sens.Actuators B 1997, 44, 413.
(112) Arnold, J. W.; Senter, S. D. J. Sci. Food Agric. 1998, 78, 343-348.
(113) Stuetz, R. M.; Fenner, R. A.; Engin, G. Water Res. 1999, 33, 453.(114) Stuetz, R. M.; Fenner, R. A.; Engin, G. Water Res. 1999, 33, 442.(115) Stuetz, R. M.; White, M.; Fenner, R. A. J. Water Serv. Res.
Technol.-Aqua 1998, 47, 223.(116) Stuetz, R. M.; Engin, G.; Fenner, R. A. Water Sci. Technol. 1998,
38, 331.(117) Persaud, K. C.; Khaffaf, S. M.; Hobbs, P. J.; Sneath, R. W. Chem.
Senses 1996, 21, 495.(118) Byun, H. G.; Persaud, K. C.; Khaffaf, S. M.; Hobbs, P. J.;
Misselbrook, T. H. Comput. Electron. Agric. 1997, 17, 233.(119) Misselbrook, T. H.; Hobbs, P. J.; Persaud, K. C. J. Agr. Eng.
Res. 1997, 66, 213.(120) Masila, M.; Sargent, A.; Sadik, O. A. Electroanalysis 1998, 10,
312.(121) Lane, A. J. P.; Wathes, D. C. J. Dairy Sci. 1998, 81, 2145.(122) Schiffman, S. S.; Kermani, B. G.; Nagle, H. T. Chem. Senses
1997, 22, 119.(123) Chandiok, S.; Crawley, B. A.; Oppenheim, B. A.; Chadwick, P.
R.; Higgins, S.; Persaud, K. C. J. Clin. Path. 1997, 50, 790.(124) Persaud, K. C.; Pisanelli, A. M.; Szyszko, S.; Reichl, M.; Horner,
G.; Rakow, W.; Keding, H. J.; Wessels, H. Sens. Actuators B1999, 55, 118.
(125) Amrani, M. E. H.; Ibrahim, M. S.; Persaud, K. C. Mater. Sci.Eng. 1993, C1, 17.
(126) Amrani, M. E. H.; Persaud, K. C.; Payne, P. A. Meas. Sci.Technol. 1995, 6, 1500.
(127) Amrani, M. E. H.; Payne, P. A.; Persaud, K. C. Sens. ActuatorsB 1996, 33, 137.
(128) Amrani, M. E. H.; Dowdeswell, R. M.; Payne, P. A.; Persaud, K.C. Sens. Actuators B 1997, 44, 512.
(129) Amrani, M. E. H.; Payne, P. A. IEE Proc. Sci. Meas. Technol.1999, 146, 95.
(130) Lonergan, M. C.; Severin, E. J.; Doleman, B. J.; Beaber, S. A.;Grubb, R. H.; Lewis, N. S. Chem. Mater. 1996, 8, 2298.
(131) Freund, M. S.; Lewis, N. S. Proc. Natl. Acad. Sci. U.S.A. 1995,92, 2652.
(132) Brosseau, C.; Boulic, F.; Queffelec, P.; Bourbigot, C.; LeMest,Y.; Loaec, J.; Beroual, A. J. Appl. Phys. 1997, 81, 882.
(133) Kirkpatrick, S. R. Rev. Mod. Phys. 1973, 45, 574.(134) Doleman, B. J.; Sanner, R. D.; Severin, E. J.; Grubbs, R. H.;
Lewis, N. S. Anal. Chem. 1998, 70, 2560.(135) Severin, E. J.; Sanner, R. D.; Doleman, B. J.; Lewis, N. S. Anal.
Chem. 1998, 70, 1440.(136) Doleman, B. J.; Severin, E. J.; Lewis, N. S. Proc. Natl. Acad.
Sci. U.S.A. 1998, 95, 5442.(137) Doleman, B. J. Ph.D., California Institute of Technology, 1999.(138) Seitz, W. R. Crit. Rev. Anal. Chem. 1988, 19, 135.(139) Dickinson, T. A.; White, J.; Kauer, J. S.; Walt, D. R. Trends
Biotechnol. 1998, 16, 250.
2624 Chemical Reviews, 2000, Vol. 100, No. 7 Albert et al.
(140) Steemers, F. J.; Walt, D. R. Mikrochim. Acta 1999, 131, 99.(141) Barnard, S. M.; Walt, D. R. Nature 1991, 353, 338.(142) Orellana, G.; Gomez-Carneros, A.; de Dios, C.; Garcia-Martinez,
A.; Moreno-Bondi, M. Anal. Chem. 1995, 67, 2231.(143) Posch, H. E.; Wolfbeis, O. S.; Pusterhoffer, J. Talanta 1988, 35,
89.(144) Ronot, C.; Archenault, M.; Gagnaire, H.; Goure, J. P.; Jaffrezic-
Renault, N.; Pichery, T. Sens. Actuators B 1993, 11, 375.(145) Ronot, C.; Gagnaire, H.; Goure, J. P.; Jaffrezic-Renault, N.;
Pichery, T. Sens. Actuators A 1994, 42, 529.(146) Gauglitz, G.; Kraus, G. Fresenius’ J. Anal. Chem. 1993, 346, 572.(147) Dickert, F. L.; Keppler, M. Adv. Mater. 1995, 7, 1020.(148) Walt, D. R.; Dickinson, T.; White, J.; Kauer, J.; Johnson, S.;
Engelhardt, H.; Sutter, J. M.; Jurs, P. C. Biosens. Bioelectron.1998, 13, 695.
(149) Pantano, P.; Walt, D. R. Anal. Chem. 1995, 67, 481A.(150) Dickinson, T. A.; White, J.; Kauer, J. S.; Walt, D. R. Nature 1996,
382, 697.(151) White, J.; Kauer, J. S.; Dickinson, T. A.; Walt, D. R. Anal. Chem.
1996, 68, 2191.(152) Albert, K. J.; Walt, D. R. Anal. Chem. 2000, 72, 1947.(153) Micheal, K. L.; Taylor, L. C.; Schultz, S. L.; Walt, D. R. Anal.
Chem. 1998, 70, 1242.(154) Dickinson, T. A.; Michael, K. L.; Kauer, J. S.; Walt, D. R. Anal.
Chem. 1999, 71, 2192.(155) Lavigne, J. J.; Savoy, S.; Clevenger, M. B.; Ritchie, J. E.;
McDoniel, B.; Yoo, S.-J.; Anslyn, E. V.; McDevitt, J. T.; Shear,J. B.; Neikirk, D. J. Am. Chem. Soc. 1998, 120, 6429.
(156) Healey, B. G.; Walt, D. R. Anal. Chem. 1997, 69, 2213.(157) Sutter, J. M.; Jurs, P. C. Anal. Chem. 1997, 69, 856.(158) Otto, M.; Thomas, J. D. R. Anal. Chem. 1985, 57, 2647.(159) Beebe, K. R.; Uerz, D.; Sandifer, J.; Kowalski, B. R. Anal. Chem.
1988, 60, 66.(160) Beebe, K. R.; Kowalski, B. R. Anal. Chem. 1988, 60, 2272.(161) Bos, M.; Bos, A.; van der Linden, W. E. Anal. Chim. Acta 1990,
233, 31.(162) Forster, R. J.; Regan, F.; Diamond, D. Anal. Chem. 1991, 63,
876.(163) Forster, R. J.; Diamond, D. Anal. Chem. 1992, 64, 1721.(164) Diamond, D.; Forster, R. J. Anal. Chim. Acta 1993, 276, 75.(165) Legin, A. V.; Vlasov, Y. G.; Rudnitskaya, A. M.; Bychkov, E. A.
Sens. Actuators B 1996, 34, 456.(166) Stetter, J. R.; Jurs, P. C.; Rose, S. L. Anal. Chem. 1986, 58, 860.(167) Stetter, J. R.; Findlay, M. W.; Maclay, G. J.; Zhang, J.; Vaihinger,
S.; Gopel, W. Sens. Actuators B 1990, 1, 43.(168) Vaihinger, S.; Gopel, W.; Stetter, J. R. Sens. Actuators B 1991,
4, 337.(169) Stetter, J. R.; Findlay, M. W. J.; Schroeder, K. M.; Yue, C.;
Penrose, W. R. Anal. Chim. Acta 1993, 284, 1.(170) Schweizer-Berberich, P.-M.; Vaihinger, S.; Gopel, W. Sens.
Actuators B 1994, 18, 282-290.(171) Wang, J.; Rayson, G. D.; Lu, Z.; Wu, H. Anal. Chem. 1990, 62,
1924.(172) Glass, R. S.; Perone, S. P.; Ciarlo, D. R. Anal. Chem. 1990, 62,
1914.(173) Chen, Q.; Wang, J.; Rayson, G.; Tian, B.; Lin, Y. Anal. Chem.
1993, 65, 251.(174) Wehrens, R.; van der Linden, W. E. Anal. Chim. Acta 1996, 334,
93.(175) Yang, Z.; Sasaki, S.; Karube, I.; Suzuki, H. Anal. Chim. Acta
1997, 357, 41.(176) Ross, B.; Cammann, K.; Mokwa, W.; Rospert, M. Sens. Actuators
B 1992, 7, 758.(177) Atkinson, J. K.; Shahi, S. S.; Varney, M.; Hill, N. Sens. Actuators
B 1991, 4, 175.(178) Augelli, M.; Nascimento, V. B.; Pedrotti, J. J.; Gutz, I. G. R.;
Angnes, L. Analyst 1997, 122, 843.(179) Kounaves, S. P.; Deng, W.; Hallock, P. R.; Kovacs, G. T. A.;
Storment, C. W. Anal. Chem. 1994, 66, 418.(180) Kovacs, G. T. A.; Storment, C. W.; Kounaves, S. P. Sens.
Actuators B 1995, 23, 41.(181) Reay, R.; Flannery, A. F.; Storment, C. W.; Kounaves, S. P.;
Kovacs, G. T. A. Sens. Actuators B 1996, 34, 450.(182) Uhlig, A.; Schnakenberg, U.; Hintsche, R. Electroanalysis 1997,
9, 125.(183) Paeschke, M.; Dietrich, F.; Uhlig, A.; Hintsche, R. Electroanalysis
1996, 8, 891.(184) Silva, P. R. M.; El Khakani, M. A.; Chaker, M.; Champagne, G.
Y.; Chevalet, J.; Gastonguay, L.; Lacasse, R.; Ladouceur, M.Anal. Chim. Acta 1999, 385, 249.
(185) Feeney, R.; Herdan, J.; Nolan, M. A.; Tan, S. H.; Tarasov, V.;Kounaves, S. P. Electroanalysis 1998, 10, 1.
(186) Belmont, C.; Tercier, M.-L.; Buffle, J.; Fiaccabrino, G. C.;Koudelka-Hep, M. Anal. Chim. Acta 1996, 329, 203.
(187) Herdan, J.; Feeney, R.; Kounaves, S. P.; Flannery, A. F.;Storment, C. W.; Kovacs, G. T. A.; Darling, R. B. Environ. Sci.Technol. 1998, 32, 131.
(188) Matson, W. R.; Langlais, P.; Volicer, L.; Gamache, P. H.; Bird,E.; Mark, K. A. Clin. Chem. 1984, 30, 1477.
(189) Matson, W. R.; Gamache, P. G.; Beal, M. F.; Bird, E. D. LifeSci. 1987, 41, 905.
(190) Niwa, O.; Horiuchi, T.; Morita, M.; Huang, T.; Kissinger, P. T.Anal. Chim. Acta 1996, 318, 167.
(191) Liu, J.; Zhou, W.; You, T.; Li, F.; Wang, E.; Dong, S. Anal. Chem.1996, 68, 3350.
(192) Niwa, O.; Morita, M. Anal. Chem. 1996, 68, 355.(193) Jin, W. R.; Weng, Q.; Wu, J. Anal. Chim. Acta 1997, 342, 67.(194) Iwasaki, Y.; Morita, M. Curr. Sep. 1995, 14, 2.(195) Gavin, P. F.; Ewing, A. G. J. Am. Chem. Soc. 1996, 118, 8932.(196) Gavin, P. F.; Ewing, A. G. Anal. Chem. 1997, 69, 3838.(197) Chao, M. H.; Huang, H. J. Anal. Chem. 1997, 69, 463.(198) Svendsen, C. N. Analyst 1993, 118, 123.(199) You, T.; Wu, M.; Wang, E. Anal. Lett. 1997, 30, 1025.(200) Slater, J. M.; Watt, E. J. Analyst 1994, 119, 2303.(201) Skladal, P.; Kalab, T. Anal. Chim. Acta 1995, 316, 73.(202) Wollenberger, U.; Paeschke, M.; Hintsche, R. Analyst 1994, 119,
1245.(203) Wang, J.; Chen, Q. Anal. Chem. 1994, 66, 1007.(204) Anderson, J. L.; Coury, L. A., Jr.; Leddy, J. Anal. Chem. 1999,
70, 519R.(205) Janata, J.; Josowicz, M.; Vanysek, P.; DeVaney, D. M. Anal.
Chem. 1998, 70, 179R.(206) Strobel, H. A.; Heineman, W. R. Chemical Instrumentation: A
Systematic Approach; John Wiley & Sons (Wiley-Interscience):New York, 1989.
(207) Bakker, E.; Buhlmann, P.; Pretsch, E. Chem. Rev. 1997, 97, 3083.(208) Cosofret, V. V.; Erdosy, M.; Johnson, T. A.; Buck, R. P.; Ash, R.
B.; Neuman, M. R. Anal. Chem. 1995, 67, 1647.(209) Lauks, I. R. Acc. Chem. Res. 1998, 31, 317.(210) Skoog, D. A.; Leary, J. J. Principles of Instrumental Analysis;
4th ed.; ed.; Saunders College Publishers: New York, 1992.(211) Forster, R. J.; Diamond, D. Anal. Commun. 1996, 33, 1H.(212) Amatore, C.; Thouin, L.; Warkocz, J.-S. Chem. Eur. J. 1999, 5,
456.(213) Grate, J. W.; Martin, S. J.; White, R. M. Anal. Chem. 1993, 65,
940A.(214) Sauerbrey, G. Z. Physik. 1959, 155, 206.(215) King, W. H. Anal. Chem. 1964, 39, 1735.(216) Wohltjen, H.; Dessey, R. Anal. Chem. 1979, 51, 1458.(217) Carey, W. P.; Beebe, K. R.; Kowalski, B. R.; Illman, D. L.;
Hirschfeld, T. Anal. Chem. 1986, 58, 149.(218) Carey, W. P.; Kowalski, B. R. Anal. Chem. 1986, 58, 3077-3084.(219) Hirschfeld, T.; Olness, D. Sorption Detector System for Chemical
Agents Detection and Recoginition; U.S. Army Chemical Re-search and Development Center:, 1984.
(220) Lorber, A. Anal. Chem. 1986, 58, 1167.(221) Carey, W. P.; Beebe, K. R.; Kowalski, B. R. Anal. Chem. 1987,
59, 1529.(222) Draper, N. R.; Smith, H. Applied Regression Analysis, 3rd ed.;
Wiley: New York, 1998.(223) Geladi, P.; Kowalski, B. R. Anal. Chim. Acta 1986, 185, 1.(224) Carey, W. P.; Kowalski, B. R. Anal. Chem. 1988, 60, 541.(225) Lucklum, R.; Henning, B.; Hauptmann, P.; Schierbaum, K. D.;
Vaihinger, S.; Gopel, W. Sens. Actuators A 1991, 25-27, 705.(226) Schierbaum, K. D.; Hierlmann, A.; Gopel, W. Sens. Actuators B
1994, 18-19, 448.(227) Zhou, R.; Weimar, U.; Schierbaum, K. D.; Geckeler, K. E.; Gopel,
W. Sens. Actuators B 1995, 26-27, 121.(228) Zhou, R.; Hierlemann, A.; Schierbaum, K. D.; Geckeler, K. E.;
Gopel, W. Sens. Actuators B 1995, 24-25, 443.(229) Hierlemann, A.; Weimar, U.; Kraus, G.; Gauglitz, G.; Gopel, W.
Sensors Mater. 1995, 7, 179.(230) Hierlemann, A.; Weimar, U.; Kraus, G.; Schweizer-Berberich,
M.; Gopel, W. Sens. Actuators B 1995, 26-27, 126.(231) Schweizer-Berberich, M.; Goppert, J.; Hierlemann, A.; Mitrovics,
J.; Weimar, U.; Rosenstiel, W.; Gopel, W. Sens. Actuators B 1995,26-27, 232.
(232) Hierlemann, A.; Bodenhofer, K.; Fluck, M.; Schurig, V.; Gopel,W. Anal. Chim. Acta 1997, 346, 327.
(233) Bodenhofer, K.; Hierlemann, A.; Seeman, J.; Gauglitz, G.;Koppenhoefer, B.; Gopel, W. Nature 1997, 387, 577.
(234) Bodenhofer, K.; Hierlemann, A.; Seeman, J.; Gauglitz, G.;Christian, B.; Koppenhoefer, B.; Gopel, W. Anal. Chem. 1997,69, 3058.
(235) Bodenhofer, K.; Hierlemann, A.; Juza, M.; Schurig, V.; Gopel,W. Anal. Chem. 1997, 69, 4017.
(236) Yano, K.; Bornscheuer, U. T.; Schmid, R. D.; Yoshitake, H.; Ji,H.-S.; Ikebukuro, K.; Masuda, Y.; Karube, I. Biosens. Bioelectron.1998, 13, 397.
(237) Ema, K.; Yokoyama, M.; Nakamoto, T.; Moriizumi, T. Sens.Actuators 1989, 18, 291.
(238) Nakamoto, T.; Fukunishi, K.; Moriizumi, T. Sens. Actuators B1990, 1, 473.
(239) Nakamoto, T.; Fukuda, A.; Moriizumi, T. Sens. Actuators B 1991,3, 221.
(240) Nakamoto, T.; Fukuda, A.; Moriizumi, T. Sens. Actuators B 1993,10, 85.
Cross-Reactive Chemical Sensor Arrays Chemical Reviews, 2000, Vol. 100, No. 7 2625
(241) Ide, J.; Nakamoto, T.; Moriizumi, T. Sens. Actuators B 1993, 13-14, 351.
(242) Nakamura, M.; Sugimoto, I.; Kuwano, H. J. Intell. Mater. Syst.Struct. 1994, 5, 315.
(243) Sugimoto, I.; Nakamura, M.; Kuwano, H. Sens. Actuators B 1996,37, 163.
(244) Slater, J. M.; Watt, E. J. Analyst 1991, 116, 1125.(245) Slater, J. M.; Watt, E. J.; Freeman, N. J.; May, I. P.; Weir, D. J.
Analyst 1992, 117, 1265.(246) Deng, Z.; Stone, D. C.; Thompson, M. Analyst 1996, 121, 671.(247) May, I. P.; Byfield, M. P.; Lindstrom, M.; Wunsche, L. F.
Chirality 1997, 9, 225.(248) Yokoyama, K.; Ebisawa, F. Anal. Chem. 1993, 65, 673.(249) Cao, Z.; Xu, D.; Jiang, J.-H.; Wang, J.-H.; Lin, H.-G.; Xu, C.-J.;
Xhang, X.-B.; Yu, R.-Q. Anal. Chim. Acta 1996, 335, 117.(250) Barko, G.; Hlavay, J. Talanta 1997, 44, 2237.(251) Zhang, S.; Li, S. F. Y. Analyst 1996, 121, 1721.(252) Schmautz, A. Sens. Actuators B 1992, 6, 38.(253) Ballantine, D. S.; Rose, S. L.; Grate, J. W.; Wohltjen, H. Anal.
Chem. 1986, 58, 3058.(254) Rose-Pehrsson, S.; Grate, J.; Ballantine, D. S.; Jurs, P. C. Anal.
Chem. 1988, 60, 2801.(255) Grate, J. W.; Rose-Pehrsson, S. L.; Venezky, D. L.; Klusty, M.;
Wohltjen, H. Anal. Chem. 1993, 65, 1868.(256) Amati, D.; Arn, D.; Blom, N.; Ehrat, M.; Saunois, J.; Widmer,
H. M. Sens. Actuators B 1992, 7, 587.(257) Reichert, J.; Coerdt, W.; Ache, H. J. Sens. Actuators B 1993, 13-
14, 293.(258) Hoyt, A. E.; Ricco, A. J.; Bartholomew, J. W.; Osbourn, G. C.
Anal. Chem. 1998, 70, 2137.(259) Groves, W. A.; Zellers, E. T. Am. Ind. Hyg. Assoc. J. 1996, 57,
1103.(260) Groves, W. A.; Zellers, E. T.; Frye, G. C. Anal. Chim. Acta 1998,
371, 131.(261) Ricco, A. J.; Crooks, R. M.; Osbourn, G. C. Acc. Chem. Res. 1998,
31, 289.(262) Crooks, R. M.; Ricco, A. J. Acc. Chem. Res. 1998, 31, 219.
(263) Liron, Z.; Greenblatt, J.; Frishman, G.; Gratziani, N.; Biran, A.Sens. Actuators B 1993, 12, 115.
(264) Zellers, E. T.; Han, M. Anal. Chem. 1996, 68, 2409.(265) Barie, N.; Rapp, M.; Ache, H. J. Sens. Actuators B 1998, 46, 97.(266) Patrash, S. J.; Zellers, E. T. Anal. Chim. Acta 1994, 288, 167.(267) Chang, S.-M.; Tamiya, E.; Karube, I.; Sato, M.; Masuda, Y. Sens.
Actuators B 1991, 5, 53.(268) Thomas, R. C.; Yang, H. C.; DiRubio, C. R.; Ricco, A. J.; Crooks,
R. M. Langmuir 1996, 12, 2239.(269) Moore, L. W.; Springer, K. N.; Shi, J.-X.; Yang, X.; Swanson, B.
I.; Li, D. Adv. Mater. 1995, 7, 729.(270) Lu, C.-J.; Shih, J.-S. Anal. Chim. Acta 1995, 306, 129.(271) Katritzky, A. R.; Savage, G. P.; Pilarska, M. Talanta 1991, 38,
201.(272) Patrash, S. J.; Zellers, E. T. Anal. Chem. 1993, 65, 2055.(273) Grate, J. W.; Patrash, S. J.; Abraham, M. H. Anal. Chem. 1995,
67, 2162.(274) Grate, J. W.; Abraham, M. H.; McGill, R. A. Handbook of
Biosensors and Electronic Noses; Kress-Rogers, E., Ed.; CRCPress: New York, 1997.
(275) McGill, R. A.; Abraham, M. H.; Grate, J. W. Chemtech 1994,24, 27.
(276) Grate, J. W.; Patrash, S. J.; Kaganove, S. N. Anal. Chem. 1999,71, 1033.
(277) Slater, J. M.; Paynter, J. Analyst 1994, 119, 191.(278) Grate, J. W.; Klusty, M.; McGill, R. A.; Abraham, M. H.; Whiting,
G.; Andonian-Haftvan, J. Anal. Chem. 1992, 64, 610.(279) Grate, J. W.; Kaganove, S. N.; Bhethanabotla, V. R. Faraday
Discuss. 1997, 107, 259.(280) Grate, J. W.; Kaganove, S. N.; Bhethanabotla, V. R. Anal. Chem.
1998, 70, 199.(281) Zellers, E. T.; Batterman, S. A.; Han, M.; Patrash, S. J. Anal.
Chem. 1995, 67, 1092.(282) Bodenhofer, K.; Hierlemann, A.; Noetzel, G.; Weimar, U.; Gopel,
W. Anal. Chem. 1996, 68, 2210.
CR980102W
2626 Chemical Reviews, 2000, Vol. 100, No. 7 Albert et al.