CROSS-NATIONAL LOGO EVALUATION ANALYSIS LOGO EVALUATION ANALYSIS: AN INDIVIDUAL LEVEL APPROACH by...
41
1 CROSS-NATIONAL LOGO EVALUATION ANALYSIS: AN INDIVIDUAL LEVEL APPROACH by Ralf van der Lans Joseph A. Cote Catherine A. Cole Siew Meng Leong Ale Smidts Pamela W. Henderson Christian Bluemelhuber Paul A. Bottomley John R Doyle Alexander Fedorikhin M. Janakiraman B. Ramaseshan Bernd Schmitt 7-25-2008 Ralf van der Lans is Assistant Professor of Marketing, Rotterdam School of Management, Erasmus University, Rotterdam. Joseph A. Cote is Professor of Marketing, Washington State University. Catherine A. Cole is Professor of Marketing at the Henry B. Tippie College of Business at The University of Iowa. Siew Meng Leong is Professor of Marketing, NUS Business School, National University of Singapore. Ale Smidts is Professor of Marketing Research, Rotterdam School of Management, Erasmus University, Rotterdam. Pam Henderson is owner of New Edge Inc. a marketing consulting firm. Christian Bluemelhuber is Professor of Marketing at the Technical University of Munich. Paul A. Bottomley and John R. Doyle are Distinguished Senior Research Fellow and Professor of Marketing respectively at the Cardiff Business School, Cardiff University, UK. UK. Alexander Fedorikhin is Associate Professor of Marketing at Kelley School of Business, Indiana University, Indianapolis. M. Janakiraman is Associate Professor of Marketing, Indian Institute of Management at Lucknow. B. Ramaseshan is Professor of Marketing and Head, School of Marketing at Curtin University of Technology, Perth, Australia. Bernd H. Schmitt is the Robert F. Calkins Professor of International Business and Director of the Center on Global Brand Leadership at Columbia Business School. The authors would like to thank Berk Ataman for valuable suggestions and the National University of Singapore for project funding. Please send correspondence regarding this manuscript to Joseph A Cote, Department of Marketing, Washington State University, 14204 NE Salmon Creek Avenue, Vancouver, WA 98686, 360-546-9753, [email protected] .
Transcript of CROSS-NATIONAL LOGO EVALUATION ANALYSIS LOGO EVALUATION ANALYSIS: AN INDIVIDUAL LEVEL APPROACH by...

1
CROSS-NATIONAL LOGO EVALUATION ANALYSIS:
AN INDIVIDUAL LEVEL APPROACH
by
Ralf van der Lans
Joseph A. Cote
Catherine A. Cole
Siew Meng Leong
Ale Smidts
Pamela W. Henderson
Christian Bluemelhuber
Paul A. Bottomley
John R Doyle
Alexander Fedorikhin
M. Janakiraman
B. Ramaseshan
Bernd Schmitt
7-25-2008
Ralf van der Lans is Assistant Professor of Marketing, Rotterdam School of Management,
Erasmus University, Rotterdam. Joseph A. Cote is Professor of Marketing, Washington State
University. Catherine A. Cole is Professor of Marketing at the Henry B. Tippie College of
Business at The University of Iowa. Siew Meng Leong is Professor of Marketing, NUS Business
School, National University of Singapore. Ale Smidts is Professor of Marketing Research,
Rotterdam School of Management, Erasmus University, Rotterdam. Pam Henderson is owner of
New Edge Inc. a marketing consulting firm. Christian Bluemelhuber is Professor of Marketing at
the Technical University of Munich. Paul A. Bottomley and John R. Doyle are Distinguished
Senior Research Fellow and Professor of Marketing respectively at the Cardiff Business School,
Cardiff University, UK. UK. Alexander Fedorikhin is Associate Professor of Marketing at
Kelley School of Business, Indiana University, Indianapolis. M. Janakiraman is Associate
Professor of Marketing, Indian Institute of Management at Lucknow. B. Ramaseshan is
Professor of Marketing and Head, School of Marketing at Curtin University of Technology,
Perth, Australia. Bernd H. Schmitt is the Robert F. Calkins Professor of International Business
and Director of the Center on Global Brand Leadership at Columbia Business School.
The authors would like to thank Berk Ataman for valuable suggestions and the National
University of Singapore for project funding.
Please send correspondence regarding this manuscript to Joseph A Cote, Department of
Marketing, Washington State University, 14204 NE Salmon Creek Avenue, Vancouver, WA
98686, 360-546-9753, [email protected].

2
CROSS-NATIONAL LOGO EVALUATION ANALYSIS:
AN INDIVIDUAL LEVEL APPROACH
MS # 7209.2
Abstract
The universality of design perception and response is tested using logo data collected from ten
countries: Argentina, Australia, China, Germany, Great Britain, India, the Netherlands, Russia,
Singapore, and the United States. A finite-mixture structural-equation model is developed in a
Bayesian framework that identifies latent clusters of logos while accounting for heterogeneity in
evaluations. The concomitant variable approach allows cluster probabilities to be country
specific. Rather than a priori defined clusters, our procedure provides a posteriori cross-national
logo clusters based on consumer response similarity. To compare the a posteriori cross-national
logo clusters, our approach is integrated with Steenkamp and Baumgartner‟s (1998)
measurement invariance methodology. Our model reduces the ten countries to three cross-
national clusters that respond differently to logo design dimensions: the West, Asia, and Russia.
The dimensions underlying design are found to be similar across countries, suggesting that
elaborate, natural, and harmony are universal design dimensions. Responses (affect, shared
meaning, subjective familiarity, and false and true recognition) to logo design dimensions
(elaborate, natural and harmony) and elements (repetition, proportion and parallel) are also
relatively consistent, although we find minor differences across clusters. Our results suggest that
managers can implement a global logo strategy – but can optimize logos for specific countries if
desired.
Keywords: design, logos, international marketing, standardization, adaptation, structural
equation models, Gibbs sampling, concomitant variable, Bayesian, mixture models

3
1. Introduction
Design is a language which communicates to consumers and others independently of verbal
information. Hence, it is critical that marketing managers and scholars understand its impact on
viewers. In general, visual information is processed differently from, faster than, and
independent of verbal information (Edell and Staelin, 1983). In addition, visual information can
trigger affect prior to cognitive processing (Lutz and Lutz, 1977).
Most marketing research has examined how individual design elements such as color,
symmetry, proportion, and angularity affect consumers‟ reactions (e.g., Pittard et al., 2007).
While such research is useful, it is like studying alphabets ─ critical to understand, but offering
limited insight into word or sentence meaning. Henderson and Cote (1998), in an early attempt to
understand broader design characteristics, uncovered three basic design dimensions: elaborate,
natural, and harmony. Elaborate refers to a design‟s richness and its ability to use simple lines to
capture the essence of something; natural designs depict commonly experienced objects; and
harmony refers to how congruently the patterns and parts of a design are arranged. Extending our
analogy, these design dimensions act as words instead of letters. Preliminary evidence indicates
that these design dimensions are important for understanding reactions to a variety of marketing
stimuli such as typeface (Henderson et al., 2004) and wine bottle design (Orth and Malkewitz,
2008).
While the evidence suggests that elaborate, natural, and harmony are “universal words”
useful for understanding visual marketing stimuli, we have limited evidence about whether these
design dimensions exist across cultures. We also do not know if people from different cultures
respond in the same way to these design dimensions. Evolutionary psychology suggests that
human response to visual stimuli is genetically programmed and relatively immune from cultural

4
influence (Adams, 2003). For example, we have an innate capability to determine what stimulus
features provide information across several domains including evaluations of landscapes (Orians
and Heerwagen, 1992), facial expressions of emotion (Ekman, 1998), and physical attractiveness
(Jones, 1996). However, some research on reactions to individual design elements find cultural
differences (e.g., Perfetti et al., 2005, Zhang et al., 2006), while others such as Pittard (2007)
report similarities across cultures.
Given the conflicting findings in the literature, this study examines whether the design
dimensions uncovered by Henderson and her colleagues underlie reactions to logos in ten
different countries: Argentina, Australia, China, Germany, Great Britain, India, Netherlands,
Russia, Singapore, and the United States. Using consumer and designer ratings of 195 stimuli,
we apply a Bayesian finite-mixture structural-equation model employing an MCMC algorithm to
uncover any latent differences in cultural perceptions of and responses to designs. This will
provide the most comprehensive and rigorous test to date of such cultural variations regarding
design dimensions (as opposed to individual design elements1). Specifically, we build upon
Henderson and Cote (1998) to examine the following research questions:
1. Do the design dimensions of elaborate, natural, and harmony exist cross-nationally?
2. Are consumers‟ responses to these design dimensions stable cross-nationally?
Beyond studying the theoretical questions of design dimension universality and consumer
response stability, our paper also makes a methodological contribution. Research in experimental
aesthetics typically analyzes data at the stimulus level by averaging individual judgments for
each stimulus (e.g., Henderson and Cote, 1998). However, such an approach does not consider
heterogeneity in individual responses, which will mask information contained in individual
response variation. This may bias correlations between judgments about different stimuli
1 A design element is a single characteristic while a design dimension is a combination of elements.

5
(DeShon, 1998). Thus, we extend finite-mixture structural-equation models (DeSarbo et al.,
2006) to simultaneously analyze responses at the stimuli level while accounting for individual
judgment heterogeneity through an additional hierarchical layer. Our model also uses a
concomitant variable specification (ter Hofstede et al., 1999) to allow the probabilities of stimuli
belonging to specific latent clusters to vary across countries. We then use the country-specific
cluster probabilities to interpret the latent clusters. Last, we assess measurement invariance
(Steenkamp and Baumgartner, 1998) across clusters rather than across countries. This offers two
advantages. First, the number of cross-national clusters is usually smaller than the number of
countries if many countries are studied – so fewer computations are required and invariance
testing is more tractable (invariance tests grow exponentially with the number of countries).
Second, Steenkamp and Baumgartner‟s framework usually selects countries a priori, while our
approach is not restricted to country.2 A priori allocations may not be realistic, because
“consumers in different countries often have more in common with one another than with other
consumers in the same country” (ter Hofstede, Steenkamp and Wedel, 1999).
We use logos as a context to examine the research questions. As a key component of
corporate visual identity, managers employ logos to create positive emotions, convey meaning,
or enhance recognition about the company and brand. However, managers have expressed
uncertainty about how to manage corporate visual identity systems globally (e.g. see, Alashban
et al., 2002). The literature suggests that logos are most often used in an unaltered form when
going abroad (Kapferer, 1992). Does using unaltered logos in new markets accomplish their
communication goals, or would it be necessary to modify logos for individual countries?
Depending on our findings, managers can either feel secure using standardized logos and other
2 The constrained finite-mixture does not require that all stimuli within a country be part of the same cluster. Any
cluster may contain only a portion of stimuli from a given country.

6
visual material; or, if cross-cultural differences exist, we can provide guidelines for adapting
logos to specific countries or regions.
3. Conceptual Framework
Consistent with Henderson and Cote (1998) our framework is specified at the logo level, and
proposes that consumers perceive logo designs along three objective design elements and three
design dimensions (see Figure 1). The objective design elements include: repetition (number of
times identical shapes are repeated), proportion (the ratio of a logo‟s width to its height), and
parallel (number of parallel lines). As discussed earlier, the design dimensions are elaborate,
natural, and harmony. The design dimensions consist of 8 design elements (complex, active,
depth, representative, organic, round, symmetric, and balance) measured subjectively by
designers (see Appendix A). While these six characteristics do not capture all aspects of design,
they appear to represent a fundamental core for logo design.
We use positive affect, shared meaning, subjective familiarity, and true and false recognition
to assess responses to logo designs. Positive affect is important because feelings can transfer to
the product or company, especially in low-involvement decision making where affective
reactions can guide choice. Prior work suggests that increasing the harmony, elaborate, and
natural dimensions in designs increases positive affect primarily because these design changes
facilitate perception (Anand and Sternthal, 1991, Martindale et al., 1988) and stimulate arousal
(Raymond et al., 2003). Natural designs may also be more pleasing, because they are more
prototypical (Seifert, 1992).
Shared meaning exists when there is a consensus among respondents regarding the first
meaning or association that comes to mind when they see a logo (Ellis et al., 1974). Logos with
high shared meaning are valuable because they are perceived, interpreted, and remembered better

7
than stimuli with varied meaning (Rodewald and Bosma, 1972). Natural, harmony, and to a
lesser extent elaborate, may increase shared meaning because universally experienced objects are
more easily interpreted and recognized than abstract objects (Seifert, 1992, Shinar et al., 2003).
Figure 1
Conceptual Framework of Logo Design Evaluation
Complex
Active
Depth
Representative
Organic
Round
Symmetry
Balance
Elements
Logo Design Characteristics Logo Design Responses
Elaborate
Natural
Harmony
Repetition
Proportion
Parallel
Subjective
familiarity
Shared meaning
True
recognition
False
recognition
Affect
Dimensions
Subjective
Objective
Note: Logo design dimensions (consisting of subjective elements) and objective elements are on the left,
while consumer responses to logos are depicted on the right.
Previous studies have not examined the relationship between logo design and subjective
familiarity (feeling of having seen a logo before, regardless of prior exposure). Subjective
familiarity can increase positive affect (Zajonc, 1968), and even enhance brand choice
(Henderson and Cote, 1998). Since shared meaning and subjective familiarity are closely related,
the rationale behind the relationships between the design characteristics and subjective
familiarity are similar to those for shared meaning.

8
Logo recognition means consumers remember seeing the logo before. Because consumers
recognize pictures more quickly than words, a company can communicate quickly by using a
logo in the brand name (Edell and Staelin, 1983). We distinguish between two types of
recognition: true recognition is the correct assertion that one has seen the logo before; and false
recognition is the incorrect assertion that one has seen the logo before. False recognition is not
necessarily a bad outcome as companies may deliberately create new logos that seem familiar.
According to Gestalt, motivational, and cognitive theories, consumers are likely to exhibit true
recognition for stimuli that are easy to encode and command attention. Natural logos, which are
easy to encode, should increase true recognition and decrease false recognition. However, other
design dimensions should have little effect on either type of recognition.
This conceptual framework does not propose any cross-cultural differences. Rather, we
expect that the same underlying design structure, and relationships between design
characteristics and consumer responses, exist independent of where the consumer lives. In our
analysis, we start with the framework in Figure 1 and use a latent class methodology to test
whether different logo clusters exist across cultures.
3. Method
3.1 Overview
To test if perception of and response to design is invariant across cultures, we collected data
from consumers and designers in ten countries: Argentina, Australia, China, Germany, Great
Britain, India, the Netherlands, Russia, Singapore, and the United States. These countries, on five
continents, represent an array of geographic, economic, political, language, and cultural
backgrounds (see Table 1), thus rigorous test perceptions of and responses to logo designs. By
comparison, recent international marketing research has generally involved two

9
Table 1
Characteristics of the Countries Studied
Nation/
Characteristic Argentina Australia China Germany
Great
Britain India
The
Netherlands Russia Singapore U.S.
Geography
South
America Oceania
East
Asia
Western
Europe
Western
Europe
South
Asia
Western
Europe
Eastern
Europe/Asia
East
Asia
North
America
Economics:1
Gross National
Income/capita
$5528 $37,924 $2,055 $34.955 $39,207 $784 $40,535 $6,877 $30,159 $43,562
Government2 Republic
Common-
wealth Socialist
Federal
Republic
Constitutional
Monarchy
Federal
Republic
Constitutional
Monarchy Federalist Republic
Federal
Republic
Culture:3
Power distance
Uncertainty
Avoidance
Individualism/
Collectivism
Masculinity/
Femininity
49
86
46
56
36
51
90
61
80
30
20
66
35
65
67
66
35
35
89
66
77
40
48
56
38
53
80
14
93
95
39
36
74
8
20
48
40
46
91
62
Language/
Writing
System4
Spanish/
Alphabetic
26+3
English/
Alphabetic
26
Mandarin/
Logographic
47,035
German/
Alphabetic
26+4
English/
Alphabetic
26
English
& Hindi/
Alphabetic
& Abugida
64
Dutch &
Frisian/
Alphabetic
26+1
Cyrillic/
Alphabetic
33
English &
Mandarin/
Alphabetic
&
Logographic
English/
Alphabetic
26
Footnotes:
1. 2006 UN data (http://unstats.un.org/unsd/demographic/products/socind/inc-eco.htm - accessed 7-24-2008).
2. Source: CIA (2004), The World Factbook.
3. Source: Hofstede (1983) Higher scores reflect greater power distance, uncertainty avoidance, individualism, and masculinity respectively. Statistics for China
and Russia were not in the original IBM data set, but collected later and reported in (Hofstede, 2001, Exhibit A5.3, p. 502).
4. The first value is the number of basic symbols in the writing system. The second is the number of diacritics and ligatures.
10
(e.g., Gurhan-Canli and Maheswaran, 2000) or three countries (e.g., Erdem et al., 2004), or a
limited region (Baumgartner and Steenkamp, 2001, ter Hofstede, Steenkamp and Wedel, 1999).
The stimuli, which comprised the 195 unfamiliar logos used by Henderson and Cote (1998),
were originally obtained from a book of foreign logos (Kuwayama, 1973) and from yellow pages
advertisements. To minimize the effects of past exposure and to prevent confounding of
symbolic with verbal processing, the logos contained no verbal material. Standard back
translation methods were used on all questionnaires. A bilingual native speaker translated the
questionnaires written in English into each country‟s language. A different bilingual native
speaker translated the questionnaires back into English. The 11 design elements used in this
research are the same as those in Henderson and Cote (1998). Appendix A defines these design
elements and contains examples of logos scoring high and low on them.
3.2 Ratings of Logo Design Elements
Consistent with experimental aesthetics research, data was collected on a large number of stimuli
and a large number of variables, across multiple samples. Two or three professional logo
designers in each country evaluated the extent to which each logo possessed the design elements
of active, balance, depth, organic, representative, round, and symmetric. The designers had
formal training and extensive experience with commercial clients and logo design. Before rating
the logos, the evaluators received a short description of each characteristic. Consistent with
Henderson and Cote (1998), five groups of about 40 undergraduates in each country evaluated
the design element of complex for a different subset of 39 logos.3 Finally, data from Henderson
and Cote (1998) provided the three objectively measured logo design elements of parallel,
proportion, and repetition.
3 This furnishes evaluations for 5 X 39 or 195 logos in total.

11
In summary, the 11 design elements were each measured with a single indicator. Eight of the
design elements (active, balance, depth, organic, representative, round, symmetric, and complex)
are country-specific and are measured by different raters (ether designers or students) in each
country. Repetition, proportion, and parallel are identical across countries.
3.3 Reponses to Logo Design
Affect and Subjective Familiarity. To minimize fatigue, each respondent rated only 39 logos on
the five affective items (like/dislike, good/bad, high/low quality, distinct/not distinct, and
interesting/uninteresting), as well as subjective familiarity (familiar/unfamiliar). Each logo
appeared on a separate page with the 7-point rating scales and was evaluated by 20-70
respondents (about 40 on average).
Shared Meaning. Shared meaning exists when there is a consensus among respondents
regarding the first meaning or association that comes to mind when they see a logo (Ellis,
Parente and Shumate, 1974). The same respondents for the affect and subjective familiarity
questions listed the first meaning or association that came to mind when they looked at each logo
(collected in the second half of the booklet). A trained research assistant from each country
grouped similar associations. For each logo in each country, we calculated the Hirschman-
Herfindahl index score by squaring and then summing across the probabilities of each response
(Henderson and Lafontaine 1996)4. A high concentration index indicates that a logo evokes
shared meaning.
Recognition. For each country, five groups of approximately 30 business undergraduates
(different from the groups used to collect the affect, familiarity, and meaning ratings) viewed a
subset of 39 logos in a slide show, with each logo appearing for two seconds. Respondents next
4 For example, if 50% of respondents said a logo reminded them of a sun, 30% said wheel, and 20% said star, the
Hirschman-Herfindahl index would be .52 + .3
2 + .2
2 = .38.

12
participated in a distracter task for about ten minutes. They then viewed a booklet with 78 logos
– 39 target logos from the slide presentation and 39 distracter logos that were not presented
earlier. The students then indicated whether they had seen the logo in the slide show. True
recognition is the percentage of respondents who correctly recognize a target logo, while false
recognition is the percentage of respondents who claimed to recognize a distracter logo.
4. The Model
Following previous aesthetics research, our model uses logos as the primary unit of analysis. The
structural relationships between logo design characteristics and consumer responses are specified
using data collected at the logo level (see Figure 2). Previous research averages individual
ratings and responses to compute each logo‟s design and response scores (e.g., Henderson et al
2003). Our model includes an additional hierarchy to analyze data at the individual level, thus
minimizing potential aggregation bias (DeShon, 1998).5 To test whether perceptions and
evaluations of logos are similar cross-nationally, we specify a concomitant variable finite-
mixture structural equation model that allocates logos to clusters. With fewer clusters than
countries, our approach reduces the number of invariance tests relative to Steenkamp and
Baumgartner (1998) who define clusters a priori at the country level.
If logos are evaluated similarly across cultures, we will find a one-cluster solution. We
estimate our model in a Bayesian framework using an MCMC algorithm, which has several
advantages over traditional methods including no asymptotic assumptions, suitability for smaller
sample sizes, incorporation of prior information (Rossi and Allenby, 2003), and avoidance of
Heywood cases (negative variances). Most importantly, Bayesian inference estimates individual-
specific effects. Thus, we can obtain each individual logo‟s country-specific posterior
5 We estimated a model without taking into account individual response differences and found a significant
aggregation bias.

13
Figure 2
Model Specification at the Cluster and Individual Response Level 6
Objective Design Elements:
Design Dimensions:
Logo Design Responses:
: Elaborate
: Natural
: Harmony
: Repetition
: Proportion
: Parallel
: Shared
Meaning
: True
recognition
: False
recognition
: Rater 1
: Rater r
.. : Complex
: Active
: Depth
:Representative
: Organic
: Round
: Symmetry
: Balance
: Rater 1
: Rater r
..
: Rater 1
: Rater r
..
: Rater 1
: Rater r
..
: Rater 1
: Rater r
..
: Rater 1
: Rater r
..
: Rater 1
: Rater r
..
: Rater 1
: Rater r
..: Subjective
Familiarity..
: Affect
Affect
resp. 1
Affect
resp. H
: Distinct
: Good
: Interesting
: Like
: Quality
: Distinct
: Good
: Interesting
: Like
: Quality
..
1ci
2ci
3ci
4ci
5ci
6ci
7ci
8ci
1ci
2ci
3ci
1
1
1
1
1
1
1
1
1
1
1
1
1
1
1
1
21
s
31
s
1
52
s
62
s
1
1
83
s
11cix
11 cici Rx
21cix
31cix
41cix
51cix
61cix
71cix
81cix
22 cici Rx
33 cici Rx
44 cici Rx
55 cici Rx
66 cici Rx
77 cici Rx
88 cici Rx
4ci
5ci
6ci
1.
s
2.
s
3.
s
4.
s
5.
s
6.
s
.1
s
.2
s
.3
s
.4
s
.5
s
1ci
2ci
3ci
4ci
5ci
1
1
1
1
11ci
11 cici H
affect
11ciy
affect
12ciy
affect
13ciy
affect
14ciy
affect
15ciy
affect
1ciciHy
affect
2ciciHy
affect
3ciciHy
affect
4ciciHy
affect
5ciciHy
familiarity
1ciy
familiarity
ciciHy
21
s
y
31
s
y
41
s
y
51
s
y
1
21
s
y
31
s
y
41
s
y
51
s
y
1
Subjective Design Elements:
cluster logo-country logo-country-respondentlogo-countryLogo-country-
rater
Logo Design Characteristics:
6 All intercepts and errors are omitted for clarity
Level:

14
distribution of factor scores and cluster probabilities. Managers can use this information to
optimize individual logos on specific dimensions of interest, as shown in Section 6.1.
4.1 Model Specification
Before introducing our model, we present some notation that defines the sets and (latent)
variables. Let:
1,..,i I denote the set of logos. In this study, 195I .
1,..,c C denote the set of countries. In this study, 10C .
1,..,s S denote the a priori unknown set of cross-national clusters to be determined
empirically.
1,..,q Q denote the set of logo design elements related to the design dimensions. In this
study, 8Q (i.e., complex, active, depth, representative, organic, round,
symmetry, and balance).
1,..,n N denote the set of logo design characteristics. In this study, N = 6 and consists of
two subsets: dimension 3N design dimensions (i.e. elaborate, natural, and
harmony); and element 3N objective design elements (i.e., repetition, proportion,
and parallel).
1,..,p P denote the set of affect response items. In this study, 5P (i.e., distinct, good,
interesting, like, and quality).
1,..,m M denote the set of logo response variables. In this study, 5M (i.e., affect,
subjective familiarity, shared meaning, true recognition, and false recognition).
1,.., ciqr R denote the raters in country c that evaluated design element q of logo i.
1,.., cih H denote the respondents in country c that responded to logo i on affect and
subjective familiarity.
cirqx denote the evaluation of design element q, of logo i in country c by rater r.
ciq denote the latent score of design element q of logo i in country c.
cin denote the (latent) value of design dimension or objective element n of logo i in
country c. affect
ycih denote the 1P -vector containing the value of the affect items of logo i in
country c by respondent h. familiarity
cihy denote the value of the subjective familiarity item of logo i evaluated in country c
by respondent h.
cimh denote the latent score on logo variable m by respondent h in country c on logo i.
In this study, this score is only computed for affect and subjective familiarity, i.e.
1,2m respectively.
cim denote the (latent) scores on logo response variable m in country c on logo i.

15
Based on our conceptual framework, Figure 2 summarizes our model specification for a
given cluster s, and incorporates both individual and logo level data. The 8Q design elements
are measured at the individual level and capture the first Ndimension = 3 logo design dimensions:
elaborate (complex, active, and depth), natural (representative, organic, and round), and harmony
(symmetry and balance). The element 3N logo objective design elements (repetition, proportion,
and parallel) are measured at the logo level and are equal across countries. These 6N logo
design characteristics influence 5M response variables (affect, subjective familiarity, shared
meaning, and true and false recognition). Affect is assessed by 5P items measured at the
individual level. Subjective familiarity is also measured at the individual level by one item for
each respondent. Shared meaning, true recognition, and false recognition are measured at the
logo level and are an aggregate of the individual level responses as described previously. As
these aggregated responses are proportions, we applied a logit transformation to obtain
continuous dependent variables.
Previous research on aesthetics assumes that the scores of the subjective logo design
elements, ξ , are observed and therefore computes these values by averaging over the rater scores
x , i.e. 1
1 ciqR
ciq cirq
rciq
xR
(Henderson and Cote, 1998). In contrast, our approach recognizes
heterogeneity of individual ratings and directly models these, given cluster membership s, as
follows:
| s
cirq ciq cirqx s , (1)
where s
cirq is assumed to be normally distributed with mean zero and standard deviation x
sq . To
derive the latent scores of the subjective logo design elements, ξ , we assume the following
measurement model, given cluster membership s:
16
'
1 2 3|ξ τ Λ εs s s
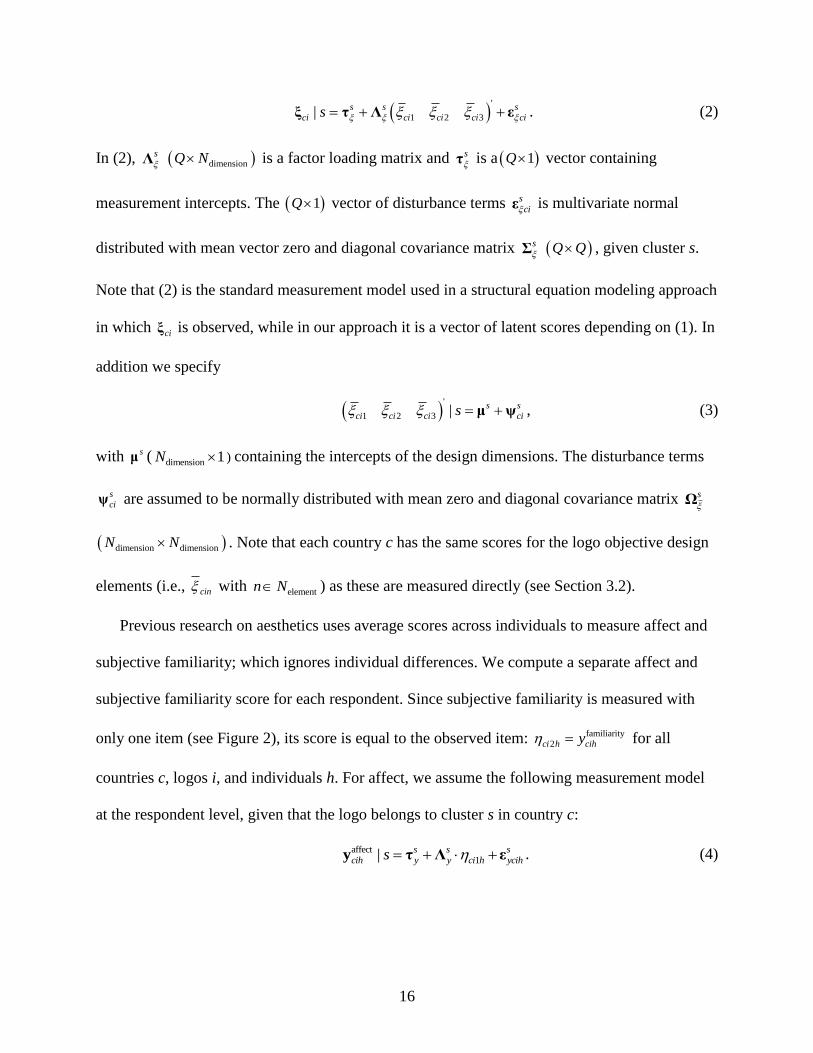
ci ci ci ci cis . (2)
In (2), Λs
dimensionQ N is a factor loading matrix and τs
is a 1Q vector containing
measurement intercepts. The 1Q vector of disturbance terms εs
ci is multivariate normal
distributed with mean vector zero and diagonal covariance matrix Σs
Q Q , given cluster s.
Note that (2) is the standard measurement model used in a structural equation modeling approach
in which ξci is observed, while in our approach it is a vector of latent scores depending on (1). In
addition we specify
'
1 2 3 | μ ψs s
ci ci ci cis , (3)
with μ s ( dimension 1N ) containing the intercepts of the design dimensions. The disturbance terms
ψs
ci are assumed to be normally distributed with mean zero and diagonal covariance matrix Ωs
dimension dimensionN N . Note that each country c has the same scores for the logo objective design
elements (i.e., cin with elementn N ) as these are measured directly (see Section 3.2).
Previous research on aesthetics uses average scores across individuals to measure affect and
subjective familiarity; which ignores individual differences. We compute a separate affect and
subjective familiarity score for each respondent. Since subjective familiarity is measured with
only one item (see Figure 2), its score is equal to the observed item: familiarity
2ci h cihy for all
countries c, logos i, and individuals h. For affect, we assume the following measurement model
at the respondent level, given that the logo belongs to cluster s in country c:
affect
1|y τ Λ εs s s
cih y y ci h ycihs . (4)

17
In (4), Λs
y is a 1P vector containing the factor loadings, and τs
y is a 1P vector containing
measurement intercepts. The 1P error vector εs
ycih is assumed to be normally distributed with
mean zero and diagonal covariance matrix Σ y
s P P , given cluster s. Similar to equation (1),
we assume the following measurement model to derive the latent scores of affect and subjective
familiarity at the logo level:
' '
1 2 1 2| εs
ci h ci h ci ci cihs . (5)
In (5), εs
cih is a 2 1 -vector that is assumed to be normally distributed with mean zero and
2 2 diagonal covariance matrix Σs
, given cluster s.
Given the measurement model in (1) to (5), we now specify the structural relationships
among the exogenous design characteristics and the responses at the logo level. Henderson and
Cote (1998) found the effects of the response variables on each other were nominal. Thus, we did
not include any response variables as predictors to avoid multicollinearity problems (Grewal et
al., 2004). This leads to the following structural relationships, given cluster s:
|η α Γ ξ ζs s s
ci ci cis , (6)
In (6), the vector α s 1M contains the intercepts for the endogenous logo responses ηci . The
coefficient matrix Γs incorporates the effects of the exogenous logo design dimensions and
objective design elements, ξci , on the endogenous logo responses ηci (see Figure 2). It is
assumed that the disturbance term ζ s
ci is normally distributed with mean zero and diagonal
covariance matrices Ωs
M M .
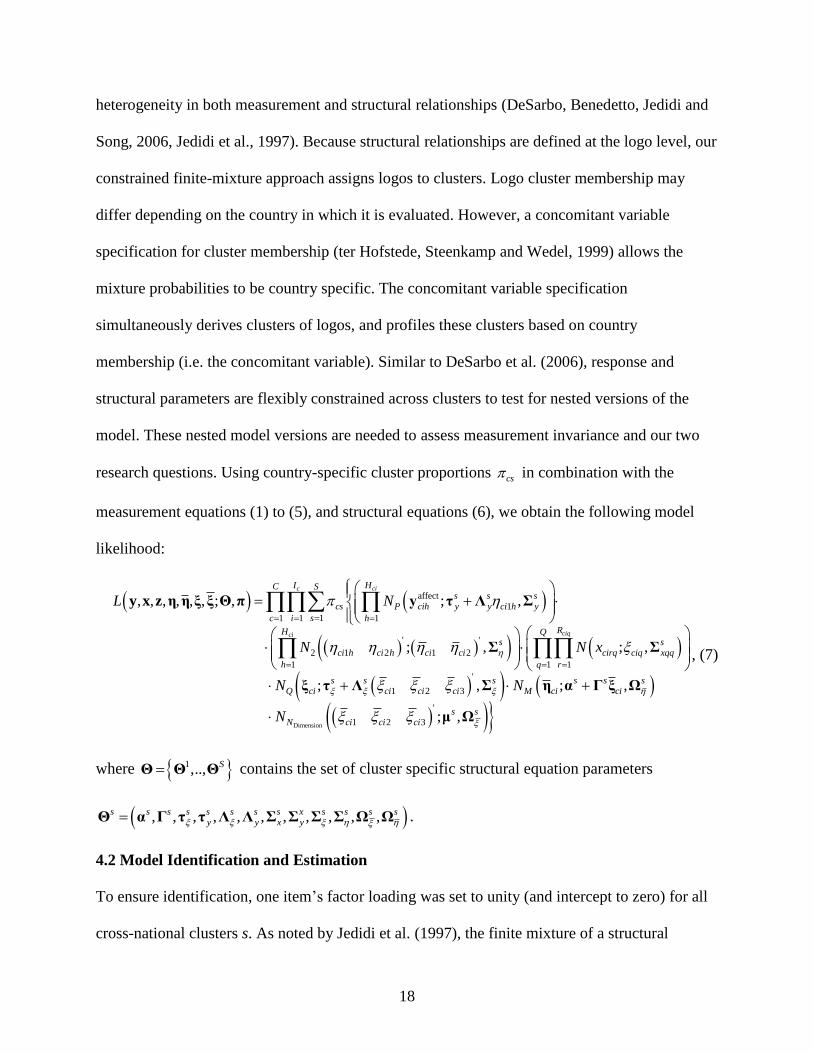
The model is tested on logos that may belong to an unknown group of cross-national clusters.
Thus, we propose a constrained finite-mixture structural-equation approach to allow for
18
heterogeneity in both measurement and structural relationships (DeSarbo, Benedetto, Jedidi and
Song, 2006, Jedidi et al., 1997). Because structural relationships are defined at the logo level, our
constrained finite-mixture approach assigns logos to clusters. Logo cluster membership may
differ depending on the country in which it is evaluated. However, a concomitant variable
specification for cluster membership (ter Hofstede, Steenkamp and Wedel, 1999) allows the
mixture probabilities to be country specific. The concomitant variable specification
simultaneously derives clusters of logos, and profiles these clusters based on country
membership (i.e. the concomitant variable). Similar to DeSarbo et al. (2006), response and
structural parameters are flexibly constrained across clusters to test for nested versions of the
model. These nested model versions are needed to assess measurement invariance and our two
research questions. Using country-specific cluster proportions cs in combination with the
measurement equations (1) to (5), and structural equations (6), we obtain the following model
likelihood:
affect
1
11 1 1
' '
2 1 2 1 2
1 1 1
, , , , , , ; , ; ,
; , ; ,
c ci
ciqci
I HC Ss s s
cs P cih y y ci h y
sc i h
RHs s
ci h ci h ci ci cirq ciq xqq
h q r
L N
N N x
y x z η η ξ ξ Θ π y τ Λ Σ
Σ Σ
Dimension
'
1 2 3
'
1 2 3
; , ; ,
; ,
Q
s s s s s s
Q ci ci ci ci M ci ci
s s
N ci ci ci
N N
N
ξ τ Λ Σ η α Γ ξ Ω
μ Ω
, (7)
where 1,..,Θ Θ ΘS contains the set of cluster specific structural equation parameters
, , , , , , , , , , ,Θ α Γ τ τ Λ Λ Σ Σ Σ Σ Ω Ωs s s s s s s s x s s s s
y y x y .
4.2 Model Identification and Estimation
To ensure identification, one item‟s factor loading was set to unity (and intercept to zero) for all
cross-national clusters s. As noted by Jedidi et al. (1997), the finite mixture of a structural

19
equation model (with unknown groups) is identified when the corresponding multi-group model
with known groups is identified and the data is multivariate normal.
Using these identification restrictions, the model was estimated using the Gibbs sampler with
auxiliary variables to estimate the clusters (Diebolt and Robert, 1994, Rossi and Allenby, 2003).
For the estimation of cross-national cluster membership, an auxiliary variable 1,2,..,ciz S was
introduced for each logo i evaluated in country c. This indicates which cluster (s) logo i in
country c is allocated (Diebolt and Robert, 1994). After introducing the auxiliary variables ( ciz ),
the likelihood (7) can be rewritten as follows:
affect
1
1 1 : 1
'
2 1 2 1 2
1 1 1
, , , , , , ; , ; ,
; , ; ,
ci
ci
ciqci
HC Ss s s
P cih y y ci h y
c s i z s h
RH Qs s
ci h ci h ci ci cirq ciq xqq
h q r
L N
N N x
y x z η η ξ ξ Θ π y τ Λ Σ
Σ Σ
Dimension
'
1 2 3
1 2 3
; , ; ,
; ,
s s s s s s
Q ci ci ci ci M ci ci
s s
N ci ci ci
N N
N
ξ τ Λ Σ η α Γ ξ Ω
μ Ω
, (8)
where : cii z s under the third product indicates that this index runs over all logos i in country c
that belong to cluster s. Given the unobserved values for ciz , specification (8) leads to standard
posterior distributions for Θ , η , η , ξ , ξ and π . For model estimation, we use flat prior
distributions specified in Web Appendix A in the MCMC algorithm (see Appendix B).
To address possible label switching, a well-known problem during Bayesian inference for
mixture models (Frühwirth-Schnatter, 2006, Rossi et al., 2005), we re-labeled cluster
memberships by post-processing the posterior draws using Richardson and Green‟s (1997)
approach.7 In all runs, we used 2,000 draws, thinned 1 in 10, with a burn-in of 100,000 iterations.
We examined convergence using diagnostics proposed by Raftery and Lewis (1992) and Geweke
7 In our analysis, we did not observe label switching in any of the runs, indicating that the clusters are well
separated (Rossi et al 2005); see Web Appendix C for some posterior draws.
20
(1992), and found that all runs converged well before burn-in (see Web Appendix B). Synthetic
data analysis revealed that the model recovered all parameter values well within the
corresponding 95% confidence intervals.
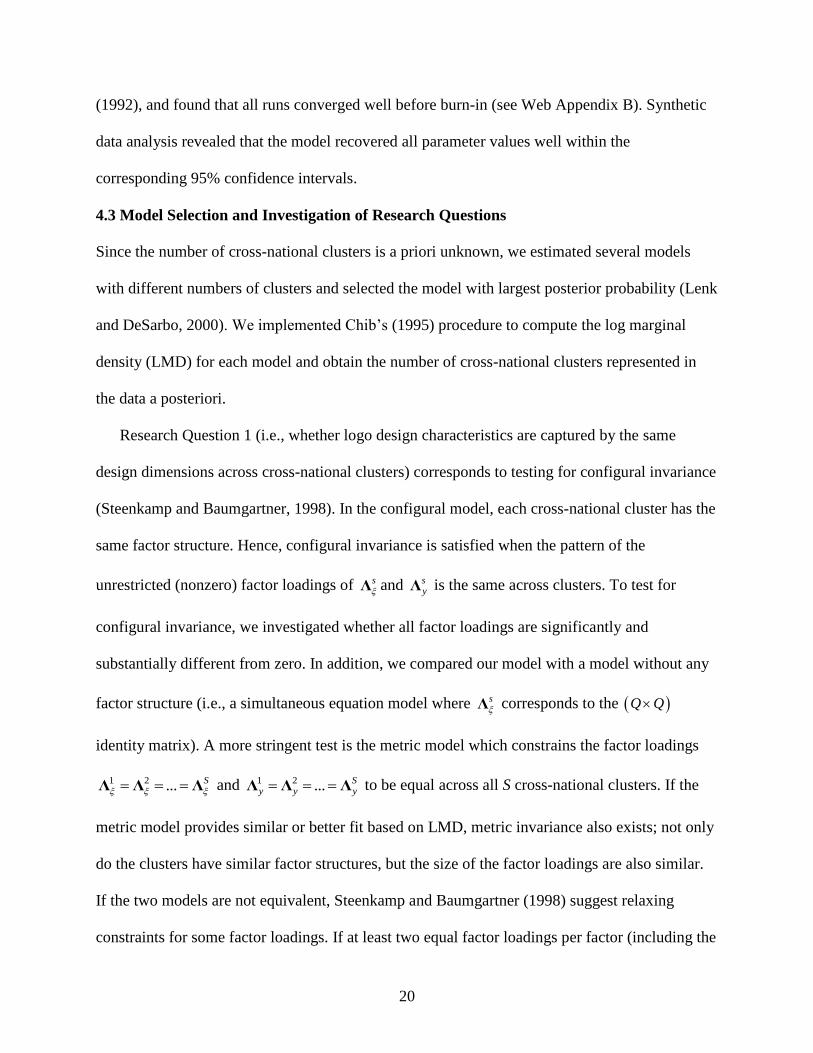
4.3 Model Selection and Investigation of Research Questions
Since the number of cross-national clusters is a priori unknown, we estimated several models
with different numbers of clusters and selected the model with largest posterior probability (Lenk
and DeSarbo, 2000). We implemented Chib‟s (1995) procedure to compute the log marginal
density (LMD) for each model and obtain the number of cross-national clusters represented in
the data a posteriori.
Research Question 1 (i.e., whether logo design characteristics are captured by the same
design dimensions across cross-national clusters) corresponds to testing for configural invariance
(Steenkamp and Baumgartner, 1998). In the configural model, each cross-national cluster has the
same factor structure. Hence, configural invariance is satisfied when the pattern of the
unrestricted (nonzero) factor loadings of Λs
and Λs
y is the same across clusters. To test for
configural invariance, we investigated whether all factor loadings are significantly and
substantially different from zero. In addition, we compared our model with a model without any
factor structure (i.e., a simultaneous equation model where Λs
corresponds to the Q Q
identity matrix). A more stringent test is the metric model which constrains the factor loadings
1 2 ...Λ Λ ΛS
and 1 2 ...Λ Λ ΛS
y y y to be equal across all S cross-national clusters. If the
metric model provides similar or better fit based on LMD, metric invariance also exists; not only
do the clusters have similar factor structures, but the size of the factor loadings are also similar.
If the two models are not equivalent, Steenkamp and Baumgartner (1998) suggest relaxing
constraints for some factor loadings. If at least two equal factor loadings per factor (including the

21
marker) are observed, we have partial metric invariance and are allowed to test the second
research question (i.e., whether consumers‟ responses to design dimensions are stable cross-
nationally) by testing for invariance of structural relationships across clusters, i.e.
1 2 .. S .
5. Results
5.1 Number of Cross-National Clusters
The Log Marginal Density indicates that a three-cluster model fits best (LMD=-891,508 versus -
896,328 for the one-cluster, -891,879 for the two-cluster, and -891,894 for the four-cluster
models). The country-specific cluster probabilities displayed in Table 2 indicate that each
country (except Argentina) clearly belongs to a single cluster. The clusters are labeled: West,
which includes Australia, Great Britain, Germany, the Netherlands and the US; Asia, which
includes China, India, and Singapore; and Russia, which includes only Russia. Argentina
straddles the West and Asia, which means that logo evaluations in Argentina are somewhat
ambiguous.
These three clusters vary by cultural characteristics (except Masculine/Feminine for the West
and Asia) and writing systems. The Asian cultures use more complex writing system and have
lower individualism scores than either the West or Russia. Interestingly, Argentina shares the
simpler writing system with the West and a relatively low individualism score with Asia. Russia
has a higher uncertainty avoidance score than the West and Asia. For the remainder of the
analysis, we focus on the three-cluster solution.
5.2 Similarity of Design Factor Structures across Clusters
Inspection of the factor loadings (see Table 3) reveals that all estimates are significantly and
substantially different from zero. The proposed factor structure also strongly outperforms a
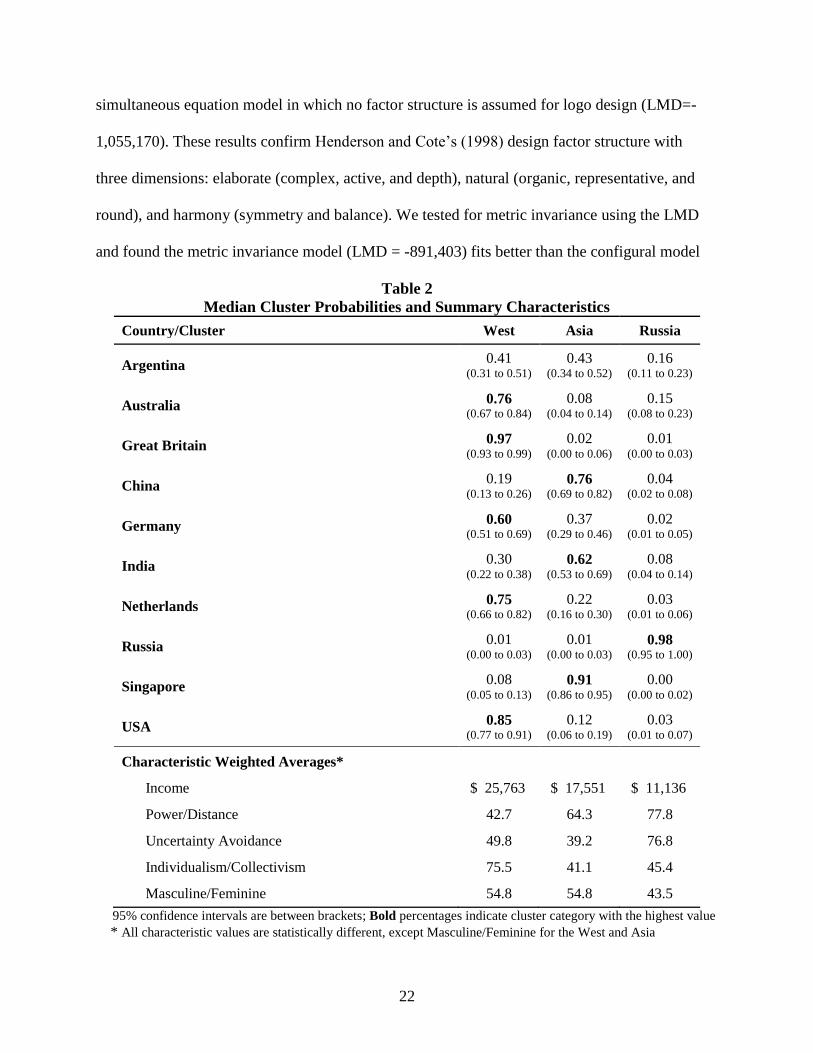
22
simultaneous equation model in which no factor structure is assumed for logo design (LMD=-
1,055,170). These results confirm Henderson and Cote‟s (1998) design factor structure with
three dimensions: elaborate (complex, active, and depth), natural (organic, representative, and
round), and harmony (symmetry and balance). We tested for metric invariance using the LMD
and found the metric invariance model (LMD = -891,403) fits better than the configural model
Table 2
Median Cluster Probabilities and Summary Characteristics
Country/Cluster West Asia Russia
Argentina 0.41
(0.31 to 0.51)
0.43 (0.34 to 0.52)
0.16 (0.11 to 0.23)
Australia 0.76
(0.67 to 0.84)
0.08 (0.04 to 0.14)
0.15 (0.08 to 0.23)
Great Britain 0.97
(0.93 to 0.99)
0.02 (0.00 to 0.06)
0.01 (0.00 to 0.03)
China 0.19
(0.13 to 0.26)
0.76 (0.69 to 0.82)
0.04 (0.02 to 0.08)
Germany 0.60
(0.51 to 0.69)
0.37 (0.29 to 0.46)
0.02 (0.01 to 0.05)
India 0.30
(0.22 to 0.38)
0.62 (0.53 to 0.69)
0.08 (0.04 to 0.14)
Netherlands 0.75
(0.66 to 0.82)
0.22 (0.16 to 0.30)
0.03 (0.01 to 0.06)
Russia 0.01
(0.00 to 0.03)
0.01 (0.00 to 0.03)
0.98 (0.95 to 1.00)
Singapore 0.08
(0.05 to 0.13)
0.91 (0.86 to 0.95)
0.00 (0.00 to 0.02)
USA 0.85
(0.77 to 0.91)
0.12 (0.06 to 0.19)
0.03 (0.01 to 0.07)
Characteristic Weighted Averages*
Income $ 25,763 $ 17,551 $ 11,136
Power/Distance 42.7 64.3 77.8
Uncertainty Avoidance 49.8 39.2 76.8
Individualism/Collectivism 75.5 41.1 45.4
Masculine/Feminine 54.8 54.8 43.5
95% confidence intervals are between brackets; Bold percentages indicate cluster category with the highest value
* All characteristic values are statistically different, except Masculine/Feminine for the West and Asia

23
(LMD = -891,508). This indicates that logo design characteristics are captured by the same
factor structure and loadings across clusters.
Table 3
Median Factor Loadings of Design Dimension and Affect*
Design Dimension Design Characteristic Factor Loading
Elaborate:
Complex 1
Active 1.29
(1.13 to 1.47)
Depth 1.34
(1.18 to 1.50)
Natural:
Organic 1
Representative 0.82
(0.74 to 0.91)
Round 0.76
(0.67 to 0.86)
Harmony: Symmetry 1
Balance 0.62
(0.57 to 0.66)
Affect:
Distinct 1
Good 1.07
(1.06 to 1.08)
Interest 1.25
(1.24 to 1.26)
Like 1.23
(1.22 to 1.25)
Quality 1.08
(1.07 to 1.09)
95% confidence intervals are between parentheses *Factor loadings are equal across clusters due to metric invariance
5.3 Similarity of Design–Response Relationships across Clusters
Since we found metric invariance, we can now test whether the structural paths are invariant
across the three clusters. As indicated by the LMD of structural relationship invariance (LMD = -
891,510), this model is rejected. Table 4 presents the results of the metric invariance model
where structural paths are different across clusters. As suggested by Gelman and Pardoe (2006),
its last column contains the explained variance for each dependent factor. Table 4 shows that the
explained variance for each response variable varies substantially across clusters. Although there

24
is a high degree of similarity to the pattern of relationships between design dimensions and
response variables, the structural parameters have slight differences across clusters. We consider
reasons for these patterns in the summary at the end of this Section.
Affect – Overall, logo design dimensions and objective elements explain 84% of the variance
in affect for Asia, 62% for the West, and 28% for Russia. In all clusters, affect increases as the
design dimensions (harmony, elaborate, and natural) increase as seen in the positive and
significant structural path coefficients. However, the importance of elaborate varies across the
three clusters. The Russian cluster puts significantly less emphasis on it (.19) than the Asian (.70)
and Western clusters (.54). The effects of parallel, proportion, and repetition on affect are small
and statistically equivalent across the three clusters.
Subjective Familiarity – Logo design characteristics explain 24% of subjective familiarity for the
West, 35% for Russia, and 41% for Asia. The relationships for harmony and natural are positive
and statistically significant in all three clusters. Additionally, the effects of parallel, repetition,
and proportion are non-significant across the clusters. However, the relationship between
elaborate and subjective familiarity varies across clusters; the path for Russia (-0.22) is negative
and significant, while the West (.26) and Asia (.41) are positive and significant.
Shared Meaning –Logo design characteristics explained about the same amount of variance
for all three clusters (22% for the West, 23% for Russia, and 19% for Asia). Natural increases
shared meaning, while elaborate reduces shared meaning in all three clusters. Harmony and the
objective design elements do not influence shared meaning.
True Recognition – Logo design dimensions and objective elements explain 10% of true
recognition for Asia, 3% for the West, and 6% for Russia. Natural has a positive influence and is
equivalent across the clusters (Asia .10, Russia .06, and the West .07). Harmony, parallel, and

25
Table 4
Median Estimates Structural Paths
Response Cluster Elaborate Natural Harmony Parallel Proportion Repetition Intercept Variance
Explained
Affect
West .54 (.41 to .77)
.12 (.08 to .17)
.06 (.03 to .09)
.00 (-.02 to .03)
-.06 (-.12 to .01)
.01 (-.01 to .04)
1.75 (1.01 to 2.22)
.62
Asia .70 (.59 to .82)
.17 (.12 to .24)
.03 (.01 to .05)
-.04 (-.06 to -.01)
-.02 (-.11 to .07)
.02 (-.01 to .05)
.87 (.48 to 1.21)
.84
Russia .19 (.05 to .34)
.14 (.09 to .19)
.09 (.04 to .16)
.04 (-.01 to .08)
-.08 (-.25 to .08)
.06 (.01 to .12)
2.40 (1.69 to 3.05)
.28
Subjective
Familiarity
West .26 (.02 to .61)
.22 (.13 to .30)
.17 (.11 to .23)
.02 (-.03 to .06)
.14 (.00 to .28)
-.01 (-.06 to .04)
.93 (-.13 to 1.71)
.24
Asia .41 (.21 to .61)
.26 (.16 to .38)
.07 (.04 to .11)
-.04 (-.08 to -.00)
.04 (-.12 to .21)
.03 (-.01 to .08)
.93 (.33 to 1.44)
.41
Russia -.22 (-.46 to -.02)
.29 (.21 to .36)
.12 (.03 to .22)
.05 (-.02 to .11)
-.01 (-.25 to .23)
.04 (-.04 to .12)
3.04 (2.08 to 4.11)
.35
Shared
Meaning
West -.07 (-.10 to -.02)
.08 (.06 to .09)
.00 (-.01 to .01)
.00 (-.01 to .01)
.02 (-.01 to .05)
.00 (-.01 to .01)
.18 (.03 to .31)
.22
Asia -.05 (-.08 to -.01)
.06 (.04 to .08)
-.00 (-.01 to .00)
.00 (-.01 to .01)
.01 (-.03 to .05)
-.00 (-.02 to .01)
.16 (.04 to .27)
.19
Russia -.11 (-.18 to -.05)
.06 (.04 to .08)
-.00 (-.03 to .02)
-.00 (-.02 to .01)
-.00 (-.07 to .07)
-.01 (-.03 to .01)
.67 (.40 to .96)
.23
True
Recognition
West -.04 (-.12 to .06)
.07 (.03 to .10)
.01 (-.02 to .04)
.02 (.00 to .05)
-.01 (-.08 to .07)
.02 (-.00 to .05)
.27 (-.07 to .59)
.03
Asia .07 (.00 to .16)
.10 (.07 to .14)
.00 (-.02 to .02)
.00 (-.02 to .03)
.03 (-.07 to .13)
.01 (-.02 to .04)
-.13 (.41 to .14)
.10
Russia -.02 (-.14 to .09)
.06 (.03 to .10)
-.03 (-.07 to .02)
.01 (-.03 to .04)
-.17 (-.31 to -.03)
.03 (-.02 to .07)
.75 (.24 to 1.28)
.06
False
Recognition
West .15 (.05 to .24)
-.06 (-.10 to -.02)
.05 (.02 to .09)
-.01 (-.04 to .02)
-.08 (-.17 to .00)
.02 (-.01 to .05)
-1.29
(-1.66 to -.95) .07
Asia .14 (.05 to .23)
-.07 (-.12 to -.03)
.03 (.00 to .05)
-.01 (-.03 to .02)
-.01 (-.12 to .09)
.01 (-.02 to .04)
-1.21 (-1.51 to -.89)
.06
Russia .13 (.03 to .26)
-.13 (-.16 to -.09)
.06 (.01 to .11)
-.02 (-.05 to .02)
.03 (-.11 to .17)
.00 (-.04 to .05)
-1.31 (-1.86 to -.79)
.23
95% confidence intervals are between brackets
Bold values correspond to coefficients with 95% confidence interval not containing zero

26
repetition have non-significant effects on true recognition in all three clusters. Two cluster
differences emerge in the relationships between elaborate, proportion and true recognition.
Elaborate has a positive influence in Asia, but no influence in Russia or the West (Asia .07 vs.
West -.04 vs. Russia -.02); although this difference is not statistically significant across clusters.
The effect of proportion is not statistically different across clusters, but has a negative influence
in Russia (-0.17), and is insignificant in Asia (0.04) or the West (-.01).
False Recognition – Logo design characteristics explain a small percent of false recognition
for Asia (6%) and the West (7%), but a larger percent in Russia (23%). For all clusters, natural
decreases false recognition, while elaborate and harmony increase false recognition.
Summary - Overall, the results for the cross-national clusters were consistent with prior work
(Henderson and Cote, 1998, Henderson et al., 2003). This is especially true for natural and
harmony where the patterns of the path estimates are consistent across response variables and
clusters. Natural designs universally increase positive affect, shared meaning, subjective
familiarity, and true recognition and decrease false recognition. Designs high in harmony
universally increase positive affect, subjective familiarity, and false recognition, while not
affecting shared meaning or true recognition. However, the effect of harmony on subjective
familiarity was higher for the West than Asia.
The largest cluster differences were for elaborate designs. In most cases, elaborate designs
increased positive affect, subjective familiarity, true and false recognition, while decreasing
shared meaning. However, the Russian cluster differed significantly from the other clusters,
where the influence of elaborate designs on affect was much smaller and that on subjective
familiarity was actually negative. Arrindell et al (2004) offer a possible explanation for this
result. They find that countries with low uncertainty avoidance scores have greater tolerance for

27
uncertainty and complexity. Since consumers in the Asian and, to a lesser extent, Western
clusters have lower uncertainty avoidance scores, they may like and feel more familiar with
complex designs than their Russian counterparts.
6. Conclusion
The goals of our study were to: 1) extended finite-mixture structural-equation models to account
for individual judgment in stimulus level design responses, 2) assess the cross-cultural
universality of design dimensions and the stability of responses to these dimensions, and 3)
address managerial concerns about adapting logos for global markets.
6.1 Extending Finite-Mixture Structural-Equation Models
The proposed constrained finite-mixture structural equation modeling approach using
concomitant variables proved a valuable tool for identifying latent logo clusters that are
evaluated similarly across countries. Our approach does not assume logo evaluations within
countries belong, a priori, to the same cluster (although our findings resulted in country based
clusters). Due to our concomitant variable formulation, the identified cross-national clusters are
easily interpreted. Further, previous experimental research in aesthetics aggregates individual
responses for each logo. In contrast, our approach addresses potential aggregation bias by
modeling response heterogeneity through a hierarchical structure. More generally, our
constrained finite-mixture structural equation modeling procedure can be extended to analyze
data sets with many subgroups; aggregating them into larger classes based on response
similarity. For example, it can answer such questions as: how would different stakeholders
(stockholders, consumers, competitors, public policy makers) respond to different multi-
dimensional stimuli such as a company‟s pricing practices; or how would different industries or
markets react to different types of R&D projects. In addition, the proposed approach is suitable

28
for smaller sample sizes, allows the incorporation of available prior parameter information, and
avoids obtaining negative variances or Heywood cases.
The constrained-finite mixture modeling procedure also provides important logo
optimization guidelines. For instance, the Western cluster seems to have difficulty recognizing
logo 65 , as indicated by an average true-recognition score of .57 (on a 0-1 scale) – compared
to .64 in Asia and .73 in Russia. In addition, this logo has a moderate affect score across cultures
(average score 3.9 on a 7-point scale). The low natural score (2.3) is probably why this logo
performs poorly; since natural has a positive influence on both true recognition and affect. Using
posterior draws of the parameters, a designer can determine the minimum required natural score
for a given country, such that its expected affect and true-recognition values are higher than a
predetermined threshold.8 For instance, the score of natural should be at least 3.5 in Russia, 3.9
in China, and 5.7 in the U.K. to obtain true-recognition and affect scores of at least .65 and 4.0
respectively. Similarly, the elaborate score of logo 65 in Germany should be between 3.2 and 4.2
(current median score equals 3.0) to reach an expected score of at least 4.0 on affect and .15 on
shared meaning (current median scores are 3.9 and .33, respectively). Such optimization is
especially important for elaborate since its effects are not positive on all responses for all
clusters.
6.2 Design Dimension Universality and Stability of Consumer Responses
Previous research suggests that elaborate, natural, and harmony are design dimensions that exist
across stimuli. Even when the design elements are quite different, these three dimensions appear
repeatedly. Our results show that these design dimensions also exist across cultures, suggesting
8 In the optimization, we determined for each posterior draw what the minimum score of natural should be, given the
scores of this logo on the other dimensions, such that prespecified values of affect and true recognition are reached.
We chose the posterior median of the minimum expected score as the threshold for natural.

29
they may be universal. The existence of universal design dimensions has important implications
for design research. Currently, when developing a design study, researchers must select which of
innumerable elements should be used to describe the design. For example, Orth and Malkewitz
(2008) included 62 design elements for wine labels and Henderson, Giese, and Cote (2004) used
24 elements for typeface. Focusing on a reduced set of design dimensions should make design
research more tractable.
Our results also support the contention of evolutionary psychology that design perceptions
are innate and relatively immune from cultural influence. Not only do different cultures perceive
design similarly, but they also appear to respond similarly as well. Of course, culture does have
some influence. For example, our results suggest that higher uncertainty avoidance cultures may
find elaborate designs less attractive than lower uncertainty avoidance ones.
Future research can extend our findings in several important ways. Most notably, future
research should investigate the universality of other possible design dimensions, such as weight,
flourish, compression, size, and color. Additionally, consumer responses to brands with
established designs/logos may differ from reactions to the unfamiliar logos. Future work might
consider how brand familiarity moderates the relationships uncovered in this research. Future
research might also study more countries and extend the concomitant variable approach to allow
cluster proportions to vary along more dimensions (e.g., writing systems and uncertainty
avoidance) than only country evaluations.
6.3 Managerial Guidelines for Adapting Global Logos
For the manager interested in maintaining a consistent brand image worldwide, our results
suggest a standardized core logo can work globally. Logo perceptions and responses are similar
enough across cultures, that a given logo design will produce similar effects in many parts of the

30
world. In addition, when evaluating logo designs, managers may want to focus on affective
responses for which design dimensions and elements appear to have the strongest influence.
Design appears less related to recognition and shared meaning, which are learned responses
strongly influenced by other marketing investments. This implies that managers should
particularly focus on designing elaborate, natural, and harmonious logos that elicit positive
affect; as it may be difficult to rectify design problems by other marketing efforts.
For example, Habitat for Humanity recently created a new logo: . It is more natural and
elaborate, but may be slightly less harmonious, than the previous logo: . We predict that this
new logo will increase positive affect and, to a lesser extent, shared meaning, worldwide.
Increasing harmony such as might have been even more effective. Although these
guidelines seem intuitive, managers continue to create poor logos (Colman et al., 1995) as the
2012 London Olympics Logo (which cost ₤400,000 to create) so vividly illustrates (Methven and
McGurran, 2007).
Elaborating on the suggestions of Kohli, Suri, and Thakor (2002), we suggest managers do
the following when designing or modifying a logo:
1. Choose the core logo image carefully and specify clear response objectives for various
regions.
2. Communicate with logo designers using the design dimensions of elaborate, natural, and
harmony. Our results suggest they provide a parsimonious vocabulary for design
communication.
3. Design something effective before entering new markets. You often cannot change your
brand name, but you can change your logo.
4. Don‟t go with the flavor-of-the-month or “artistically interesting” logos. Stick to logos
that simply and richly capture the essence of something (elaborate); depict commonly
experienced objects (natural); and represent congruent patterns or arrangements of parts
(harmony).
5. Be systematic and objective; allow designers to modify the core logo for individual
markets. However, use the results of Table 4 to guide logo selection, rather than rely
solely on the opinion of a particular logo designer or committee.
31
6. Test new alternatives against existing logos since there are multiple ways to create
elaborate, natural, and harmonious logos.
As a company builds familiarity with its brand within a country, consumer responses to its
logo may depend less on the actual design and more on the associations formed with the brand.
However, there are several cases where our recommended guidelines will be important
independent of brand name and reputation. These include:
1. New companies – When you first create a logo and brand, they have no meaning.
2. New consumers – New international markets will interpret a logo design before the
brand‟s verbal information.
3. Changing logos – A product may have a place in the mind, but a new logo triggers new
thinking about the brand (which may be inconsistent with original positioning). If a logo
is not properly designed, it can interfere with the processing of brand information and
interpretation of the new image.
4. Mergers or brand extensions - Acquiring new companies may necessitate modifying a
logo to better capture full range of company products.
5. Marketing to children or the illiterate – Children and the illiterate will learn by visuals
before any processing of verbal information.
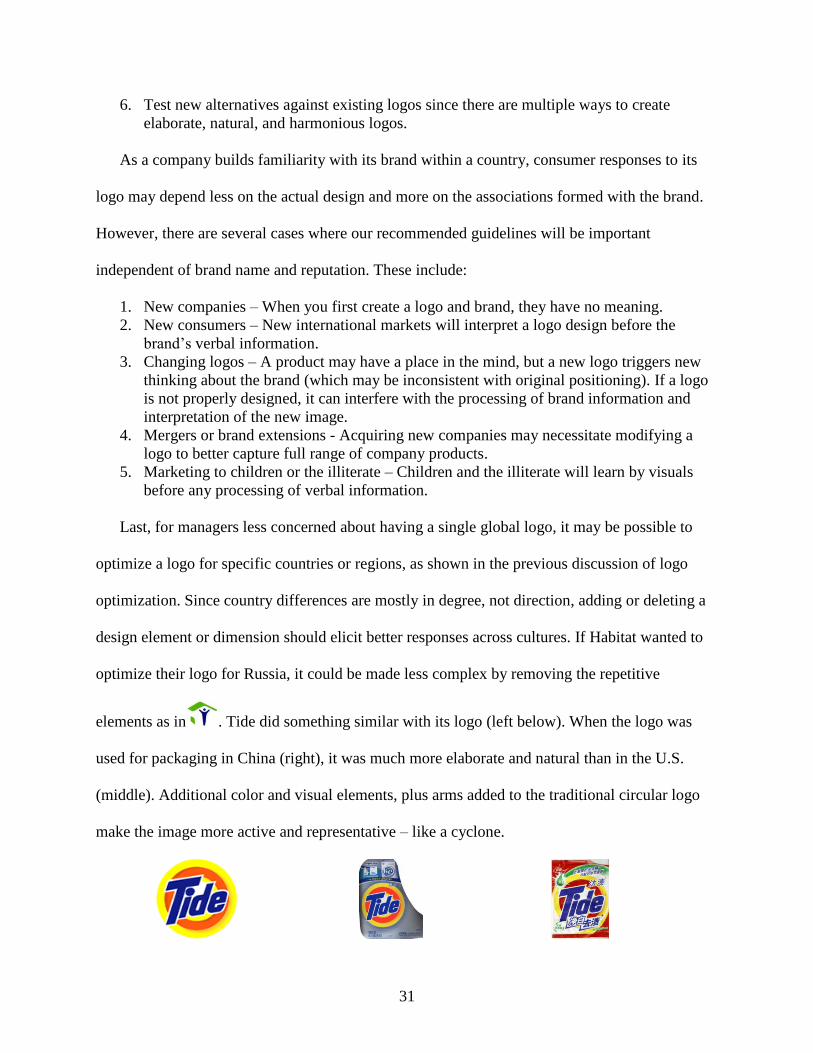
Last, for managers less concerned about having a single global logo, it may be possible to
optimize a logo for specific countries or regions, as shown in the previous discussion of logo
optimization. Since country differences are mostly in degree, not direction, adding or deleting a
design element or dimension should elicit better responses across cultures. If Habitat wanted to
optimize their logo for Russia, it could be made less complex by removing the repetitive
elements as in . Tide did something similar with its logo (left below). When the logo was
used for packaging in China (right), it was much more elaborate and natural than in the U.S.
(middle). Additional color and visual elements, plus arms added to the traditional circular logo
make the image more active and representative – like a cyclone.
32
There are at least three caveats associated with our recommended approach to logo design in
international markets. First, because our research was done in only 10 of 195 possible countries,
managers need to be cautious about generalizing results beyond the 10 studied markets. If a
manager needs to modify a design for markets not included in our study, we recommend that
managers obtain the cultural characteristics of the country from a web site such as:
http://www.geert-hofstede.com/ and match the new market to the cultural characteristics of the
markets described in Table 1. Then select the most similar country and apply the optimization
procedure discussed in section 6.2 to obtain dimensional estimates of the optimal logo design.
Second, student subjects were used to test consumer responses to consumer logos. Hence, the
observed relationships between logo characteristics and responses may have a different direction
and strength in other groups. Our respondent homogeneity may underestimate the cultural effects
of logo design characteristics. Third, our recommendations may not apply to brand/logo
combinations. Future research could assess consumer familiarity with brands; expose them to
different brand/logo combinations; and measure affect, subjective familiarity, shared meaning,
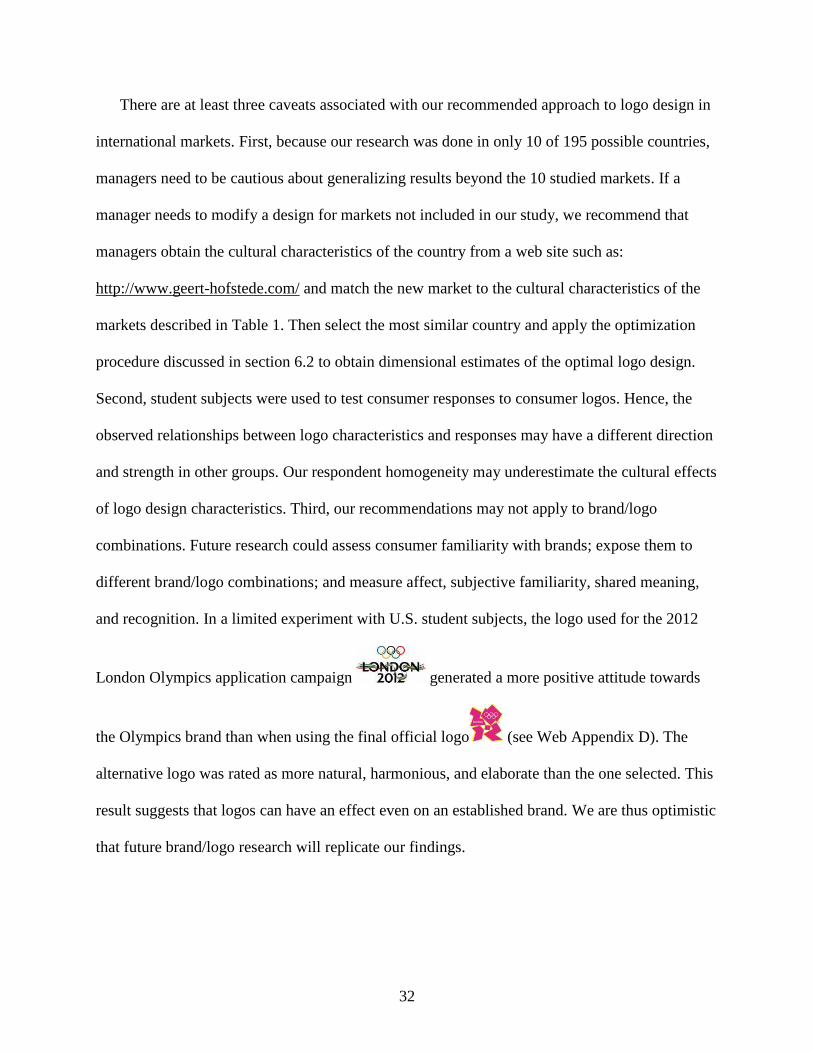
and recognition. In a limited experiment with U.S. student subjects, the logo used for the 2012
London Olympics application campaign generated a more positive attitude towards
the Olympics brand than when using the final official logo (see Web Appendix D). The
alternative logo was rated as more natural, harmonious, and elaborate than the one selected. This
result suggests that logos can have an effect even on an established brand. We are thus optimistic
that future brand/logo research will replicate our findings.

33
Appendix A
Examples and Definitions of Design Elements and Dimensions* (from Henderson and Cote 1998)
Design Characteristics High Low
Elaborate captures the concept of design richness and the ability to use
simple lines to capture the essence of something. It comprises the elements
of complexity, activeness, and depth.
Complexity is created by irregularity in the arrangement of elements,
increases in the number of elements, heterogeneity in the nature of
elements, and how ornate the design is.
Active designs are those that give the impression of motion or flow.
Depth gives the appearance of perspective or being 3-dimensional.
Natural reflects the degree to which the design depicts commonly
experienced objects. It comprises the elements of representative and
organic.
Representative the degree of realism in a design. This occurs when the
elements of an object are distilled to its most typical features.
Organic refers to natural shapes as opposed to angular and abstract
designs
Round designs are made of primarily curved lines and circular
elements.
Harmony is a congruent pattern or arrangement of parts which combines
the elements of symmetry and balance.
Symmetric designs appear as reflections along one or more axis.
Balance captures the notion that there is a center of suspension
between two weights or portions of the design.
Parallel designs contain multiple lines or elements that appear adjacent to
each other.
Repetition is the repeated use of design parts which are similar or identical
to each other – unless they are simply part of a larger whole (e.g.,
branches on a tree).
Proportion is the relationship between the horizontal and vertical
dimensions.
* Design dimensions are in bold, while design elements are italic and bold.
34
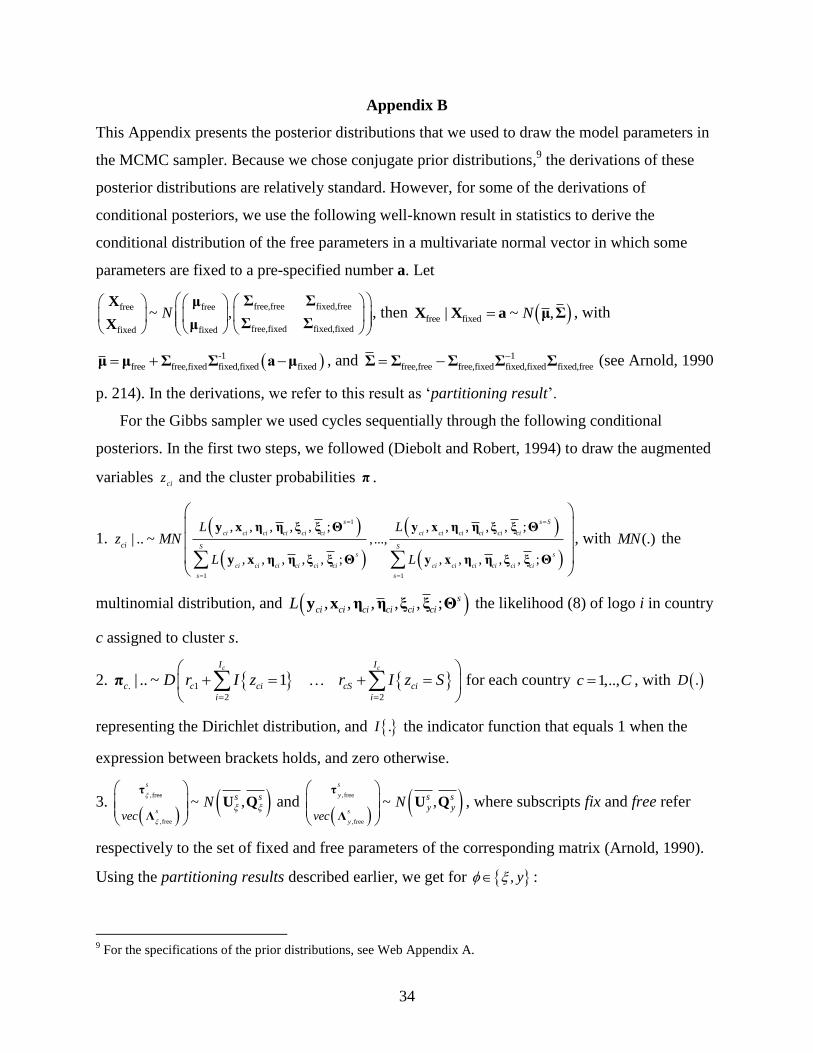
Appendix B
This Appendix presents the posterior distributions that we used to draw the model parameters in
the MCMC sampler. Because we chose conjugate prior distributions,9 the derivations of these
posterior distributions are relatively standard. However, for some of the derivations of
conditional posteriors, we use the following well-known result in statistics to derive the
conditional distribution of the free parameters in a multivariate normal vector in which some
parameters are fixed to a pre-specified number a. Let
free,free fixed,freefree free
free,fixed fixed,fixedfixed fixed
~ ,Σ ΣX μ
Σ ΣX μN
, then free fixed| ~ ,X X a μ ΣN , with
-1
free free,fixed fixed,fixed fixedμ μ Σ Σ a μ , and 1
free,free free,fixed fixed,fixed fixed,freeΣ Σ Σ Σ Σ (see Arnold, 1990
p. 214). In the derivations, we refer to this result as „partitioning result‟.
For the Gibbs sampler we used cycles sequentially through the following conditional
posteriors. In the first two steps, we followed (Diebolt and Robert, 1994) to draw the augmented
variables ci
z and the cluster probabilities π .
1.
1
1 1
, , , , , ; , , , , , ;, ...,
, , , , , ; , , , , , ;
| .. ~y x η η ξ ξ Θ y x η η ξ ξ Θ
y x η η ξ ξ Θ y x η η ξ ξ Θ
s s S
ci ci ci ci ci ci ci ci ci ci ci ci
S S
s s
ci ci ci ci ci ci ci ci ci ci ci ci
s s
ci
L L
L L
z MN
, with (.)MN the
multinomial distribution, and , , , , , ;y x η η ξ ξ Θs
ci ci ci ci ci ciL the likelihood (8) of logo i in country
c assigned to cluster s.
2. . 1
2 2
| .. ~ 1πc cI I
c c ci cS ci
i i
D r I z r I z S
for each country 1,..,c C , with .D
representing the Dirichlet distribution, and .I the indicator function that equals 1 when the
expression between brackets holds, and zero otherwise.
3.
,free
,free
~ ,τ
ΛU Q
s
s
s s
vecN
and
,free
,free
~ ,τ
ΛU Q
s
y
s
y
s s
y yvec
N
, where subscripts fix and free refer
respectively to the set of fixed and free parameters of the corresponding matrix (Arnold, 1990).
Using the partitioning results described earlier, we get for , y :
9 For the specifications of the prior distributions, see Web Appendix A.

35
,fix
,fix
,fix
1
,free ,free,fix ,fix,fix
τU
ΛU U Q Q
s
s
s
s s s s
vec
, and 1
,free,free ,free,fix ,fix,fix ,fix,freeQ Q Q Q Q
s s s s s
,
with 1
1'
1 :
1hH 0
0 V L
U Q ξ I Σ ξ
ss
s s
ci
Cs s s
ci Q ci
c i z s
,
1 : 1
1U Qci
ci
HCs sy y
c i z s h
1
1' affecthH 0
0 V L
η I Σ y
ss
yy
s s
y y
s
cih P y cih
,
1
1
1
'
1 :
1 1H 0
0 VQ ξ ξ Σ
s
s
ci
Cs s
ci ci
c i z s
,
and 1
11
'
1 : 1
1 1H 0
0 VQ η η Σ
sci
y
s
yci
HCs sy cih cih y
c i z s h
.
In the following four steps, we sequentially drew respectively 4) the scores on the subjective
logo design items, 5) logo design dimensions, 6) affect response items, and 7) affect and
subjective familiarity response dimensions. The derivations of these conditional posterior
distributions are relatively straightforward using multiplication of normal distributions.
4.
.
1,~
Σ τ Λ ξ ΣΣ Σ
Σ Σ Σ Σξ
ciqR
s s s s
s sqq cirq q q ci xqq
xqq qqr
s s s s
ciq qq xqq ciq qq xqq
ciq
x
R RN
.
5. ~ ,ξ U Qci ci
ci N
, with 111 1
' 'Q Λ Σ Λ Γ Ω Γ Ω cici ci ci ci ci ci
ci
zz z z z z z
, and
11 ' 1 '
' 'U Q Λ Σ ξ τ Γ Ω η α Ω μcici ci ci ci ci ci ci
ci ci
zz z z z z z z
ci ci
.
6. 1 ~ ,cih cici h N L Q , with
11 1'
Q Λ Σ Λ Σci ci ci ci
ci
z z z z
y y y
, and
1 1
' affect
,11 1L Q Λ Σ y τ Σci ci
cih ci ci ci
z zy y
cih y ciz z
.
7. ~ ,η U Qci cici N , with
1 1 ''
1
U Q Σ η Ω α Γ ξci
ci ci ci ci
ci ci
Hz z z z
cih ci
h
, and
11 1
Q Σ Ωci ci
ci
z z
ciH
.
In the following Step we draw the means of the subjective logo design dimensions. The
derivations are again relatively straightforward using multiplication of normal distributions.

36
8. ~ ,μ U Qs s sN , with
1 1
1 :
U Q Ω ξ H h
ci
Cs s s s s
ci
c i z s
, and
1
1 1
1 1
Q Ω HcIC
s s s
ci
c i
I z s
.
In the following 6 steps, we respectively draw the variances of 9) the rater variance of the
subjective logo design items, 10) the item variances of logo response items, 11) the item
variances of the subjective logo design characteristics, 12) the variance of the subjective logo
design dimensions, and 13) the variances of the logo design responses (affect and subjective
familiarity)
9. 2
0
1 1 1 : 1
1 1~ ,
2 2Σ x ξ
ciqc
ci
RIC Cs s s
xqq ci ciq x cirq ciq xp
c i c i z s r
IG I z s R v v
.
10. 2
affect '
0 . 1 ,
1 1 1 : 1
1 1~ ,
2 2Σ y τ Λ η
c ci
ci
I HC Cs s s s s
ypp ci ci y cihp yp yp ci h y p
c i c i z s h
IG I z s H v v
.
11. 2
'
0 .
1 1 1 : 1
1 1~ ,
2 2Σ ξ τ Λ ξ
ciqc
ci
RIC Cs s s s s
qq ci ciq q q ci p
c i c i z s r
IG I z s v v
.
12. 2
0
1 1 1 : 1
1 1~ ,
2 2Σ η η
c ci
ci
I HC Cs s s
pp ci ci ciph cip p
c i c i z s h
IG I z s H v v
, 1,2p .
13. 2
0
1 1 1 :
1 1~ ,
2 2Ω ξ μ
c
ci
IC Cs s s s
nn ci cin n n
c i c i z s
IG I z s v v
, 1,2,3n .
14. 2
'
0 .
1 1 1 :
1 1~ ,
2 2Ω η α ξ Γ
c
ci
IC Cs s s s s
mm ci cim m ci m m
c i c i z s
IG I z s v v
.
In the last step, we drew the intercepts and parameters of the structural relationships between the
logo design characteristics and responses. The derivations are based on standard derivations for
multivariate normal distributions.
15.
~ ,
α
Γ
U Q
s
s
s svec
vec
N
, with 1
: :
1
0
0
a
g
A1 ξ Ω η
G
U Qci ci
ss
s
ci z s ci z s s s
s svec
,
1
1
1'
: :
A 0
0 G
Q 1 ξ 1 ξ Ω
s
sci ci
s s
ci z s ci z s
, and : cii z s the logos assigned to cluster
s.
37
References
R.B. Adams, Jr. 2003. Effects of Gaze on Amygdala Sensitivity to Anger and Fear Faces.
Science. 300(June) 1536.
A. Alashban, Hayes, L., Zinkhan, G.M., Balazs, A. 2002. International Brand
Standardization/Adaptation: Antecedents and Consequences. Journal of International
Marketing. 10(3) 22-48.
P. Anand, Sternthal, B. 1991. Perceptual Fluency and Affect without Recognition. Memory and
Cognition. 19(3) 293-300.
S.F. Arnold. 1990. Mathematical Statistics. Prentice-Hall, Englewood Cliffs, New Jersey.
W.A. Arrindell, Eisemann, M., Oei, T., V.Caballo, Sanavio, E., Sica, C., Bages, N., Feldman, L.,
Torres, B., Iwawaki, S., Hatzichristou, C., Castro, J., Cnalda, G., Furnham, A., Ende, J.v.
2004. Phobic Anxiety in 11 Nations: Part II. Hofstede‟s Dimensions of National Cultures
Predict National-Level Variations. Personality and Individual Differences. 37 627-643.
H. Baumgartner, Steenkamp, J.B.E.M. 2001. Response Styles in Marketing Research: A Cross-
National Investigation. Journal of Marketing Research. 38(2) 143-156.
S. Chib. 1995. Marginal Likelihood from the Gibbs Output. Journal of the American Statistical
Association. 90(December) 1313-1321.
A.M. Colman, Wober, J.M., Norris, C.E. 1995. Sight Bites: A Study of Viewers' Impressions of
Corporate Logos in the Communications Industry. Journal of the Market Research Society.
37(4) 405.
W.S. DeSarbo, Benedetto, C.A.D., Jedidi, K., Song, M. 2006. Identifying Sources of
Heterogeneity for Empirically Deriving Strategic Types: A Constrained Finite-Mixture
Structural-Equation Methodology. Management Science. 52(6) 909-924.

38
R.P. DeShon. 1998. A Cautionary Note on Measurement Error Corrections in Structural
Equation Models. Psychological Methods. 3(4) 412-423.
J. Diebolt, Robert, C.P. 1994. Estimation of Finite Mixture Distributions through Bayesian
Sampling. Journal of the Royal Statistical Society: Series B. 56 363-375.
J.A. Edell, Staelin, R. 1983. The Information Processing of Pictures in Print Advertisements.
Journal of Consumer Research. 10(1) 45-61.
P. Ekman. 1998. Introduction, Afterword and Commentaries to Darwin. Oxford University
Press, City.
H.C. Ellis, Parente, F.J., Shumate, E.C. 1974. Meaningfulness, Perceptual Grouping, and
Organization in Recognition Memory. Journal of Experimental Psychology. 102(2) 308-313.
T. Erdem, Zhao, Y., Valenzuela, A. 2004. Performance of Store Brands: A Cross-Country
Analysis of Consumer Store-Brand Preferences, Perceptions, and Risk. Journal of Marketing
Research. 41(February) 86-100.
S. Frühwirth-Schnatter. 2006. Finite Mixture and Markov Switching Models. Springer, New
York.
A. Gelman, Pardoe, I. 2006. Bayesian Measures of Explained Variance and Pooling in Multilevel
(Hierarchical) Models. Technometrics. 48(2) 241-251.
J. Geweke. 1992. Evaluating the Accuracy of Sampling-Based Approaches to the Calculation of
Posterior Moments. Oxford University Press, City.
R. Grewal, Cote, J.A., Baumgartner, H. 2004. Multicollinearity and Measurement Error in
Structural Equation Models: Implications for Theory Testing. Marketing Science. 23(4) 519-
529.

39
Z. Gurhan-Canli, Maheswaran, D. 2000. Cultural Variations in Country-of-Origin Effects.
Journal of Marketing Research. 37(August) 309-317.
P.W. Henderson, Cote, J.A. 1998. Guidelines for Selecting or Modifying Logos. Journal of
Marketing. 62(April) 14-30.
P.W. Henderson, Cote, J.A., Leong, S.M., Schmitt, B. 2003. Building Strong Brands in Asia:
Selecting the Visual Components of Image to Maximize Brand Strength. International
Journal of Research in Marketing. 20(4) 297-313.
P.W. Henderson, Giese, J.L., Cote, J.A. 2004. Impression Management Using Typeface Design.
Journal of Marketing. 68(4) 60-72.
G. Hofstede. 1983. National Cultures in Four Dimensions: A Research-Based Theory of Cultural
Differences among Nations. International Studies of Management and Organization.
13(Spring/Summer) 46-74.
G. Hofstede. 2001. Culture's Consequences: Comparing Values, Behaviors, Institutions and
Organizations across Nations. Sage Publications, Thousand Oaks, California.
K. Jedidi, Jagpal, H.S., DeSarbo, W.S. 1997. Finite-Mixture Structural Equation Models for
Response-Based Segmentation and Unobserved Heterogeneity. Marketing Science. 16(1) 39-
59.
D. Jones. 1996. An Evolutionary Perspective on Physical Attractiveness. Evolutionary
Anthropology. 5 97-109.
J.N. Kapferer. 1992. How Global are Global Brands? , City.
C. Kohli, Suri, R., Thakor, M. 2002. Creating effective logos: Insights from theory and practice.
Business Horizons. 45(3) 58-64.

40
Y. Kuwayama. 1973. Trademark and Symbols Vol. 1: Alphabetical Designs and Vol. 2: Symbolic
Designs. Van Nostrand Reinhold Co., New York NY.
P.J. Lenk, DeSarbo, W.S. 2000. Bayesian Inference for Finite Mixtures of Generalized Linear
Models with Random Effects. Psychometrika. 65(1) 93-119.
K.A. Lutz, Lutz, R.J. 1977. Effects of Interactive Imagery on Learning: Application to
Advertising. Journal of Applied Psychology. 62(4) 493-498.
C. Martindale, Moore, K., West, A. 1988. Relationship of Preference Judgments to Typicality,
Novelty and Mere Exposure. Empirical Studies in the Arts. 6(1) 79-96.
N. Methven, McGurran, A. 2007. No-Go Logo: The Olympic Design Fiasco. City.
G.H. Orians, Heerwagen, J.H. 1992. Evolved Responses to Landscape. City.
U.R. Orth, Malkewitz, K. 2008. Holistic Package Design and Consumer Brand Impressions.
Journal of Marketing. 72 64-81.
C. Perfetti, Liu, Y., Tan, L.H. 2005. The Lexical Constituency Model: Some Implications of
Research on Chinese for General Theories of Reading. Psychological Review. 112(1) 43-59.
N. Pittard, Ewing, M., Jevons, C. 2007. Aesthetic Theory and Logo Design: Examining
Consumer Response to Proportion across Cultures. International Marketing Review. 24(4)
457-473.
A.E. Raftery, Lewis, S. 1992. How Many Iterations in the Gibbs Sampler? Oxford University
Press, City.
J.E. Raymond, Fensek, M.J., Tavassoli, N.T. 2003. Selective Attention Determines Emotional
Responses to Novel Visual Stimuli. Psychological Science. 14(November) 537-542.
S. Richardson, Green, P.J. 1997. On Bayesian Analysis of Mixtures with an Unknown Number
of Components. Journal of the Royal Statistical Society, Series B. 59(4) 731-792.

41
H.K. Rodewald, Bosma, L.F. 1972. Information Transmission in Brief Exposures as a Function
of Association Value. Perceptual and Motor Skill. 34(April) 420-422.
P.E. Rossi, Allenby, G.M. 2003. Bayesian Statistics and Marketing. Marketing Science. 22(3)
304-328.
P.E. Rossi, Allenby, G.M., McCulloch, R. 2005. Bayesian Statistics and Marketing. Wiley,
Hoboken, NJ.
L.S. Seifert. 1992. Pictures as a Means of Conveying Information. The Journal of General
Psychology. 119(3) 279-287.
D. Shinar, Dewar, R.E., Summala, H., Zakowska, L. 2003. Traffic Sign Symbol Comprehension:
A Cross-Cultural Study. Ergonomics. 46(15) 1549-1565.
J.B.E.M. Steenkamp, Baumgartner, H. 1998. Assessing Measurement Invariance in Cross-
National Consumer Research. Journal of Consumer Research. 25(1) 78-90.
F. ter Hofstede, Steenkamp, J.-B.E.M., Wedel, M. 1999. International Market Segmentation
Based on Consumer-Product Relations. Journal of Marketing Research. 36(February) 1-17.
R.B. Zajonc. 1968. Attitudinal Effects of Mere Exposure. Journal of Personality and Social
Psychology. Monograph 9(No. 2 part 2) 1-27.
Y. Zhang, Feick, L., Price, L.J. 2006. The Impact of Self-Construal on Aesthetic Preference for
Angular Versus Rounded Shapes. Personality and Social Psychology Bulletin. 32(June) 794-
805.