Cross-Cutting Themes - Academic Plan Enhance Value for Students and Faculty International...
24
-
Upload
jessie-matts -
Category
Documents
-
view
219 -
download
1
Transcript of Cross-Cutting Themes - Academic Plan Enhance Value for Students and Faculty International...


Cross-Cutting Themes - Academic Plan Cross-Cutting Themes - Academic Plan
• Enhance Value for Students and Faculty• International Opportunities • Experiential Learning• Interdisciplinary Solutions• Online Learning• Innovation and Partnerships• Self-Reliance

Why Such Value-based Themes?Why Such Value-based Themes?
• Relevance in the 21st Century • Revenue - self-reliance; limited state suppport• Quality – attract/retain good students & faculty• Institutional Pride• Societal contributions – local to global• Scholarly excellence
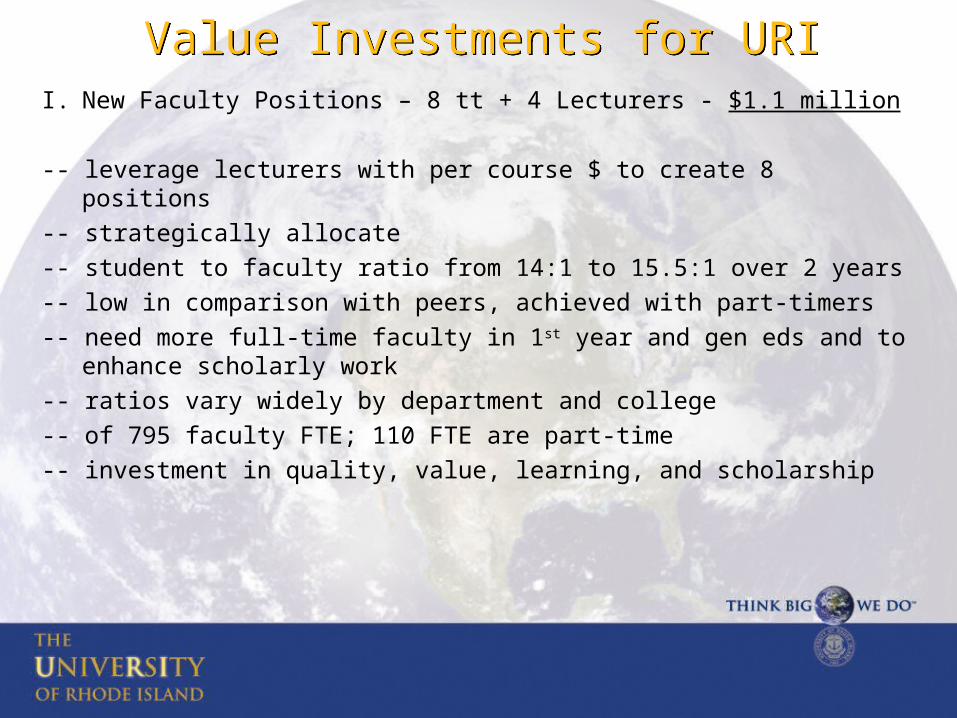
Value Investments for URIValue Investments for URII. New Faculty Positions – 8 tt + 4 Lecturers - $1.1 million
-- leverage lecturers with per course $ to create 8 positions
-- strategically allocate
-- student to faculty ratio from 14:1 to 15.5:1 over 2 years
-- low in comparison with peers, achieved with part-timers
-- need more full-time faculty in 1st year and gen eds and to enhance scholarly work
-- ratios vary widely by department and college
-- of 795 faculty FTE; 110 FTE are part-time
-- investment in quality, value, learning, and scholarship


Student to Faculty Ratio ComparisonsStudent to Faculty Ratio Comparisons
URI – from 14:1 to 15.5:1 --- target ~16.5:1
UCONN - 17:1 PSU – 17:1
UMASS - 18:1 UILL - 17:1
UNH - 18:1 UFL - 22:1
UVM - 16:1 UTA - 18:1
URI achieves lower ratio with disproportionate reliance on part-time faculty teaching intro courses

Value Investments for URIValue Investments for URI
II. Global Learning/International Opportunities: $250,000
-- leadership to oversee all global activities
-- ESL partnership
-- institutional partnerships, intl students, travel courses
III. Coordinator of Summer Programs: $150,000
-- attractive campus/location - summer session under-utilized
-- online and on-campus – attract URI and other students
-- traditional courses and creative new programming
-- generate revenue – would pay for itself

Value Investments for URIValue Investments for URIIV. Liaison for Academic Internships: $100,000
-- expand experiential learning – staff support between colleges, UC, and Career Center
-- build connections and partnerships on- and off-campus
-- quality credit-bearing internships
-- student employment and institutional reputation
V. Graduate Research Tuition Differential Fellow: $150,000
-- current program is at $1.3 m needs to grow to $2 m
-- GTA program at $12.5 m
-- supports students, enhances faculty research and grant competitiveness, creates vibrant graduate programs

Financial AidFinancial Aid• Driver of revenue of our increasingly tuition dependant
budget• Driver of our enrollment, retention, diversity, and student
quality goals as well as our financial goals• Means by which we address the access, affordability, and
quality aspects of our mission• Despite growth in our aid budget, we are increasingly not
competitive in yielding quality OS students• Our OS discount rate of 18% is below NE doctoral peers
(33%) and privates (42 – 45%)• Our “price”, “value”, “aid” equation is out of balance

Note: * FY00-FY06, GO Debt Service is budgeted in the Department of Administration (prior years’ data normalized).* Effective FY07, state appropriation does not include GO Debt Service Pass-through* Asset Protection and other RICAP projects budgeted separately.
State Appropriation, Tuition and Fees, Student AidState Appropriation, Tuition and Fees, Student Aid

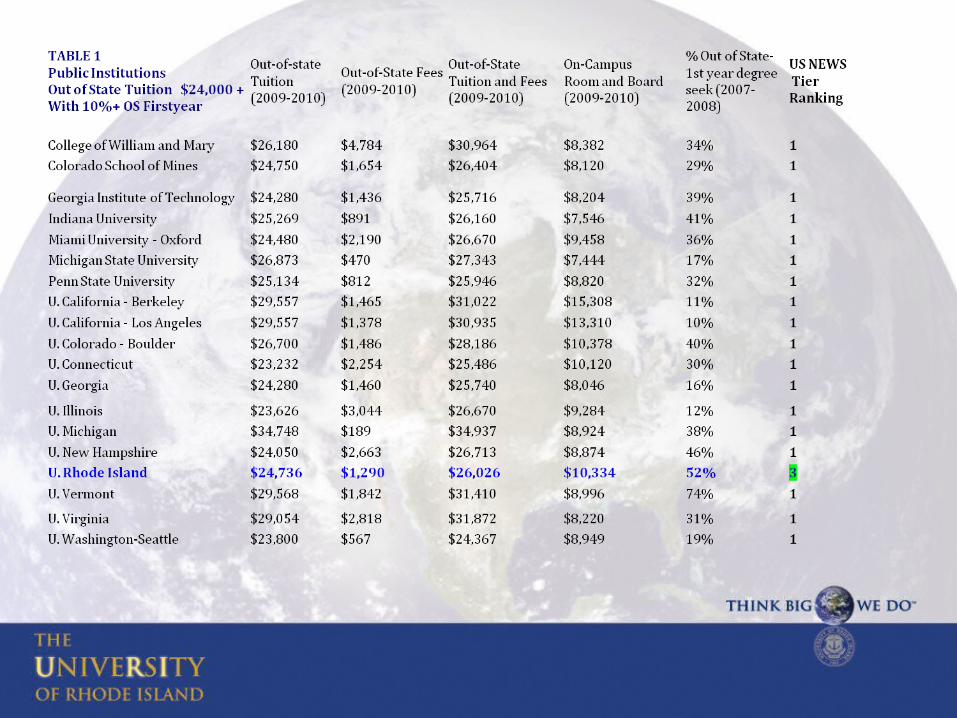
Undergraduate Tuition ComparisonUndergraduate Tuition Comparison
Undergraduate Tuition & Mandatory Fees (2009/2010 rates)
In-State Out-State Room/Board
• University of Vermont $13,556 $31,412 $8996• University of New Hampshire $12,461 $26,750 $9112• University of Connecticut $9886 $25,846 $10,120• University of Maine $9626 $23,876 $8348• University of Massachusetts $11,732 $23,229 $8276• University of Rhode Island $9528 $26,026 $10,550
In-State Rank: 6th lowest Out-State Rank: 3rd Highest Room & Board: Highest
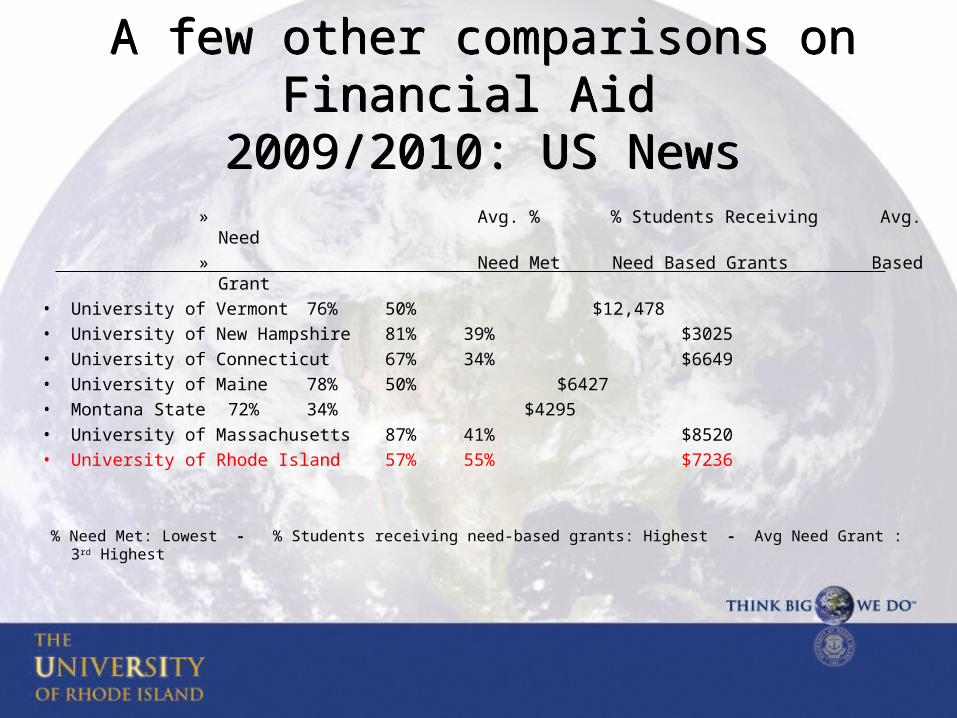
A few other comparisons on Financial Aid 2009/2010: US News
A few other comparisons on Financial Aid 2009/2010: US News
» Avg. % % Students Receiving Avg. Need » Need Met Need Based Grants Based Grant
• University of Vermont 76% 50% $12,478• University of New Hampshire 81% 39% $3025• University of Connecticut 67% 34% $6649 • University of Maine 78% 50% $6427• Montana State 72% 34% $4295• University of Massachusetts 87% 41% $8520• University of Rhode Island 57% 55% $7236
% Need Met: Lowest - % Students receiving need-based grants: Highest - Avg Need Grant : 3rd Highest

Financial Aid, Scholarships & Tuition Remission: FY 2010, Total $60M
Financial Aid, Scholarships & Tuition Remission: FY 2010, Total $60M
Categories of aid Amount/% of Total
# Students % of entire student body
General (Need based grants, transfer, retention, etc)
$18.6 (31%) 7886 48%
Centennial Merit Program $12.5 (21%) 1980 12%
Graduate Assistants, Tuition Differential & Fellowships
$7.5 (12.5%) 485 3%
Hardge Grant, Crusade, DiMaio, Diversity $7.5 (12.5%) 1124 7%
Athletics $7.2 (12%) 309 2%
Tuition Remissions (waivers, unemployed, Nat’l Guard, etc)
$5.2 (9%) 763 5%
Misc (Music, Loan Match, NEBHE, etc) $1.3 (2%) 650 4%

Financial Aid/Discounting NeedsFinancial Aid/Discounting Needs
$10 million dollar increase in Aid Budget for FY 12
-- increase discount to 32%
-- ~ $6.4 million for recruitment/yield of OS freshman
-- ~ $3 million for retention of current students
-- ~ $600K for IS recruitment/yield
-- projected difference of 1460 vs.1160 OS students
--allows enhanced selectivity and quality – yield 1100-1200 SATrange vs. <900 range

Student Financial Aid, Scholarships & Tuition Waivers: Fiscal Years 2007 - 2012
Student Financial Aid, Scholarships & Tuition Waivers: Fiscal Years 2007 - 2012
• FY 07 $39.1M
• FY 08 $47.7M
• FY 09 $51.9M
• FY 10 (mid-year) $60M
• FY 11 (allocation) $70.4M
• FY 12 request $80.4M

Financial Aid DilemmaFinancial Aid Dilemma• Not sustainable – relying too much on new $• Strategic allocation of aid – “net revenue” model
Potential Other Sources of Aid
Private giving: targeted & unrestricted aid endowment (will take time)
Careful scrutiny of cost/value equation in GF budget
Reallocation within & across fund lines – is this only a GF responsibility?


Discount Rate ComparisonDiscount Rate Comparison
Peer Comparison (2007 Data):
• University of New Hampshire 31%• University of Maine 28%• University of Connecticut 27%• University of Massachusetts 22%• Montana State 13%• University of Rhode Island 17%• University of Vermont 17%
(Based on 2007 data, Minter & Assoc, 2008)

A few other comparisons on Financial Aid 2009/2010: US News: Part 2
A few other comparisons on Financial Aid 2009/2010: US News: Part 2
» Avg Financial Avg Need-Based Avg Non-Need
» Aid Package Loan (excludes Plus/Private)
Grant/Scholarship
• University of Vermont $19,519 $6061 $2232• University of New Hampshire $17,910 $3848 $7552• University of Connecticut $11,048 $4305 $6080• University of Maine $11,369 $5061 $11,399• Montana State $9834 $4640 $1813• University of Massachusetts $13,282 $4374 $3193• University of Rhode Island $12,654 $6557 $5468
Avg Financial Aid Package Rank: 4th Avg Need-Based Loan Rank: 1st Avg Non-Need: 4th