Cross-Border Trading as a Mechanism for Implicit Capital ...ltesar/pdf/ADRsApril2003.pdfCross-Border...
44
Cross-Border Trading as a Mechanism for Implicit Capital Flight: ADRs, CEDEARs and the Argentine Crisis Sebastian Auguste University of Michigan Kathryn M.E. Dominguez University of Michigan and NBER Herman Kamil University of Michigan Linda L. Tesar University of Michigan and NBER Abstract This paper examines the surprising performance of the Argentine stock market in the midst of the country’s most recent financial crisis and the role played by cross-listed stocks in Argentine capital flight. Although Argentine investors were subject to capital controls, they were able to purchase cross-listed stocks for pesos in Argentina, convert them into dollar-denominated shares, re-sell them in New York and deposit the dollar proceeds in U.S. bank accounts. In the paper we show that: (1) ADR discounts went as high as 45% (indicating that Argentine investors were willing to pay significant amounts in order to legally move their funds abroad), (2) the implicit peso-dollar exchange rate on the eve of the devaluation anticipated a 42% fall in the value of the peso relative to the dollar, (3) local market factors in Argentina became more important in pricing peso denominated stocks with associated ADRs, while the same stocks in New York were mainly priced based on global factors, (4) capital outflow using the ADR and CEDEAR markets was substantial (our estimate for ADRs is between $835 million and $3.4 billion) . November 2002 Revised: March 2003 We are grateful to Ariel Burstein and Juan Carlos Hallak for planting the seed for this paper last fall. We would also like to thank seminar participants at the University of Michigan Business School Argentina Conference, the University of Wisconsin, USC, the International Finance Division of the Board of Governors of the Federal Reserve System, the research division at the Inernational Monetary Fund, the NBER and Jorge Alberti, Yxa Bazan, Ben Chabot, Augusto Darget, Florencia Donovan, Jack Ferrer, Gaston Gelos, Andrew Karolyi, Patrick Kehoe, Maria Jose Luna, Tomas Sarmiento, Sergio Schmukler, and Claudio Zuchovicki for helpful suggestions and comments. We especially thank Juan Ignacio Gomez Vega for help with finding data.
Transcript of Cross-Border Trading as a Mechanism for Implicit Capital ...ltesar/pdf/ADRsApril2003.pdfCross-Border...

Cross-Border Trading as a Mechanism for Implicit Capital Flight: ADRs, CEDEARs and the Argentine Crisis
Sebastian Auguste
University of Michigan
Kathryn M.E. Dominguez University of Michigan and NBER
Herman Kamil
University of Michigan
Linda L. Tesar University of Michigan and NBER
Abstract
This paper examines the surprising performance of the Argentine stock market in the midst of the country’s most recent financial crisis and the role played by cross-listed stocks in Argentine capital flight. Although Argentine investors were subject to capital controls, they were able to purchase cross-listed stocks for pesos in Argentina, convert them into dollar-denominated shares, re-sell them in New York and deposit the dollar proceeds in U.S. bank accounts. In the paper we show that: (1) ADR discounts went as high as 45% (indicating that Argentine investors were willing to pay significant amounts in order to legally move their funds abroad), (2) the implicit peso-dollar exchange rate on the eve of the devaluation anticipated a 42% fall in the value of the peso relative to the dollar, (3) local market factors in Argentina became more important in pricing peso denominated stocks with associated ADRs, while the same stocks in New York were mainly priced based on global factors, (4) capital outflow using the ADR and CEDEAR markets was substantial (our estimate for ADRs is between $835 million and $3.4 billion) .
November 2002 Revised: March 2003
We are grateful to Ariel Burstein and Juan Carlos Hallak for planting the seed for this paper last fall. We would also like to thank seminar participants at the University of Michigan Business School Argentina Conference, the University of Wisconsin, USC, the International Finance Division of the Board of Governors of the Federal Reserve System, the research division at the Inernational Monetary Fund, the NBER and Jorge Alberti, Yxa Bazan, Ben Chabot, Augusto Darget, Florencia Donovan, Jack Ferrer, Gaston Gelos, Andrew Karolyi, Patrick Kehoe, Maria Jose Luna, Tomas Sarmiento, Sergio Schmukler, and Claudio Zuchovicki for helpful suggestions and comments. We especially thank Juan Ignacio Gomez Vega for help with finding data.

1
“In the emerging Markets, the star performance came from Argentina. The Merval rose 25.6%. This rise occurred when the country’s fundamentals took a distinct turn for the worse. Draconian capital controls were introduced to preempt a massive build-up of capital flight... The reason the market is going up is simply that the stock market is seen as a way of protecting assets and a means, by ADR conversion, of getting money out of Argentina.” Investavenue.com, December 10, 2001.
“Buenos Aires' normally sleepy stock exchange jumped 25% in the week following Cavallo's announcement. The short-lived rally was prompted by investors who loaded up on shares in a handful of Argentine blue chips, then converted them into their corresponding American depositary receipts, sold them on the New York Stock Exchange for dollars, and parked the proceeds abroad. Since few U.S. investors want these shares, Argentines have to sell their ADRs at a loss. But apparently those in search of a safe haven for their money are willing to pay a price”. Argentines Dust Off Their Survival Skills: They're using a vast array of tricks to outwit capital controls, Business Week, December 24, 2001.
1. Introduction In December 2001, after a decade of open capital markets, the Argentine government imposed a series of financial market controls in an ultimately unsuccessful bid to forestall economic crisis. This paper studies the impact of these controls on four aspects of Argentine financial markets. First, we document how Argentine investors were able to transfer wealth abroad using cross-listed securities and thereby circumvent the intent, if not the letter, of the capital control laws. Second, we study the role these controls played in limiting financial market arbitrage for cross-listed securities. Third, we show that the Argentine stock market served as a shadow foreign exchange market during the capital control regime, which in turn, allows us to back out the market’s implicit forecast of the size of the devaluation. And fourth, we test whether the imposition of controls led to changes in the underlying pricing structure of cross-listed stocks priced in pesos in Argentina and in dollars in New York. Although the exact timing and causes of Argentina’s economic fall from grace are contentious, there is little disagreement that by the last quarter of 2001 Argentina was on the brink of a full-scale collapse.1 Between July and November
1 Mussa (2002) makes the case that the persistent inability of the Argentine government to run responsible fiscal policy was the primary cause of the economic collapse. Others point to the deleterious effects of an over-valued currency on exports (see, for example, Feldstein (2002)) and the sudden stop in foreign capital inflows (Calvo, Izquierdo, and Talvi (2002)).
2
2001, Argentines withdrew over $15 billion from banks -- on November 30, 2001 alone, banks saw withdrawals of $1.3 billion. On December 3rd, in a desperate effort to prevent further massive capital outflows, financial market controls were established (these are known as the “Corralito”), which among other restrictions, imposed a ceiling of $1,000 a month on bank withdrawals.2 In January the Argentine peso was officially devalued, all bank deposits and debts were “pesofied”, and U.S. dollar accounts were no longer permitted. In contrast to the experiences of other emerging markets, the crisis appears to have been “good news” for the Argentine stock market.3 Figure 1 shows the stock market indices (denominated in dollars) in Argentina, Malaysia, Mexico and Thailand during their respective financial crises.4 The stock markets in Malaysia, Mexico and Thailand stagnated in the weeks preceding their currency devaluations, and then sharply declined after devaluation. While the market in Argentina was also in a slump two months before the devaluation, the Corralito triggered a 50 percent expansion of the market. One interpretation of the stock market run up in Argentina is that for some reason investors viewed the likely devaluation of the peso as beneficial for firms, whereas in other countries such crises are generally harmful.5 The contention of this paper, however, is that the idiosyncratic reaction of the Argentine stock market was largely due to the specific restrictions in the Corralito which allowed investors to use their frozen bank deposits to purchase stocks listed on the Argentine exchange, and, in so doing, provided a legal mechanism for transferring funds abroad via cross-listed securities.
[Figure 1 here] The two types of cross-listed securities we examine are American Depositary Receipts (ADRs) and Certificados de Depositos Argentinos (CEDEARS). ADRs are shares of non-U.S. (in this case Argentine) corporations sold in the U.S (and denominated in dollars).6 CEDEARs are shares of non-Argentine firms (mostly
2 A literal translation of “Corralito” is little corral. It is also the word for “playpen.” 3 It is interesting to note that the Argentine stock market began its upturn when the Corralito was first imposed on December 3rd, and then rose even higher after President De La Rua and Finance Minister Domingo Cavallo resigned (December 19 and 20th) when expectations of an impending devaluation intensified. It was not until after the announcement of the devaluation (on January 7th) that the stock market, measured in US dollars, began its decline. 4 The vertical line on the figure marks the corresponding devaluation date for each country. The flat intervals in the plot indicate periods when the Argentine market was closed. 5 See, for example, Forbes (2002). 6 Although Depositary Receipts (DRs) can be issued in a number of markets, all of the cross-listed firms from Argentina issued DRs in the United States; consequently, we will refer to Argentine cross-listed shares as ADRs.
3
U.S. firms) that are cross-listed on the Argentine exchange and sold for pesos.7 The discounts we find on cross-listed stocks suggest that Argentine investors were willing to pay a substantial price to move their deposits out of Argentina through the conversion of local shares to shares abroad. At their peak, some ADRs were trading at a discount of in excess of 45 cents on the dollar. A rough estimate is that ADR transactions alone resulted in a transfer of assets abroad of roughly $835 million to $3.4 billion between December 1, 2001 and May 31, 2002. There is an extensive literature on ADRs and their role in the global integration of financial markets (see, for example, the survey by Karolyi (1998)). Cross-listing of foreign stocks on U.S. exchanges allows firms in foreign markets to enjoy the advantages of greater liquidity, transparency and access to the U.S. capital market.8 From the perspective of U.S. investors, ADRs are a convenient way of obtaining global diversification.9 Cross-listing of U.S. stocks on other exchanges, such as CEDEARs, has not been as widely studied but this type of activity clearly provides the same sorts of diversification benefits to local investors. The unusual set of circumstances in Argentina surrounding the Corralito give cross-listed securities a new, and previously unstudied, role as a mechanism for capital flight.10 A general message of our analysis is that once having established ADRs and other kinds of contractual arrangements across markets, it may be difficult if not impossible to reverse the process of capital market integration with (even draconian) capital controls. Although the exact set of circumstances that existed in Argentina are unlikely to occur elsewhere, the recent dramatic increase in the number of ADRs issued by firms in emerging markets suggests that capital control measures may become a less viable policy tool for governments in the midst of financial market crisis. Indeed, as of the time of this writing, Venezuela is experiencing financial turmoil, has imposed capital controls and until the ADR loophole was closed, investors were trading heavily in home shares with underlying ADRs on the local exchange.
7 Most CEDEARs are issued by Deustche Bank, which acts as the depositary bank, and is the only authorized institution that can transform CEDEARs back into shares sold on U.S. exchanges. 8 See, for example, Alexander, Eun and Jankiramanan (1987), Foerster and Karolyi (1999), Miller (1999), Ahearne, Griever, and Warnock (2001), and Doidge, Karolyi and Stulz (2002). 9 See, for example, Officer and Hoffmeister (1987), Wahab and Khandala (1993), and Jiang (1998). Domovitz, Glen and Madhavan (1997), Errunza, Hogan and Hung (1999), and Karolyi and Stulz (2002) examine the broader influences of ADR programs on the development and integration of markets. 10 Melvin (2002) also documents the unusual behavior of the Argentine stock market and the role of ADRs during the Corralito period.

4
The paper is organized as follows. Section 2 provides details about the specific restrictions of the Corralito and defines the arbitrage premium/discount between local and U.S. ADR prices. Section 3 examines the behavior of non-cross-listed and cross-listed returns pre- and post-Corralito and calculates arbitrage bounds for cross-listed securities based on the transactions costs that U.S. and Argentine investors faced during the December 2001 to July 2002 period. We then use the cross-listed security premium to estimate the market’s expectation of the devaluation. Section 4 examines the market factors that influenced cross-listed portfolio returns in New York and Argentina before and after the imposition of the Corralito. And section 5 concludes. 2. ADRs, CEDEARs, the Corralito, and the Argentine Stock Market In principle the performance of the Argentine stock market in the pre-devaluation period is puzzling. Just one month before a widely anticipated devaluation of the peso and in the midst of a staggering financial crisis with massive capital outflows and bank runs, the stock market was booming. To place the recent performance of the stock market in some perspective, Figure 2 shows Argentina’s stock market index, the Merval, in pesos and U.S. dollars, from January 1990 to April 2002. Argentina’s currency board was established in March 1991, triggering a stock market boom that lasted until June 1992. The market was negatively affected by the Mexican crisis in late 1994, and again by the Asian crisis in 1997, but stayed well above its pre-March 1991 level. Beginning in early 2000, however, the market began a steady decline, sliding down to levels not seen in a decade.
[Figure 2 here]
2.1 The Corralito By mid-2001, years of stagnating economic growth, lagging exports, weak banks and mounting fiscal deficits had taken their toll. In October negotiations over a bailout package with the IMF failed and Argentina was on the brink of financial collapse. To stave off a run on banks and a speculative attack on the peso, on December 1, 2001 Finance Minister Cavallo announced a series of restrictions on bank withdrawals and dollar transfers abroad. Under the Corralito, depositors were limited to withdrawals of 250 pesos per week per account11 but could
11 Perhaps unsurprisingly there was a sudden increase in the number of new bank accounts in early December. The government promptly changed the regulations so that the deposit limits applied per person rather than per account. According to the press, some 500,000 accounts were opened in the two days following the imposition of bank restrictions.

5
access their accounts to transfer funds within the banking system.12 Wire transfers required Central Bank approval, foreign currency futures transactions were prohibited, and in effect, all investors, foreign and domestic, were prohibited from transferring funds abroad. The restrictions were announced as temporary measures that would remain in place until the danger of the speculative attack had passed. The Corralito, did not, however, restrict investors from trading Argentine securities including those that were cross-listed on another market. Indeed, to do so would have seriously destabilized the local market as it would have prevented investors from trading in some of the largest and most liquid stocks on the market. The ADR13 “loophole” worked as follows: Argentine residents were allowed to use bank deposits in excess of the $1,000 monthly ceiling to purchase Argentine stocks. If a stock happened to be cross-listed in another country those shares could be legally converted from Argentine shares into ADRs. The ADRs could then be sold in the United States and the dollar proceeds deposited in a U.S. account. Under normal circumstances the dollar proceeds would appear in the Argentine Balance of Payments as a capital inflow, as U.S. residents have acquired claims on Argentine firms. Under the Corralito, however, the capital inflows did not occur, and the dollars and/or shares remained outside of Argentina. In effect, the ADR “loophole” allowed Argentines to transfer monies abroad, but the transactions did not result directly in a fall in Argentina’s international reserves (or a fall in Argentine bank deposits). ADR conversions, however, did reduce the number of (underlying) shares available on La Bolsa. In order to understand how the ADR loophole influenced the relative prices of ADRs in Buenos Aires and New York, it is useful to define the pay-offs of stocks listed in the two markets. We will use the following definitions:
12 Some of the original withdrawal limits were eventually modified, though the main restrictions on capital outflow remained in place until December 2, 2002 (exactly one year after they were first introduced). See Appendix 1 for a detailed timeline of the changes in financial market regulations in Argentina beginning in October 2001. 13 In the discussion that follows we will refer only to ADRs in explaining the capital control “loophole.” The same conditions apply to CEDEARs, which involved purchasing non-Argentine stocks (mostly U.S. stocks) for pesos, converting them back to their underlying shares, and re-selling them for dollars in the U.S.
6
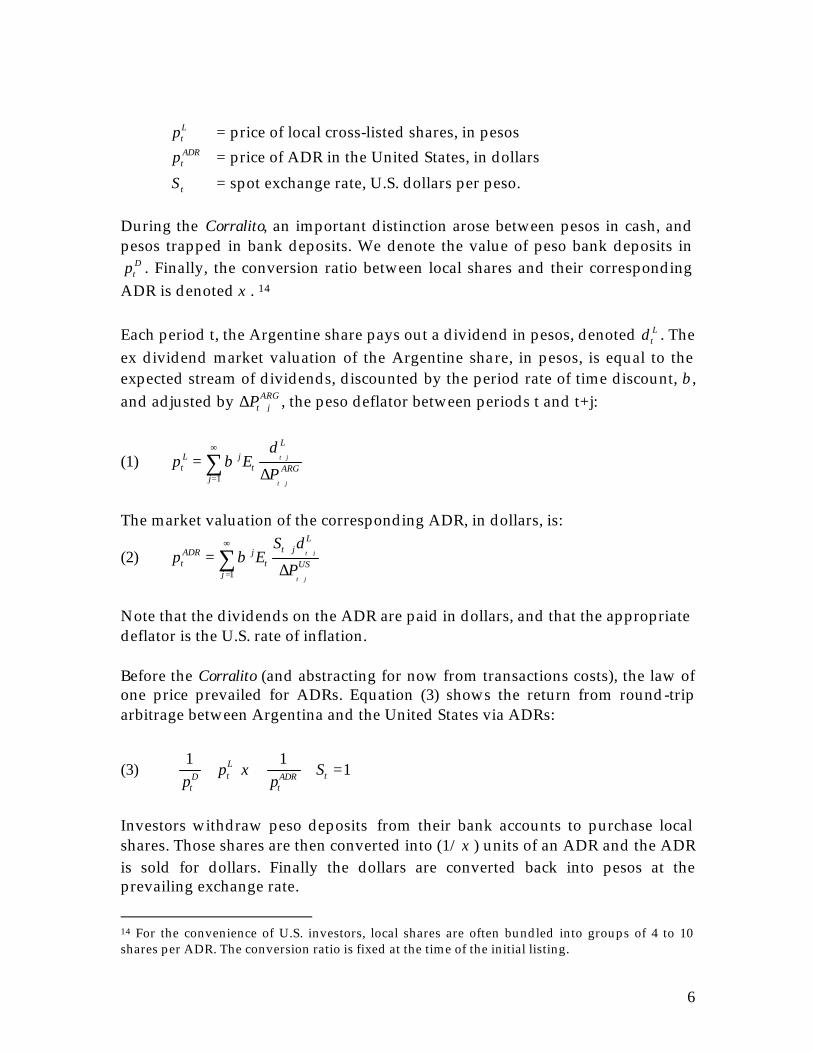
Ltp = price of local cross-listed shares, in pesos ADRtp = price of ADR in the United States, in dollars
tS = spot exchange rate, U.S. dollars per peso. During the Corralito, an important distinction arose between pesos in cash, and pesos trapped in bank deposits. We denote the value of peso bank deposits in
Dtp . Finally, the conversion ratio between local shares and their corresponding
ADR is denoted ξ . 14 Each period t, the Argentine share pays out a dividend in pesos, denoted L
td . The ex dividend market valuation of the Argentine share, in pesos, is equal to the expected stream of dividends, discounted by the period rate of time discount, β , and adjusted by ARG
t jP+∆ , the peso deflator between periods t and t+j:
(1) 1
t j
t j
LL jt t ARG
j
dp E
Pβ +
+
∞
=
=∆∑
The market valuation of the corresponding ADR, in dollars, is:
(2) 1
t j
t j
Lt jADR j
t t USj
S dp E
Pβ +
+
∞+
=
=∆∑
Note that the dividends on the ADR are paid in dollars, and that the appropriate deflator is the U.S. rate of inflation. Before the Corralito (and abstracting for now from transactions costs), the law of one price prevailed for ADRs. Equation (3) shows the return from round-trip arbitrage between Argentina and the United States via ADRs:
(3) 1 1
1Lt tD ADR
t t
p Sp p
ξ
⋅ ⋅ ⋅ ⋅ =
Investors withdraw peso deposits from their bank accounts to purchase local shares. Those shares are then converted into (1/ ξ ) units of an ADR and the ADR is sold for dollars. Finally the dollars are converted back into pesos at the prevailing exchange rate.
14 For the convenience of U.S. investors, local shares are often bundled into groups of 4 to 10 shares per ADR. The conversion ratio is fixed at the time of the initial listing.

7
The Corralito affected the process of round-trip arbitrage via ADRs in three ways. Consider the return from ADR conversion on the day the Corralito was imposed, denoted t+1, relative to the day before the Corralito: (4) 1 1(ln ln ) (ln ln ) (ln ln )L L D D
t t t tp p p p ξ ξ+ +− − − + −
1 1(ln ln ) (ln ln )ADR ADRt t t tp p S S ADRdiscount+ +− − + − = ∆
The first effect, which we call the liquidity value of shares, is the impact of the Corralito on the relative price of local shares to deposits. The provisions of the Corralito allowed investors to transform frozen bank deposits – which could potentially be expropriated by the government or lost in a full-scale bank run -- into stocks. Note that the liquidity value should appear in the prices of all Argentine stocks during the Corralito, and the premium associated with asset transformation should remain until all depositors in Argentina have re-optimized their savings portfolios or the deposit restrictions are removed. The second effect is the capital control circumvention value of cross-listed shares. ADRs provided a legal means of acquiring foreign assets under the Corralito. Thus ADRs carry an additional premium over other shares and the premium should last until all Argentine investors are indifferent between holding their assets at home or abroad. This could be achieved either when all of the available funds have left the country, or the cost of moving funds becomes prohibitively high. Note that in equation (4) the rate of conversion of Argentine stock into its ADR equivalent, ξ , is a constant. Therefore, the value of obtaining local shares that can be sold in the United States appears as an increase in the local price relative to ξ . The third effect is the currency value of ADRs. This effect has two parts. The first part, reflected in 1
ADRtp + , is due to the fact that holders of ADRs own claims to
dollar-denominated dividends, paid out at the official exchange rate. Depending on the impact of the Corralito on the expected path of the official exchange rate, this would alter the market valuation of the ADR relative to its local share equivalent. The second part of the currency effect is the change in the exchange rate itself. Because investors receive dollars, rather than pesos, for the sale of the asset, this will affect the expected profit from ADR conversion. 2.2 Costless and instantaneous arbitrage premia Before turning to the data we define the returns to U.S. and Argentine investors considering a purchase of a cross-listed security. We first assume that arbitrage
8
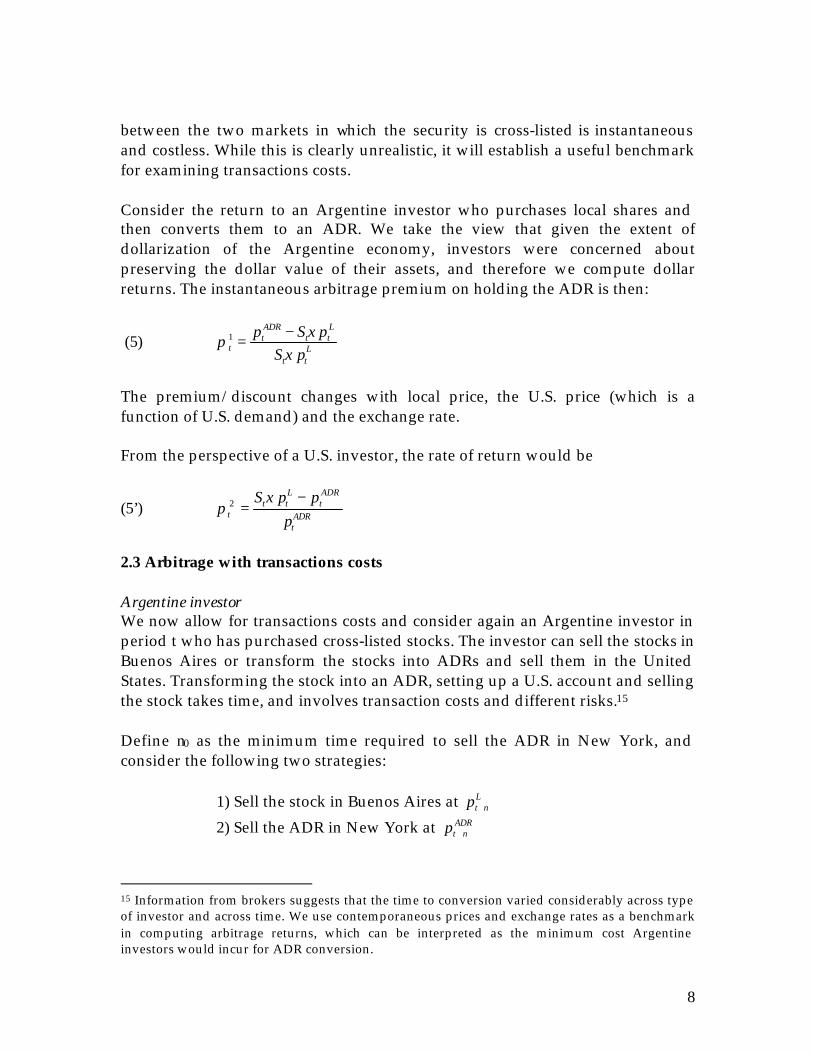
between the two markets in which the security is cross-listed is instantaneous and costless. While this is clearly unrealistic, it will establish a useful benchmark for examining transactions costs. Consider the return to an Argentine investor who purchases local shares and then converts them to an ADR. We take the view that given the extent of dollarization of the Argentine economy, investors were concerned about preserving the dollar value of their assets, and therefore we compute dollar returns. The instantaneous arbitrage premium on holding the ADR is then:
(5) 1ADR Lt t t
t Lt t
p S pS p
ξπ
ξ−
=
The premium/discount changes with local price, the U.S. price (which is a function of U.S. demand) and the exchange rate. From the perspective of a U.S. investor, the rate of return would be
(5’) 2L ADR
t t tt ADR
t
S p pp
ξπ
−=
2.3 Arbitrage with transactions costs Argentine investor We now allow for transactions costs and consider again an Argentine investor in period t who has purchased cross-listed stocks. The investor can sell the stocks in Buenos Aires or transform the stocks into ADRs and sell them in the United States. Transforming the stock into an ADR, setting up a U.S. account and selling the stock takes time, and involves transaction costs and different risks.15 Define n0 as the minimum time required to sell the ADR in New York, and consider the following two strategies:
1) Sell the stock in Buenos Aires at Lt np +
2) Sell the ADR in New York at ADRt np +
15 Information from brokers suggests that the time to conversion varied considerably across type of investor and across time. We use contemporaneous prices and exchange rates as a benchmark in computing arbitrage returns, which can be interpreted as the minimum cost Argentine investors would incur for ADR conversion.

9
where n≥n0. If the expected return of strategy 2 is larger than the expected return of strategy 1, then every risk neutral local investor (assuming all the other investing opportunities are arbitraged) would transform their stocks into ADRs and follow strategy 2. On the other hand, under normal conditions risk-neutral local investors would simply hold their local shares when the expected return of strategy 1 is bigger than expected return of strategy 2. The expected return (at period t) in U.S. dollars of following strategy 2 is:16
(6) EtR2= 3 5 4 1 2
1 2
[ (1- )(1- )]- - [ (1 ) ] [ (1 ) ]
ADR Lt t n t t
Lt t
E p p Sp S
τ τ τ ξ τ τξ τ τ
+ + ++ +
where 1 2(1 )L
tpξ τ τ+ + is the pesos the investor needs to buy ξ local shares to obtain one ADR, and 3 5[ (1- )(1- )]ADR
t t nE p τ τ+ is the dollar amount that the Argentine investor expects to obtain after selling the ADR in the U.S. at time t+n after taxes and expenses. Argentine investors typically face a broker’s fee, τ1, and a
transactions fee, τ2. A second broker’s fee, τ3, is incurred when the asset is sold in the United States. We also include a fixed fee in dollars, τ4, that the investor must pay to transform the regular shares into an ADR. Finally, the cost of opening a bank account in the United States is τ5. Note that the investor does not have to physically obtain dollars to carry out this operation (the return is simply expressed in dollar units) so the investor does not pay a fee for obtaining foreign exchange. Note also that all of the transactions in (6) were permitted under the Corralito. If the Argentine investor were to instead use the dollar amount
1 2[ (1 ) ]Lt tp Sξ τ τ+ + to buy local shares and sell them in Buenos Aires in period t+n
for the expected (net of taxes) price, her expected return at time t will be:
(7) EtR1= L
1 2 1 2
1 2
(1- - ) (1 ) (1 )
Lt t n t n t t
Lt t
E p S p Sp S
ξ τ τ ξ τ τξ τ τ
+ + − + ++ +
Where 1 2 (1 )L
t tp Sξ τ τ+ + is the amount, expressed in dollars, the investor needs in order to buy enough shares of the local stock to reach the equivalent of one ADR, and L
1 2 (1- - )t t n t nE p Sξ τ τ+ + is the amount of money she receives for selling the shares after n periods. The returns are calculated net of the broker’s fee and the local transactions fee. 16 Here we are assuming the conversion fee is paid in dollars in the U.S. once the operation is complete, and the amount is withdrawn from the investor’s banking account.
10
For the investor to be willing to convert shares to ADRs, it must be the case that EtR1 ≤ EtR2 or (8) L
3 5 4 1 2[ (1- )(1- )]- [ (1- - ) ] 0ADRt t n t t n t nE p E p Sτ τ τ ξ τ τ+ + +− ≥
U.S. investor We next derive the trade-off facing a U.S. investor. The trade-off is different for the two investors because of the asymmetries in fees, taxes and institutional regulations in the two markets. The U.S. investor purchases the ADR in the U.S. and can either
I) Sell the ADR in New York at ADRt np + or
II) Sell the stock in Buenos Aires at Lt np + .
The first strategy gives the expected return to holding the ADR for n periods:
(9) EtRI=-
ADR ADRt t n t
ADRt
E p pp
+
U.S. investors do not face a broker’s fee or a stock market transactions fee.17 The return to converting the ADR to local shares, and repatriating the earnings is given by:
(10) EtRII=L
1 2 6 (1- - )(1 )
ADRt t n t n t
ADRt
E p S pp
ξ τ τ τ+ +− − .
When selling the shares in Argentina, we assume that the U.S. investor incurs charges in using a local broker and must pay the stock market transactions fee. Since we assume that he would like to return the profits from the sale back to the U.S., he incurs an additional tax ( 6τ ) for transferring the funds. Note that under the Corralito repatriating the dollars directly is illegal. Presumably there are other means of circumventing the controls, but by ignoring these restrictions we are in effect understating the transactions costs faced by U.S. investors. A risk-neutral investor will cancel an ADR when t I t IIE R E R≥ or:
17 It is not strictly true that U.S. investors face zero transactions costs. However, our empirical analysis focuses on the arbitrage conducted by Argentine investors during the Corralito , so we abstract from the relatively small U.S. transaction costs for simplicity.
11
(11) L
1 2 6 (1- - )(1 ) 0ADRt t n t n tE p S pξ τ τ τ+ +− − ≥
This suggests that if local prices (expressed in dollars) exceed the ADR price investors should buy ADRs, convert them back to local shares and sell them in Argentina. Arbitrage bounds The trade-offs faced by Argentine and U.S. investors yield arbitrage bounds for capital inflow into and outflow from the Argentine market. Equation (8) can be re-written to show the bound facing an Argentine investor who is contemplating converting his local stocks into an ADR:
(12) nt
Lntt
ntL
nttADR
ntt
ntL
ntt SpESpEpE
SpE ++
+++
++
−≥−
−−+
−−−−
ξξ
ξτττ
ττττ
1)1)(1()1)(1(
)1(
53
4
53
21
Capital outflows to the U.S. will not occur if the transaction costs on the left-hand-side of (12) (which are a function of the local price and the exchange rate) exceed the returns to the conversion. The data below will show that local prices moved well outside of the arbitrage bands because of the value investors attached to being able to convert their frozen bank deposits into dollars in overseas accounts. Equation (13) shows the corresponding arbitrage bound for capital inflows into Argentina. Transactions costs faced by a U.S. investor that exceed the returns of selling ADRs for local shares will choke off capital inflows into Argentina.
(13) 1 2 6(1 )(1 ) 1L ADR
t t n t n t t nL
t t n t n
E p S E pE p S
ξτ τ τ
ξ+ + +
+ +
−− − − − ≥
If the ADR premia/discount lies between the bounds in (12) and (13) neither investor would engage in arbitrage between the markets. Premia outside of the bounds should, in principle, be arbitraged away. In our empirical analysis below we examine ADR premia/discounts with and without transactions costs and we calculate arbitrage bounds based on the costs faced by investors in the U.S. and Argentina conducting arbitrage between the two markets. Table 1 shows transaction cost ranges that reflect amounts that were charged to both small and large Argentine investors. The standard length of time required for an ADR conversion was nine days. Large investors, such as institutional investors and bankers faced substantially lower costs than smaller

12
investors, and could also complete the ADR conversion in a shorter period of time.18
[Table 1 here] 3. Share prices and discounts during the Corralito Table 2 provides a list of the 12 ADRs listed in Argentina as of December 1, 2001 and traded on either the NYSE or Nasdaq.19 In November 2001 trade in these 12 ADRs accounted for 36% percent of the Merval Index and 27% of total market volume. Table 2 also provides pre-Corralito information on each ADR’s market capitalization and trading volume as a percent of the market, as well as the mean and standard deviation of returns (over the period January 2001 to November 2001).
[Table 2 here] Figure 3 shows price indices for value-weighted portfolios of ADRs20 and all other Argentine stocks over the July 1, 2001 to October 18, 2002 period. Both portfolios reverse their downward trend in the pre-Corralito period, increasing immediately following the freezing of bank accounts and the imposition of capital controls. As predicted, the ADR portfolio experiences a bigger increase than the non-ADR portfolio, reflecting the additional capital circumvention and currency values of cross-listed stocks. The additional premium on ADR stocks over non-ADR stocks remains until May 2002.
[Figure 3 here] We also observe a dramatic change in the trading volume in cross-listed shares in Argentina over this period. Although the aggregate trading volume on La Bolsa steadily declines, the fraction of ADRs in the total volume traded jumps
18 The costs reported in the table are based on phone interviews with portfolio managers and investors in Buenos Aires and on information published on the websites of various Argentine brokerages advertising the ADR-conversion process. 19 There are also 11 ADR shares that we do not include in our analysis because they are only traded over the counter (Rule 144a and OTC stocks) and as such are not required to meet U.S. accounting standards. We also dropped Nortel from our ADR portfolio even though it is not an OTC stock because it is a preferred stock with very few transactions over this period. 20 The figure using price indices for equal-weighted portfolios of ADRs and non-ADRs is qualitatively similar.

13
dramatically at the time of the Corralito from roughly 40 percent of the total volume to over 80 percent. Perez Companc alone accounted for nearly 50 percent of the total volume of trading in the month of December 2001. In late February 2002, volume in the ADR market leveled off.21 Although the Corralito continued to be in effect, several regulatory changes, starting in February 2002, may have diminished investor’s incentives to use the stock market as a means to gain access to frozen assets.22 At the same time as interest in ADRs was stalling, volume in the CEDEAR market began to rise dramatically, so much so that by May 2002 volume in CEDEARs accounted for approximately 70 percent of all trading on La Bolsa.23 We will return to the behavior of the CEDEAR market in later in the paper.
[Figure 4 here]
3.1 Changes in prices of cross-listed securities Table 3 verifies statistically what we saw visually in figure 3. The table presents changes in ADR and non-ADR portfolio prices in Argentina and New York following the imposition of the Corralito. (All prices are measured in U.S. dollars). On the day following the imposition of the Corralito (see the first column of the table), the equal-weighted ADR portfolio price in Argentina jumped 2.7 percent while the equal-weighted portfolio of non-ADRs jumped by 0.5 percent. If we measure the change in ADR and non-ADR portfolio prices one week after the imposition of the Corralito the ADR portfolio price change is even more dramatic, increasing by 14 percent, while the non-ADR portfolio rise is 8 percent. Similar results hold for the value-weighted portfolios. These changes are statistically significant from the price movements one would have anticipated based on the pre-Corralito distribution and are consistent with the view that there was an increase in the liquidity value of all Argentine stocks. We also examine differences in the prices of the ADR and non-ADR portfolios (after the imposition of the Corralito) and find that the wedge between the two portfolios is statistically significant, one day and one week after the change, and for the equal-weighted and value-weighted portfolios. This is suggestive, though certainly not definitive, evidence that there was an additional premium associated with ADRs relative to non-ADRs after the Corralito. 21 This is particularly true in New York where ADR volume declines steadily from its peak in December 2001. Volume in February 2002 was 18 percent lower than the previous December, and by May 2002, volume was a mere 23% of what it had been in December 2001. 22 In February investors were allowed to withdraw (once and for all) 7,000 U.S. dollars from any of their bank accounts. In March investors were given the option to convert deposits into bonds (in pesos or dollars) and they were allowed to use their deposits to purchase properties and subsequently cars. 23 During the period of the Corralito there were 216 CEDEARs listed in Buenos Aires.

14
In the lower panel of Table 3 we examine the same ADR and non-ADR portfolio price changes, now using the ADR portfolio price in New York. The ADR portfolio price in New York increases too, but by a fraction of the price changes in Argentina. We also find that the difference between the ADR portfolio price in New York and the non-ADR portfolio price (in Buenos Aires) one day after the Corralito is insignificant. The difference in the New York ADR portfolio price and non-ADR portfolio price the week after the imposition of the Corralito is actually negative (and statistically significant) suggesting that the New York price on the ADR portfolio fell below the non-ADR portfolio price during this period. Taken together, the data suggest that New York prices changed little following the Corralito, while ADR prices in Argentina rose dramatically.
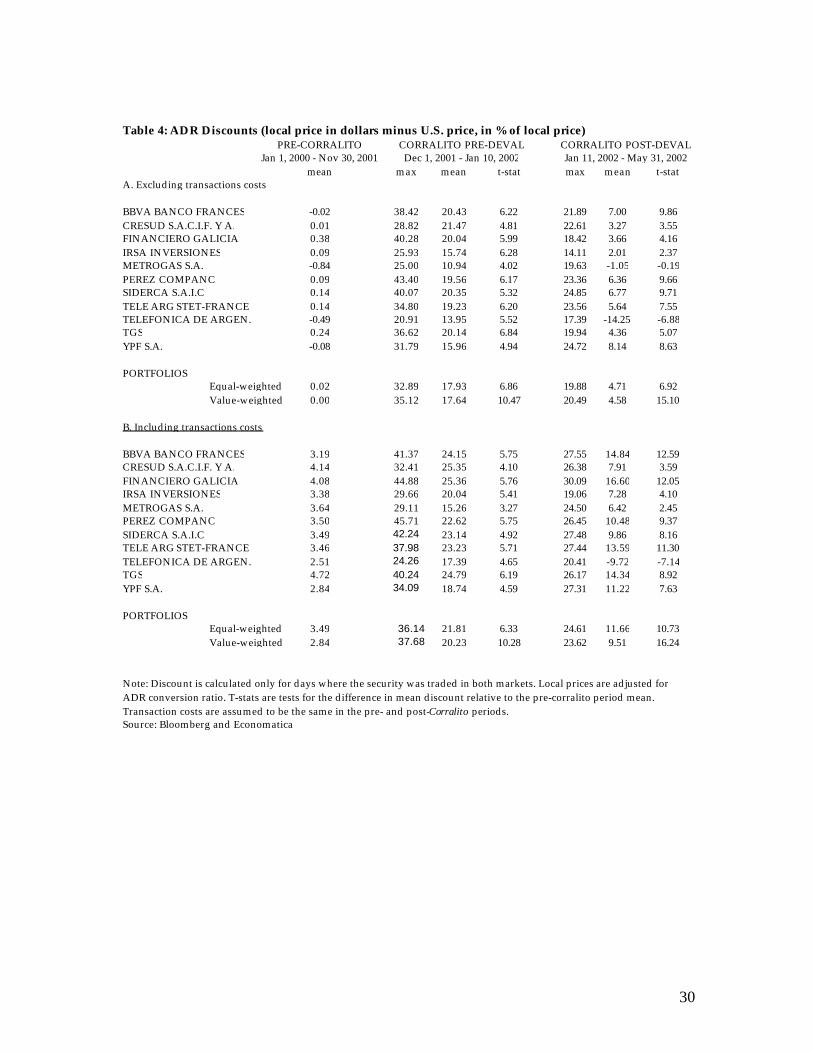
[Table 3 here] 3.2 ADR discounts It is clear from table 3 that Argentine stock prices increased following the imposition of the Corralito, consistent with our prediction that stock prices reflect the liquidity value of stocks relative to bank deposits. One of the difficulties in studying stock price movements, however, is that it is difficult if not impossible to control for changes in fundamentals that could have affected firms around the time of the Corralito. The advantage of studying ADRs is that one can use the price of ADRs in New York as a benchmark for gauging the impact of changes in policies that were specific to investors in Argentina. We therefore turn to the arbitrage discounts on ADR shares in Buenos Aires relative to their price in New York. Figures 5 and 6 show local and U.S. prices in dollars and the ADR discounts for two (Perez Companc and Siderca) of the 12 companies in our sample of ADRs over the July 1, 2001 to May 31, 2002 period.24 The figures also show the arbitrage bounds based on our estimates of transactions costs (described in Table 1).25 Table 4 summarizes the maximum and average discounts during pre-Corralito, Corralito pre-devaluation and post-devaluation periods for each company and the averages across the twelve companies. The top panel of the table calculates
24 Similar figures for the rest of the ADRs are available upon request. 25 The transactions costs we use in the calculations are: t 1=.3025 t 2=.1025 t 3=.3025 t 4=.15 t 5=1.0. We ignore the time delay in our calculations of premia/discounts. The difference between the lower bound and upper bound in our estimations is around 500 basis points. Rabinovitch, Silva and Susmel (2000), using data for 6 Argentinean stocks with ADRs for the period 1993-2000 estimate arbitrage bands of around 270 basis points, suggesting both that transactions costs increased during the Corralito and that the transactions fees we use in our calculations provide maximum arbitrage bands.
15
the discounts excluding transactions costs and the bottom panel includes transactions costs.26
[Figures 5 and 6 here]
[Table 4 here] The information in Table 4 and the plots indicate that the average pre-Corralito premium for all companies was close to zero, suggesting that arbitrage between Argentina and the U.S. kept prices in close alignment. During the Corralito, the average ADR discount (the local price less the ADR price) jumped to 18 percent (excluding transaction costs). And, even after the devaluation in January the average ADR discount remained at just under 5% (or 10% including transactions costs), well outside the arbitrage bounds. Unfortunately many of the ADRs traded only sporadically over this period, so that it is not possible to do a full-fledged event study analysis of the impact of the Corralito and the devaluation on the ADR discounts. To get a sense of whether the changes in discounts over this period are statistically significant we provide t-statistics that suggest that the discounts observed in the Corralito period are far outside the range that we would have expected based on the distribution of pre-Corralito discounts. Figures 5 and 6 suggest that the ADR discounts were relatively small at the beginning of the Corralito and peaked just prior to the devaluation. One interpretation of this evidence is that the value of converting to dollar-denominated assets increased as the devaluation became more likely in early January 2002. At their peak, the discount reached close to 40 cents on the dollar for Banco Frances, Banco Galicia, Perez Companc and Siderca.27 3.3 The Emergence of CEDEARs Before the imposition of the Corralito Argentine investors should have preferred to hold foreign stocks directly (and in dollars) rather than as a CEDEAR in pesos, especially given that they had to pay high conversion fees for the CEDEARs. However, after the imposition of the Corralito investors were no longer able to use dollars to purchase non-Argentine stocks. Indeed, one of the few ways investors were able to gain access to their frozen bank deposits was to purchase
26 We use the same transactions costs for the pre-Corralito and post-Corralito periods for consistency, even though it is likely that these costs increased substantially after the imposition of the Corralito (so that we are biasing our results against finding differences in the two periods). 27 According to brokers and the financial press, the most demanded ADRs have been (in order of importance): Perez Companc (PC), Grupo Financiero Galicia, Siderca and Telecom. In December 2001, the number of shares of PC traded in NYSE increased 170%.
16
shares on La Bolsa. For this reason we might have expected Argentine demand for CEDEARs to have increased during the Corralito because underlying CEDEAR assets are denominated in dollars (although CEDEARs are priced in pesos), and because holding shares of non-Argentine firms would serve as a better means of hedging against the looming economic crisis. The supply of CEDEARs, however, did not immediately pick up in large part because Argentine brokers were initially not able to send dollars abroad to buy the underlying stocks and convert them to CEDEARs, and there was little incentive for investors outside of Argentina to convert U.S. stocks into peso denominated CEDEARs before the devaluation.28 Starting in late February 2002, however, liquidity in CEDEAR stocks gradually increased. Discussions with brokers in Argentina suggest that the increase in CEDEAR liquidity came from two sources. First, using operations called “via cable” brokers bought foreign bank checks that allowed them to purchase the underlying U.S. shares, convert these into CEDEARs, and then sell the CEDEARs (at a premium) in Argentina for pesos.29 Second, mutual funds, pension funds and other institutional investors are required to hold assets rated above BBB, and at this time all Argentine stocks and bonds were below the minimum ranking, forcing these funds to purchase non-Argentine securities. Since the Corralito disallowed direct purchases of foreign assets CEDEARs were among the few assets that they could acquire. Once liquidity in the CEDEAR market was established, investors had an alternative means of escaping the Corralito, by purchasing CEDEARs in Argentina for pesos, converting them back to the underlying dollar denominated stocks, and selling them in New York for dollars (that then are deposited in dollar accounts).30,31 The transaction costs of CEDEAR conversion are similar to
28Traders had little incentive to convert U.S. stocks into CEDEARs prior to the devaluation both because of peso value uncertainty and because the Corralito restricted repatriation of any peso returns. 29 Another way that CEDEARs may have been created is through a practice termed “pre-releasing” where the Depositary Bank lends out the underlying securities that make up the CEDEAR to brokers in the market. The brokers then sell the CEDEARs to investors who pay in pesos and then request that the broker convert the CEDEARs back into the underlying U.S. shares (and sell them in New York for dollars). 30 Investors also purchased (in pesos) dollar denominated Argentine government bonds (specifically Global 2008s) and re-sold them in New York (for dollars) for similar reasons. 31 It is interesting to note that the two most frequently traded CEDEARs in the post-Corralito period, Lockheed and Avon, were rarely traded before the capital controls were imposed. The apparent reason for this shift in preference is that they each have low conversion ratios and high dollar prices (for the underlying shares) in the U.S., which in turn meant that these securities sold at high prices in pesos in Argentina. Higher nominal peso prices meant that fewer of these

17
those in the ADR market32, and the increased demand for CEDEARs in Argentina led to similar price spreads on CEDEARs in Argentina relative to the underlying prices of the stocks in New York. Table 5 shows that before the Corralito, the mean CEDEAR discount was approximately zero, but during the period March 2002 through September 2002 the average discount increased to 3.3 percent (excluding transactions costs) with a maximum increase of 13 percent.33
[Table 5 here]
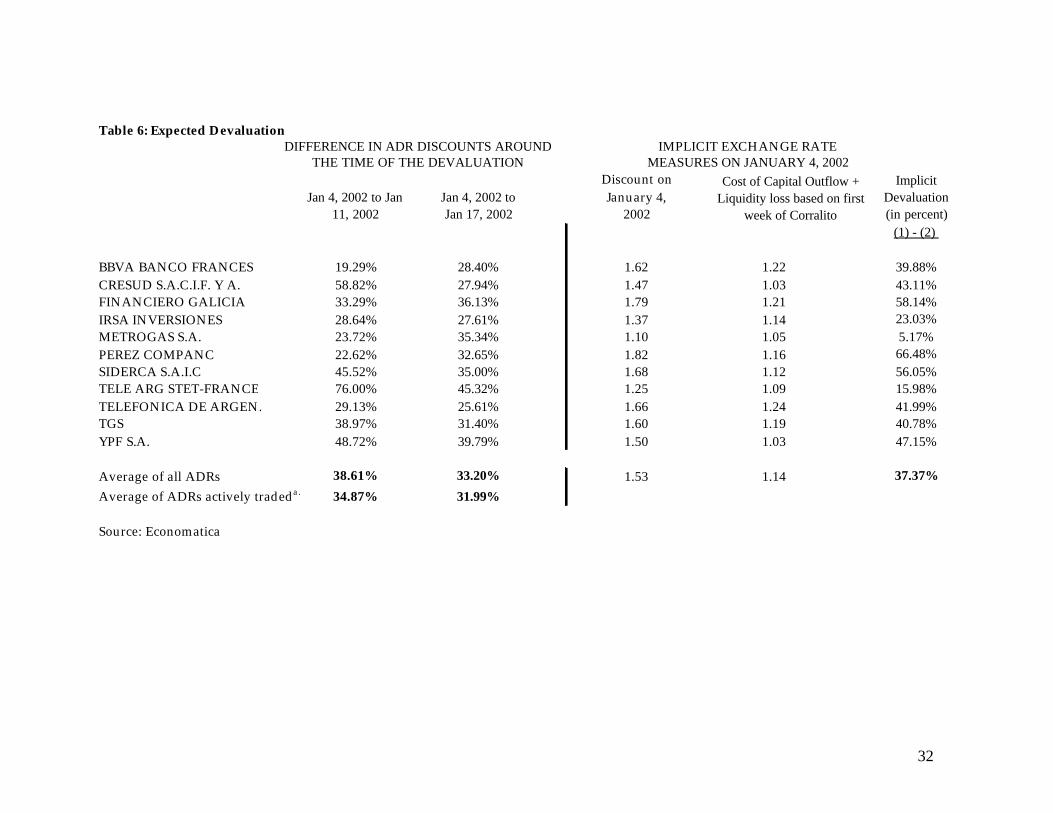
There is clear indication that the Argentine government understood that CEDEARs were serving a similar purpose as ADRs in allowing investors to transfer funds (legally) outside of Argentina. On March 25, 2002 a report in the official BCRA press communication suggests that the government considered adopting new measures to avoid capital outflows using ADR and CEDEAR transactions. However, no restrictions were imposed at that time. In September 2002, regulations were changed that increased the cost and difficulty of CEDEAR conversions.34 The last column in Table 5 shows that CEDEAR discounts increased substantially after September 2002, which could be a reflection of the increased costs associated with shifting capital abroad through this mechanism. 3.4 Expected Devaluation By late December 2001, it was clear that a devaluation of the Argentine peso was imminent. Recall from equation (4) that one of the components of the ADR discount is the value of converting a peso-denominated asset into dollars. In effect, the stock market served in part as a shadow foreign exchange market and we exploit this to back out expectations of the devaluation. We compute the expected devaluation in two ways. First, we take the difference in the discounts just before and just after the devaluation (January 11th), which
CEDEARS had to be acquired to transfer a given amount of funds (and with fewer transactions investors incur lower conversion costs). 32 The transactions costs we use in the calculations are: t 1=.3025 t 2=.1025 t 3=.3025 t 4=.09 t 5=1.0. We ignore the time delay in our calculations of premia/discounts. Note that the conversion fee, t4, is lower for CEDEARs than ADRs (where it is .15). Conversations with brokers suggest that transactions costs rose in the post-Corralito period but for consistency we use the same costs for both the pre- and post-Corralito period, biasing our results against finding differences in the two periods. 33 Liquidity for many of the CEDEARs in Buenos Aires remained low even after March 2002, in Table 5 we include the 15 most frequently traded CEDEARs (out of the 216 listed CEDEARs) and we calculate the discount for each of the CEDEARs only on the days when there was a closing price in both markets. The index is then the average of the daily premia. 34 See the entry for September 2002 in Appendix 1.

18
should include only the impact of the devaluation on the local price.35 The first two columns of Table 6 show that this difference yields an average expected devaluation of between 35 and 39 percent, depending on whether we include all observations of ADR discounts or exclude observations for ADRs that did not trade in one of the markets on January 4th (the last trading day before the devaluation). 36 Over this period there are days when only the U.S. market is open (although there still exists a price in Argentina based on the previous trading day) as well as days when particular ADRs did not trade in one or both markets. If we calculate changes in the ADR discounts on January 17th (when the Argentine stock market reopened) rather than January 11th, the average change in the ADR discount ranged between 32 and 33 percent. These changes in discounts are significantly larger than the typical daily or weekly discount changes in the pre-Corralito period, though they suggest that the market slightly under-predicted the magnitude of the official devaluation (which was 40%). The last column of table 6 presents an alternative measure of the market’s expectation of the devaluation based on the implicit exchange rate Argentine investors faced in their ADR conversions (including transactions costs). To derive the implicit exchange rate, we start with each ADR’s implicit exchange rate on the day before the devaluation was announced (reported in the third column of table 6). Of course, the implicit exchange rate also contains the liquidity value of ADRs as well as the capital control circumvention value. We estimate these two components (reported in the fourth column) for each ADR by using the average implicit exchange rate in the first week of the Corralito, when expectations of a devaluation were still relatively low. The estimates suggest that on average investors were willing to pay 14 cents for every dollar they removed from their peso accounts and sent abroad. When we subtract this from the implicit exchange rate on the eve of the devaluation our measure of the market’s expected devaluation is 37 percent, again close to but slightly under the actual devaluation that occurred of 40%.
[table 6 here] Figure 7 presents the actual peso-dollar exchange rate over the period January 2001 through December 2002 along with the average implicit exchange rate faced by investors using the ADR and CEDEAR channels to convert peso assets into dollar assets. The figure clearly shows that the cost of using cross-listed 35 This assumes that no other events occurred in that period that would have affected the wedge between the ADR price in New York and the share price in Argentina. 36 The devaluation was announced on January 7th and took place on January 11th (to a new exchange rate of 1.4). The free float started on February 11th. See appendix 2 for more information regarding exchange rate developments over this period.

19
securities to bring dollars outside of Argentina exceeded the actual peso-dollar exchange rate over this period.
[figure 7 here]
3.5 Magnitude of Implicit Capital Flight using ADRs In addition to calculating the expected magnitude of the devaluation, we can use ADR transactions data to estimate the volume of wealth transfer from Argentina to the United States via ADRs. The most accurate measure would be to use the volume of ADR conversions that occurred after the imposition of the Corralito. The NYSE collects the number of ADR conversions on a quarterly basis, which unfortunately makes it impossible to back out the number of conversions during the peak period of December of 2001 and January 2002. The data suggest that between the end of December 2001 and the end of March 2002, approximately 26 million shares of Argentine stock were converted to ADRs. Since we do not know in which month those shares were converted, and because share prices changed dramatically in this period it is difficult to assign a value to this flow. An alternative measure is to take the post-Corralito cumulated volume of sales of Argentine ADRs in New York, under the assumption that all ADR sales reflect cashing out by Argentine investors. This figure comes to $835 million.37 This is likely to be an underestimate of the volume of outflow, since many investors may simply hold the stock rather than sell at depressed prices. Another measure is the cumulated volume of purchases of local stocks with associated ADRs in Buenos Aires over this period. Under the assumption that all these purchases are intended for ADR conversion, the value of wealth transfer comes to $3.4 billion dollars. This is likely an overestimate, since Argentines may have had other reasons for purchasing these stocks besides ADR convertibility. On the one hand, a capital flow of even $3.4 billion is small given the magnitude of the crisis and the desire of Argentines to find a way to move wealth abroad. On the other hand, the fact that the volume is small is consistent with the fact that, unlike many unofficial channels for capital outflow, the value of the ADR loophole was priced by the market. It appears that the increase in local share prices effectively choked off the flow. This may have been why, in the midst of all of the other events taking place during the Corralito, the government did not appear to be much concerned about closing the ADR loophole.
37 This is the cumulated sum between December 1, 2001 and May 31, 2002.

20
4. Market Factors and the Pricing of ADRs Until this point, we have analyzed the time series of ADR and local prices in isolation. We now turn to the pricing of ADR stocks in the context of overall market movements in Argentina and New York. In theory, in a fully liberalized and integrated financial environment, we would expect ADRs to be priced based on global market factors. Investors with access to global assets should expect returns to be based on covariances of individual stocks and the global market portfolio. That said, in practice, Karolyi and Stulz (2002) find that home bias tends to increase local influences on asset prices. They find that local market portfolios often better explain the cross-sectional variation in expected returns for local stocks, though they also find that equity flows and cross-country correlations increase global influences on asset prices.38 The pricing of Argentine ADRs provides an interesting natural experiment in the context of this literature. Prior to the imposition of the Corralito, Argentina’s financial markets were considered fully liberalized. The Corralito, although allowing ADR transactions to continue, was intended to control capital outflows and therefore presumably led to a less globally integrated Argentine capital market.39 In terms of the market model, we should therefore expect that local market factors in Argentina became more important in pricing stocks with associated ADRs during the period in which capital controls were in force. We test whether the imposition of the Corralito led to changes in the pricing of Argentine stocks with associated ADRs using a standard market model; where
itR is the return on asset i at time t, GmtR is the return on the global market
portfolio at time t, LmtR is the return on the local market portfolio at time t, and
? St is the change in the exchange rate: (10) itt
Lmt
Gmtit SRRR εββββ +∆+++= 3210
Evidence of market segmentation would be indicated by a significant coefficient on the local market index, ß2. Table 7 presents daily time series results40 from
38 Also see Errunza and Losq (1985), Eun and Janakiramanan (1986) and Alexander et al (1987) who examine the pricing of ADR portfolios in the context of the market model and generally find evidence that global market factors dominate local factors in explaining ADR returns. 39 Schmukler and Kaminsky (2001), however, find little evidence that capital controls (in six emerging market economies during the 1990s) effectively segmented domestic markets especially over longer horizons. 40 Daily returns correspond to close-to-close prices including dividends and excluding weekends and holidays. A potential problem with daily market model regressions is the occurrence of non-

21
regressions of returns from the value-weighted ADR portfolio (in Argentina and the U.S.) on the Morgan Stanley Capital International (MSCI) world index, an orthogonalized local Argentine value-weighted portfolio index (excluding the stocks with associated ADRs), and the change in the peso-dollar exchange rate.41 Regression results are presented both for the period prior to the imposition of the Corralito (specifically October 1997 through November 2001) and for the post-Corralito period (December 2001 through July 2002).
[Table 7 here]
The results in table 7 suggest that both local (Argentine) market factors and global market factors were important in pricing Argentine stocks with associated ADRs even before the imposition of the Corralito. Our estimates of the betas on the global market portfolio are close to one while the betas on the local market factor are 0.9 for the ADRs in Argentina and 0.8 for the ADRs in the U.S. Focusing first on the results for the regression using the ADR portfolio price in Argentina we find that in the post-Corralito period the local market portfolio beta rises (both in absolute magnitude and in relation to the beta on the global market portfolio) following the imposition of the Corralito, indicating that stocks with associated ADRs magnified Argentine market movements in this period. These results confirm our initial hypothesis that local market factors in Argentina became more important in pricing stocks with associated ADRs (and presumably all Argentine stocks) during the period in which capital controls were in force.
The model in section 2 and the data description in section 3 of this paper suggest that the pricing of ADR stocks in Argentina and New York may have diverged
overlapping trading hours across markets due to different time zones, trading schedules and country-specific holidays. In our study, the extent of non-synchronous trading across national stock markets is compounded by the fact that the Argentine stock market was closed for several days during the height of the crisis and many stocks were traded infrequently over this period. In order to determine whether non-frequent trading introduces bias in our regression results, we re-estimated equation (10) using the Scholes and Williams (1977) non-synchronous trading correction. Specifically, we estimate equation (10) allowing for up to 10 lags and leads of the local and global market portfolios. We compute
∑
∑
=
−=
+= n
i
i
n
nii
SWn
1
21 ρ
ββ
where ? is the autocorrelation coefficient.
We find that the local market portfolio beta is robust to the choice of leads and lags, whereas the global market portfolio beta is sensitive to the lag specification in the post-Corralito period, though the main qualitative results remain robust. These lead and lag estimates of the betas are available upon request. 41 We orthogonalize the non-ADR Argentine portfolio by regressing it on the MSCI (separately over the pre- and post-Corralito subperiods) and use the residuals from these first stage
regressions for LmtR in the estimation of equation (10).

22
during the Corralito period. And, in particular, we might expect that while local factors influenced prices in Argentina, they may not have been as important for prices of the same stocks sold in New York (given that investors in New York were not subject to the restrictions of the Corralito). Indeed, we find that in the regressions using ADR portfolio returns in New York that the beta on the local market portfolio falls dramatically from .80 in the pre-Corralito subperiod to .18 in the post-Corralito period.42 The beta on the global market portfolio also falls in the post-Corralito period (from 1.04 to 0.62) though it remains large relative to the beta on the local market factor.43 These results suggest that after the imposition of the Corralito Argentine market factors no longer had as much influence on the pricing of Argentine ADRs in New York. Or, put another way, ADRs in New York became less like other Argentine stocks (including those with associated ADRs) with the advent of capital controls. 5. Conclusions
Argentina in late 2001 and early 2002 provides an unusual opportunity to analyze the reactions of investors to capital controls. The Corralito, originally put in place to stave off a devaluation of the peso, effectively served to provide incentives for Argentines to invest in the Argentine stock market, helping to fuel a boom in La Bolsa even as the Argentine economy was headed toward collapse. The Corralito also provided a new role for cross-listed shares as a (legal) mechanism for capital flight. Investors were able to purchase cross-listed stocks for pesos in Argentina, convert them into ADRs or CEDEARs, re-sell them in New York for dollars and deposit the dollar proceeds in U.S. bank accounts. In the paper we show that ADR discounts went as high as 45% in the pre-devaluation period, indicating that Argentine investors were willing to pay significant amounts in order to move their funds abroad and to hedge the dollar value of their assets. In effect, the stock market served as a shadow exchange market, which allows us to back out the market’s implicit forecast of the size of
42 The regression goodness of fit also falls dramatically from .60 in the pre-Corralito period to .19 in the post-Corralito period. 43 We analyze beta stability in the post-Corralito period by running recursive least squares regressions. These estimates (available upon request) suggest that in the first two months following the imposition of the Corralito (and when the volume in the ADR market was at its peak) neither the global market index nor the Argentine market index explain ADR portfolio returns in New York (whereas in Argentina local market factors become more important in explaining the pricing of stocks with associated ADRs over this period). In the subsequent two-month rolling subsamples the global market index beta regains statistical significance and rises in magnitude for the ADR portfolio returns in New York.

23
the devaluation. On the eve of the devaluation, we estimate that the market anticipated a devaluation in the range of 32 to 42 percent. We also test whether the imposition of the Corralito led to changes in the underlying pricing structure of ADR stocks in Argentina and New York. The Corralito, although allowing ADR transactions to continue, was intended to control capital outflows and therefore should have led to a less globally integrated Argentine capital market. We find strong evidence of an increase in Argentine market segmentation after the imposition of the Corralito. We find that local market factors in Argentina became more important in pricing peso denominated stocks with associated ADRs, though we find that the same ADRs in New York are mainly priced based on global factors. Argentine investors continued to use financial markets, and increasingly the CEDEAR market, to gain access to their frozen bank deposits and to place their assets abroad in dollar accounts throughout 2002. We estimate that asset conversion using only the ADR market over the December 2001 to May 2002 period amounted to $835 million to $3.4 billion. If we include CEDEARs and other cross-listed securities, it is likely that the amount of wealth that has (legally) left Argentina during the Corralito is many times higher.

24
References Ahearne, A., Griever, W., Warnock,F., 2001. Information costs and home bias: an analysis of U.S. holdings of foreign equities. Working Paper, FRB Board of Governors. Alexander, G., Eun, C., Janakiramanan, S., 1987. Asset Pricing and Dual Listing on Foreign Capital Markets: A Note. Journal of Finance 42, 151–158. Bailey, W., Chan, K., Chung, P., (2000). Depositary Receipts, Country Funds, and the Peso Crash: The Intraday Evidence. Journal of Finance 55, 2693-2717. Becjker, T., Gelos, G.,Richards,A., 2002. Devaluation Expectations and the Stock Market: A New Measure and an Application to Mexico 1994/1995. International Journal of Finance and Economics 7, 195-214. Calvo, G., Izquierdo, A., Talvi,E., 2002. Sudden Stops, the Real Exchange Rate and Fiscal Sustainability: Argentine Lessons. Paper Presented at the Annual Meetings of the Board of Governors, Inter-American Development Bank. Doidge, C., Karolyi, G.A., Stulz,R., (2002). Why Are Firms that List in the U.S. Worth More? Ohio State University working paper. Domowitz, I., J. Glen, and A. Madhavan., 1997. Market Segmentation and Stock Prices: Evidence from an Emerging Market. Journal of Finance 52 (3), 1059-1085, 1997. Errunza, V., Hogan K, Hung, M., 1999. Can The Gains From International Diversification Be Achieved Without Trading Abroad?, Journal of Finance, 54, 2075-2107. Errunza, V., Losq, E., 1985. International asset pricing under mild segmentation: theory and test. Journal of Finance 40, 105–124. Eun, C., Janakiramanan, S., 1986. A model of international asset pricing with a constraint on the foreign equity ownership. Journal of Finance 41, 897–913. Feldstein, M., 2002. Argentina’s Fall: Lessons from the latest financial crisis. Foreign Affairs, March/April issue.
25
Foerster, S., Karolyi, G.A., 1999. The effects of market segmentation and investor recognition on asset prices: evidence from foreign stocks listing in the US, Journal of Finance 54, 981–1013. Forbes, K. 2002, How do large depreciations affect firm performance? NBER Working Papre # 9095. Huang and Stoll, 2001. Exchange rates and firms' liquidity: evidence from ADRs. Journal of International Money and Finance 20,297-325. Jiang, C. X., 1998. Diversification with American Depositary Receipts: The Dynamics and the Pricing Factors. Journal of Business Finance and Accounting 25, 683-699. Karolyi, G.A., 1998. Why do companies list shares abroad? A survey of the evidence and its managerial implications, financial markets. Financial Markets, Institutions and Instruments 7, 1–60. Karolyi, G.A., Stulz, R.M., 2002. Are Financial Asset Priced Locally or Globally? forthcoming in The Handbook of the Economics of Finance, George Constantinides, Milton Harris and René Stulz, editors, North-Holland, Amsterdam, The Netherlands. Kato, K., Linn, S., Schallheim, J., 1991. Are there arbitrage opportunities in the markets for American depositary receipts? Journal of International Financial Markets Institutions and Money 1, 73–89. Kim, M., Szakmary, Andrew, C. and Mathur, I., 2000. Price Transmission Dynamics Between ADRs and their Underlying Foreign Securities. Journal of Banking & Finance, 24, 1359 – 1382. Melvin, M., 2002. A Stock Market Boom during a Financial Crisis? ADRs and Capital Outflows in Argentina, mimeo, June. Miller, D.P., 1999. The market reaction to international cross-listings: evidence from depositary receipts. Journal of Financial Economics 51 (1), 103–123. Mussa, M. 2002. Argentina and the Fund: From Triumph to Tragedy. Institute for International Economics, Washington D.C. Officer, D., Hoffmeister, R., 1987. ADRs: A substitute for the real thing? Journal of Portfolio Management 13, 61–65.
26
Park, J., Tavakkol, A., 1994. Are ADRs a dollar translation of their underlying securities? Journal of International Financial Markets, Institutions and Money 4, 77–87. Rabinovitch, R., Silva, A.C., Susmel, R., 2000. The Impact of Capital Controls and Transaction Costs on the Return Distribution of Dually Traded Securities: Evidence from Chile and Argentina. Department of Finance, CBA, The University of Houston, Houston. Scholes, M and J. Williams., 1977. Estimating Beta from Nonsynchronous Data. Journal of Financial Economics 5, 309-32. Schmukler, S. and G. Kaminsky, 2001. Short and Long-Run Integration: Do Capital Controls Matter? World Bank Working Paper #2660. Wahab, M., Khandala, A., 1993. Why not diversify internationally with ADRs? Journal of Portfolio Management 20, 75–82. Wahab, M., Lashgari, M., and Cohn, R. 1992. Arbitrage Opportunities in the American Depository Receipts Market Revisited, Journal of International Financial Markets, Institutions and Money, v2(3), 97-130.

27
Table 1 Transaction Cost Ranges for ADR Settlement Cycle Location
of Trade or Activity
Parameter
Description
Estimated Range of Values (percent of total value of stock
market transaction, except where noted)
τ1
The brokerage fee is not regulated in Argentina, but for market operations
larger than 10,000 pesos, the fee is in the range [0.25% , 1% ] of total settlement,
before Value Added Tax. During December most of the capital control- evading transactions were settled for
amounts larger than 10,000 pesos.
[0.3025, 1.21]
Buenos Aires Stock
Market
τ2 Fee that the Buenos Aires stock exchange market charges for every transaction.
0.1025
American Depositary
Bank
τ4
ADR issuance (conversion) fee charged
by the broker. During this period, brokers charged big markups over the typical US$
0.04-0.05 conversion fees charged by depositary banks.
[0.10 dollar, 0.20 dollars]
τ3
Argentinean brokers selling the ADR in the U.S. are charged the same fee as they are when buying or selling stocks in the
local market.
[0.3025, 1.21]
NYSE Stock
Market τ5
Approximate cost of opening a banking account in the U.S. and wire transferring
the foreign currency to a U.S. bank.
1
Argentinean Bank
τ6
Approximate cost of transferring money from Argentina to the U.S.. During the
capital controls period these transactions were not allowed.
1
Note: The transaction costs ranges account for the wide dispersion of brokerage and conversion fees across size and institutional affiliation of investors, and across time. Large investors faced substantially lower costs than smaller ones, and could also complete the ADR conversion in a shorter period of time. Source: All transaction cost information, in particular ADR conversion fees, were obtained from personal interviews in Buenos Aires and/or direct communication with brokers at InvertirOnline, ElAccionista, CapitalMarkets Argentina and ArgentineReserach and web-adversitements at portfoliopersonal.com.

28
Table 2: Pre-Corralito ADR and CEDEAR Information (January 2001-November 2001)
(Nov 30, 2001) (Nov 30, 2001) (daily) (daily)
ALTO PALERMO S.A. 1.4 Real Estate 0.03% 0.15% -0.70% 2.63%BBVA BANCO FRANCES 1.3 Banking 0.26% 1.92% -0.40% 4.76%CRESUD S.A.C.I.F. Y A. 1.10 Food-Agribus-Tobacc 0.04% 0.39% -0.06% 1.64%FINANCIERO GALICIA 1.10 Fin Serv-Investment 0.22% 7.09% -0.54% 4.24%IRSA INVERSIONES 1.10 Real Estate 0.06% 0.60% -0.44% 2.79%METROGAS S.A. 1.10 Oil & Gas-Service 0.15% 0.06% -0.13% 2.39%PEREZ COMPANC 1.10 Util-Gas,Elec&Water 1.03% 9.82% -0.18% 3.17%SIDERCA S.A.I.C 1.10 Steel 0.61% 2.75% -0.16% 2.62%TELE ARG STET-FRANCE 1.5 Telecom-DatNtwk 0.61% 3.43% -0.35% 3.82%TELEFONICA DE ARGEN. 1:10 Telecom-DatNtwking 1.42% 0.03% -0.31% 3.41%TGS 1.5 Oil & Gas-Service 0.39% 0.84% -0.11% 2.88%YPF S.A. 1.1 Oil & Gas-Service 3.11% 0.09% -0.21% 1.74%
All ADRs 7.94% 27.19% -0.30% 1.83%*
Note: The standard deviation for the "all ADRs" row is for an equal-weighted ADR portfolio.Source: Bank of New York and Bolsar
Trading volume as %
MarketIndustry
Market Cap as % of Total
MarketNameRATIO
ADR:ORD
Mean Return
standard deviation

29
Table 3: Price Impact of Corralito on ADRs in Argentina and New York
I. PERCENT CHANGE IN ARGENTINE PRICES (IN $US)
t-stat t-statEQUAL WEIGHTED PORTFOLIOS
ADRs (ARG) 2.69 -25.20 14.47 -59.18NON-ADRs 0.48 -15.27 8.40 -78.97
2.21 -18.45 6.07 -22.79
VALUE WEIGHTED PORTFOLIOSADRs (ARG) 1.67 -17.76 23.21 -98.39NON-ADRs 0.27 -6.02 16.13 -89.94
1.40 -11.47 7.09 -24.05
II. PERCENT CHANGE IN NEW YORK PRICE (IN $US)
EQUAL WEIGHTED PORTFOLIOSADRs (NY) 0.54 -7.34 1.95 -11.83
0.06 -1.30 -6.44 19.95
VALUE WEIGHTED PORTFOLIOSADRs (NY) 0.37 -5.66 0.13 -5.09
0.10 -1.31 -16.00 51.70
Source: Economatica
Note: t-stats are tests for differences in return relative to average (daily or weekly) pre-Corralito returns. "Day before to day" is the return between 12/3/2001 and 11/30/2001; "Day before to week" is the return between 12/7/2001 and 11/30/2001
day before to day after
day before to week after
Difference Between ADRs (NY) and Non-ADRs (ARG)
Difference Between ADRs (ARG) and Non-ADRs (ARG)
Difference Between ADRs (ARG) and Non-ADRs (ARG)
Difference Between ADRs (NY) and Non-ADRs (ARG)
30
Table 4: ADR Discounts (local price in dollars minus U.S. price, in % of local price)PRE-CORRALITO
Jan 1, 2000 - Nov 30, 2001mean max mean t-stat max mean t-stat
A. Excluding transactions costs
BBVA BANCO FRANCES -0.02 38.42 20.43 6.22 21.89 7.00 9.86CRESUD S.A.C.I.F. Y A. 0.01 28.82 21.47 4.81 22.61 3.27 3.55FINANCIERO GALICIA 0.38 40.28 20.04 5.99 18.42 3.66 4.16IRSA INVERSIONES 0.09 25.93 15.74 6.28 14.11 2.01 2.37METROGAS S.A. -0.84 25.00 10.94 4.02 19.63 -1.05 -0.19PEREZ COMPANC 0.09 43.40 19.56 6.17 23.36 6.36 9.66SIDERCA S.A.I.C 0.14 40.07 20.35 5.32 24.85 6.77 9.71TELE ARG STET-FRANCE 0.14 34.80 19.23 6.20 23.56 5.64 7.55TELEFONICA DE ARGEN. -0.49 20.91 13.95 5.52 17.39 -14.25 -6.88TGS 0.24 36.62 20.14 6.84 19.94 4.36 5.07YPF S.A. -0.08 31.79 15.96 4.94 24.72 8.14 8.63
PORTFOLIOS Equal-weighted 0.02 32.89 17.93 6.86 19.88 4.71 6.92 Value-weighted 0.00 35.12 17.64 10.47 20.49 4.58 15.10
B. Including transactions costs
BBVA BANCO FRANCES 3.19 41.37 24.15 5.75 27.55 14.84 12.59CRESUD S.A.C.I.F. Y A. 4.14 32.41 25.35 4.10 26.38 7.91 3.59FINANCIERO GALICIA 4.08 44.88 25.36 5.76 30.09 16.60 12.05IRSA INVERSIONES 3.38 29.66 20.04 5.41 19.06 7.28 4.10METROGAS S.A. 3.64 29.11 15.26 3.27 24.50 6.42 2.45PEREZ COMPANC 3.50 45.71 22.62 5.75 26.45 10.48 9.37SIDERCA S.A.I.C 3.49 42.24 23.14 4.92 27.48 9.86 8.16TELE ARG STET-FRANCE 3.46 37.98 23.23 5.71 27.44 13.59 11.30TELEFONICA DE ARGEN. 2.51 24.26 17.39 4.65 20.41 -9.72 -7.14TGS 4.72 40.24 24.79 6.19 26.17 14.34 8.92YPF S.A. 2.84 34.09 18.74 4.59 27.31 11.22 7.63
PORTFOLIOS Equal-weighted 3.49 36.14 21.81 6.33 24.61 11.66 10.73 Value-weighted 2.84 37.68 20.23 10.28 23.62 9.51 16.24
Source: Bloomberg and Economatica
Note: Discount is calculated only for days where the security was traded in both markets. Local prices are adjusted for ADR conversion ratio. T-stats are tests for the difference in mean discount relative to the pre-corralito period mean. Transaction costs are assumed to be the same in the pre- and post-Corralito periods.
CORRALITO POST-DEVALJan 11, 2002 - May 31, 2002
CORRALITO PRE-DEVALDec 1, 2001 - Jan 10, 2002

31
Table 5: CEDEAR Discounts (local price in dollars minus U.S. price, in % of local price)PRE-CORRALITO
Jan 1, 2000 - Nov 30, 2001mean max mean t-stat max mean t-stat
A. Excluding transactions costs
AMERICAN INTERNATIONAL GROUP INC. 0.35 10.23 4.50 10.80 19.57 9.00 11.59AVON PRODUCTS INC. -0.37 11.25 3.60 15.71 8.96 4.52 12.37ANHEUSER-BUSCH COMPANIES INC. 0.06 11.91 4.21 12.76 9.01 5.61 9.69CITIGROUP INC. -0.18 11.12 3.81 10.34 7.19 4.89 9.58DU PONT DE NEMOURS & Co. 0.20 9.74 4.21 10.84 13.08 8.10 12.73FEDERAL EXPRESS Co. 2.32 9.00 4.70 6.62 16.37 7.70 9.06GENERAL ELECTRIC Co. 0.07 9.53 3.21 9.74 12.97 4.90 7.83THE HOME DEPOT INC. 1.13 12.40 4.98 8.79 10.28 5.01 6.67INTERNATIONAL PAPER Co. -0.03 11.33 3.98 12.31 9.59 4.77 7.83JOHNSON & JOHNSON -0.18 11.49 3.32 11.60 9.87 5.41 9.28LOCKHEED MARTIN Co. 0.36 9.05 2.76 10.29 12.98 5.51 14.84PEPSICO INC. -0.27 10.17 3.38 12.56 8.83 4.16 13.89ROYAL DUTCH PETROLEUM Co. (ADR) -0.18 9.25 4.78 14.14 24.08 10.59 11.58UNITED TECHNOLOGIES Co. 0.06 9.80 4.16 11.83 11.55 4.82 7.64EXXON MOBIL Co. 0.16 12.80 3.63 10.22 9.17 5.11 8.56
PORTFOLIOS Equal-weighted 0.02 11.28 3.29 13.24 12.74 6.42 22.11 Volume-weighted -0.02 10.39 3.24 13.70 9.34 4.99 19.51
B. Including transactions costs
AMERICAN INTERNATIONAL GROUP INC. 3.24 13.07 7.46 6.09 22.17 11.88 15.56AVON PRODUCTS INC. 2.25 13.58 6.10 10.40 11.36 7.01 11.62ANHEUSER-BUSCH COMPANIES INC. 3.33 14.68 7.20 8.33 11.87 8.55 12.62CITIGROUP INC. 4.14 15.32 8.26 6.55 12.31 9.76 12.24DU PONT DE NEMOURS & Co. 3.62 12.89 7.51 5.28 16.17 11.31 15.89FEDERAL EXPRESS Co. 5.17 11.52 7.34 4.35 18.73 10.27 12.21GENERAL ELECTRIC Co. 3.42 13.05 6.94 6.62 16.60 8.88 6.66THE HOME DEPOT INC. 4.28 15.22 8.19 5.51 13.84 8.53 6.26INTERNATIONAL PAPER Co. 3.37 14.28 7.14 8.53 12.76 8.03 4.53JOHNSON & JOHNSON 3.10 14.30 6.42 6.98 12.81 8.47 8.65LOCKHEED MARTIN Co. 2.95 11.40 5.25 7.96 15.26 7.96 16.91PEPSICO INC. 2.57 12.69 6.08 8.06 11.50 6.89 15.85ROYAL DUTCH PETROLEUM Co. (ADR) 2.72 11.94 7.57 10.04 26.52 13.34 14.36UNITED TECHNOLOGIES Co. 3.18 12.56 7.13 6.60 14.42 7.85 4.84EXXON MOBIL Co. 3.63 15.86 7.08 5.94 12.64 8.67 8.45
PORTFOLIOS Equal-weighted 3.63 14.04 6.29 10.79 15.47 9.30 23.00 Volume-weighted 3.50 13.20 5.97 10.07 12.09 7.63 17.21
Source: Economatica
Note: Discount is calculated only for days where the security was traded in both markets. Local prices are adjusted for CEDEAR conversion ratio. T-stats are tests for the difference in mean discount relative to the pre-corralito period mean. Transaction costs are assumed to be the same in the pre- and post-Corralito period.
POST-CORRALITOMar 3, 2002 - Sep 6, 2002
POST-CORRALITOSep 11, 2002 -Dec 31, 2002
32
Table 6: Expected DevaluationDIFFERENCE IN ADR DISCOUNTS AROUND IMPLICIT EXCHANGE RATE
THE TIME OF THE DEVALUATION MEASURES ON JANUARY 4, 2002
Jan 4, 2002 to Jan 11, 2002
Jan 4, 2002 to Jan 17, 2002
Discount on January 4,
2002
Implicit Devaluation (in percent)
(1) - (2)
BBVA BANCO FRANCES 19.29% 28.40% 1.62 1.22 39.88%CRESUD S.A.C.I.F. Y A. 58.82% 27.94% 1.47 1.03 43.11%FINANCIERO GALICIA 33.29% 36.13% 1.79 1.21 58.14%IRSA INVERSIONES 28.64% 27.61% 1.37 1.14 23.03%METROGAS S.A. 23.72% 35.34% 1.10 1.05 5.17%PEREZ COMPANC 22.62% 32.65% 1.82 1.16 66.48%SIDERCA S.A.I.C 45.52% 35.00% 1.68 1.12 56.05%TELE ARG STET-FRANCE 76.00% 45.32% 1.25 1.09 15.98%TELEFONICA DE ARGEN. 29.13% 25.61% 1.66 1.24 41.99%TGS 38.97% 31.40% 1.60 1.19 40.78%YPF S.A. 48.72% 39.79% 1.50 1.03 47.15%
Average of all ADRs 38.61% 33.20% 1.53 1.14 37.37%
Average of ADRs actively tradeda. 34.87% 31.99%
Source: Economatica
Cost of Capital Outflow + Liquidity loss based on first
week of Corralito

33
Table 7 Explaining ADR portfolio returns in Argentina and the U.S. using a Global Market Portfolio and an Argentine (Non-ADR) Local Market Portfolio over the Pre-Corralito and Post-Corralito periods
Note: The global market portfolio is the MSCI world index return and the local market index is an orthgonalized value-weighted portfolio (in dollars) of all the stocks traded in Buenos Aires except those with an associated ADR. The dependent variable is the return in Argentina or the U.S. on a value-weighted portfolio of the 12 stocks with associated ADRs. Standard errors are in parentheses. The pre-Corralito period is 10/1/1997 to 11/30/2001 and the Post-Corralito period is 12/3/2001 to 7/1/2002. The “dummy for devaluation day” take the value of 1 on the day when the Argentine stock market opened after the devaluation. *** denotes significance at the 1% level, ** denotes significance at the 5% level and * denotes significance at the 10% level. Data source: Economatica.
ARG US ARG USConstant 0.0001 0.0003 -0.0008 -0.0032**
(-0.00039) (-0.0004) (-0.0021) (-0.0016)Local Market Portfolio 0.936*** 0.802*** 1.022*** 0.180***
(-0.0254) (-0.0264) (-0.0782) (-0.0477)Global Market Portfolio 1.036*** 1.039*** 0.567** 0.620***
(-0.0394) (-0.0402) (-0.2268) (-0.1737)Exchange Rate Change 0.1070 -0.0070
(-0.0811) (-0.0314)0.038*** 0.0000(-0.0134) (-0.0110)
number of obs 1038 1054 124 145R-squared 0.6639 0.6028 0.7776 0.1944Adjusted R-squared 0.6632 0.6020 0.7701 0.1714F-statistic 1023 798 104 8Log likelihood 3080 3094 299 374Durbin-Watson stat 1.9759 1.9685 1.7204 1.5383
Dummy for Devaluation Day
Variable Pre-Corralito Post-Corralito
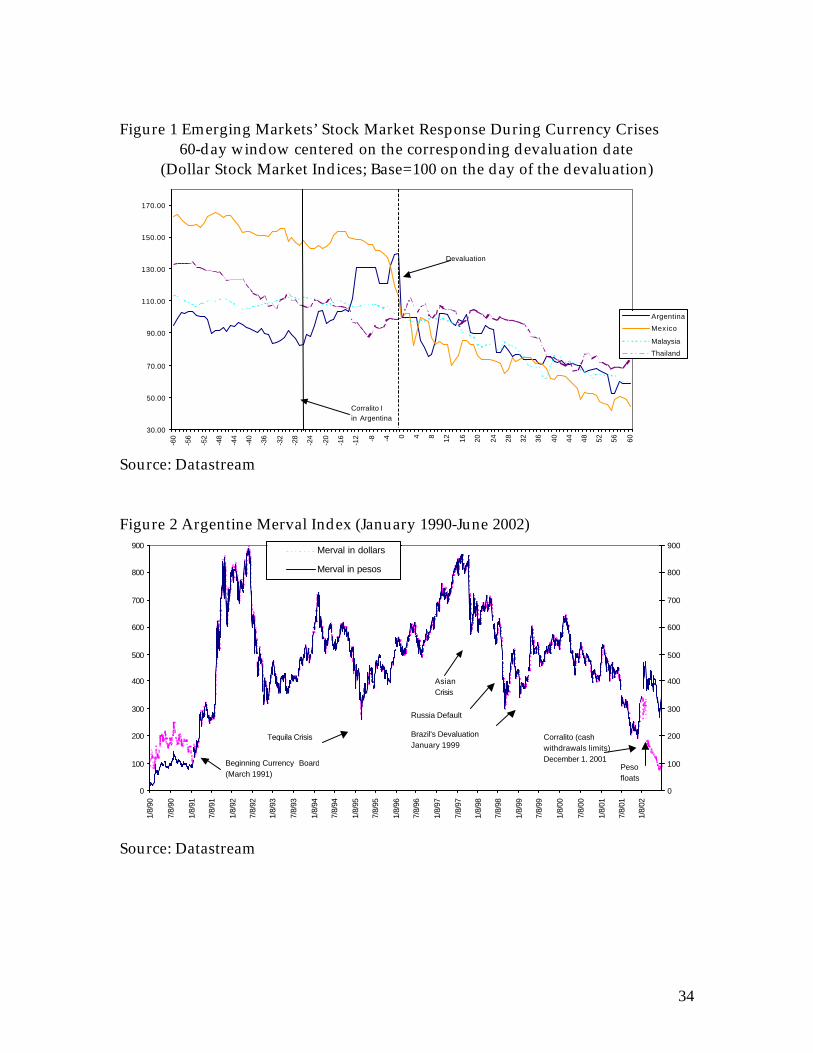
34
Figure 1 Emerging Markets’ Stock Market Response During Currency Crises 60-day window centered on the corresponding devaluation date
(Dollar Stock Market Indices; Base=100 on the day of the devaluation)
Source: Datastream Figure 2 Argentine Merval Index (January 1990-June 2002)
Source: Datastream
30.00
50.00
70.00
90.00
110.00
130.00
150.00
170.00
-60
-56
-52
-48
-44
-40
-36
-32
-28
-24
-20
-16
-12 -8 -4 0 4 8 12 16 20 24 28 32 36 40 44 48 52 56 60
Argentina
Mexico
Malaysia
Thailand
Corralito I in Argentina
Devaluation
0
100
200
300
400
500
600
700
800
900
1/8/
90
7/8/
90
1/8/
91
7/8/
91
1/8/
92
7/8/
92
1/8/
93
7/8/
93
1/8/
94
7/8/
94
1/8/
95
7/8/
95
1/8/
96
7/8/
96
1/8/
97
7/8/
97
1/8/
98
7/8/
98
1/8/
99
7/8/
99
1/8/
00
7/8/
00
1/8/
01
7/8/
01
1/8/
02
0
100
200
300
400
500
600
700
800
900Merval in dollars
Merval in pesos
Tequila Crisis Corralito (cash withdrawals limits)December 1, 2001
Russia Default
Brazil's DevaluationJanuary 1999
Asian Crisis
Beginning Currency Board (March 1991)
Peso floats

35
Figure 3 Prices of ADR and non-ADR Portfolios, Value Weighted July 1, 2001-October 18, 2002 (Value at the time of the imposition of Corralito, November 30, 2001=100)
Source: Economatica Figure 4 Volume Traded in Home Shares with ADRs and CEDEARs as a Fraction of Total Volume Traded in Ordinary and Cross-listed Stocks in Buenos Aires (monthly frequency, in %)
Source: Bolsar
80
100
120
140
160
180
200
220
240
260
280
300
7/2/
01
7/16
/01
7/30
/01
8/13
/01
8/27
/01
9/10
/01
9/24
/01
10/8
/01
10/2
2/01
11/5
/01
11/1
9/01
12/3
/01
12/1
7/01
12/3
1/01
1/14
/02
1/28
/02
2/11
/02
2/25
/02
3/11
/02
3/25
/02
4/8/
02
4/22
/02
5/6/
02
5/20
/02
6/3/
02
6/17
/02
7/1/
02
7/15
/02
7/29
/02
8/12
/02
8/26
/02
9/9/
02
9/23
/02
10/7
/02
Corralito = 100
ADR portfolio
Non-ADR portfolio
0
10
20
30
40
50
60
70
80
90
2000-0
1
2000-0
2
2000-0
3
2000-0
4
2000-0
5
2000-0
6
2000-0
7
2000-0
8
2000-0
9
2000-1
0
2000-1
1
2000-1
2
2001-0
1
2001-0
2
2001-0
3
2001-0
4
2001-0
5
2001-0
6
2001
-07
2001-0
8
2001-0
9
2001-1
0
2001
-11
2001-1
2
2002-0
1
2002-0
2
2002
-03
2002-0
4
2002-0
5
2002-0
6
2002-0
7
2002-0
8
2002-0
9
2002-1
0
2002-1
1
2002-1
2
Corralito imposed
ADRs
CEDEARs
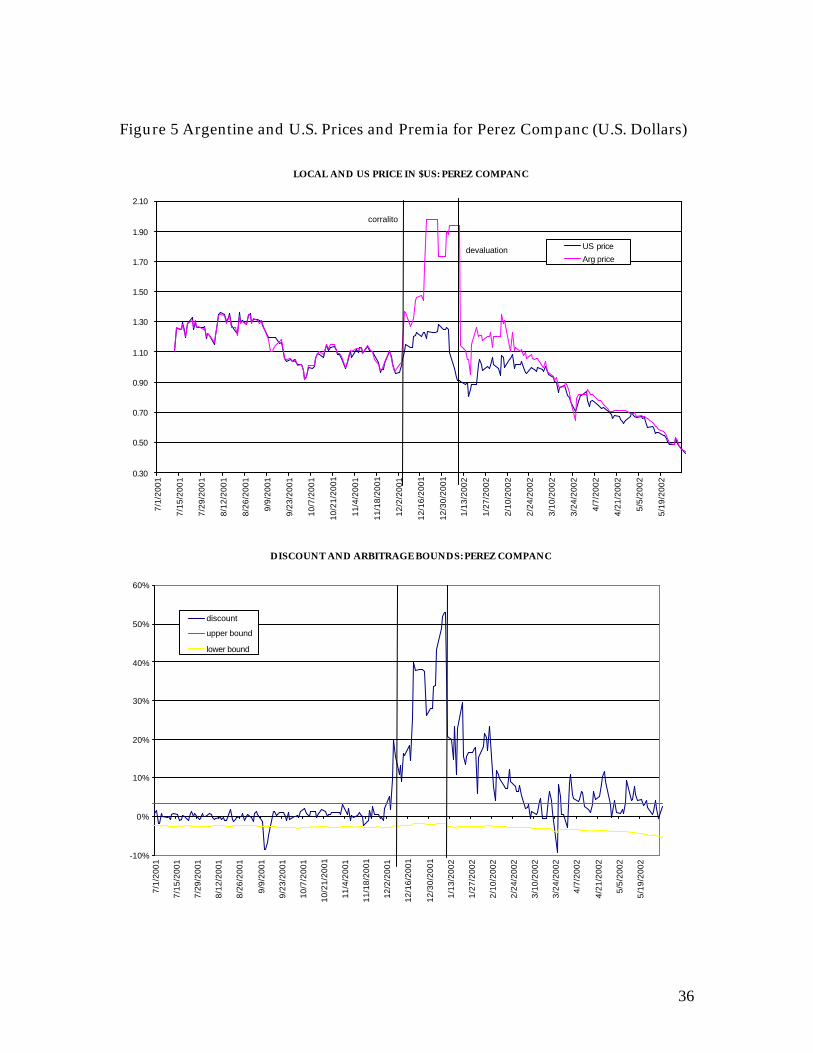
36
Figure 5 Argentine and U.S. Prices and Premia for Perez Companc (U.S. Dollars)
DISCOUNT AND ARBITRAGE BOUNDS: PEREZ COMPANC
-10%
0%
10%
20%
30%
40%
50%
60%
7/1/
2001
7/15
/200
1
7/29
/200
1
8/12
/200
1
8/26
/200
1
9/9/
2001
9/23
/200
1
10/7
/200
1
10/2
1/20
01
11/4
/200
1
11/1
8/20
01
12/2
/200
1
12/1
6/20
01
12/3
0/20
01
1/13
/200
2
1/27
/200
2
2/10
/200
2
2/24
/200
2
3/10
/200
2
3/24
/200
2
4/7/
2002
4/21
/200
2
5/5/
2002
5/19
/200
2
discount
upper bound
lower bound
LOCAL AND US PRICE IN $US: PEREZ COMPANC
0.30
0.50
0.70
0.90
1.10
1.30
1.50
1.70
1.90
2.10
7/1/
2001
7/15
/200
1
7/29
/200
1
8/12
/200
1
8/26
/200
1
9/9/
2001
9/23
/200
1
10/7
/200
1
10/2
1/20
01
11/4
/200
1
11/1
8/20
01
12/2
/200
1
12/1
6/20
01
12/3
0/20
01
1/13
/200
2
1/27
/200
2
2/10
/200
2
2/24
/200
2
3/10
/200
2
3/24
/200
2
4/7/
2002
4/21
/200
2
5/5/
2002
5/19
/200
2
US price
Arg pricedevaluation
corralito
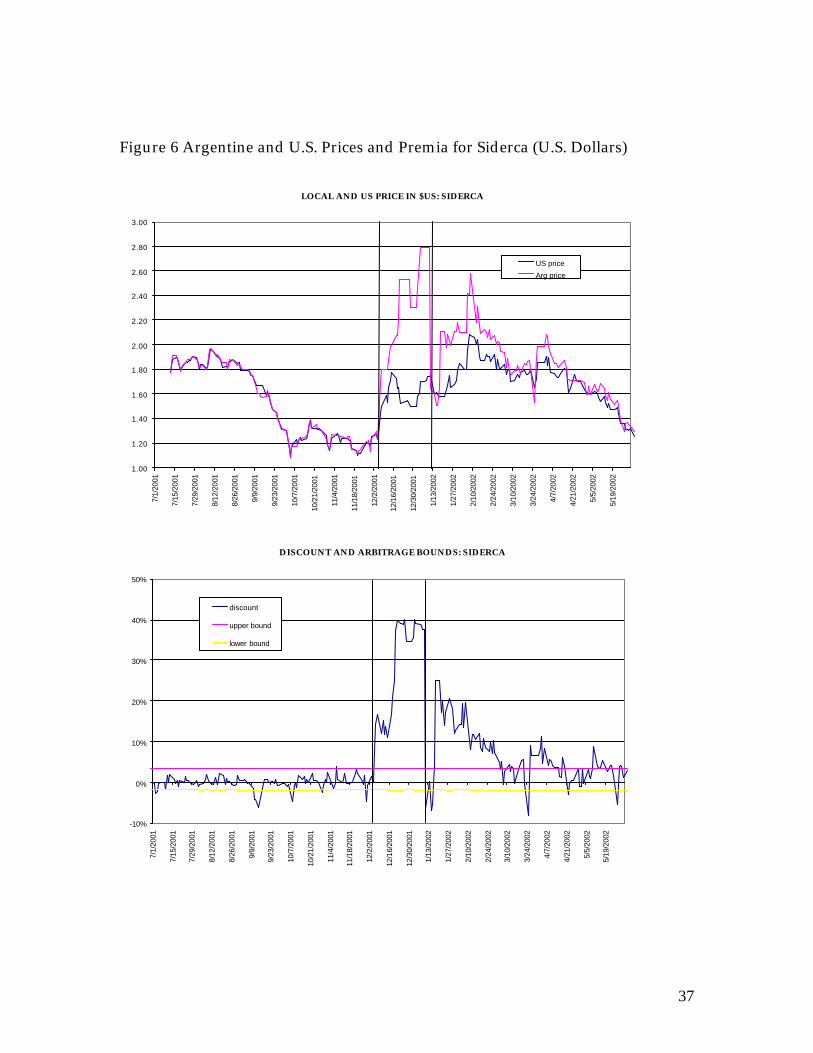
37
Figure 6 Argentine and U.S. Prices and Premia for Siderca (U.S. Dollars)
LOCAL AND US PRICE IN $US: SIDERCA
1.00
1.20
1.40
1.60
1.80
2.00
2.20
2.40
2.60
2.80
3.00
7/1/
2001
7/15
/200
1
7/29
/200
1
8/12
/200
1
8/26
/200
1
9/9/
2001
9/23
/200
1
10/7
/200
1
10/2
1/20
01
11/4
/200
1
11/1
8/20
01
12/2
/200
1
12/1
6/20
01
12/3
0/20
01
1/13
/200
2
1/27
/200
2
2/10
/200
2
2/24
/200
2
3/10
/200
2
3/24
/200
2
4/7/
2002
4/21
/200
2
5/5/
2002
5/19
/200
2
US price
Arg price
DISCOUNT AND ARBITRAGE BOUNDS: SIDERCA
-10%
0%
10%
20%
30%
40%
50%
7/1/
2001
7/15
/200
1
7/29
/200
1
8/12
/200
1
8/26
/200
1
9/9/
2001
9/23
/200
1
10/7
/200
1
10/2
1/20
01
11/4
/200
1
11/1
8/20
01
12/2
/200
1
12/1
6/20
01
12/3
0/20
01
1/13
/200
2
1/27
/200
2
2/10
/200
2
2/24
/200
2
3/10
/200
2
3/24
/200
2
4/7/
2002
4/21
/200
2
5/5/
2002
5/19
/200
2discount
upper bound
lower bound

38
Figure 7 Implicit Exchange Rates on ADR and CEDEAR Transactions (including transactions costs) Relative to the Actual Spot Exchange Rate, January 1, 2001 to December 31, 2002
Source: Bloomberg and Economatica Note: implicit exchange rates are calculated as simple averages across ADR and CEDEAR securities on days when the securities were traded in both markets.
0.81
1.21.41.61.8
22.22.42.62.8
33.23.43.63.8
44.24.44.64.8
5
1/1/
01
2/1/
01
3/1/
01
4/1/
01
5/1/
01
6/1/
01
7/1/
01
8/1/
01
9/1/
01
10/1
/01
11/1
/01
12/1
/01
1/1/
02
2/1/
02
3/1/
02
4/1/
02
5/1/
02
6/1/
02
7/1/
02
8/1/
02
9/1/
02
10/1
/02
11/1
/02
12/1
/02
implicit ADR exchange rate
Actual Exchange Rate
Implicit CEDEAR exchange rate
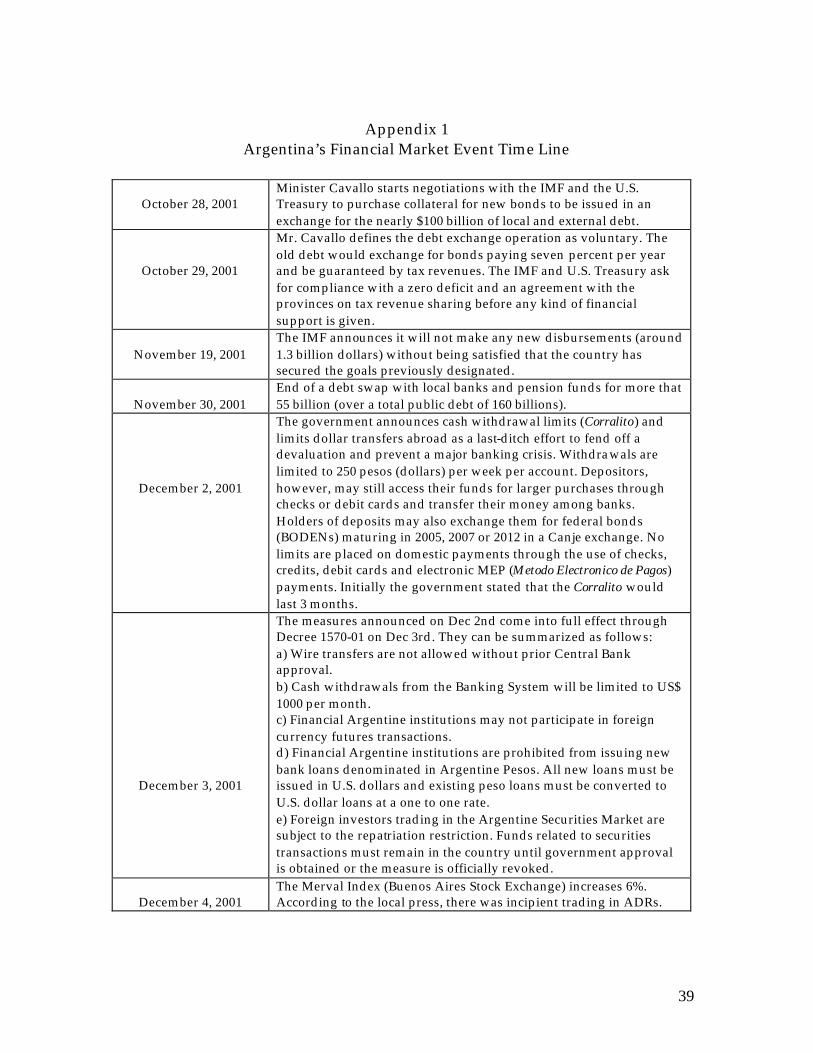
39
Appendix 1 Argentina’s Financial Market Event Time Line
October 28, 2001 Minister Cavallo starts negotiations with the IMF and the U.S. Treasury to purchase collateral for new bonds to be issued in an exchange for the nearly $100 billion of local and external debt.
October 29, 2001
Mr. Cavallo defines the debt exchange operation as voluntary. The old debt would exchange for bonds paying seven percent per year and be guaranteed by tax revenues. The IMF and U.S. Treasury ask for compliance with a zero deficit and an agreement with the provinces on tax revenue sharing before any kind of financial support is given.
November 19, 2001
The IMF announces it will not make any new disbursements (around 1.3 billion dollars) without being satisfied that the country has secured the goals previously designated.
November 30, 2001
End of a debt swap with local banks and pension funds for more that 55 billion (over a total public debt of 160 billions).
December 2, 2001
The government announces cash withdrawal limits (Corralito) and limits dollar transfers abroad as a last-ditch effort to fend off a devaluation and prevent a major banking crisis. Withdrawals are limited to 250 pesos (dollars) per week per account. Depositors, however, may still access their funds for larger purchases through checks or debit cards and transfer their money among banks. Holders of deposits may also exchange them for federal bonds (BODENs) maturing in 2005, 2007 or 2012 in a Canje exchange. No limits are placed on domestic payments through the use of checks, credits, debit cards and electronic MEP (Metodo Electronico de Pagos) payments. Initially the government stated that the Corralito would last 3 months.
December 3, 2001
The measures announced on Dec 2nd come into full effect through Decree 1570-01 on Dec 3rd. They can be summarized as follows: a) Wire transfers are not allowed without prior Central Bank approval. b) Cash withdrawals from the Banking System will be limited to US$ 1000 per month. c) Financial Argentine institutions may not participate in foreign currency futures transactions. d) Financial Argentine institutions are prohibited from issuing new bank loans denominated in Argentine Pesos. All new loans must be issued in U.S. dollars and existing peso loans must be converted to U.S. dollar loans at a one to one rate. e) Foreign investors trading in the Argentine Securities Market are subject to the repatriation restriction. Funds related to securities transactions must remain in the country until government approval is obtained or the measure is officially revoked.
December 4, 2001
The Merval Index (Buenos Aires Stock Exchange) increases 6%. According to the local press, there was incipient trading in ADRs.

40
December 7, 2001
Following Decree 1570, the Central Bank established an information procedure for the processing of automatic and non-automatic authorizations of repatriation. According to this rule, coupon payments on National Government Bonds have automatic transfer authorization and all other types of payments and repatriations of U.S. dollars are subject to Central Bank approval.
December 19, 2001 Mr. Cavallo and all other ministers resign.
December 20, 2001 President Dela Rua resigns and Mr. Ramon Puerta becomes interim president. Country Risk reaches 4618 points . Global (sovereign) bond yields reach their historical maximum of 49% annual return in dollars.
December 21, 2001
The official Foreign Exchange Rate market is closed until the 10th of January, 2002.
December 23, 2001
Mr. Rodriguez Saa, governor of one of the provinces, becomes the new interim president for 60 days, until elections are called in March, 2002. He declares the suspension of external debt payments for at least 60 days, totaling $166bn in federal and provincial debt.
December 24, 2001
The government announces that a new fiat currency (i.e., without foreign-currency backing) would be created (the argentino).
December 30, 2001
Interim president Mr. Rodriguez Saa resigns and the legislative assembly elects Mr. Eduardo Duhalde as new president.
December 31, 2001
In the midst of political instability and closed foreign exchange markets, the peso trades on the black market at 1.35 pesos per dollar.
January 2, 2002 Mr. Duhalde assumes power.
January 7, 2002
The new Minister of Finance, Mr. Lenicov, announces the devaluation of the peso and a new dual foreign exchange rate regime, to be implemented on the 9 th of January, 2002.
January 11, 2002
After several delays, the exchange rate market re-opens and the new dual exchange rate system is put in place, under the “Public Emergency and Exchange Regulations” approved by Congress. The main articles and measures are the following: a) 1 Argentinean peso= 1 U.S. dollar parity (Convertibility Plan) is abolished. For emergency reasons, the Executive Power- President- has been authorized to determine both the new official rate of exchange between the Argentinean peso and foreign currency and exchange rate regulations. b) All debts (capital and interests) agreed in ARG currency with financial entities - converted into U.S. dollars according to the Decree 1570/2001- will be reconverted into the original currency agreed (pesos). c) The official, fixed conversion rate - 1 U.S Dollar=1.4 pesos will be relevant for foreign trade operations. The free or floating rate will be used for all other transactions and freely determined by the market. The peso was quoted at 1.8 per dollar at money-changers in Buenos Aires. The peso's decline was limited by the government's decision to reduce the amount of money in circulation through a freeze on deposits, withdrawal restrictions and a central bank order blocking banks from selling the U.S. currency via electronic transactions.

41
January 21, 2002
The government announces the easing of bank withdrawal restrictions: a) Up to 7,000 pesos can be withdrawn from term deposits in pesos (transferring that money to a checking account) b) Up to 5,000 dollars can be withdrawn from term deposits in dollars (transferring that money to a checking account at the official exchange rate, 1.40). c) Up to 5,000 dollars in a saving account can be pesofied at the official exchange rate.
February 3, 2002
Mr. Lenicov announces an asymmetric pesofication and the end of the dual exchange rate regime. The fundamental economic measures were the following: a) pesofication of all dollar deposits at 1.4 pesos per dollar. b) corporate and consumer debts are also pesofied , but at the exchange rate prevailing during the Convertibility period. Both deposits and credit will be indexed to inflation. c) the end of the dual exchange rate regime and a unified floating exchange rate determined by market forces. d) the right to withdraw wage and pension income from the corralito without any amount restrictions (before workers could only extract up to 1.500 pesos). Corralon starts which freezes bank term deposits (holders of term deposits had the option to convert them into CEDROs or BODENs maturing in 2007 or 2012 in a Canje exchange).
February 4, 2002
The official foreign exchange market is closed again until the 11th of February.
February 8, 2002
While the foreign exchange market is closed and before devaluation uncertainty is resolved, the stock market index increases. The pesification of all debts announced in Argentina drives up share prices of firms heavily indebted in pesos and banks. The mix of announced policy measures not yet implemented, (including the pesification of all debts and the prospects of a large devaluation once the market re-opened) and the non -operation of the exchange rate market, induce some investors to reverse the capital-outflow process, converting ADRs back into underlying shares and selling them in the Argentinean market. The implicit dollar rate obtained through this operation was 2.56 pesos (above the 2.35 pesos in the black market) and allowed the repayment of pesofied corporate debt.
February 11, 2002
The BCRA establishes a new unified free foreign exchange market, which replaces the two markets - official and free - implemented in January. The exchange rate market re-opens and the floating dollar exchange rate reaches 2.1 pesos, well below the devaluation expectations built-into asset prices.
February 12, 2002
The stock market drops an accumulated 18% in the two business days following the launching of the new exchange rate regime.
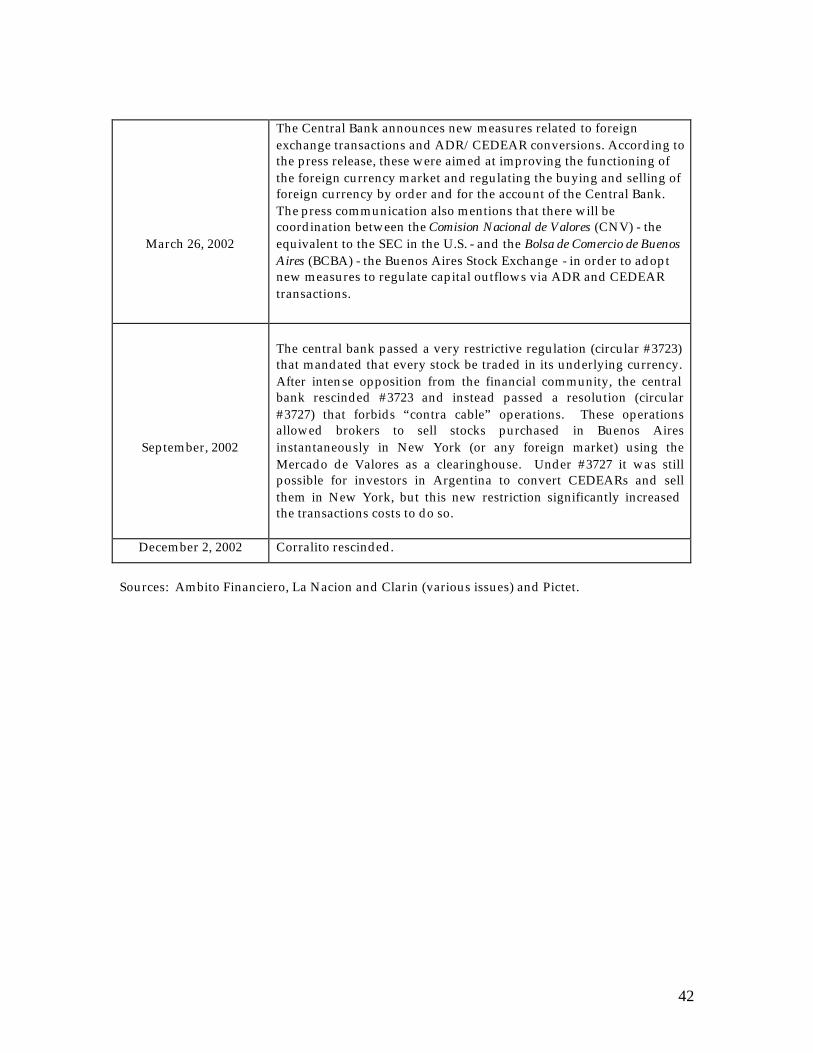
42
March 26, 2002
The Central Bank announces new measures related to foreign exchange transactions and ADR/CEDEAR conversions. According to the press release, these were aimed at improving the functioning of the foreign currency market and regulating the buying and selling of foreign currency by order and for the account of the Central Bank. The press communication also mentions that there will be coordination between the Comision Nacional de Valores (CNV) - the equivalent to the SEC in the U.S. - and the Bolsa de Comercio de Buenos Aires (BCBA) - the Buenos Aires Stock Exchange - in order to adopt new measures to regulate capital outflows via ADR and CEDEAR transactions.
September, 2002
The central bank passed a very restrictive regulation (circular #3723) that mandated that every stock be traded in its underlying currency. After intense opposition from the financial community, the central bank rescinded #3723 and instead passed a resolution (circular #3727) that forbids “contra cable” operations. These operations allowed brokers to sell stocks purchased in Buenos Aires instantaneously in New York (or any foreign market) using the Mercado de Valores as a clearinghouse. Under #3727 it was still possible for investors in Argentina to convert CEDEARs and sell them in New York, but this new restriction significantly increased the transactions costs to do so.
December 2, 2002 Corralito rescinded.
Sources: Ambito Financiero, La Nacion and Clarin (various issues) and Pictet.
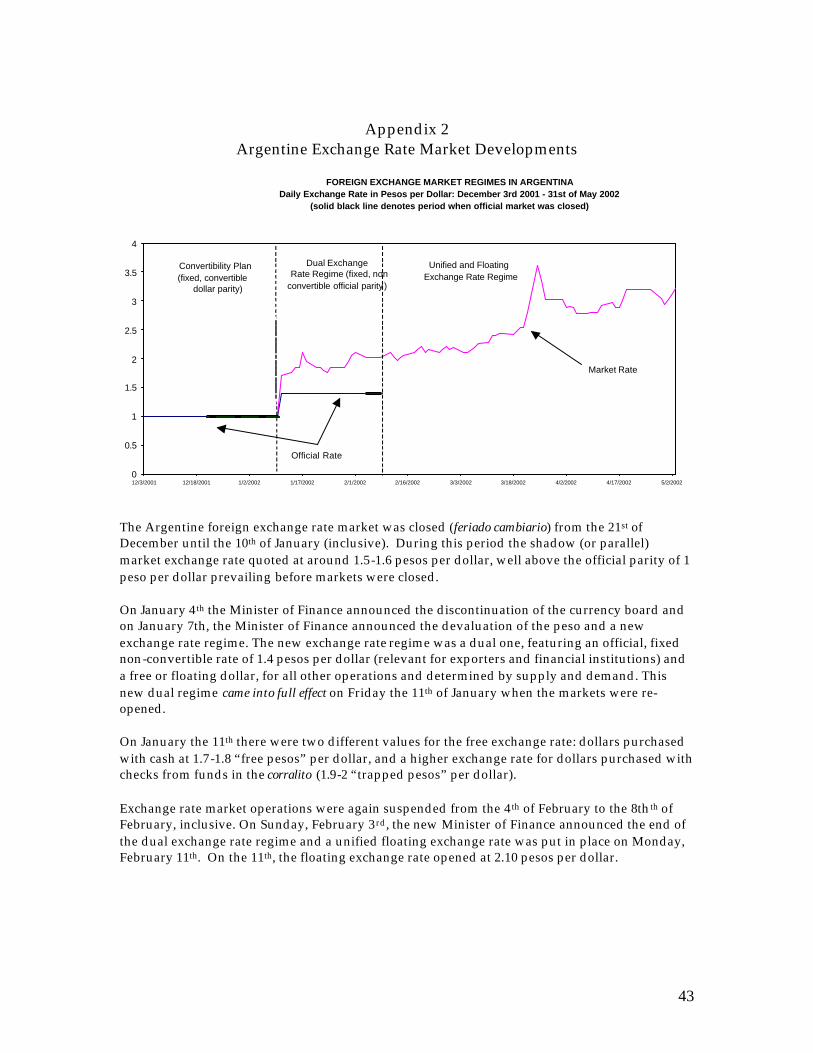
43
Appendix 2 Argentine Exchange Rate Market Developments
The Argentine foreign exchange rate market was closed (feriado cambiario) from the 21st of December until the 10th of January (inclusive). During this period the shadow (or parallel) market exchange rate quoted at around 1.5-1.6 pesos per dollar, well above the official parity of 1 peso per dollar prevailing before markets were closed. On January 4 th the Minister of Finance announced the discontinuation of the currency board and on January 7th, the Minister of Finance announced the devaluation of the peso and a new exchange rate regime. The new exchange rate regime was a dual one, featuring an official, fixed non-convertible rate of 1.4 pesos per dollar (relevant for exporters and financial institutions) and a free or floating dollar, for all other operations and determined by supply and demand. This new dual regime came into full effect on Friday the 11th of January when the markets were re-opened. On January the 11th there were two different values for the free exchange rate: dollars purchased with cash at 1.7-1.8 “free pesos” per dollar, and a higher exchange rate for dollars purchased with checks from funds in the corralito (1.9-2 “trapped pesos” per dollar). Exchange rate market operations were again suspended from the 4 th of February to the 8th th of February, inclusive. On Sunday, February 3 rd, the new Minister of Finance announced the end of the dual exchange rate regime and a unified floating exchange rate was put in place on Monday, February 11th. On the 11th, the floating exchange rate opened at 2.10 pesos per dollar.
FOREIGN EXCHANGE MARKET REGIMES IN ARGENTINADaily Exchange Rate in Pesos per Dollar: December 3rd 2001 - 31st of May 2002
(solid black line denotes period when official market was closed)
0
0.5
1
1.5
2
2.5
3
3.5
4
12/3/2001 12/18/2001 1/2/2002 1/17/2002 2/1/2002 2/16/2002 3/3/2002 3/18/2002 4/2/2002 4/17/2002 5/2/2002
Convertibility Plan (fixed, convertible
dollar parity)
Dual Exchange Rate Regime (fixed, non-convertible official parity)
Unified and Floating Exchange Rate Regime
Market Rate
Official Rate