The Role of Cross-Border Power Transmission in a Renewable ...
Upload
vuongtuyenCategory
view
219download
1
www.bpdb.gov.bd
Md. Mizanur Rahman
Chief Engineer, Planning and Design, BPDB
April 29, 2014
Cross Border Power Trade
with Neighboring Countries
Bangladesh

www.bpdb.gov.bd 2
Economy of Bangladesh at a Glance
INDIA
CHINA
DHAKA
KHULNA
RAJSHAHI
SYLHET
CHITTAGONG
BARISAL
INDIA
INDIA
INDIA
200 miles
500 km
Official Name : People’s Republic of
Bangladesh
Political System: Parliamentary Democracy
Area : 147,570 km2
Population : 154 million
Total Exports : USD 27 billon (FY2013)
Total Imports : USD 34 billon (FY2013)
Remittance : USD 14.5 billon (FY2013)
Forex Reserve : USD 20 billion
GDP Per Capita : USD 1044 (FY 2013)
Power Capacity : 10,000 MW

www.bpdb.gov.bd 33
3.3
5.04.6
4.1
4.9
4.6
5.4 5.2
4.9
5.9
5.3
4.4
5.3
6.36.0
6.6 6.4 6.25.7
6.1
6.7
6.3 6.03
2
3
4
5
6
7
1991 1992 1993 1994 1995 1996 1997 1998 1999 2000 2001 2002 2003 2004 2005 2006 2007 2008 2009 2010 2011 2012 2013
Re
al
GD
P G
ro
wth
(%
)
Natural Disasters External Shocks Linear Trend line (Real GDP Growth)
Tropical Cyclone 04B:
Casualty: 650 people
17,000 cattle.
Severe Floods: 36% of
the country flooded 36
mn people affected.
Cyclone Sidr: 3500 people
killed
Major floods: 500 died, 30%
of the country affected
Tropical catastrophic
cyclone
Most severe flooding in modern
history : 66% of the land affected,
1000 deaths 26,000 livestock lost,
16,000 km roads damaged.
Bangladesh has maintained consistent growth and never defaulted on its internal or external debt obligations despite the Asian and
Global Financial Crises, numerous political upheavals and countless natural disasters. This consistency is practically unrivaled
amongst countries of a similar level of development
GROWTH IS REMARKABLY STABLE AGAINST ALL SHOCKSResilient growth despite regular political, environmental and external setbacks
Cyclone 2B:
Casualty: 400
people
8,000 cattle
Very severe
tropical
Cyclone BOB 01
Asian
Economic
Crisis
Very severe cyclonic storm BOB
06:
300,000 affected,
8755 homes destroyed
MFA
Phase Out
Oil Price
reaches
>US$140/b
Economic
Crisis
Slowdown
after 9/11

www.bpdb.gov.bd
GDP Growth, Electricity Demand and Challenges
With sustained GDP Growth, Electricity demand is
increasing at a rate of 9 -12 %
To meet this demand growth, power sector is facing
challenges mainly:
- Shortage of primary fuel supply from indigenous resources
- Financing capital intensive power projects
www.bpdb.gov.bd
88
3
68
1
1,0
31
1,2
02
1,2
56
1,3
87
1,5
38
1,8
17
2,0
16
2,2
36
2,5
29
2,8
85
3,2
61
3,7
68
4
,30
2
4,5
60
5,3
08
6,2
14
6,7
59
7,3
45
7,8
57
8,4
50
8,7
46
9,2
95
1
0,2
66
10
,90
1
11
,24
3
12
,19
4
13
,63
8
14
,73
9
16
,25
5
17
,44
5
18
,45
8
20
,30
2
21
,40
8
22
,97
8
23
,26
8
24
,94
6
26
,53
3
29
,24
7
31
,35
5
35
,11
8
38
,22
9
0
5,000
10,000
15,000
20,000
25,000
30,000
35,000
40,000
45,000
19
70
-71
19
72
-73
19
74
-75
19
76
-77
19
78
-79
19
80
-81
19
82
-83
19
84
-85
19
86
-87
19
88
-89
19
90
-91
19
92
-93
19
94
-95
19
96
-97
19
98
-99
20
00
-01
20
02
-03
20
04
-05
20
06
-07
20
08
-09
20
10
-11
20
12
-13
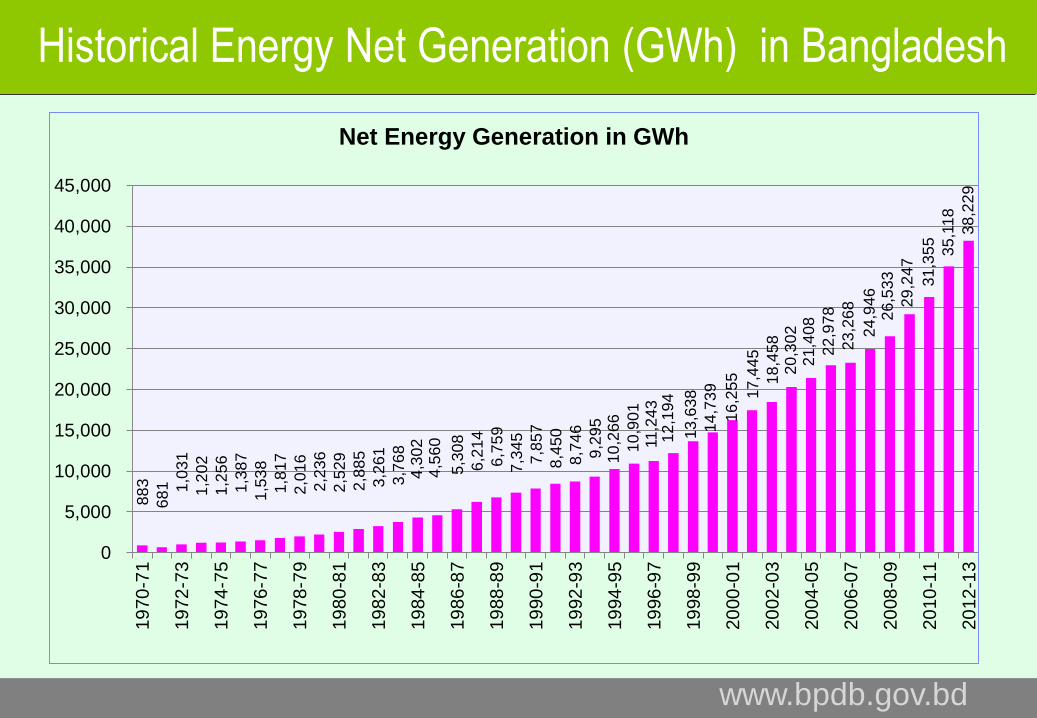
Net Energy Generation in GWh
Historical Energy Net Generation (GWh) in Bangladesh

www.bpdb.gov.bd
Strategic Policy on Power
Fuel diversity and sustainable supply of primary fuel
Private sector participation in power generation
Harnessing renewable energy resources
Demand Side Management (DSM) and Energy
Efficiency improvement program
Regional Co-operation on Cross Boarder Power
Trade

www.bpdb.gov.bd
Bangladesh’s Power Sector: At a Glance
Installed Generation Capacity : 10,341 MW
Electricity Growth : 9 -12 %
Total Consumers : 14.2 Million
Transmission Lines : 9,300 km
Distribution Lines : 290,000 km
Per Capita Generation (Inc Captive): 321 kWh
Access to Electricity (Inc 7% RE) : 62 %
7

www.bpdb.gov.bd
Present Generation Capacity (March, 2014)
8
Public Sector
SL Installed Generation Capacity (MW)
1. BPDB 4186
2. APSCL 777
3. EGCB 622
4. NWPGCL 300
5. RPCL 77
Subtotal 5,962 (58%)
Private Sector
1. IPPs 1783
2. 15 YR. Rental 167
3. 3/5 YR. Rental 1929
4. Power Import 500
Subtotal 4,379 (42%)
Total 10,341

www.bpdb.gov.bd 9
Typical Demand Curve
0300600900
12001500180021002400270030003300360039004200450048005100540057006000630066006900720075007800810084008700
0:00
1:00
2:00
3:00
4:00
5:00
6:00
7:00
8:00
9:00
10:00
11:00
12:00
13:00
14:00
15:00
16:00
17:00
18:00
19:00
20:00
21:00
22:00
23:00
24:00
Load
(MW
)
Typical demand for FY 2012-2013
July'12 August'12 September'12 October'12November'12 December'12 January'13 February'13March'13 April'13 May'13 June'13

www.bpdb.gov.bd 10
Present Power Market in
Bangladesh
www.bpdb.gov.bd
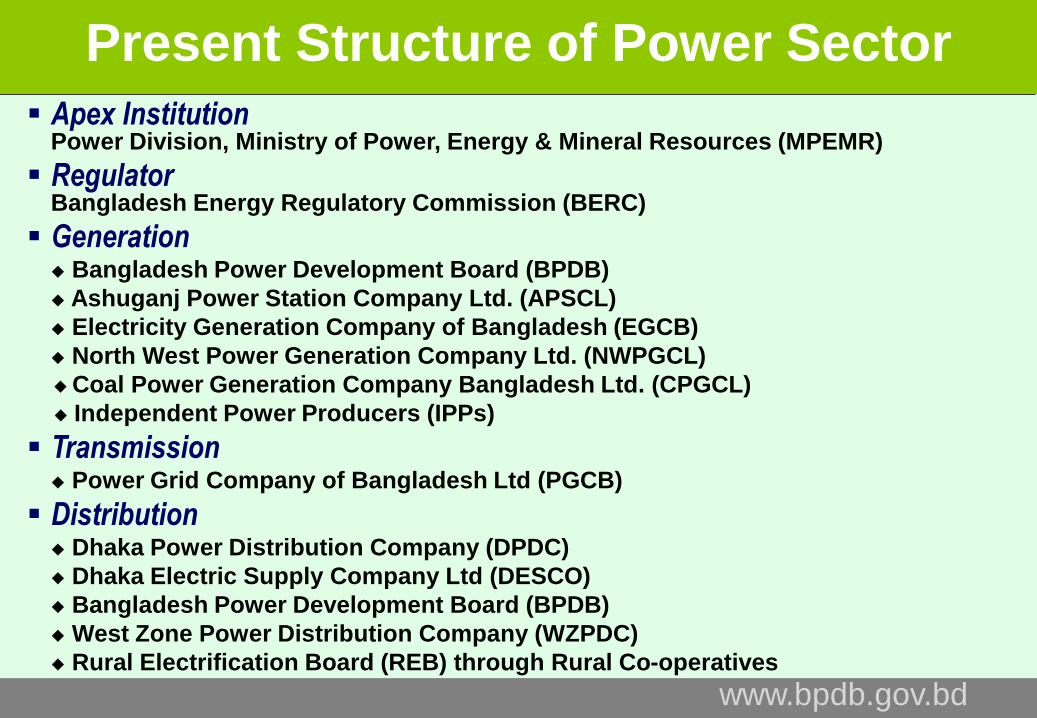
Present Structure of Power Sector
Apex InstitutionPower Division, Ministry of Power, Energy & Mineral Resources (MPEMR)
RegulatorBangladesh Energy Regulatory Commission (BERC)
Generation Bangladesh Power Development Board (BPDB)
Ashuganj Power Station Company Ltd. (APSCL)
Electricity Generation Company of Bangladesh (EGCB)
North West Power Generation Company Ltd. (NWPGCL)
Coal Power Generation Company Bangladesh Ltd. (CPGCL)
Independent Power Producers (IPPs)
Transmission Power Grid Company of Bangladesh Ltd (PGCB)
Distribution Dhaka Power Distribution Company (DPDC)
Dhaka Electric Supply Company Ltd (DESCO)
Bangladesh Power Development Board (BPDB)
West Zone Power Distribution Company (WZPDC)
Rural Electrification Board (REB) through Rural Co-operatives

www.bpdb.gov.bd12
Single Buyer Power Market
BPDB Acts as a Single Buyer
Purchaser & Seller of power as a “Single Buyer”- Purchase electricity from generators (public and private) under
long term PPA
- Sells to distribution entities at Bulk Tariff, set by BERC
- BPDB responsible for demand-supply balance and prepare least
cost generation expansion plan

www.bpdb.gov.bd 13
Primary Fuel Supply
Options for Bangladesh

www.bpdb.gov.bd14
Fuel Mix: FY-2010 & 2013
Hydro2.34%
Natural Gas
78.12%
Furnace Oil
14.56%
Diesel1.95% Coal
3.02%
Total Net Generation : 38,229 M kWh
FY-2013
Gas
89.21%
FO
3.00%
Diesel
1.76%
Hydro
2.50%Coal
3.53%
FY-2010
Total Net Generation : 29,247 M kWh

www.bpdb.gov.bd 15
Primary Fuel Options: Indigenous Resources
Gas: Only 16 tcf proven reserve; No significant gas discovery in recent years; Depleting gas reserve restricts gas based generation expansion; R/P ration is only about 20 years.
Hydro: Present capacity 230 MW and average energy generation- 800 GWh; No further significant potential
Coal: Total 3.2 billion ton reserve in 5 mines; Near term option; Base Load; Mines are in densely populated areas
Renewable: Present capacity only 120 MW; Mostly SHS; still high cost

www.bpdb.gov.bd 16
Coal Import: Indonesia, Australia, South Africa
LNG Import
Oil- Volatile Market
Nuclear
Regional Hydro Power Import- Cross Boarder Power Trade
Import Options as Indigenous resources are Inadequate
Primary Fuel Supply Options: Import

www.bpdb.gov.bd 17
Long Term Power Generation Expansion
Plan

www.bpdb.gov.bd 18
PSMP Peak Demand Forecast 2030
FYGDP growth
rateElasticity Effect of DSM
Electricity
growth rate
Total Demand
without DSM
Total Demand with DSM
Off-grid
captive demand
Grid System
Demand with
DSM
Unit [%] - [%] [%] [MW] [MW] [MW] [MW]
2010 5.5% 1.50 5.0% 7,454 7,454 1,000 6,4542011 6.7% 1.50 5.0% 4.5% 8,203 7,793 1,027 6,7652012 7.0% 1.50 5.0% 10.5% 9,064 8,611 1,093 7,5182013 7.0% 1.50 5.0% 10.5% 10,016 9,515 1,166 8,3492014 7.0% 1.50 5.0% 10.5% 11,068 10,514 1,246 9,2682015 7.0% 1.50 5.0% 10.5% 12,230 11,618 1,335 10,2832016 7.0% 1.50 5.0% 10.5% 13,514 12,838 1,433 11,4052017 7.0% 1.50 5.0% 10.5% 14,933 14,186 1,542 12,6442018 7.0% 1.50 5.0% 10.5% 16,501 15,676 1,662 14,0142019 7.0% 1.50 5.0% 10.5% 18,233 17,322 1,794 15,5272020 7.0% 1.40 6.0% 8.6% 20,020 18,819 1,515 17,3042021 7.0% 1.35 6.5% 8.9% 21,912 20,488 1,649 18,8382022 7.0% 1.30 7.0% 8.5% 23,906 22,233 1,790 20,4432023 7.0% 1.25 8.0% 7.6% 25,998 23,918 1,925 21,9932024 7.0% 1.20 9.0% 7.2% 28,182 25,645 2,064 23,5812025 7.0% 1.15 10.0% 6.9% 30,450 27,405 2,206 25,1992026 7.0% 1.10 11.0% 6.5% 32,795 29,187 2,349 26,8382027 7.0% 1.05 12.0% 6.1% 35,205 30,981 2,494 28,4872028 7.0% 1.00 13.0% 5.8% 37,670 32,773 2,638 30,1342029 7.0% 1.00 14.0% 5.8% 40,306 34,664 2,790 31,8732030 7.0% 1.00 15.0% 5.8% 43,128 36,659 2,951 33,708

www.bpdb.gov.bd 19
Power Generation Plan: Primary Fuel Sources by 2030
Sl.
No.Description Capacity (MW) % Possible Location (s)
1 Domestic Coal 11,25051
North West Region at Mine Mouth
2 Imported Coal 8,400 Chittagong and Khulna
3 Domestic Gas/LNG 8,850 23Gas- Near Load Centers
LNG- Near Costal Area
4 Regional Grid 3,500 9Bahrampur - Bheramara, Silchar -
Fenchuganj, Purnia- Barapukuria-
Bongaigaon, Myanmar - Chittagong
5 Nuclear 4,000 10 Rooppur
6Others (Oil, Hydro
and Renewable)2,700 7 Near Load Centers
Total 38,700

www.bpdb.gov.bd
Chittagong 3x660MW
Import Coal
Road Map for Coal Power Development (as of 2030)
: Potential Coal PS
: Potential Coal Center
: Ocean-going vessel
: Transship
Khulna 2x660MW (Dom Future)
Domestic Coal
K-D-P 6x1000 MW USC
K-D-P 8x 600 MW USC
Matarbari
Coal Center
Zajira/New Meg 3x600MW
Chittagong
Moheshkhali
Island
Railway
Total 19,200MW (New)
Moheshkhali/Matarbari 4x600MW
Meghnaghat 2x600MW

www.bpdb.gov.bd
FENCHUGANJ
SILCHARFENCHUGANJ
BHERAMARABAHARAMPUR
BAHARAMPURBHERAMARA
NR/ WR of IndiaBARAPUKURIA
500MW [2013-]
500MW [2018-]
2000MW500 MW
Regional Power Exchange: Possibilities
MYANMARCHITTAGONG
500 MW
RANGIA/ROWTABARAPUKURIA
2000MW
TRIPURACOMILLA
100 MW

www.bpdb.gov.bd
BOGRASOUTH
BHERAMARA
NAOGAON
NIAMATPUR
FARRAKA
SUBHASGRAM
KATWA
GOKARNA
JEERAT
KHULNA(SOUTH)
BOTTAIL
BAHARAMPUR
CH. NAWABGANJ
RAGHUNATHGANJ
KA
HA
LGA
ON
SAGARDIGHI
RAJSHAHI
BAHARAMPUR
ISHURDI
NATORE
KHEJURIA
FARIDPUR
BAGHABARI
GHORASAL
MA
DH
OP
UR
SHAHJAD
PABNAPUR
SIRAJGANJ
BOGRA
INTERCONNECTION BETWEEN INDIA AND BANGLADESH GRIDS
400 kV230 kV132 kV
THE PROJECT
LEGEND
BAKRESHWAR
KOLAGHAT
BANGLADESH
INDIA
400kV D/c
(400 KV)
MALDA
DHULIAN
DURGAPUR
Existing
Under Constr. / Future
JAYPURHAT BARAPUKURIA
First Regional Power Inter-Connection Line

www.bpdb.gov.bd
Case-1
Case-2
Case-3
Possible Next Cross Border Interconnections

www.bpdb.gov.bd
Proposed interconnection :
- +800kV, 6500 MW HVDC multi-terminal line from Rangia/Rowta (India) - Jamalpur/Barapukuria
(Bangladesh) - suitable location in WR/NR/SR (India).
- Establishment of +800kV, 6500 MW HVDC terminal station at Rangia/Rowta.
- Establishment of +800kV, 500/1000 MW HVDC terminal station at Jamalpur/Barapukuria.
- Establishment of 400kV substation at Rangia/Rowta by looping in and looping out of Balipara –
Bongaigaon 400kV D/c line (quad conductor)
- Establishment of +800kV, 5500 MW HVDC terminal station at suitable location in
Western/Northern/Southern Region.
Next Asynchronous Interconnection

www.bpdb.gov.bd 25
Present Power Import
250 MW Import from unallocated resource of Indian
Government; NVVN is the nodal agency for power trade
250 MW power from Indian market through PTC for short
term 3 yr contract
30 MW from IEX is under consideration
Present Power Trade Through 1st Inter-connector

www.bpdb.gov.bd 26
Power Import in Future
Long Term Contract mainly with IPPs developing HEP in
Arunachal, Nepal and Bhutan
Short Term Contract from Indian Power Market
Power Trade from ‘Regional Power Market’ in future where
Bangladesh, India, Nepal, Bhutan, Sri Lanka will
participate
BPDB can participate in the ‘Regional Power Market’ as it
is Single Buyer in the local market
Future Power Trade

www.bpdb.gov.bd 27
Conclusion
Diversity of power sources will ensure energy security in
Bangladesh
Availability of power at competitive price is a pre-condition
for power market in South Asia
Development of hydro resources in North-Eastern India,
Nepal, Bhutan and Power Trade among neighboring
countries will bring economic benefits to all the countries.
Establishment of ‘Regional Power Market’ is utmost priority
for maximizing benefits and ensuring energy security in
South Asia

www.bpdb.gov.bd 28
Thank you