Crop Updates 2008 - Cereals - Research Library
113
Research Library Research Library Crop Updates Grain and other field crop research 13-2-2008 Crop Updates 2008 - Cereals Crop Updates 2008 - Cereals Christine Zaicou Department of Agriculture and Food Shahajahan Miyan Department of Agriculture and Food Brenda Shackley Department of Agriculture and Food Steve Penny Department of Agriculture and Food Sarah Ellis Department of Agriculture and Food See next page for additional authors Follow this and additional works at: https://researchlibrary.agric.wa.gov.au/crop_up Part of the Agribusiness Commons, Agronomy and Crop Sciences Commons, Atmospheric Sciences Commons, Marketing Commons, Plant Biology Commons, Plant Breeding and Genetics Commons, Plant Pathology Commons, and the Statistical Methodology Commons Recommended Citation Recommended Citation Zaicou, C, Miyan, S, Shackley, B, Penny, S, Ellis, S, Sharma, D, Paynter, B, Russell, J, Hills, A, Riethmuller, G, Bowden, B, Blackwell, P, Dhammu, H, Lambert, V, Roberts, C, Cox, D, Cox, S, Lemon, J, Damon, P, Rengel, Z, Thomas, G, Beard, C, Smith, A, Jayasena, K, Kelly, S, Loughman, R, MacLeod, B, Malik, R, Khangura, R, Vanstone, V, Hanbury, C, Aberra, M, MasNish, G, Coutts, B, Strickland, G, Kehoe, M, Severtson, D, Jones, R, Wright, D, Jordan, M, He, X, Manyol, E, Nio, S, Malik, I, Botwright-Acuña, T, Wade, L, Metz, N, Price, L, Diepeveen, D, Armstrong, L, Clarke, P, Abrecht, D, Appels, R, and Bellgard, M. (2008), Crop Updates 2008 - Cereals. Department of Agriculture and Food, Perth. Conference Proceeding. This conference proceeding is brought to you for free and open access by the Grain and other field crop research at Research Library. It has been accepted for inclusion in Crop Updates by an authorized administrator of Research Library. For more information, please contact [email protected].
Transcript of Crop Updates 2008 - Cereals - Research Library
Research Library Research Library
Crop Updates Grain and other field crop research
13-2-2008
Crop Updates 2008 - Cereals Crop Updates 2008 - Cereals
Christine Zaicou Department of Agriculture and Food
Shahajahan Miyan Department of Agriculture and Food
Brenda Shackley Department of Agriculture and Food
Steve Penny Department of Agriculture and Food
Sarah Ellis Department of Agriculture and Food
See next page for additional authors Follow this and additional works at: https://researchlibrary.agric.wa.gov.au/crop_up
Part of the Agribusiness Commons, Agronomy and Crop Sciences Commons, Atmospheric Sciences
Commons, Marketing Commons, Plant Biology Commons, Plant Breeding and Genetics Commons, Plant
Pathology Commons, and the Statistical Methodology Commons
Recommended Citation Recommended Citation Zaicou, C, Miyan, S, Shackley, B, Penny, S, Ellis, S, Sharma, D, Paynter, B, Russell, J, Hills, A, Riethmuller, G,
Bowden, B, Blackwell, P, Dhammu, H, Lambert, V, Roberts, C, Cox, D, Cox, S, Lemon, J, Damon, P, Rengel, Z, Thomas, G, Beard, C, Smith, A, Jayasena, K, Kelly, S, Loughman, R, MacLeod, B, Malik, R, Khangura, R, Vanstone, V, Hanbury, C, Aberra, M, MasNish, G, Coutts, B, Strickland, G, Kehoe, M, Severtson, D, Jones, R, Wright, D, Jordan, M, He, X, Manyol, E, Nio, S, Malik, I, Botwright-Acuña, T, Wade, L, Metz, N, Price, L, Diepeveen, D, Armstrong, L, Clarke, P, Abrecht, D, Appels, R, and Bellgard, M. (2008), Crop Updates 2008 - Cereals. Department of Agriculture and Food, Perth. Conference Proceeding.
This conference proceeding is brought to you for free and open access by the Grain and other field crop research at Research Library. It has been accepted for inclusion in Crop Updates by an authorized administrator of Research Library. For more information, please contact [email protected].

Authors Authors Christine Zaicou, Shahajahan Miyan, Brenda Shackley, Steve Penny, Sarah Ellis, Darshan Sharma, Blakely Paynter, Jeff Russell, Andrea Hills, Glen Riethmuller, Bill Bowden, Paul Blackwell, Harmohinder Dhammu, Vince Lambert, Chris Roberts, David Cox, Sally Cox, Jeremy Lemon, Paul Damon, Zed Rengel, Geoff Thomas, Ciara Beard, Anne Smith, Kith Jayasena, Sean Kelly, Rob Loughman, Bill MacLeod, Raj Malik, Ravjit Khangura, Vivien Vanstone, Colin Hanbury, Mehreteab Aberra, Gordon MasNish, Brenda Coutts, Geoff Strickland, Monica Kehoe, Dustin Severtson, Roger Jones, Dominie Wright, Megan Jordan, Xinhua He, Eli Manyol, Song-Ai Nio, Imran Malik, Tina Botwright-Acuña, Len Wade, Nigel Metz, Linda Price, Dean Diepeveen, Leisa Armstrong, Peter Clarke, Doug Abrecht, Rudi Appels, and Matthew Bellgard
This conference proceeding is available at Research Library: https://researchlibrary.agric.wa.gov.au/crop_up/37

ISSN 1445-0593
2008
CEREALS UPDATES
WESTERN AUSTRALIA
PRESENTED AT THE BURSWOOD ENTERTAINMENT COMPLEX, PERTH
WESTERN AUSTRALIA, 13-14 FEBRUARY 2008
Compiled and edited by Steve Penny
Permission of the publisher is required for articles being reproduced or presented.
Mention of a trade name or company in this publication does not imply endorsement of any product or company by the Department of Agriculture and Food, Western Australia.
DISCLAIMER
1. The information, representations and statements contained in this publication are provided for general scientific information purposes only.
2. The State of Western Australia, the Minister for Agriculture, the Director General of the Department of Agriculture, the Grains Research and Development Corporation and their respective officers, employees and agents:
a) do not make any representation or warranty as to the accuracy, reliability, completeness or currency of the information, representations or statements in this publication (including but not limited to information which has been provided by third parties); and
b) shall not be liable, in negligence or otherwise, to a person for any loss, liability or damage arising out of an act or failure to act by any person in using or relying on any information, representation or statements contained in this publication.
3. The State of Western Australia, the Minister for Agriculture, the Director General of the Department if Agriculture, the Grains Research and Development Corporation and their respective officers, employees and agents:
a) make no representations or warranty that any of the products specified in this publication (‘Specified Products’) are registered pursuant to the Agricultural and Veterinary Chemicals Code Act 1994 (WA).
4. a) The State of Western Australia, the Minister for Agriculture, the Director General of the Department of Agriculture, the Grains Research and Development Corporation and their respective officers, employee and agents do not endorse or recommend any Specified Product or any manufacturer of a Specified Product. Brand, trade and proprietary names have been be used solely for the purpose of assisting users of this publication to identify products.
b) Products that are not Specified Products (‘Alternative Products') may perform as well as or better than Specified Products.
5. Users of any chemical product should always read the label on the product before use and should follow the directions specified on the label.
© State of Western Australia, 2008

Agribusiness Crop Updates 2008
Crop Updates is a partnership between the Department of Agriculture and Food, Western Australia and the Grains Research & Development Corporation
i
CEREALS UPDATE, 2008
Table of Contents
Page
WHEAT AGRONOMY
Wheat variety performance in the Northern Agricultural Region in 2007 ...................................... 1 Christine Zaicou
Wheat variety performance in the Central Agricultural Region in 2007 ........................................ 5 Shahajahan Miyan
Response of wheat varieties to sowing time in the Great Southern and Lakes Region in 2007 .. 9 Brenda Shackley and Steve Penny
Wheat variety performance in the South Coastal Region in 2007 ................................................ 14 Sarah Ellis
Flowering dates of wheat varieties in Western Australia in 2007 .................................................. 19 Darshan Sharma, Brenda Shackley and Christine Zaicou
BARLEY AGRONOMY
Barley variety options for Western Australia ................................................................................. 22 Blakely Paynter, Andrea Hills and Jeff Russell
Vlamingh A – the newest malting barley variety ............................................................................ 29
Blakely Paynter, Jeff Russell and Andrea Hills
Barley yields higher in wide rows with stubble retained in a very dry season at Merredin ........... 36 Glen Riethmuller, Bill Bowden and Paul Blackwell
HERBICIDE TOLERANCE
Herbicide tolerance of current/new wheat varieties ...................................................................... 41 Glen Riethmuller, Bill Bowden and Paul Blackwell
Herbicide tolerance of new oat varieties ....................................................................................... 47 Harmohinder Dhammu, Vince Lambert and Chris Roberts
NUTRITION
Managing nitrogen inputs in malting barley ................................................................................... 51 Andrea Hills and Blakely Paynter
Decision tools for optimal N on cereal crops ................................................................................. 60 David and Sally Cox, Jeremy Lemon and Andrea Hills
Wheat varieties respond differently to potassium application on potassium ................................ 63 responsive soils Paul Damon and Zed Rengel

Agribusiness Crop Updates 2008
Crop Updates is a partnership between the Department of Agriculture and Food, Western Australia and the Grains Research & Development Corporation
ii
Page
DISEASES
Leaf disease management in continuous barley in the northern and central grainbelt of WA ...... 68 Geoff Thomas, Ciara Beard, Anne Smith, Kith Jayasena and Sean Kelly
Temperature and moisture requirements of leaf, stem and stripe rusts of wheat ......................... 73 Geoff Thomas, Rob Loughman and Bill MacLeod
Fungicide options for controlling diseases in oats ......................................................................... 76 Raj Malik and Blakely Paynter
Survey of wheat root diseases under intensive cereal production in Western Australia .............. 80 during 2005-2007 Ravjit Khangura, William MacLeod, Vivien Vanstone, Colin Hanbury, Mehreteab Aberra, Gordon MacNish and Robert Loughman
Epidemiology studies on Wheat Streak Mosaic Virus ................................................................... 83 Brenda Coutts, Geoff Strickland, Monica Kehoe, Dustin Severtson and Roger Jones
Bacterial diseases that affect WA export hay quality .................................................................... 86 Dominie Wright and Megan Jordan
SOIL
Hardpan penetration ability of drought-stressed wheat under pot and field conditions ................ 88 Xinhua He, Eli Manyol, Song-Ai Nio, Imran Malik, Tina Botwright-Acuña and Len Wade
HARVEST MANAGEMENT
Calculating the risk – the SEPWA Harvest Calculator .................................................................. 92 Nigel Metz
The relationship between grain moisture and atmospheric conditions in cereal crop ................... 94 harvesting on the South Coast of WA Nigel Metz
MARKETS
Varietal accreditation for Australian barley .................................................................................... 100 Linda Price
STATISTICAL METHODS
Applying data mining tools to improve grain quality for growers ................................................... 103 Dean Diepeveen, Leisa Armstrong, Peter Clarke, Doug Abrecht, Rudi Appels and Matthew Bellgard

Agribusiness Crop Updates 2008
Crop Updates is a partnership between the Department of Agriculture and Food, Western Australia and the Grains Research & Development Corporation
iii
ACKNOWLEDGMENTS
Thank you to those who contributed, in any way, to the development of the cereals component of the 2008 Crop Updates program. The effort of all contributors, including reviewers, to meet the tight deadline for papers is also acknowledged.
Many thanks to Chiquita Butler. Her continued efforts with the formatting of the cereals papers for the proceedings are greatly appreciated.
All the best for 2008.
Steve Penny CEREALS CONVENOR


Agribusiness Crop Updates 2008
Crop Updates is a partnership between the Department of Agriculture and Food, Western Australia and the Grains Research & Development Corporation
1
Wheat variety performance in the Northern Agricultural Region in 2007 Christine Zaicou, Department of Agriculture and Food, Western Australia, Geraldton
KEY MESSAGES
Wyalkatchem was the highest yielding variety in Agzone 1, 2 and 4 (NVT trials − 2000 to 2006).
Arrino, Calingiri, Carnamah, EGA Bonnie Rock, Gladius, Westonia, Wyalkatchem and Young were consistent yield performers in NVT 2007.
Correll and Axe were two newly released varieties in the 2007 NVT data set with a hectolitre weight less than 74 hL. All other varieties were not downgraded based on hectolitre weight.
In some districts and for later maturing crops, the late rains improved the yield of July sown crops.
AIMS
To provide growers in the northern agricultural region with information for making decisions relating to wheat variety choice and management.
METHOD
Field based agronomy trials in 2007 were located on yellow sandplain at Mingenew and sandy loam at Coorow. Twenty-four cultivars from various Australian breeding companies were sown at three sowing times in a randomised split block. Field based national variety testing trials were located at Binnu, Mingenew, Yuna, Eneabba, Eradu and Buntine in 2007. The NVT analysis (2000 to 2006) is publicly available information – see http://www.acasnvt.com.au/ACAS/VarietyPerformance.aspx.
RESULTS AND CONCLUSIONS
Grain yield
In the National Variety Testing trials in 2000 through to 2006, Wyalkatchem was the highest yielding variety in Agzone 1, 2 and 4 (Table 1). The performance of recently released varieties Axe, Carinya, Correll, Derrimut, Gladius, LRPB Lincoln, Magenta and Yandanooka ranged from 88% to 99% of Wyalkatchem across Agzones 1, 2 and 4 (Table 1). Note: The number of site years for these varieties was limited.
Arrino, Calingiri, Carnamah, EGA Bonnie Rock, Gladius, Westonia, Wyalkatchem and Young were consistent performers in 2007. They yielded better than the site mean in over 80% of the trials (data not supplied but available on NVT website).
Time of sowing
Later sown crops (particularly on the sandplain) were able to utilise the late rains during grain fill in some districts. Hence, yields did not decline significantly with delayed sowing from late May to early July on the sandplain at Mingenew in 2007 (Table 2a). In contrast at Coorow (a sandy loam site), there was a significant decline in yield when varieties were sown between mid June and early July (Table 2b). In 2006 at Mingenew (a low rainfall year) the average yield was 1.1 t/h compared to 1.4 t/ha when sown in early July in 2007. The late rains would have contributed to the improved crop yields in 2007.
Grain quality
As expected in a low rainfall year, proteins were high (Tables 2 and 3). The late spring rains contributed to good hectolitre weights and grain quality was not compromised by high screenings. In contrast, screenings were relatively high in 2006.
Agribusiness Crop Updates 2008
Crop Updates is a partnership between the Department of Agriculture and Food, Western Australia and the Grains Research & Development Corporation
2
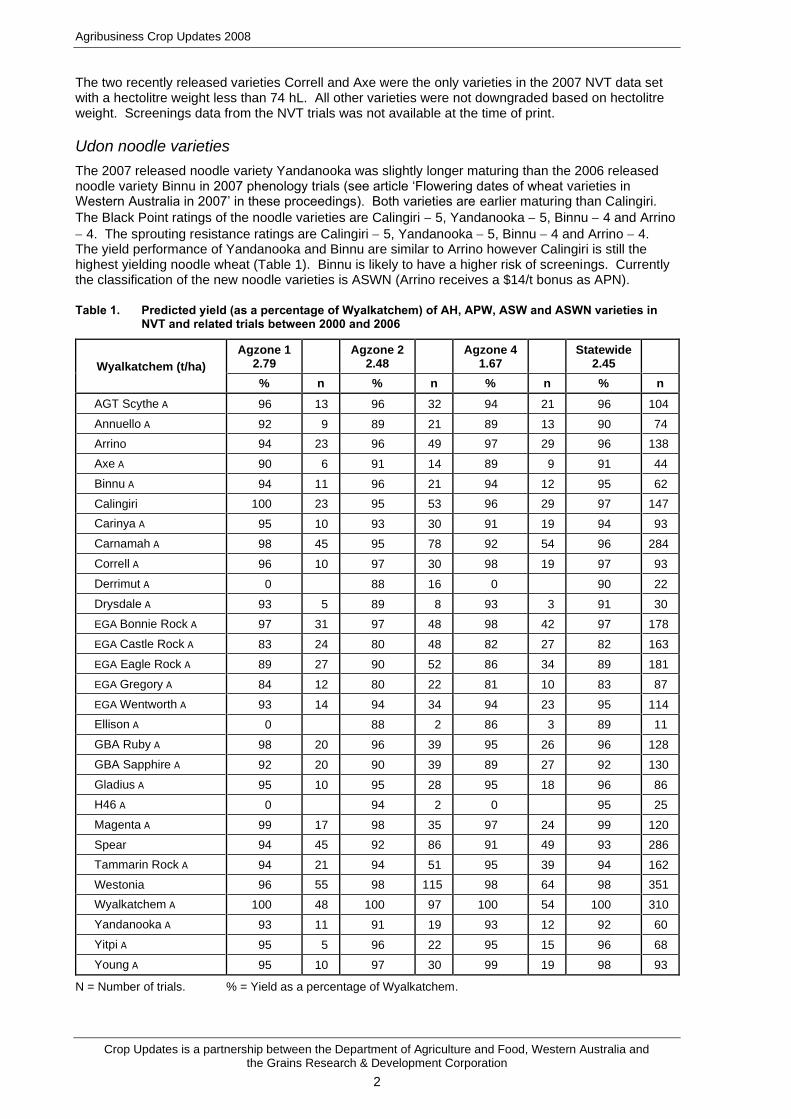
The two recently released varieties Correll and Axe were the only varieties in the 2007 NVT data set with a hectolitre weight less than 74 hL. All other varieties were not downgraded based on hectolitre weight. Screenings data from the NVT trials was not available at the time of print.
Udon noodle varieties
The 2007 released noodle variety Yandanooka was slightly longer maturing than the 2006 released noodle variety Binnu in 2007 phenology trials (see article ‘Flowering dates of wheat varieties in Western Australia in 2007’ in these proceedings). Both varieties are earlier maturing than Calingiri.
The Black Point ratings of the noodle varieties are Calingiri − 5, Yandanooka − 5, Binnu − 4 and Arrino
− 4. The sprouting resistance ratings are Calingiri − 5, Yandanooka − 5, Binnu − 4 and Arrino − 4. The yield performance of Yandanooka and Binnu are similar to Arrino however Calingiri is still the highest yielding noodle wheat (Table 1). Binnu is likely to have a higher risk of screenings. Currently the classification of the new noodle varieties is ASWN (Arrino receives a $14/t bonus as APN).
Table 1. Predicted yield (as a percentage of Wyalkatchem) of AH, APW, ASW and ASWN varieties in NVT and related trials between 2000 and 2006
Wyalkatchem (t/ha)
Agzone 1 2.79
Agzone 2
2.48
Agzone 4 1.67
Statewide
2.45
% n % n % n % n
AGT Scythe A 96 13 96 32 94 21 96 104
Annuello A 92 9 89 21 89 13 90 74
Arrino 94 23 96 49 97 29 96 138
Axe A 90 6 91 14 89 9 91 44
Binnu A 94 11 96 21 94 12 95 62
Calingiri 100 23 95 53 96 29 97 147
Carinya A 95 10 93 30 91 19 94 93
Carnamah A 98 45 95 78 92 54 96 284
Correll A 96 10 97 30 98 19 97 93
Derrimut A 0 88 16 0 90 22
Drysdale A 93 5 89 8 93 3 91 30
EGA Bonnie Rock A 97 31 97 48 98 42 97 178
EGA Castle Rock A 83 24 80 48 82 27 82 163
EGA Eagle Rock A 89 27 90 52 86 34 89 181
EGA Gregory A 84 12 80 22 81 10 83 87
EGA Wentworth A 93 14 94 34 94 23 95 114
Ellison A 0 88 2 86 3 89 11
GBA Ruby A 98 20 96 39 95 26 96 128
GBA Sapphire A 92 20 90 39 89 27 92 130
Gladius A 95 10 95 28 95 18 96 86
H46 A 0 94 2 0 95 25
Magenta A 99 17 98 35 97 24 99 120
Spear 94 45 92 86 91 49 93 286
Tammarin Rock A 94 21 94 51 95 39 94 162
Westonia 96 55 98 115 98 64 98 351
Wyalkatchem A 100 48 100 97 100 54 100 310
Yandanooka A 93 11 91 19 93 12 92 60
Yitpi A 95 5 96 22 95 15 96 68
Young A 95 10 97 30 99 19 98 93
N = Number of trials. % = Yield as a percentage of Wyalkatchem.

Agribusiness Crop Updates 2008
Crop Updates is a partnership between the Department of Agriculture and Food, Western Australia and the Grains Research & Development Corporation
3
Table 2. Effect of sowing time on yield and quality of wheat varieties sown in: a) Mingenew and b) Coorow. *Note: Screenings include whole and cracked grain
a) Mingenew Grain yield (t/ha) Protein (%) Screenings (%) *
28 May 27 June 5 July Ave 28 May 27 June 5 July Ave 28 May 27 June 5 July Ave
AGT Scythe A 1.35 1.16 1.12 1.21 16.2 15.6 14.2 15.3 7.7 7.3 8.3 8
Arrino 1.55 1.52 1.42 1.50 15.5 14.8 13.5 14.6 3.6 1.3 1.3 2
Axe A 1.53 1.43 1.25 1.40 15.1 14.6 13.5 14.4 3.9 3.8 4.3 4
Binnu A 1.50 1.35 1.35 1.40 13.4 14.1 12.9 13.5 6.4 3.4 4.7 5
Calingiri 1.55 1.27 1.39 1.40 14.9 15.4 13.7 14.7 4.5 4.0 4.2 4
Carinya A 1.26 1.20 1.19 1.22 15.4 15.0 13.1 14.5 6.7 3.3 4.6 5
Carnamah A 1.32 1.27 1.29 1.30 14.5 14.9 12.9 14.1 6.0 2.6 3.5 4
Catalina A 1.38 1.45 1.32 1.38 14.9 14.0 12.9 13.9 7.5 7.4 8.0 8
Correll A 1.45 1.47 1.33 1.42 16.0 15.1 13.8 14.9 8.0 6.1 6.1 7
Derrimut A 1.27 1.40 1.21 1.30 15.7 14.4 13.0 14.4 14.4 6.2 6.6 9
EGA Bonnie Rock A 1.90 1.84 1.52 1.75 13.9 14.3 13.8 14.0 5.7 3.5 3.4 4
EGA Wentworth A 1.32 1.26 1.20 1.26 15.7 14.9 13.3 14.6 14.4 5.7 6.1 9
GBA Sapphire A 1.33 1.38 1.22 1.31 14.7 14.7 13.0 14.1 8.9 3.9 5.0 6
Gladius A 1.47 1.72 1.49 1.56 15.1 13.9 12.7 13.9 3.7 3.4 4.4 4
LRPB Lincoln A 1.40 1.49 1.36 1.42 15.8 14.5 12.9 14.4 10.9 4.6 4.0 6
Tammarin Rock A 1.39 1.64 1.44 1.49 14.2 13.9 12.3 13.5 10.0 5.5 4.5 7
Magenta A 1.46 1.25 1.32 1.35 15.2 15.7 14.1 15.0 5.5 3.2 3.5 4
Yandanooka A 1.57 1.10 1.20 1.29 14.9 16.1 14.6 15.2 4.5 4.0 5.3 5
WAWHT2856 1.36 1.31 1.33 1.33 17.4 15.9 14.0 15.8 4.6 3.1 3.9 4
Wyalkatchem A 1.31 1.71 1.32 1.45 14.5 13.9 13.0 13.8 4.2 2.2 2.0 3
Yitpi A 1.09 1.20 1.27 1.19 15.0 15.4 13.8 14.7 5.5 4.2 5.1 4.9
Young A 1.45 1.71 1.38 1.52 14.9 14.2 13.2 14.1 11.5 3.5 4.7 6.6
Average within each TOS 1.42 1.41 1.31 1.20 15.1 14.8 13.3 14.4 7.2 4.3 5.1 6
TOS (lsd) Var (lsd) %CV TOS (lsd) Var (lsd) %CV TOS (lsd) Var (lsd) %CV
ns 0.14 11.1 0.57 0.50 3.7 0.69 0.71 13.7
Var (lsd) between TOS 0.31 0.95 1.30
Var (lsd) within TOS 0.25 0.86 1.23

Agribusiness Crop Updates 2008
Crop Updates is a partnership between the Department of Agriculture and Food, Western Australia and the Grains Research & Development Corporation
4
b) Coorow Grain yield (t/ha) Protein (%) Screenings (%)
11 June 6 July Ave 11 June 6 July Ave 11 June 6 July Ave
AGT Scythe A 1.48 0.92 1.20 14.5 12.0 13.2 3.6 5.7 4.6
Arrino 1.67 0.95 1.31 14.4 11.8 13.1 0.7 1.4 1.0
Axe A 1.91 1.07 1.49 13.2 11.7 12.5 3.1 3.9 3.5
Binnu A 1.44 0.87 1.15 14.1 11.5 12.8 2.2 3.1 2.6
Calingiri 1.38 0.78 1.08 14.6 12.1 13.4 1.8 3.7 2.8
Carinya A 1.21 0.88 1.05 14.8 11.8 13.3 1.3 3.1 2.2
Carnamah A 1.63 0.99 1.31 14.1 12.0 13.1 1.5 2.9 2.2
Catalina A 1.68 0.54 1.11 13.4 11.5 12.5 2.7 5.7 4.2
Correll A 1.70 0.93 1.31 13.8 12.1 13.0 4.8 7.3 6.0
Derrimut A 1.45 0.88 1.17 13.9 11.2 12.6 2.8 5.1 4.0
EGA Bonnie Rock A 1.52 1.01 1.27 14.8 12.3 13.6 3.2 3.6 3.4
EGA Wentworth A 1.57 0.77 1.17 14.0 11.5 12.8 1.9 3.0 2.5
GBA Sapphire A 1.45 0.77 1.11 13.7 12.0 12.9 1.3 3.3 2.3
Gladius A 1.69 0.99 1.34 13.7 11.9 12.8 2.8 6.6 4.7
LRPB Lincoln A 1.64 0.92 1.28 13.7 11.9 12.8 2.8 4.4 3.6
Magenta A 1.37 0.97 1.17 14.9 13.8 14.3 1.5 3.6 2.5
Tammarin Rock A 1.68 0.81 1.25 13.6 11.2 12.4 4.0 4.5 4.2
Yandanooka A 1.65 0.85 1.25 14.0 12.4 13.2 1.5 2.8 2.2
WAWHT 2856 1.68 0.95 1.31 14.1 12.6 13.4 1.5 4.4 2.9
Wyalkatchem A 1.72 0.86 1.29 13.5 11.6 12.6 1.2 2.5 1.8
Yitpi A 1.50 0.54 1.02 14.3 12.6 13.5 3.5 5.2 4.4
Young A 1.76 0.93 1.35 13.5 11.4 12.5 3.1 4.9 4.0
Average within each TOS
1.58 0.87 1.20 14.1 11.9 13.0 2.5 4.6 4
TOS (lsd)
Var (lsd)
%CV TOS (lsd)
Var (lsd)
%CV TOS (lsd)
Var (lsd)
%CV
0.23 0.16 11.5 0.26 0.58 3.9 ns 0.83 20.60
Var (lsd) between TOS
0.25 0.81 2.47
Var (lsd) within TOS
0.23 0.82 1.17
KEY WORDS
wheat varieties, agronomy, crop management, time of sowing
ACKNOWLEDGMENTS
The fantastic technical support from Melaine Kupsch, Anne Smith, and Woorree Research Support Unit is very much appreciated. Thanks to the Grains Research and Development Corporation for the essential financial support and the National Variety Testing project for regional trial information. DAFWA Crop Variety Testing team provided assistance with trial information which was wonderful. Last but not least much appreciation to my colleagues Ben Curtis, Shahajahan Miyan, Steve Penny, Brenda Shackley and Darshan Sharma.
Project No.: DAW147
Paper reviewed by: Brenda Shackley

Agribusiness Crop Updates 2008
Crop Updates is a partnership between the Department of Agriculture and Food, Western Australia and the Grains Research & Development Corporation
5
Wheat variety performance in the Central Agricultural Region in 2007 Shahajahan Miyan, Department of Agriculture and Food, Western Australia, Northam
KEY MESSAGES
• EGA Bonnie Rock, Tammarin Rock, Yitpi, Gladius, Young and Magenta were the highest yielding varieties at all times of sowing in trials at Merredin and Wongan Hills in 2007. However, WAWHT 2856, Arrino, and Yandanooka performed well at Wongan Hills compared to Binnu, Calingiri and Carnamah.
• Late June sowing outyielded mid July sowing by 27% at Wongan Hills and mid June sowing outyielded early July seeding by 22% at Merredin
• Screenings and hectolitre weight were not a factor at either location in 2007.
AIMS
To determine how yield and grain quality of new wheat varieties respond to time of sowing at two locations in the Central Agricultural Region in 2007.
METHOD
Two field trials were conducted at Merredin and Wongan Hills Research stations in 2007. Twenty-four wheat varieties were sown at three time of sowing in a randomised block design with three replications. At Merredin the first time of sowing was sown on 27 April after irrigating the trial site to generate information on early sowing. Another light irrigation was also applied to save the crop due to very dry spell in May. Patchy germination and a higher weed burden were observed in the first time of sowing (TOS1) at Merredin, compared to TOS 2 and TOS 3. TOS 1 at Wongan Hills (Agzone 2) was sown in late May and TOS 2 was delayed until 26 June, when rainfall allowed. Soil type and crop rotation at Wongan Hills (Agzone 2) was shallow sandy duplex after lupins and clay loam after pasture at Merredin (Agzone 4).
Data on grain yield, grain protein, hectolitre weight and screenings were recorded and analysed using Genstat.
Note: Screenings include whole and cracked grain. Gross income was calculated on the average yield and quality for each treatment using AWB Golden Rewards-Base scale: APW $423, AHP $432, AH $427, APDR $605, ASWN $428 and ASW $418.
RESULTS
Growing season rainfall from May to October was 163.0 mm at Merredin and 241.4 mm at Wongan Hills. Low yields and high protein levels in the later sowings at both sites were associated with low rainfall in September and October.
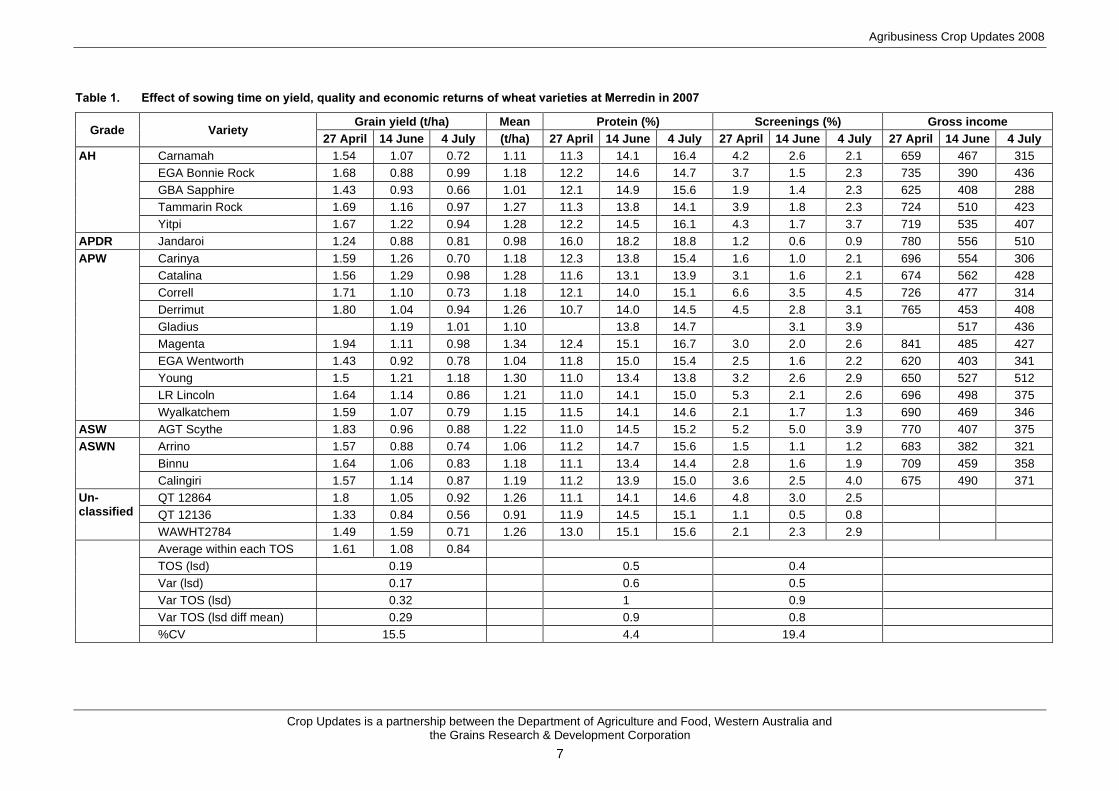
EGA Bonnie Rock, Tamarin Rock, Yitpi, Correll, AGT Scythe, DerrimutWt, and Magenta occupied the top significant group for grain yield with late April sowing at Merredin (Table 1). Gladius was not included in TOS1 at this site due to lack of seed. Grain yield decline with subsequent sowing times was greatest in GBA Sapphire, Carnamah, Carinya, Correll, EGA Wentworth and Arrino. The average grain yield across all times of sowing of the newly released variety Magenta exceeded all other varieties at Merredin (Table 1). Jandaroi was the only variety with a higher average gross income across all times of sowing. Magenta has longer coleoptile length than Wyalkatchem and better stem rust resistance. Most of the AH varieties achieved more than 13% protein in TOS 2 and TOS 3 at Merredin. All noodle wheat varieties achieved protein levels above 11.5% in TOS 1 and TOS 2. While Carnamah and EGA Bonnie Rock outyielded Jandaroi by 12 and 17% respectively, Jandaroi had gross returns $135 higher than Carnamah and $100/ha higher than EGA Bonnie Rock.. Screenings were higher than 5% for Correll, Lincoln and AGT Scythe in TOS1. No varieties recorded a hectolitre weight below 74 kg/kL.

Agribusiness Crop Updates 2008
Crop Updates is a partnership between the Department of Agriculture and Food, Western Australia and the Grains Research & Development Corporation
6
EGA Bonnie Rock, Tammarin Rock, Yitpi, Correll, DerrimutWt, Magenta, Wyalkatchem, Arrino and WAWHT 2856 were amongst the top significant group for grain yield with late May sowing (TOS 1) at Wongan Hills (Table 2). Grain yield decline with subsequent sowing times was highest in GBA Sapphire, Carinya, Carnamah and EGA Wentworth at Wongan Hills. The potential noodle wheat WAWHT 2856 outyielded Calingiri at Wongan Hills at all times of sowing (Table 2). Yields of Yandanooka were comparable with Arrino and Binnu. Grain protein levels for all noodle wheat varieties were above 11.5% for all times of sowing at Wongan Hills. The gross income of WAWHT 2856, Arrino, DerrimutWt, Wyalkatchem, and EGA Bonnie Rock were higher than Carnamah, Tammarin Rock, Calingiri and Binnu at Wongan Hills (Table 2). No varieties recorded a hectolitre weight below 74 kg/kL and screenings levels were within acceptable levels for all varieties.
CONCLUSION
EGA Bonnie Rock, Tammarin Rock, Yitpi, Gladius, Young, and Magenta performed very well at Merredin and Wongan Hills in 2007. Screenings and hectolitre weight were not an issue at either location despite dry growing conditions. The results presented in Tables 1 and 2 can be used to support variety choices.
KEY WORDS
wheat varieties, wheat agronomy, crop management, time of sowing, grain yield, protein
ACKNOWLEDGMENTS
Thanks to Bruce Haig for his technical support, Mario D’Antuono for statistical advice, Research Support Units at Merredin and Wongan Hills for trial operations and to GRDC for funds.
Project No.: DAW 0147
Paper reviewed by: Wal Anderson
Agribusiness Crop Updates 2008
Crop Updates is a partnership between the Department of Agriculture and Food, Western Australia and the Grains Research & Development Corporation
7
Table 1. Effect of sowing time on yield, quality and economic returns of wheat varieties at Merredin in 2007
Grade Variety Grain yield (t/ha) Mean Protein (%) Screenings (%) Gross income
27 April 14 June 4 July (t/ha) 27 April 14 June 4 July 27 April 14 June 4 July 27 April 14 June 4 July
AH Carnamah 1.54 1.07 0.72 1.11 11.3 14.1 16.4 4.2 2.6 2.1 659 467 315
EGA Bonnie Rock 1.68 0.88 0.99 1.18 12.2 14.6 14.7 3.7 1.5 2.3 735 390 436
GBA Sapphire 1.43 0.93 0.66 1.01 12.1 14.9 15.6 1.9 1.4 2.3 625 408 288
Tammarin Rock 1.69 1.16 0.97 1.27 11.3 13.8 14.1 3.9 1.8 2.3 724 510 423
Yitpi 1.67 1.22 0.94 1.28 12.2 14.5 16.1 4.3 1.7 3.7 719 535 407
APDR Jandaroi 1.24 0.88 0.81 0.98 16.0 18.2 18.8 1.2 0.6 0.9 780 556 510
APW Carinya 1.59 1.26 0.70 1.18 12.3 13.8 15.4 1.6 1.0 2.1 696 554 306
Catalina 1.56 1.29 0.98 1.28 11.6 13.1 13.9 3.1 1.6 2.1 674 562 428
Correll 1.71 1.10 0.73 1.18 12.1 14.0 15.1 6.6 3.5 4.5 726 477 314
Derrimut 1.80 1.04 0.94 1.26 10.7 14.0 14.5 4.5 2.8 3.1 765 453 408
Gladius 1.19 1.01 1.10 13.8 14.7 3.1 3.9 517 436
Magenta 1.94 1.11 0.98 1.34 12.4 15.1 16.7 3.0 2.0 2.6 841 485 427
EGA Wentworth 1.43 0.92 0.78 1.04 11.8 15.0 15.4 2.5 1.6 2.2 620 403 341
Young 1.5 1.21 1.18 1.30 11.0 13.4 13.8 3.2 2.6 2.9 650 527 512
LR Lincoln 1.64 1.14 0.86 1.21 11.0 14.1 15.0 5.3 2.1 2.6 696 498 375
Wyalkatchem 1.59 1.07 0.79 1.15 11.5 14.1 14.6 2.1 1.7 1.3 690 469 346
ASW AGT Scythe 1.83 0.96 0.88 1.22 11.0 14.5 15.2 5.2 5.0 3.9 770 407 375
ASWN Arrino 1.57 0.88 0.74 1.06 11.2 14.7 15.6 1.5 1.1 1.2 683 382 321
Binnu 1.64 1.06 0.83 1.18 11.1 13.4 14.4 2.8 1.6 1.9 709 459 358
Calingiri 1.57 1.14 0.87 1.19 11.2 13.9 15.0 3.6 2.5 4.0 675 490 371
Un-classified
QT 12864 1.8 1.05 0.92 1.26 11.1 14.1 14.6 4.8 3.0 2.5
QT 12136 1.33 0.84 0.56 0.91 11.9 14.5 15.1 1.1 0.5 0.8
WAWHT2784 1.49 1.59 0.71 1.26 13.0 15.1 15.6 2.1 2.3 2.9
Average within each TOS 1.61 1.08 0.84
TOS (lsd) 0.19 0.5 0.4
Var (lsd) 0.17 0.6 0.5
Var TOS (lsd) 0.32 1 0.9
Var TOS (lsd diff mean) 0.29 0.9 0.8
%CV 15.5 4.4 19.4

Agribusiness Crop Updates 2008
Crop Updates is a partnership between the Department of Agriculture and Food, Western Australia and the Grains Research & Development Corporation
8
Table 2. Effect of sowing time on yield, quality and economic returns of wheat varieties at Wongan Hills in 2007
Grade Variety Grain yield (t/ha) Mean Protein (%) Screenings (%) Gross income ($/ha)
28 May 26 June 10 July (t/ha) 28 May 26 June 10 July 28 May 26 June 10 July 28 May 26 June 10 July
AH Carnamah 2.12 2.09 1.30 1.84 14.3 14.9 15.8 4.0 3.4 2.0 917 906 569
EGA Bonnie Rock 2.39 2.18 1.58 2.05 14.3 15.1 15.4 3.4 2.6 3.5 1049 963 693
GBA Sapphire 2.06 2.01 1.19 1.75 14.4 14.9 15.9 2.0 2.0 2.6 901 879 518
Tammarin Rock 2.26 2.00 1.49 1.92 14.2 15.0 15.8 3.5 2.2 2.4 980 875 650
Yitpi 2.28 2.12 1.53 1.98 15.0 15.2 16.3 5.0 3.3 3.7 980 921 664
APW Axe 2.01 1.93 1.69 1.88 15.2 15.2 15.3 3.5 2.8 2.9 871 841 735
Carinya 2.18 1.84 1.24 1.75 14.5 15.3 15.3 1.8 1.4 2.9 950 801 539
Catalina 2.06 2.05 1.71 1.94 13.9 14.6 14.2 2.7 3.3 3.2 898 890 742
Correll 2.32 1.98 1.51 1.94 14.3 15.2 16.4 4.0 4.9 5 1008 850 647
Derrimut 2.30 2.17 1.73 2.07 13.8 14.2 14.4 4.6 3.9 3.9 991 937 747
Gladius 2.15 2.15 1.57 1.96 15.1 14.9 16.1 3.9 3.2 3.4 929 933 680
Magenta 2.35 2.01 1.47 1.94 14.8 15.8 16.3 3.9 2.6 3.2 1015 874 638
EGA Wentworth 2.17 2.06 1.36 1.86 14.4 14.9 16.2 2.8 2.5 3.6 944 898 589
Young 2.14 2.15 1.67 1.99 14.0 15.1 15.4 2.2 2.6 3.0 933 937 726
LR Lincoln 2.18 1.99 1.55 1.91 14.5 15.1 15.5 3.6 3.4 3.6 944 862 671
Wyalkatchem 2.34 2.07 1.56 1.99 14.8 15.7 15.7 1.8 1.4 2 1026 907 682
ASW AGTScythe 2.31 2.11 1.59 2.00 14.4 15.1 15.1 5.3 3.9 5.1 978 900 673
ASWN Arrino 2.33 2.13 1.65 2.04 14.4 15.2 15.4 1.0 1.2 1.3 1011 923 714
Binnu 2.20 2.05 1.51 1.92 13.7 14.8 15.3 2.0 1.8 2.3 949 888 650
Calingiri 2.30 2.03 1.44 1.92 14.4 14.9 15.8 2.9 2.9 3.9 987 914 622
Yandanooka 2.25 2.13 1.46 1.95 14.8 15.0 15.9 2.5 3.1 4.4 968 912 621
WAWHT2856 2.40 2.14 1.67 2.07 14.0 15.2 15.2 2.6 2.5 3.9 1033 921 712
Un-classified
QT 12864 2.12 2.08 1.38 1.86 14.2 15.1 15.8 3.9 3.9 3.3
Average within each TOS 2.23 2.07 1.51
TOS (lsd) 0.52 2.2 0.5
Var (lsd) 0.09 0.4 0.6
Var TOS (lsd) 0.51 2.1 1.1
Var TOS (lsd diff mean) 0.16 0.6 1.1
%CV 5.1 2.6 21.4

Agribusiness Crop Updates 2008
Crop Updates is a partnership between the Department of Agriculture and Food, Western Australia and the Grains Research & Development Corporation
9
Response of wheat varieties to sowing time in the Great Southern and Lakes Region in 2007 Brenda Shackley and Steve Penny, Department of Agriculture and Food, Western Australia, Katanning
KEY MESSAGES
• Soft wheats EGA 2248 and Bullaring dominated the yield results at Katanning but preliminary results suggest that gross margins will be severely reduced by high protein levels, screenings and low hectolitre weights.
• Young and Magenta (WAWHT2726) are competitive with Wyalkatchem. These results are supported by NVT data. There are indications that Magenta performs better when sown in May.
• Magenta may have a higher risk of screenings compared to Wyalkatchem. EGA Bonnie Rock, LRPB Lincoln and EGA Wentworth had screenings above 5% when sown in mid June at Katanning.
• APW varieties Correll and LRPB Lincoln recorded hectolitre weights below 74 kg/hL when sown in mid June at Katanning.
• Preliminary results show a number of varieties with high levels of fungal staining when sown early May. This reiterates the risk of sowing susceptible varieties too early.
AIMS
To investigate the performance of new wheat varieties at different sowing times. To identify any specific risks associated with new varieties in the southern agricultural region of WA.
METHOD
Field based trials were located on duplex soils at the Great Southern Agriculture Research Institute (GSARI) in Katanning and the Newdegate Research Station (NRS) in 2007. The trials examined 24 wheat varieties from various Australian breeding programs, at three sowing times. There was a huge range in sowing times reflecting the different seasons experienced at Katanning and Newdegate. Katanning had a favourable season starting in early May with the subsequent sowings at three week intervals. Newdegate had a less uniform season with the first sowing time planted dry in late May, with rain following immediately.
Note: In the tables ‘Screenings’ include whole and cracked grain.
RESULTS AND CONCLUSION
Season
Generally speaking the 2007 season was a return to a more ‘average’ season with the growing season rainfall of 305 mm at GSARI and 219 mm at the NRS. There was some useful rainfall in April (50 mm at GSARI and 33 mm at NRS), however the May rainfall was extremely low and patchy throughout the region. The saving grace for the year was rain in October (52 mm at GSARI and 39 mm at NRS).
Grain yield
Time of sowing resulted in significant differences at both the GSARI and NRS sites. Average grain yields ranged from 4.2 t/ha sown in early May to 3.1 t/ha sown in mid June at GSARI (Table 1) and 2 t/ha sown in late May to 1.3 t/ha sown in early July at NRS (Table 2).
The soft wheat EGA 2248 was one of the highest yielding varieties at the GSARI site, closely followed by the noodle wheat Binnu, a potential release QT12864 and another soft wheat Bullaring. The recently released variety Magenta (WAWHT2726) was among the highest yielding varieties when sown in early May but at the later sowings it was slightly lower yielding than Wyalkatchem, which in turn was slightly lower yielding than Young.

Agribusiness Crop Updates 2008
Crop Updates is a partnership between the Department of Agriculture and Food, Western Australia and the Grains Research & Development Corporation
10
A number of short maturing varieties, including EGA 2248, yielded well at the early May sowing at GSARI. These results must be viewed with caution as no frost events were recorded at flowering. The relative performance of the longer maturing varieties EGA Jitarning and Yitpi at the early May sowing was disappointing.
Bolac and the new noodle wheat Yandanooka (WAWHT2773) where the lowest yielding varieties at the GSARI site. Yandanooka lodged at this site while at NRS there was no sign of lodging and the variety was among the highest yielding. Yandanooka performed particularly poorly at the GSARI site with no explanation why.
Young was the highest yielding variety with the later sowings at NRS,. Wyalkatchem and Magenta where competitive with Young when sown in late May. Surprisingly the yield of the longer season varieties Calingiri and EGA Jitarning was not significantly different to Young at the later sowings. This was probably a reflection of yield potential and the useful rain in October.
Long term yield data from National Variety Testing (NVT) suggests that Wyalkatchem is the highest yielding APW/AH variety, although Young and Magenta are not significantly different. The recently released Gladius however does fall behind these varieties as indicated in Tables 1 and 2.
Correll (a replacement for Yitpi) did not yield significantly higher than Yitpi at the GSARI or NRS sites. Correll does offer the advantage of better stem rust resistance but growers must be aware that Correll was found to be slightly shorter in maturity compared to Yitpi (see article ‘Flowering dates of wheat varieties in Western Australia in 2007’ in these proceedings). 'Note that while Yitpi in classified as AH in WA, Correll currently has a classification of APW in WA.'
Grain quality
High protein, high screenings, low hectolitre weight and fungal staining were among the issues that severely reduce the returns of some varieties.
Even with the high yields obtained at GSARI, the proteins levels were reasonably high (average of 11% with early May seeding). This will severely reduce the gross income of the soft wheats (except for Bullaring sown in early May, not shown). EGA 2248 achieves high yields but is a higher protein achiever compared to the other soft wheat varieties, increasing the risk of not meeting the grade. Sowing EGA 2248 following a legume crop or pasture (as on this site) is not recommended.
Grain protein levels below 11.5% for ASWN where achieved for Binnu at all sowing times at GSARI. However Yandanooka (WAWHT2773) and Calingiri were above the ASWN protein requirement even at the mid to late May sowing. Data from NRS was not available at the time of printing.
Correll has been noted to have problems with hectolitre weight. Hectolitre weight of Correll did fall below 74 kg/hL at the mid June sowing at GSARI and apart from the soft wheats Bullaring and Datatine, Correll had the lowest hectolitre weight at all sowings. LRPB Lincoln also had low hectolitre weight with the mid June sowing.
Preliminary data from GSARI suggests screenings were not an issue with May sowing, Bolac being the only exception. However, in the mid June sowing there are indications that the club head soft wheats (Bullaring and Datatine) may have screenings well over 5%. Bolac, EGA Bonnie Rock, LRPB Lincoln and EGA Wentworth are also showing a risk of screenings over 5%. Magenta has screenings just below 5% at this later sowing date, well above Wyalkatchem with < 1%. Screenings data from NRS was not available at the time of printing.
Some varieties sown in early May at GSARI exhibited high levels of fungal staining as a result of the October rains. This re-iterates the risk of sowing susceptible varieties too early. The gross margins of Wyalkatchem, EGA 2248, Binnu, Carinya, Carnamah, Catalina, EGA Wentworth Yitpi and Magenta may be severely reduced by fungal staining (only preliminary data available at the time of printing).
KEY WORDS
wheat varieties, wheat agronomy, time of sowing, grain quality

Agribusiness Crop Updates 2008
Crop Updates is a partnership between the Department of Agriculture and Food, Western Australia and the Grains Research & Development Corporation
11
ACKNOWLEDGMENTS
The assistance of Anne Smith and the Research Support Units of the Department of Agriculture and Food at Katanning and Newdegate are gratefully acknowledged. Thanks to NVT for providing data and GRDC for funding
Project No.: DAW 0147
Paper reviewed by: Steve Penny

Agribusiness Crop Updates 2008
Crop Updates is a partnership between the Department of Agriculture and Food, Western Australia and the Grains Research & Development Corporation
12
Table 1. Grain yield and grain quality response to sowing time at GSARI in 2007
Paddock history: Lupins (06), Wheat (05) and Lupins (04)
Soil type: Sandy duplex (clay at ~ 25 cm)
Rainfall: 305 mm (May-October) and 79 mm (January-February)
Classification Variety Grain Yield (t/ha) Protein (%) Screenings (%) *4-May 22-May 14-Jun Av 4-May 22-May 14-Jun Av 4-May 22-May 14-Jun Av
AH Carnamah 4.2 4.1 3.2 3.8 11.6 11.8 12.3 11.9
AH EGA Bonnie Rock 4.3 4.1 3.5 4.0 12.7 12.1 11.6 12.2
AH GBA Sapphire 4.1 3.7 3.0 3.6 11.2 11.4 11.4 11.3
AH Yitpi 4.1 3.4 2.8 3.4 10.4 11.8 12.0 11.4
APW Bolac 3.3 3.4 2.6 3.1 10.4 11.2 12.6 11.4
APW Carinya 4.3 3.7 3.0 3.7 11.1 10.3 11.7 11.0
APW Catalina 3.8 4.0 3.4 3.7 11.9 10.9 11.4 11.4
APW Correll 4.1 3.8 2.8 3.6 11.4 11.6 12.0 11.7 Data not available at time of printing
APW EGA Wentworth 4.2 3.7 2.8 3.6 11.1 10.7 11.2 11.0
APW Gladius 3.1 3.2 11.1 11.1
APW Magenta 4.5 3.6 2.9 3.7 11.5 12.4 12.2 12.0
APW Wyalkatchem 4.2 3.7 3.4 3.8 12.2 12.3 11.3 12.0
APW Young 4.3 3.8 3.5 3.9 10.5 11.1 11.1 10.9
ASW LRPB Lincoln 4.0 3.4 2.9 3.4 11.0 11.3 12.3 11.5
ASWN Binnu 4.6 3.9 3.5 4.0 11.1 11.1 10.3 10.9
ASWN Calingiri 4.4 3.5 3.0 3.6 11.5 12.2 11.6 11.8
ASWN Yandanooka 3.7 3.3 3.0 3.3 11.3 13.3 13.1 12.6
ASWN WAWHT2856 4.0 3.9 3.0 3.6 11.1 11.4 12.0 11.5
A Soft Bullaring 4.7 4.3 3.2 4.1 9.3 10.3 10.2 9.9
A Soft Datatine 4.2 3.7 2.9 3.6 10.1 8.9 10.7 9.9
A Soft EGA 2248 4.9 4.1 3.8 4.2 10.8 11.1 11.0 11.0
A Soft EGA Jitarning 4.3 3.7 2.9 3.6 10.3 10.3 10.8 10.5
Unclassified QT12864 4.7 4.0 3.5 4.1 11.6 11.2 11.4 11.4
Average within each TOS 4.2 3.8 3.1 3.7 11.1 11.3 11.5 11.3
TOS (lsd) 0.5 ns
Var (lsd) 0.2 0.7
Var (lsd) between TOS 0.5 1.5
Var (lsd) within TOS 0.4 1.1
%CV 7.1 6

Agribusiness Crop Updates 2008
Crop Updates is a partnership between the Department of Agriculture and Food, Western Australia and the Grains Research & Development Corporation
13
Table 2. Grain yield and grain quality response to sowing time at NRS in 2007
Paddock history: Lupins (06), Wheat (05) and Lupins (04)
Soil type: Sandy duplex (clay at ~ 20 cm)
Rainfall: 219 mm (May-October) and 63 mm (January-February)
Classification Variety Grain Yield (t/ha) Protein (%) Screenings (%) *28-May 20-Jun 6-Jul Av 28-May 20-Jun 6-Jul Av 28-May 20-Jun 6-Jul Av
AH Carnamah 2.1 1.5 1.3 1.7
AH EGA Bonnie Rock 1.9 1.5 1.3 1.6
AH GBA Sapphire 2.0 1.7 1.2 1.6
AH Tammarin Rock 2.0 1.7 1.6 1.8
AH Yitpi 1.8 1.6 1.4 1.6
APW Carinya 1.9 1.8 1.3 1.7
APW Catalina 2.0 1.4 1.3 1.6
APW Correll 2.0 1.9 1.0 1.6
APW Derrimut 1.7 1.8 1.3 1.6 Data not available at time of printing
APW EGA Wentworth 1.7 1.7 1.0 1.5 Data not available at time of printing
APW Gladius 1.5 1.3 1.4
APW Axe 1.4 1.3 1.4
APW Magenta 2.2 1.6 1.3 1.7
APW Wyalkatchem 2.2 1.7 1.2 1.7
APW Young 2.3 2.0 1.5 1.9
ASW LRPB Lincoln 1.8 1.7 1.3 1.6
ASWN Arrino 2.1 1.6 1.3 1.7
ASWN Binnu 2.0 1.7 1.1 1.6
ASWN Calingiri 2.0 1.8 1.0 1.6
ASWN Yandanooka 2.1 1.8 1.3 1.7
ASWN WAWHT2856 2.0 1.7 1.1 1.6
A Soft EGA Jitarning 2.2 1.8 1.3 1.7
Unclassified QT12864 2.0 1.5 1.2 1.6
Average within each TOS 2.0 1.7 1.3 1.6
TOS (lsd) 0.4
Var (lsd) 0.2
Var (lsd) between TOS 0.3
Var (lsd) within TOS 0.3
%CV 9.5

Agribusiness Crop Updates 2008
Crop Updates is a partnership between the Department of Agriculture and Food, Western Australia and the Grains Research & Development Corporation
14
Wheat variety performance in the South Coastal Region in 2007 Sarah Ellis, Department of Agriculture and Food, Western Australia, Esperance
KEY MESSAGES
Wyalkatchem was the highest yielding variety in Agzones 5 and 6 (NVT trials 2000-06) and at Esperance in 2007. However 2007 was a dry with negligible disease pressure. Poor grain quality is a risk for Wyalkatchem in wetter seasons.
Higher yields and better grain quality were achieved with earlier sowing at both Esperance and Mt Madden. Grain quality was determined by variety more than sowing time. Low disease pressure and dry harvest conditions allowed less adapted varieties to perform unexpectedly well in the Esperance Port Zone.
AIMS
To provide growers in the South Coastal Agricultural Region with information needed for making decisions on wheat variety choice and subsequent management.
METHOD
Wheat variety agronomy trials with three times of sowing (TOS) were located on a deep, grey sandy duplex, pH 4.8 over gravel, at Esperance Downs Research Station (EDRS, Gibson) and a brown, shallow sandy duplex, pH 4.6 over alkaline clay at Mt Madden (Lake King). Twenty four cultivars were sown in a randomised split block design. Gladius seed was unavailable for the earlier sowing times. Field based National variety testing (NVT) trials were located at Gibson, Munglinup, Salmon Gums, Scaddan, Mt Madden and Jerramungup in 2007. The NVT analysis (2000 to 2006) is available at http://www.acasnvt.com.au/ACAS/VarietyPerformance.aspx.
RESULTS
NVT trials
Wyalkatchem is the reference variety used to compare between wheat varieties across sites. It has consistently high yields in both Agzone 5 and 6. Recently released varieties Young, Magenta, Guardian, Gladius, EGA Wentworth, Correll and AGT Scythe have all performed well (Table 1) across the past six years of NVT (2000-2006), however this is based on a limited number of years data and must be viewed with some caution (see N = number of site years, Table 1). These varieties again yielded well across sites in 2007 (data not shown – see NVT website http://www.acasnvt.com.au). Gladius performed relatively better at low rainfall sites (118% Salmon Gums, 115% Mt Madden) than higher rainfall sites (average 106% of site mean).
Noodle varieties such as Arrino (98%), Binnu (97%), Calingiri (97%) and soft variety Bullaring (104%) have all yielded well but have been excluded from the data shown here as they are not deliverable within the Esperance Port Zone. Similarly, Bonnie Rock has been a consistently high yielding variety but is not recommended due to susceptibility to stripe rust. Guardian has yielded well recently and Longreach breeding company hope to soon achieve a reclassification from current Feed grade classification to APW.
Esperance Downs time of sowing trial
Growing conditions at EDRS were ideal with maximum stored soil moisture; good early break, effective weed control, uniform crop establishment; relatively dry winter and spring leading to low fungal disease pressure and dry harvest conditions. Grain yields were high overall, with the site average 5.3 t/ha (Table 2). Wyalkatchem yielded significantly more than all other varieties (6.32 t/ha) and EGA Gregory yielded significantly less (4.0 t/ha). Early sowing maximised yield, with the first time of sowing (TOS1) higher yielding than later sowings (TOS1 ave 6.21 t/ha, TOS2 ave 4.92 t/ha and TOS3 ave 4.75 t/ha).

Agribusiness Crop Updates 2008
Crop Updates is a partnership between the Department of Agriculture and Food, Western Australia and the Grains Research & Development Corporation
15
Grain quality was relatively low for TOS2 with poor hectolitre weights (below 74 kg/hL) and high screenings for many varieties. This may have been weather damage from very hot weather (> 35ºC) followed by heavy rain late in October before grain maturity. TOS 1 and 3 appear to be unaffected. At TOS2 the highest yielding varieties such as Wyalkatchem, Eagle Rock, Correll, Calingiri and Catalina had the lowest screenings and relatively good hectolitre weights. These varieties had consistently low screenings at each TOS, demonstrating a strong varietal response.
Table 1. Predicted yield of wheat varieties in NVT trials between 2000 and 2006 for Agzones 5 and 6, expressed as a percentage of Wyalkatchem
Wyalkatchem (t/ha)
Agzone 5 Agzone 6 Statewide
2.32 3.07 2.45
% N % N % N
AGT Scythe 98 16 96 7 96 104
Annuello 90 14 91 7 90 74
Axe 91 6 92 3 91 44
Babbler 88 8 89 4 87 35
Camm 93 26 94 11 93 121
Carinya 94 13 98 7 94 93
Carnamah 94 56 97 24 96 284
Cascades 86 46 89 23 86 264
Chara 87 7 92 2 88 42
Clearfield Jnz 89 13 92 5 88 63
Clearfield Stl 91 20 92 8 89 93
Correll 98 13 96 7 97 93
Drysdale 90 6 91 2 91 30
EGA Bonnie Rock 96 30 98 13 97 178
EGA Castle Rock 84 31 83 14 82 163
EGA Eagle Rock 87 33 90 17 89 181
EGA Gregory 86 22 85 8 83 87
EGA Wentworth 98 18 97 8 95 114
Ellison 89 4 89 11
Frame 90 3 90 12
GBA Ruby 95 21 97 6 96 128
GBA Sapphire 93 16 96 12 92 130
GBA Shenton 86 13 92 3 91 66
Giles 90 9 92 3 90 26
Gladius 97 12 96 6 96 86
Guardian 99 6 100 3 99 57
H46 92 13 98 7 95 25
Janz 91 15 91 4 90 82
Magenta 99 21 100 10 99 120
Mitre 92 21 91 11 89 73
Pugsley 98 6 98 23
Sentinel 89 4 90 22
Spear 94 57 94 19 93 286
Sunco 84 12 82 4 82 51
Tammarin Rock 93 25 93 13 94 162
Westonia 95 60 99 17 98 351
Wyalkatchem 100 53 100 22 100 310
Wylah 85 2 85 12
Yitpi 97 12 95 7 96 68
Young 100 13 99 7 98 93
N = Number of site years.
% = Yield as a percentage of Wyalkatchem.

Agribusiness Crop Updates 2008
Crop Updates is a partnership between the Department of Agriculture and Food, Western Australia and the Grains Research & Development Corporation
16
Table 2. Effect of sowing time on yield and quality of wheat varieties sown at Esperance. * Provisional screenings data includes whole and cracked grains
Esperance (Agzone 6)
Grain yield (t/ha) Protein (%) Screenings (%) * Hectolitre wt (kg/hL)
9 May 25 May 14 June Ave 9 May 25 May 14 June Ave 9 May 25 May 14 June Ave 9 May 25 May 14 June Ave
AGT Scythe 6.62 4.98 4.51 5.37 13.0 14.5 13.5 13.7 4.1 9.6 6.5 6.7 74 69 74 72
Annuello 5.39 4.07 3.87 4.44 13.4 14.5 13.9 13.9 3.5 11.8 9.3 8.2 78 75 77 76
Bolac 5.45 4.60 4.51 4.85 12.8 14.0 13.4 13.4 10.0 13.9 11.3 11.7 74 74 76 75
Braewood 5.68 4.69 4.78 5.05 13.0 13.2 12.4 12.9 6.3 9.0 4.6 6.6 77 78 80 79
Calingiri 6.94 5.48 5.27 5.90 12.9 13.4 12.8 13.0 2.0 3.4 2.8 2.7 79 76 78 78
Carinya 6.53 4.89 4.84 5.42 12.0 12.8 12.4 12.4 2.2 9.0 5.9 5.7 80 77 77 78
Carnamah 6.65 5.19 5.13 5.66 13.6 13.9 13.4 13.6 1.8 4.9 4.7 3.8 79 74 76 77
Catalina 6.04 5.10 4.95 5.36 12.5 12.4 12.5 12.5 1.2 3.8 5.3 3.4 81 79 80 80
Correll 6.53 4.89 4.57 5.33 13.0 13.8 13.3 13.4 3.4 4.4 3.4 3.7 74 69 72 72
Derrimut 5.92 4.75 5.04 5.24 11.8 12.8 12.3 12.3 3.2 10.0 8.0 7.1 79 74 77 77
EGA Eagle Rock 6.83 6.12 4.89 5.95 13.2 13.8 14.0 13.6 1.8 3.2 3.5 2.8 77 77 77 77
EGA Gregory 4.60 3.55 3.84 4.00 13.0 13.8 13.2 13.3 4.3 9.4 8.5 7.4 75 72 74 74
EGA Wentworth 5.86 4.63 4.66 5.05 12.4 13.2 12.8 12.8 2.9 12.4 9.5 8.3 79 74 78 77
GBA Sapphire 6.07 4.69 4.37 5.04 12.3 13.3 13.1 12.9 2.7 10.9 10.3 8.0 79 75 78 77
Gladius 5.19 5.19 13.0 13.0 2.8 2.8 76 76
Lincoln 6.17 3.96 3.99 4.70 13.1 14.8 13.8 13.9 5.4 15.7 10.7 10.6 77 71 74 74
QT12136 5.51 4.25 4.45 4.74 12.7 13.5 13.5 13.2 4.0 8.8 9.0 7.3 79 76 78 78
QT12864 6.62 5.16 5.10 5.63 12.6 13.7 12.8 13.0 2.6 4.8 5.3 4.3 82 78 80 80
VS2177 6.94 5.07 5.22 5.74 12.4 13.9 12.5 13.0 2.2 10.4 7.2 6.6 78 72 75 75
WAWHT2730 6.65 5.04 5.04 5.58 13.0 14.4 13.6 13.7 2.3 2.5 2.3 2.4 75 74 76 75
WAWHT2784 6.04 5.04 4.40 5.16 12.9 13.7 13.2 13.3 3.7 4.1 3.7 3.8 77 76 78 77
Wyalkatchem 7.14 5.98 5.83 6.32 13.0 13.3 12.7 13.0 1.1 1.7 2.1 1.6 81 79 79 79
Yitpi 5.98 5.25 4.63 5.28 12.5 13.2 12.9 12.9 3.8 4.9 4.7 4.5 76 74 75 75
Young 6.30 5.36 4.95 5.54 12.7 13.2 13.2 13.1 2.0 8.2 9.4 6.5 81 78 79 79
Average within each TOS 6.21 4.92 4.75 12.8 13.6 13.1 3.2 7.5 6.3 78 75 77
LSD (ave within each TOS) 1.05 (0.94)
ns (5.61)
ns (5.56)
ns
LSD (ave of variety) 0.36 0.35 1.94 1.47
LSD variety (across TOS) 0.85 0.79 4.56 4.21
LSD within TOS (between vars) 0.62 0.60 3.36 2.54
CV% 7.3 2.9 36.7 2.1

Agribusiness Crop Updates 2008
Crop Updates is a partnership between the Department of Agriculture and Food, Western Australia and the Grains Research & Development Corporation
17
Table 3. Effect of sowing time on yield and quality of wheat varieties sown at Mt Madden. * Provisional screenings data includes whole and cracked grains
Mt Madden (Agzone 5)
Grain yield (t/ha) Protein (%) Screenings (%) * Hectolitre wt (kg/hL)
23 May 7 June 19 June Ave 23 May 7 June 19 June Ave 23 May 7 June 19 June Ave 23 May 7 June 19 June Ave
AGT Scythe 2.52 2.17 1.73 2.14 9.7 11.2 11.2 10.7 12.5 11.9 15.0 13.2 82 81 81 81
Annuello 2.23 1.90 1.86 1.99 9.7 11.7 10.9 10.8 8.4 6.4 10.2 8.3 85 83 83 84
Bolac 2.16 1.70 1.45 1.77 10.1 11.4 11.0 10.8 7.1 12.7 12.1 10.6 83 80 81 81
Braewood 2.06 1.71 1.30 1.69 9.7 11.3 11.6 10.9 7.3 7.2 8.2 7.6 85 84 83 84
Calingiri 2.28 1.97 1.64 1.96 9.4 11.1 10.5 10.3 10.9 10.0 11.5 10.8 82 82 81 82
Carinya 2.29 2.14 1.78 2.07 9.8 11.5 10.8 10.7 7.7 8.0 10.3 8.7 84 83 82 83
Carnamah 2.16 1.98 1.71 1.95 10.0 11.4 11.0 10.8 9.3 8.8 9.6 9.2 82 82 82 82
Catalina 2.06 1.78 1.53 1.79 9.8 11.2 10.5 10.5 7.7 9.4 11.9 9.7 86 83 83 84
Correll 2.29 1.91 1.56 1.92 9.1 10.5 10.4 10.0 13.1 12.3 13.9 13.1 80 78 78 79
Derrimut 2.29 1.83 1.85 1.99 9.2 11.0 10.3 10.2 11.7 14.2 13.2 13.0 84 82 83 83
EGA Eagle Rock 2.07 1.93 1.56 1.85 11.1 12.6 12.1 11.9 7.9 8.0 9.6 8.5 82 81 81 81
EGA Gregory 2.10 1.93 1.52 1.85 9.5 10.6 10.5 10.2 11.8 10.9 10.2 11.0 84 84 84 84
EGA Wentworth 2.37 2.10 1.78 2.08 9.4 11.0 10.2 10.2 8.0 8.7 10.9 8.3 83 82 83 83
GBA Sapphire 2.28 2.17 1.89 2.11 9.6 11.0 10.6 10.4 7.2 7.0 4.9 6.3 84 84 84 84
Gladius 2.14 1.74 2.08 11.1 10.7 10.5 9.1 12.2 10.3 81 80 80
Lincoln 1.86 1.39 1.44 1.56 9.8 11.7 10.7 10.7 11.5 15.4 17.3 14.7 80 78 80 79
QT12136 1.59 1.73 1.16 1.49 10.5 12.2 12.0 11.6 6.8 8.1 7.1 7.3 85 84 83 84
QT12864 2.11 1.93 1.69 1.91 9.7 11.2 10.6 10.5 10.1 11.1 13.5 11.6 84 83 82 83
VS2177 2.34 1.96 1.71 2.00 9.0 10.6 9.8 9.8 10.0 10.1 12.9 11.0 82 81 81 81
WAWHT2730 2.21 1.99 1.45 1.88 10.1 11.5 12.3 11.3 11.1 7.4 8.2 8.9 83 82 82 82
WAWHT2784 2.02 1.65 1.25 1.64 10.1 11.2 11.4 10.9 7.8 8.3 11.7 9.3 84 82 82 82
Wyalkatchem 2.37 2.08 1.70 2.05 10.0 11.1 10.7 10.6 5.9 6.5 8.2 6.9 83 81 81 82
Yitpi 2.29 2.25 1.82 2.12 11.0 11.3 10.8 11.0 15.3 12.9 13.2 13.8 84 81 82 82
Young 2.23 2.11 1.85 2.06 9.8 11.0 10.6 10.4 7.9 9.9 13.0 10.3 84 82 84 83
Average within each TOS 2.19 1.94 1.62 9.8 11.3 10.9 9.43 9.77 11.2 83 82 82
LSD (ave within each TOS) 0.14 0.36 (1.74)
ns (1.37)
ns
LSD (ave of variety) 0.16 0.34 1.69 0.76
LSD variety (across TOS) (0.28)
ns 0.61 2.98 1.47 ns
LSD within TOS (between vars) (0.28)
ns 0.59 2.93 1.32
CV% 9.1 3.5 17.9 1.0

Agribusiness Crop Updates 2008
Crop Updates is a partnership between the Department of Agriculture and Food, Western Australia and the Grains Research & Development Corporation
18
Mt Madden time of sowing trial
Growing conditions at Mt Madden were poor relative to Scadden, with no stored soil moisture and significant dry periods limiting crop growth. Site yields averaged 1.9 t/ha with earlier sowing significantly higher yielding than later sowings (TOS1 ave 2.19 t/ha, TOS2 ave 1.94 t/ha and TOS3 ave 1.62 t/ha). Grain proteins were low at TOS1 and highest at TOS2. Hectolitre weight was high for all varieties at all sowing times. However, screenings were also high for all varieties at all sowing times. This is preliminary data, not adjusted for harvest damage (grain cracking) which can be substantial.
CONCLUSION
Wyalkatchem was the highest yielding variety in Agzones 5 and 6 (NVT trials 2000-06) and at Esperance in 2007. At the lower yielding Mt Madden site differences were not as clear with no significant yield difference between the top 11 varieties.
Higher yields and better grain quality were achieved with earlier sowing at both Esperance and Mt Madden. While late spring rains at Esperance were unable to overcome the yield penalty of delayed sowing, they are likely to have benefited grain quality in the later sowings.
A low disease pressure year followed by dry harvest conditions prevented robust assessment of variety adaptation. The high disease pressure and poor weather conditions at harvest usually experienced on the South Coast are likely to change variety yield and quality performance. This needs to be considered when referencing the data presented in this paper.
KEY WORDS
wheat varieties, agronomy, crop management, time of sowing
ACKNOWLEDGMENTS
Financial support of GRDC. National variety testing project for regional trial information. EDRS and Newdegate Research Support Units for trial support. Ben Curtis, Shahajahan Miyan, Steve Penny, Brenda Shackley, Darshan Sharma and Christine Zaicou-Kunesch for project support.
Project No.: DAW147
Paper reviewed by: Christine Zaicou

Agribusiness Crop Updates 2008
Crop Updates is a partnership between the Department of Agriculture and Food, Western Australia and the Grains Research & Development Corporation
19
Flowering dates of wheat varieties in Western Australia in 2007 Darshan Sharma1, Brenda Shackley3 and Christine Zaicou3, Department of Agriculture and Food, Western Australia; 1Northam, 2Katanning and 3Geraldton
KEY MESSAGES
Flowering dates for wheat varieties vary with sowing date as well as location.
Seasonal conditions also influence these dates (for 2006 flowering dates refer to ‘Flowering dates of wheat varieties in Western Australia in 2006‘ in 2006 Agribusiness Crop Updates Cereals proceedings). Warmer and drier conditions generally tend to hasten development for most of the currently grown varieties in WA.
The data presented here may be used only as a guide in respective regions to estimate relative flowering date for given time of seeding.
AIM
To improve flowering predictability of wheat varieties in Western Australia.
METHOD
Fifty wheat varieties were sown at four sowing times in unreplicated, one metre long rows with three repeated checks at Geraldton, Northam and Katanning. Locations were selected on the basis of representing a range of day length and minimum and maximum temperatures. The number of heads showing anthesis at 2-3 days intervals was recorded. Mid-anthesis date was determined as the date when 50% of heads had reached anthesis.
RESULTS
Mid-anthesis dates in Table 1 show that varietal relativities for the flowering dates can change with time of sowing as well as with location. Therefore caution is required when choosing varieties and sowing dates because future temperature conditions are not predictable.
Optimum flowering dates for different locations vary according to local temperature and moisture conditions. For example flowering ‘windows’ to maximise grain yield at the three trial locations have been determined as 25 August to 15 September for Geraldton, 5 September to 25 September for Northam and 17 September to 7 October for Katanning. It should be noted that these optimum flowering windows do not take into account frost risk. This should be considered when using information in Table 1 to predict flowering dates.
CONCLUSION
Duration from seeding to flowering is determined by sowing date and temperature conditions as well as variety.
KEY WORDS
flowering date, anthesis, head emergence, wheat, agronomy, new varieties, phenology
ACKNOWLEDGMENTS
Thanks to Bruce Haig, Melaine Kupsch and Anne Smith for their assistance in data recording, Mario D’Antuono for assistance in computing dates and to GRDC for funds.
Project No.: DAW00147
Paper reviewed by: Harmohinder Dhammu

Agribusiness Crop Updates 2008
Crop Updates is a partnership between the Department of Agriculture and Food, Western Australia and the Grains Research & Development Corporation
20
Table 1. Anthesis date new wheat varieties at different sowing dates at three locations in Western Australia in 2007 (table continued over page)
Variety Geraldton Northam Katanning
26 April 16 May 1 June 21 June 26 April 16 May 2 June 21 June 25 April 16 May 1 June 21 June
AGT Scythe 14 Jul 4 Aug 23 Aug 15 Sep 11 Aug 4 Sep 25 Sep 30 Sep 8 Sep 23 Sep 29 Sep 13 Oct
Annuello 10 Jul 1 Aug 19 Aug 13 Sep 10 Aug 13 Sep 25 Sep 8 Oct 9 Sep 24 Sep 10 Oct 15 Oct
Arrino 2 Jul 24 Jul 14 Aug 6 Sep 27 Jul 1 Sep 21 Sep 28 Sep 7 Sep 18 Sep 27 Sep 4 Oct
Binnu 6 Jul 23 Jul 8 Aug 2 Sep 2 Aug 6 Sep 21 Sep 3 Oct 6 Sep 26 Sep 1 Oct 7 Oct
Bolac 8 Jul 31 Jul 20 Aug 15 Sep 15 Aug 22 Sep 29 Sep 8 Oct 15 Sep 29 Sep 5 Oct 17 Oct
Braewood 25 Jul 19 Aug 2 Sep 23 Sep 4 Sep 27 Sep 1 Oct 8 Oct 2 Oct 9 Oct 14 Oct 20 Oct
Bullaring 13 Jul 6 Aug 25 Aug 19 Sep 10 Aug 19 Sep 29 Sep 11 Oct 9 Sep 1 Oct 12 Oct 15 Oct
Calingiri 17 Jul 1 Aug 22 Aug 13 Sep 17 Aug 17 Sep 28 Sep 4 Oct 4 Sep 21 Sep 30 Sep 11 Oct
Carinya 5 Jul 27 Jul 16 Aug 9 Sep 15 Aug 12 Sep 25 Sep 2 Oct 28 Aug 21 Sep 26 Sep 11 Oct
Carnamah 9 Jul 2 Aug 15 Aug 6 Sep 11 Aug 8 Sep 29 Sep 9 Oct 22 Aug 16 Sep 24 Sep 10 Oct
Catalina 2 Jul 25 Jul 14 Aug 6 Sep 31 Jul 4 Sep 25 Sep 1 Oct 30 Aug 24 Sep 1 Oct 13 Oct
Correll 2 Jul 29 Jul 14 Aug 5 Sep 29 Jul 6 Sep 24 Sep 1 Oct 17 Sep 28 Sep 8 Oct 15 Oct
Datatine 10 Jul 6 Aug 25 Aug 23 Sep 14 Aug 17 Sep 29 Sep 7 Oct 17 Sep 7 Oct 13 Oct 17 Oct
Derrimut 27 Jul 13 Aug 8 Sep 7 Sep 30 Sep 1 Oct 19 Sep 29 Sep 10 Oct
EGA 2248 1 Jul 24 Jul 13 Aug 8 Sep 28 Jul 7 Sep 24 Sep 1 Oct 28 Aug 24 Sep 29 Sep 8 Oct
EGA Bonnie Rock 2 Jul 22 Jul 10 Aug 5 Sep 28 Jul 28 Aug 21 Sep 29 Sep 20 Aug 12 Sep 26 Sep 8 Oct
EGA Eagle Rock 2 Jul 26 Jul 16 Aug 16 Sep 13 Aug 15 Sep 29 Sep 1 Oct 18 Sep 30 Sep 5 Oct 15 Oct
EGA Gregory 16 Jul 3 Aug 22 Aug 21 Sep 20 Aug 18 Sep 29 Sep 6 Oct 10 Sep 30 Sep 4 Oct 15 Oct
EGA Jitarning 2 Aug 16 Aug 5 Sep 26 Sep 2 Sep 26 Sep 2 Oct 9 Oct 18 Sep 1 Oct 10 Oct 17 Oct
EGA Wentworth 5 Jul 26 Jul 15 Aug 6 Sep 4 Aug 9 Sep 24 Sep 4 Oct 12 Sep 23 Sep 29 Sep 11 Oct
Ellison 19 Jul 12 Aug 29 Aug 18 Sep 27 Sep 5 Oct 10 Oct 17 Sep 5 Oct 10 Oct 20 Oct
GBA Sapphire 6 Jul 29 Jul 19 Aug 6 Sep 6 Aug 6 Sep 27 Sep 3 Oct 2 Sep 24 Sep 30 Sep 14 Oct
Gladius 29 Aug 5 Sep 25 Sep 29 Sep 30 Sep 12 Oct
LongReach Lincoln (LPB03 0545) 6 Jul 28 Jul 15 Aug 6 Sep 28 Jul 5 Sep 19 Sep 30 Sep 6 Sep 24 Sep 1 Oct 13 Oct
Lorikeet 4 Sep 15 Sep 28 Sep 12 Oct 16 Sep 21 Sep 4 Oct 9 Oct
Magenta (WAWHT 2726) 15 Jul 4 Aug 19 Aug 15 Sep 17 Aug 15 Sep 27 Sep 8 Oct 9 Sep 30 Sep 4 Oct 14 Oct
QT12136 6 Aug 21 Aug 17 Sep 26 Aug 11 Sep 28 Sep 2 Oct 28 Sep 6 Oct 16 Oct
QT12864 1 Aug 15 Aug 11 Sep 12 Aug 5 Sep 21 Sep 30 Sep 14 Sep 27 Sep 10 Oct
Axe (RAC1192) 25 Aug 30 Aug 12 Sep 28 Sep 16 Sep 30 Sep
Sentinel 24 Jul 21 Aug 30 Aug 15 Sep 16 Aug 19 Sep 27 Sep 6 Oct

Agribusiness Crop Updates 2007
Crop Updates is a partnership between the Department of Agriculture and Food, Western Australia and the Grains Research & Development Corporation
21
Table 1 continued …
Variety Geraldton Northam Katanning
26 April 16 May 1 June 21 June 26 April 16 May 2 June 21 June 25 April 16 May 1 June 21 June
Spear 27 Jul 26 Aug 3 Sep 19 Sep 20 Aug 20 Sep 28 Sep 2 Oct 15 Sep 30 Sep 13 Oct 15 Oct
Stiletto 27 Jul 23 Aug 4 Sep 15 Sep 11 Aug 19 Sep 27 Sep 4 Oct
Tammarin Rock 5 Jul 23 Jul 10 Aug 6 Sep 25 Jul 29 Aug 16 Sep 27 Sep 17 Aug 6 Sep 16 Sep 4 Oct
VS2177 12 Jul 1 Aug 16 Aug 9 Sep 10 Aug 9 Sep 27 Sep 5 Oct 3 Sep 19 Sep 27 Sep 10 Oct
WAWHT 2730 3 Aug 16 Aug 6 Sep 23 Sep 2 Sep 26 Sep 2 Oct 7 Oct 20 Sep 30 Sep 13 Oct 16 Oct
WAWHT 2784 8 Aug 31 Aug 5 Sep 24 Sep 1 Sep 26 Sep 2 Oct 8 Oct 25 Sep 11 Oct 14 Oct 20 Oct
WAWHT 2856 17 Jul 29 Jul 21 Aug 13 Sep 11 Aug 10 Sep 27 Sep 5 Oct 31 Aug 27 Sep 2 Oct 13 Oct
Wedgetail 2 Sep 19 Sep 27 Sep 14 Oct 29 Sep 3 Oct 8 Oct 15 Oct 1 Oct 11 Oct 14 Oct 25 Oct
Westonia 29 Jun 23 Jul 8 Aug 3 Sep 23 Jul 24 Aug 12 Sep 26 Sep 27 Sep 4 Oct
Wyalkatchem 5 Jul 31 Jul 9 Aug 3 Sep 4 Aug 12 Sep 16 Sep 30 Sep 27 Aug 20 Sep 28 Sep 6 Oct
Wylah 9 Sep 22 Sep 3 Oct 15 Oct 21 Sep 30 Sep 8 Oct 15 Oct 4 Oct 14 Oct 15 Oct 27 Oct
Yandanooka (WAWHT 2773) 10 Jul 2 Aug 19 Aug 9 Sep 7 Aug 3 Sep 20 Sep 29 Sep 26 Aug 16 Sep 27 Sep 7 Oct
Yitpi 30 Jul 19 Aug 2 Sep 18 Sep 20 Sep 29 Sep 7 Oct 20 Sep 3 Oct 13 Oct 17 Oct
Young 26 Jun 19 Jul 7 Aug 30 Aug 23 Jul 23 Aug 8 Sep 29 Sep 28 Aug 12 Sep 27 Sep 10 Oct
Jandaroi 28 Jun 24 Jul 17 Aug 1 Sep 30 Jul 31 Aug 15 Sep 27 Sep 22 Aug 27 Sep 2 Oct 12 Oct
Kalka 10 Jul 3 Aug 22 Aug 5 Sep 18 Aug 16 Sep 29 Sep 2 Oct
Wollaroi 2 Jul 24 Jul 9 Aug 2 Sep 3 Aug 28 Aug 13 Sep 28 Sep
Long duration Medium duration Short duration
* = Anthesis date is the date when 50% of the heads are showing yellow anthers.
Flowering dates in bold italics fall within optimum flowering dates for highest grain yield at these locations (25 August-15 September at Geraldton, 5 September-25 September at Northam, 17 September-7 October at Katanning).

Agribusiness Crop Updates 2008
Crop Updates is a partnership between the Department of Agriculture and Food, Western Australia and the Grains Research & Development Corporation
22
Barley variety options for Western Australia
Blakely Paynter1, Andrea Hills2 and Jeff Russell1, Department of Agriculture and Food, Western Australia; 1Northam and 2Esperance
Contact: Blakely Paynter, DAFWA, Northam; Ph: (08) 9690 2115 or [email protected]
KEY MESSAGES
• The number of barley malting and feed varieties available to growers is increasing. Deciding which variety to grow is therefore becoming more complex, although there are strong market signals indicating preferences for some varieties.
• Baudin is the variety in most demand by grain marketing companies for both export sale as grain for malting and export sale as malt. Baudin is well suited to international brewing markets with high starch adjunct usage during the brewing process. Growers are encouraged to review any plans to reduce their area sown to Baudin in the coming season. The release of an updated management package for Baudin – Farmnote 290/2008 titled Management update for Baudin barley (replaces 21/2004) and updates to disease management options in barley – Farmnote 288/2008 titled Managing barley leaf diseases (replaces 64/2001) will assist Baudin to be grown for the malting market. There is more comparative performance data for Baudin relative to other barley varieties in Farmnote 257/2007 titled Barley variety guide for 2007.
• Vlamingh is the newest malting barley and has favourable agronomic attributes relative to Baudin and Gairdner, but there is an unknown international market demand. Vlamingh will only be received at selected receival points in the 2008/09 harvest as only a small amount of grain is required to develop markets for its quality. Growers wishing to grow Vlamingh should consult Farmnote 289/2008 titled Vlamingh: A high yielding malting barley adapted to medium and high rainfall areas of Western Australia and article in these proceedings titled Vlamingh – the newest malting barley variety, for guidelines on how to grow Vlamingh to meet malt barley receival standards.
• Buloke is a new variety which growers have shown an interest in because of its high grain yield potential, moderate resistance to powdery mildew, apparent tolerance to boron toxicity and potential for upgrade from feed barley. Buloke is currently undergoing malting and brewing accreditation trials under the management of Barley Australia (www.barleyaustralia.com.au) and the results will be announced in February 2008. The Western Region Barley Council, the peak barley industry body in WA, is set to review the accreditation results in March and make a decision on its status in WA for the up coming season. Growers should be under no expectation, should Buloke become an accredited malting variety, that malt segregations will be made available for it in the 2008/09 harvest. There is currently no international market demand for Buloke, but there is some interest from parts of the domestic malting industry.
• Varieties with a feed classification now constitute 25% of the area sown to barley in Western Australia, up from 10% just six years ago. This swing to feed varieties is related to impact of the variability in seasonal rainfall (particularly in lower rainfall areas) on the probability of malting and an increase in leaf disease pressure in higher rainfall areas. The high price being paid for feed and malting barley and the difference between them will influence any further shift to feed barley. In addition the availability of five new feed varieties, Fleet, Hannan, Hindmarsh, Lockyer and Roe, could increase the pressure on the sowing of malting barley varieties. Whilst seed of the five varieties will not be widely available for sowing in 2008, growers are encouraged to find more out about them as one or more may suit their farming system and could be sown in 2009. Additional information can be found in Farmnote 261/2007 titled New feed barley varieties for Western Australia, which compares their agronomic attributes, grain yield by Agzone and disease resistance with that of varieties currently received as malting and feed in WA.
AIMS AND BACKGROUND
Barley production has continued to climb in Western Australia and now averages around 2 million tonnes per annum. Western Australia has consolidated its position as the major barley producing State in Australia, accounting for 44% of the national crop in 2006/07. The value of Western Australia’s barley exports was $334 million in 2006/07 is expected to climb to over $600 million from the most recent harvest.

Agribusiness Crop Updates 2008
Crop Updates is a partnership between the Department of Agriculture and Food, Western Australia and the Grains Research & Development Corporation
23
Malting barley varieties account for 75% of the area sown to barley. Baudin is now the dominant barley in Western Australia, accounting for 24% of the area based on CBH grower receival information. The top five varieties (in order of area) were Baudin, Gairdner, Stirling, Mundah and Hamelin and collectively account for 90% of the area sown to barley. There are significant changes in the types of barley that we are now growing. Varieties with a semi-dwarf habit (i.e. Baudin, Gairdner) now account for nearly 50% of the barley acreage up from 20% in the mid 1990s and 1% in the mid 1980s. The other change is the swing to varieties with a feed only classification (i.e. Barque, Dash, Mundah) which now account for 25% of the barley acreage, up from 10% six years ago.
In addition to the greater choice in barley variety available there is also a greater choice in who you can sell the grain to and the price you will receive for that grain. Identifying which barley variety option will lead to the greatest return for a grower is complex. In some instances, the price premium paid for malting will more than offset the lower yields of some malting varieties when compared to a suggested feed variety. In other situations, the substantially higher yield of feed varieties, or the low likelihood of a malting variety being included in the malting grade, may justify the choice of a feed variety. The recent increase in barley price has changed the economics of feed versus malt barley.
At a feed price of $300/t and a malt premium of $40/t, feed barley needs to yield 1.13 times or 13% more than a malting barley for the same gross return assuming 100% of the malting barley meets malting specifications and they have the same input costs. At a 50% probability of meeting malting specifications, feed barley needs to yield only 7% more than malting barley for the same gross return.
In the right season and with the right agronomy very few feed barley varieties however can deliver gross returns better than malting barley at current premiums. Management guidelines on how growers can maximise the success of growing a malting variety go a long way towards providing growers and industry with the confidence they need to sow malting barley at the right time for the right market. As growers look to increase their acreage of Baudin and Hamelin, adopt Vlamingh and potentially grow Buloke, they need support on how to manage their crops to maximise their probabilities of success. This can be done by providing variety specific management guidelines, including information on response to date of seeding, soil type suitability, seeding rate, nitrogen management and leaf disease management, and the effect of interactions between these factors. At the same time the new malting barley varieties need to be benchmarked against new feed barley variety options.
Standard variety evaluation trials (CVT and NVT) only provide a one-dimensional interpretation of variety performance. They tell you nothing about the impact that date of seeding has on relative grain yield and grain quality. This paper provides a snapshot of the time of sowing by variety research that the barley agronomy project at the Department of Agriculture and Food is undertaking. These trials began in 2006 and are planned to continue in 2008. The question being asked is which variety should I sow when and what are the consequences for grain yield and grain quality? How does sowing date influence the choice of barley variety (and grade of barley variety)? In undertaking this research we have selected what we consider the best malting varieties and the best feed varieties to compare. The control lines account for 90% of the current area sown to barley in Western Australia.
METHOD
Design: 18 varieties x 3 times of sowing x 3 replicates
Eighteen barley varieties were sown over three dates of seeding across nine locations in 2007 (Table 1). The dates of seeding were usually three weeks apart. Trials were sown at Calingiri, Cadoux, Mt Kokeby, Tincurrin, Corrigin, Newdegate, Grass Patch, Wittenoom Hills and Gibson. There
were only two dates of seeding at Tincurrin. Six accredited malting varieties − Stirling, Hamelin, Gairdner, Baudin, Vlamingh, Flagship; three un-released crossbreds being evaluated for their brewing
potential − WABAR2312, WABAR2315 and WI3416-1572; and nine varieties with a feed classification, Barque, Buloke, Dash, Fleet, Hannan, Hindmarsh, Lockyer, Mundah and Roe were included. It should be noted that Buloke, Hannan and Hindmarsh are completing or entering into commercial accreditation trials and may be accredited in the future as being suitable for delivery into the malting grade. Seed was treated with triadimenol as Zorro® at 400 mL/100 kg seed and sown to establish 150 plants/m2. Flutriafol as Impact was applied to the in-furrow fertiliser at 400 mL/ha. In-crop foliar fungicide was used where deemed necessary. Trials were sown as a block row column design (varieties sown in replicates across three banks) with time of sowing as the main plot and varieties randomised within.

Agribusiness Crop Updates 2008
Crop Updates is a partnership between the Department of Agriculture and Food, Western Australia and the Grains Research & Development Corporation
24
Table 1. Site details for barley agronomy time of sowing trials sown in the 2007 season
Site Agzone Date sown
Soil type TOS1 TOS2 TOS3
Calingiri 2 30 May 25 June 11 July Red loamy gravel
Corrigin 2 29 May 19 June 10 July Red deep sandy duplex
Mt Kokeby 2 29 May 19 June 10 July Yellow deep sandy duplex
Tincurrin 2 9 May 11 June - Yellow shallow sandy duplex
Cadoux 4 29 May 21 June 10 July Yellow shallow sandy duplex
Newdegate 5 24 May 19 June 4 July Brown shallow sandy duplex
Grass Patch 5 4 May 22 May 12 June Alkaline grey shallow loamy duplex
Wittenoom Hills 5 3 May 18 May 13 June Alkaline grey deep loamy duplex
Gibson 6 2 May 21 May 11 June Grey deep sandy duplex
Plots were sown with a small plot seeder sowing 6 to 7 rows of seed at 22 to 25 cm row spacing. Plant establishment counts were taken at four weeks after seeding. Plots were harvested with a small plot harvester, weighed and sub-sampled. The grain sub-sample was cleaned over a 1.5 mm sieve and measured for average grain weight, hectolitre weight, screenings, grain brightness and grain protein. The physical grain analysis was not available at time of printing.
RESULTS AND DISCUSSION
Rainfall received
The first opportunity to sow a trial ranged from early May in the Esperance region to late May in the central wheatbelt (Table 1). The last seeding opportunity for the third date of seeding was in late July. Total rainfall received between 1 May and 30 October ranged between 174 mm at Newdegate to 317 mm at Gibson (Figure 1). Trials located in the south eastern wheatbelt (Grass Patch, Wittenoom Hills and Gibson) received 40% of their rainfall during the period between May to July (seeding period) and 60% during the period between August to October (grain filling period). The other six sites received 60% of their rainfall during the seeding period and 40% during the grain filling period.
0
50
100
150
200
250
300
350
Ca
ling
iri
Co
rrig
in
Mt
Ko
ke
by
Tin
cu
rrin
Ca
do
ux
Ne
wd
eg
ate
Gra
ss
Pa
tch
Witte
no
om
Hill
s
Gib
so
n
Ra
infa
ll (m
m)
May-July Aug-Oct
Figure 1. Rainfall received during the seeding period (May to July) and the grain filling stage (August to
October) for the nine time of sowing by variety trials sown in 2007. Rainfall data had not been received for Corrigin and Grass Patch at the time of writing this paper.
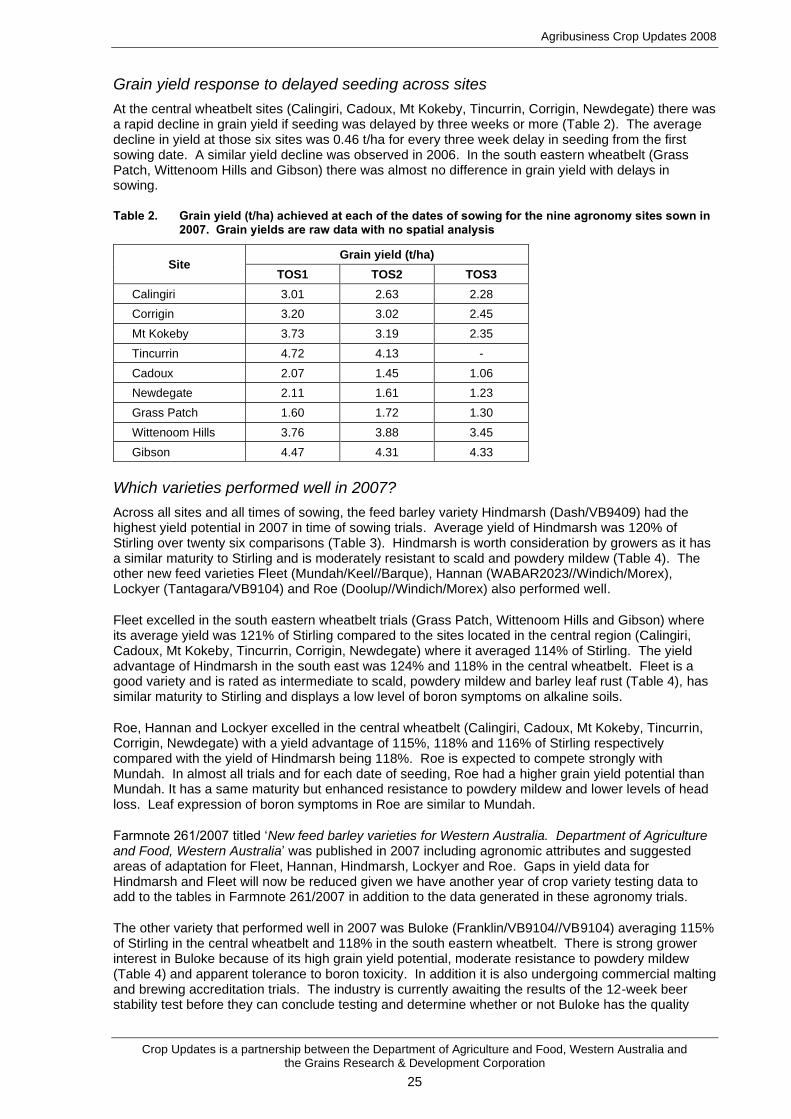
Agribusiness Crop Updates 2008
Crop Updates is a partnership between the Department of Agriculture and Food, Western Australia and the Grains Research & Development Corporation
25
Grain yield response to delayed seeding across sites
At the central wheatbelt sites (Calingiri, Cadoux, Mt Kokeby, Tincurrin, Corrigin, Newdegate) there was a rapid decline in grain yield if seeding was delayed by three weeks or more (Table 2). The average decline in yield at those six sites was 0.46 t/ha for every three week delay in seeding from the first sowing date. A similar yield decline was observed in 2006. In the south eastern wheatbelt (Grass Patch, Wittenoom Hills and Gibson) there was almost no difference in grain yield with delays in sowing.
Table 2. Grain yield (t/ha) achieved at each of the dates of sowing for the nine agronomy sites sown in 2007. Grain yields are raw data with no spatial analysis
Site Grain yield (t/ha)
TOS1 TOS2 TOS3
Calingiri 3.01 2.63 2.28
Corrigin 3.20 3.02 2.45
Mt Kokeby 3.73 3.19 2.35
Tincurrin 4.72 4.13 -
Cadoux 2.07 1.45 1.06
Newdegate 2.11 1.61 1.23
Grass Patch 1.60 1.72 1.30
Wittenoom Hills 3.76 3.88 3.45
Gibson 4.47 4.31 4.33
Which varieties performed well in 2007?
Across all sites and all times of sowing, the feed barley variety Hindmarsh (Dash/VB9409) had the highest yield potential in 2007 in time of sowing trials. Average yield of Hindmarsh was 120% of Stirling over twenty six comparisons (Table 3). Hindmarsh is worth consideration by growers as it has a similar maturity to Stirling and is moderately resistant to scald and powdery mildew (Table 4). The other new feed varieties Fleet (Mundah/Keel//Barque), Hannan (WABAR2023//Windich/Morex), Lockyer (Tantagara/VB9104) and Roe (Doolup//Windich/Morex) also performed well.
Fleet excelled in the south eastern wheatbelt trials (Grass Patch, Wittenoom Hills and Gibson) where its average yield was 121% of Stirling compared to the sites located in the central region (Calingiri, Cadoux, Mt Kokeby, Tincurrin, Corrigin, Newdegate) where it averaged 114% of Stirling. The yield advantage of Hindmarsh in the south east was 124% and 118% in the central wheatbelt. Fleet is a good variety and is rated as intermediate to scald, powdery mildew and barley leaf rust (Table 4), has similar maturity to Stirling and displays a low level of boron symptoms on alkaline soils.
Roe, Hannan and Lockyer excelled in the central wheatbelt (Calingiri, Cadoux, Mt Kokeby, Tincurrin, Corrigin, Newdegate) with a yield advantage of 115%, 118% and 116% of Stirling respectively compared with the yield of Hindmarsh being 118%. Roe is expected to compete strongly with Mundah. In almost all trials and for each date of seeding, Roe had a higher grain yield potential than Mundah. It has a same maturity but enhanced resistance to powdery mildew and lower levels of head loss. Leaf expression of boron symptoms in Roe are similar to Mundah.
Farmnote 261/2007 titled ‘New feed barley varieties for Western Australia. Department of Agriculture and Food, Western Australia’ was published in 2007 including agronomic attributes and suggested areas of adaptation for Fleet, Hannan, Hindmarsh, Lockyer and Roe. Gaps in yield data for Hindmarsh and Fleet will now be reduced given we have another year of crop variety testing data to add to the tables in Farmnote 261/2007 in addition to the data generated in these agronomy trials.
The other variety that performed well in 2007 was Buloke (Franklin/VB9104//VB9104) averaging 115% of Stirling in the central wheatbelt and 118% in the south eastern wheatbelt. There is strong grower interest in Buloke because of its high grain yield potential, moderate resistance to powdery mildew (Table 4) and apparent tolerance to boron toxicity. In addition it is also undergoing commercial malting and brewing accreditation trials. The industry is currently awaiting the results of the 12-week beer stability test before they can conclude testing and determine whether or not Buloke has the quality

Agribusiness Crop Updates 2008
Crop Updates is a partnership between the Department of Agriculture and Food, Western Australia and the Grains Research & Development Corporation
26
attributes to be accredited as a malting variety. Even if Buloke gets accredited as a malting variety it does not mean that it will be received in WA as a malting variety this coming season. Growers should therefore be under no expectation that segregations will be made available for the variety for the 2008/09 harvest. As there is stronger interest in Buloke than there is in Vlamingh from the domestic malting industry there will be some demand for Buloke grain for malting trials. This is to allow the domestic maltsters to undertake further commercial trials to determine the suitability of Buloke for their markets. This then could lead to the creation of segregations for Buloke in the 2009 season. We will have to wait until the peak barley industry body in Western Australia, the Western Region Barley Council, meets in late March to discuss malting and brewing results for Buloke before its status is known for the coming season.
Table 3. Grain yield (t/ha and % of Stirling) of the 18 varieties averaged across sites sown in May, June or July. Grain yields are raw data with no spatial analysis
Variety Grain yield (t/ha) Grain yield (% Stirling)
May June July Average May June July Average
Barque 3.26 2.83 1.98 2.86 115% 110% 108% 112%
Baudin 3.19 2.62 1.69 2.70 111% 101% 92% 104%
Buloke 3.39 2.94 2.03 2.97 120% 114% 109% 116%
Dash 3.15 2.56 1.52 2.63 108% 97% 82% 99%
Flagship 3.18 2.70 1.88 2.76 113% 103% 103% 107%
Fleet 3.41 3.00 1.97 2.99 120% 116% 107% 116%
Gairdner 3.16 2.56 1.43 2.62 111% 98% 79% 101%
Hamelin 2.95 2.64 1.87 2.64 104% 103% 100% 103%
Hannan 3.30 3.00 2.12 2.97 117% 117% 114% 116%
Hindmarsh 3.47 3.06 2.10 3.07 123% 119% 113% 120%
Lockyer 3.30 2.84 2.01 2.89 113% 108% 109% 111%
Mundah 2.95 2.82 1.91 2.71 104% 109% 103% 106%
Roe 3.32 2.89 2.04 2.92 119% 111% 110% 114%
Stirling 2.86 2.59 1.83 2.57 100% 100% 100% 100%
Vlamingh 3.12 2.65 1.81 2.71 107% 101% 97% 103%
WABAR2312 3.33 2.82 1.83 2.87 116% 108% 99% 110%
WABAR2315 3.36 2.81 1.82 2.87 116% 108% 98% 110%
WI3416-1572 3.20 2.85 1.89 2.82 108% 109% 103% 107%
Performance of the malting barley varieties currently received in Western Australia is dependant on sowing date and region. Stirling was out yielded by Baudin, Gairdner, Hamelin and Vlamingh with May sowing. As seeding was delayed, differences between them and Stirling became progressively smaller or an advantage developed in Stirling’s favour.
In the central wheatbelt, Gairdner was the worst performing of the malting varieties. As seeding was delayed its grain yield dropped from 108% of Stirling with May sowing, to 97% with June sowing and 79% with July sowing. Baudin and Vlamingh were higher yielding than Gairdner with both June and July sowing. A very similar picture was observed in 2006.
In the south east wheatbelt, Gairdner was the better performing of the later maturing varieties in terms of yield at Grass Patch but not necessarily at Wittenoom Hills or Gibson. Grain quality results (not available at time of printing) are required to determine if the yield differences were compensated by differences in grain quality and resulted in higher returns per hectare.
The performance of WABAR2312 (WABAR2023/Alexis) and WABAR2315 (WABAR2023/Alexis) was encouraging (Table 3). They are both semi-dwarf, medium spring maturity crossbreds like Baudin and Gairdner and will enter commercial malting and brewing trials with Barley Australia in 2008. This process takes a minimum of two years and, subject to satisfactory performance, they could be considered for commercial release to seed producers and growers in 2010. Both crossbreds have improvements in grain plumpness over Baudin and Gairdner, being similar to Stirling. They also have

Agribusiness Crop Updates 2008
Crop Updates is a partnership between the Department of Agriculture and Food, Western Australia and the Grains Research & Development Corporation
27
good resistance to barley leaf rust but are susceptible to powdery mildew (Table 4). They are being considered for export brewing markets along with Hindmarsh which will also enter year one of commercial accreditation trials in 2008 as well. The testing of Hindmarsh will be conducted on grain samples grown in eastern Australia whilst the commercial evaluation of the two WABAR lines will be conducted on grain grown in Western Australia.
WI3416-1572 (WI2976/Sloop//Galaxy) is in the second year of commercial accreditation trials with Barley Australia and will complete testing in late 2008. WI3416-1572 is being considered for domestic brewing markets such as the Swan Brewery. The new WA feed barley Hannan is also being considered for domestic brewing markets, having a similar micro-malting profile to WI3416-1572. As a consequence no seed of Hannan has been released to growers for sowing in 2008. Seed is being used for commercial brewing trials with Barley Australia. Whilst the commercial accreditation will take a minimum of two years to complete, it is expected seed will be released to growers in 2009. Hannan out yielded WI3416-1572 in Statewide agronomy trials in 2007. However, Hannan is more prone to lodging and is susceptible to powdery mildew, unlike WI3416-1572 (Table 4).
Table 4. Disease resistance ratings of the 18 varieties sown in agronomy trials in 2007
Variety Scald NTNB STNB Mildew BYDV Leaf rust CCN
Barque MR S I R I S R
Baudin I S S S MR S S
Buloke I Ip MS MR MSp S S
Dash R I S R S R R
Flagship MS-I I MS MS Ip MR R
Fleet I MSp S I ESp I-MRp R
Gairdner I I S MS R S S
Hamelin S S S S VS S -
Hannan MR Sp S MS Sp S-MS -
Hindmarsh MRp Ip Sp MRp MSp - R
Lockyer I Ip S I Sp MSp -
Mundah S MS MS MS MSp S S
Roe S-MS MSp S I Sp S -
Stirling S S MS S I S S
Vlamingh MR I S S MS MS S
WABAR2312 MS S S S I R -
WABAR2315 I MS S S I MR -
WI3416-1572 MS S S I - S R
Disease resistance ratings: S = susceptible, MS = moderately susceptible, I = intermediate, MR = moderately resistant, R = resistant, p = provisional.
FURTHER READING
Russell, J.J., Paynter, B.H. and Hills, A.L. (2007). Barley variety guide for 2007. Department of Agriculture and Food, Western Australia Farmnote No. 257.
Russell, J.J., Paynter, B.H. and Hills, A.L. (2007). New feed barley varieties for Western Australia. Department of Agriculture and Food, Western Australia Farmnote No. 261.
Jayasena, K.W., Beard, C., Thomas, G.J. and Loughman, R. (2008). Managing barley leaf diseases. Department of Agriculture and Food, Western Australia Farmnote No. 288. Replaces Farmnote No. 64/2001.
Russell, J.J., Paynter, B.H. and Hills, A.L. (2008). Vlamingh: A high yielding malting barley adapted to medium and high rainfall areas of Western Australia. Department of Agriculture and Food, Western Australia Farmnote No. 289.
Russell, J.J., Paynter, B.H. and Hills, A.L. (2008). Management update for Baudin barley. Department of Agriculture and Food, Western Australia Farmnote No. 290. Replaces Farmnote No. 21/2004.

Agribusiness Crop Updates 2008
Crop Updates is a partnership between the Department of Agriculture and Food, Western Australia and the Grains Research & Development Corporation
28
KEY WORDS
barley, feed barley, malting barley, variety choice
ACKNOWLEDGMENTS
The work covered in this paper is funded by the Department of Agriculture and Food, Western Australia (DAFWA) with support from the GRDC. The authors acknowledge the support of our technical staff Sue Cartledge and newly appointed Teagan Gates, Research Support Units and contributions from staff of DAFWA’s other Barley Projects – Breeding, Pathology, CVT and Grain Products Laboratory.
Project No.: DAW00148 and DAW00149
Paper reviewed by: Steve Penny

Agribusiness Crop Updates 2008
Crop Updates is a partnership between the Department of Agriculture and Food, Western Australia and the Grains Research & Development Corporation
29
Vlamingh A – the newest malting barley variety
Blakely Paynter1, Jeff Russell1 and Andrea Hills2, Department of Agriculture and Food, Western Australia; 1Northam and 2Esperance
Contact: Jeff Russell, DAFWA, Northam; Ph: (08) 9690 2100 or [email protected]
KEY MESSAGES
• Vlamingh is an accredited malting barley variety with unknown demand from export brewing markets.
• Growers are urged not to replace current varieties, especially Baudin, in favour of Vlamingh, but instead grow a small acreage of Vlamingh in 2008 whilst international market evaluation continues. The market only needs enough Vlamingh for market acceptance trials.
• Should Vlamingh gain international market acceptance then research shows it has the potential to be competitive against current malting varieties.
• Based on the premiums available at the 2007/08 harvest, Vlamingh had an economic advantage over Baudin, Gairdner, Hamelin and Stirling across 224 research trials. This is because it met malt receival standards more reliably than Baudin and Gairdner, similarly to Stirling and Hamelin, but with a higher grain yield potential.
• Vlamingh is suggested for sowing in medium and high rainfall environments. It is not considered suitable for normal sowing opportunities in low rainfall environments.
• The management guidelines for growing Vlamingh are contained in Farmnote 289 titled Vlamingh: A high yielding malting barley adapted to medium and high rainfall areas of Western Australia.
AIMS
To compare the performance of Vlamingh against current malting barley varieties and determine where Vlamingh barley is best suited in Western Australia.
BACKGROUND
The malting barley market is becoming very complicated. Not only is there a range of marketing options available, there is also a greater choice in varieties that can be grown. Vlamingh is the newest malting barley, having been accredited by Barley Australia and granted general malting status in Western Australia by the peak barley industry body, Western Region Barley Council, in 2006. Grain samples meeting malt barley receival standards will be paid the malting premium on receival at selected sites within Western Australia.
Vlamingh has a malting quality which is different to that of Baudin, Gairdner, Hamelin and Stirling. The international market demand for Vlamingh is unknown. Companies such as the Grain Pool will continue with trial shipments to customers during the 2008 season to determine which markets are willing to receive Vlamingh. The largest domestic malt barley user, Joe White Maltings, is still evaluating Vlamingh as an alternative to Gairdner and only a small demand for Vlamingh is envisaged at the 2008/09 harvest for trial malting in the 2009 season.
This paper takes grain yield and grain quality data collected from agronomic reseach trials and compares the performance of Vlamingh versus Baudin, Gairdner, Hamelin and Stirling in an economic analysis. Information on the agronomic attributes of Vlamingh and the suggested management strategy required to grow Vlamingh for the malting market are included in the new Farmnote 289 titled Vlamingh: A high yielding malting barley adapted to medium and high rainfall areas of Western Australia.
METHOD
An economic analysis was conducted using data collected from 224 small plot research trials conducted over five seasons between 2002 to 2006. Eighty per cent of the datasets used were from agronomic research trials (usually two or more dates of seeding) and the other 20% from crop variety evaluation trials (only one date of seeding) where grain quality was collected. Grain quality is not routinely measured on all samples in crop variety evaluation trials, which limits their usefulness for this type of analysis.

Agribusiness Crop Updates 2008
Crop Updates is a partnership between the Department of Agriculture and Food, Western Australia and the Grains Research & Development Corporation
30
Nearly 80% of the small plot trials were conducted in rainfall regions where the average annual rainfall was above 325 mm. The percentage of observations in each Agzone was: Agzone 1 (5%), Agzone 2 (35%), Agzone 3 (15%), Agzone 4 (10%), Agzone 5 (21%) and Agzone 6 (13%). The breakdown across rainfall zones is equivalent to 30% in high rainfall, 50% in medium rainfall and 20% in low rainfall.
Soil types at each location were grouped according to their major textural properties into four main groups and the percentage of observations across each of these groups was: non-alkaline sandy and loamy duplex soils (37%), alkaline sandy and loamy duplex soils (21%), ironstone gravel soils (23%) and earths and deep sands (19%).
There were significant climatic contrasts between the five seasons in which the small plot trials were conducted. Rainfall patterns recorded in 2002, 2004 and 2006 were below average in most regions of Western Australia, with low spring rainfall a feature of the 2004 season. The rainfall patterns in 2003 and 2005 were closer to average in most regions of Western Australia. The percentage of observations in each year was: 2002 (15%), 2003 (26%), 2004 (24%), 2005 (11%) and 2006 (24%). Trials planted in May formed 32% of the dataset, June 62%, whilst July sowing data formed 6% of the dataset.
Barley grain received by Co-operative Bulk Handling (CBH) is classified as malting or feed depending on variety, physical quality (hectolitre weight, moisture content, screenings, grain protein, grain brightness, mould) and level or presence of contaminants. For this analysis, all varieties compared could be classified as malting if they met the malt barley receival standards. Only three physical quality traits (screenings, grain protein and grain brightness) were used to calculate net farm gate price. The standards applying to the 2007/08 barley receival was used as a basis for the economic analysis, except that screenings were limited to 20% whereas in 2007/08 CBH allowed deliveries up to 25% due to the seasonal conditions. The maximum grade payable for Baudin, Gairdner, Hamelin and Vlamingh was malt and the maximum grade payable for Stirling was shochu. The assumptions used in the economic analysis are listed in Table 1.
Table 1. Premium payable for barley grain meeting malt barley receival specifications, premiums for delivery of grain within a defined protein window, variety premiums and end-point royalties payable on delivery. Receival standards based on 2007-08 Co-operative Bulk Handling Receival specifications except maximum screenings limited to 20%
1. Price premium over feed barley ($/t)
Malting barley $40
Shochu (Stirling only) $55
2. Specifications for delivery as malting
Specification Malt barley Shochu barley
Basis
Minimum protein 9.5% 9.5% db
Maximum protein 13.0% 12.5% db
Maximum screenings 20% 14% % < 2.5 mm
Minimum brightness 56 L 59% Minolta ‘L’
3. Protein window for which a premium is payable
Minimum protein 10.0%
Maximum protein 11.0%
4. Premium payable ($/t) if grain suitable for delivery as malting
Variety Baudin Gairdner Hamelin Vlamingh Stirling
Protein inside protein window $5.00 $2.50 $5.00 $5.00 $0.00
Variety premium $7.00 $5.00 $7.00 $0.00 $0.00
5. End-point royalty premium ($/t) payable on delivery as malt or feed
Variety Baudin Gairdner Hamelin Vlamingh Stirling
Delivery as malting $3.00 $0.00 $3.00 $3.50 $0.00
Delivery as feed $1.00 $0.00 $1.00 $1.50 $0.00

Agribusiness Crop Updates 2008
Crop Updates is a partnership between the Department of Agriculture and Food, Western Australia and the Grains Research & Development Corporation
31
RESULTS
Performance of Vlamingh relative to other malting varieties
The economic analysis clearly shows that Vlamingh has the potential to be a more profitable option than growing Baudin, Gairdner, Hamelin and Stirling in medium and high rainfall areas of Western Australia (Table 2). Vlamingh had higher returns in almost all seasons except 2006, was higher in Agzones 1, 2, 3, 5 and 6 and was higher the earlier the crop could be sown. This was despite the fact that Stirling could be received as shochu, which it did in 19% of observations. Vlamingh had advantages over other varieties on all soil types, particularly with May sowing, despite showing symptoms of boron toxicity on soils where the sub-soil pH is greater than 6.5 in CaCl2.
Table 2. Relative performance ($/ha relative to Stirling) of Baudin, Gairdner, Hamelin and Vlamingh when grown under the same management as Stirling over five seasons (2002-2006)
Season Baudin Gairdner Hamelin Vlamingh No. obs
2002 $43.36 $21.01 $19.64 $45.92 34
2003 $41.96 -$2.05 $29.66 $80.54 59
2004 $26.78 -$4.22 $2.69 $29.82 54
2005 $90.40 $55.48 $38.58 $79.26 24
2006 -$18.76 -$36.86 $7.85 -$6.36 53
AVERAGE $29.34 -$1.15 $17.43 $42.36 224
Sowing date Baudin Gairdner Hamelin Vlamingh No. obs
late May $55.46 $25.00 $30.78 $71.59 71
early June $39.16 $7.97 $12.59 $40.75 74
late June -$6.57 -$32.34 $10.43 $20.20 64
early July $10.43 -$36.73 $8.04 $6.53 15
Agzone Sowing date Baudin Gairdner Hamelin Vlamingh No. obs
Agzone 1 May $71.97 $104.81 $54.39 $145.35 7
June $67.97 $23.70 $65.57 $103.76 5
Agzone 2 May $79.58 $11.98 $16.42 $100.52 22
June $1.80 -$36.10 $1.18 $28.34 53
Agzone 3 May $74.77 $63.76 $49.35 $57.98 7
June $33.97 $12.33 -$6.68 $8.42 21
Agzone 4 May -$6.97 -$51.83 -$8.86 $3.49 9
June -$30.26 -$47.85 $8.80 -$13.63 12
Agzone 5 May $46.13 $11.98 $31.69 $38.86 14
June $43.08 $14.38 $29.78 $40.68 31
Agzone 6 May $48.03 $52.49 $61.14 $72.70 12
June $22.25 $11.50 $20.02 $63.34 16
Soil type Sowing date Baudin Gairdner Hamelin Vlamingh No. obs
Non-alkaline duplex soils May $76.46 $47.10 $20.12 $64.02 25
June $36.28 -$6.54 $16.90 $42.91 52
Alkaline duplex soils May $48.01 -$2.32 $39.82 $69.96 14
June $13.43 -$7.90 $5.18 $28.59 31
Gravels May $50.91 -$5.48 $32.76 $76.12 16
June $1.78 -$4.41 $4.73 $22.47 30
Earths and sands May $33.69 $44.84 $37.53 $80.31 16
June $4.85 -$30.51 $16.73 $20.66 25
Across the five seasons the net returns from growing Vlamingh were $42/ha higher than Stirling, $25/ha more than Hamelin, $13/ha more than Baudin and $43/ha more than Gairdner. The risk to growers in adopting Vlamingh as their medium spring maturity barley is lower than with Baudin and

Agribusiness Crop Updates 2008
Crop Updates is a partnership between the Department of Agriculture and Food, Western Australia and the Grains Research & Development Corporation
32
Gairdner. This is clearly evident with the change in relative returns due to sowing date. Where seeding could not occur until late June (as may have been the case in the lower rainfall years of 2002, 2004 and 2006) the sowing of Baudin and Gairdner would have lost growers money relative to switching to sowing Stirling instead. The net returns from Vlamingh were still superior to Stirling.
Ability of Vlamingh to make malting
The returns from growing Vlamingh were higher than Baudin and Gairdner because Vlamingh grain met the receival standards for malting barley more often (Table 3). Across the five seasons of trials, Vlamingh met malt barley receival standards in 42% of cases. This was similar to Stirling and Hamelin, but higher than Baudin at 33% and Gairdner at 21%.
The median screenings of Vlamingh over the 224 comparisons was 14.3% compared to Stirling 11.8%, Hamelin 16.3%, Baudin 23.1% and Gairdner 33.4%. When sown and harvested on the same day, the grain of Vlamingh was similar in brightness to Baudin, slightly darker than Gairdner and brighter than Stirling and Hamelin. Vlamingh can be expected to extend the range of situations in which malt barley can be received as malting to be similar to Baudin and Gairdner where Stirling would otherwise be received as feed. Grain protein levels under the same management are lower than Stirling due to dilution by its higher grain yield and similar to Baudin and Gairdner.
The likelihood of receival of malting for Vlamingh was highest with late May and early June sowing and decreased as sowing was delayed into late June and July (Table 3). It was higher than Baudin at all sowing dates except for July. It was always higher than Gairdner.
Based on the premiums offered in Table 1 and the proportion of trials that met receival standards in Table 3, Table 4 shows the average premium ($/t) achieved by each of the five varieties in relation to that being offered. Across the five years of trials, the average premium achieved by all varieties ranged between 20% to 45% of what was available. In our research trials the average premium achieved by Vlamingh was $15.44/t when the malt premium was $40/t, similar to Baudin but below Stirling and Hamelin. The higher returns per hectare achieved by Vlamingh are also therefore related to its high grain yield potential (Table 5).
Table 3. Proportion of grain samples of Baudin, Gairdner, Hamelin, Vlamingh and Stirling meeting malting barley receival standards and of Stirling meeting shochu barley receival standards when grown under the same management over 5 seasons (2002-2006)
Season Baudin Gairdner Hamelin Vlamingh Stirling as
malting Stirling as
shochu
2002 29% 18% 38% 44% 41% 29%
2003 47% 22% 59% 61% 64% 25%
2004 24% 20% 44% 37% 46% 19%
2005 63% 50% 63% 50% 50% 13%
2006 15% 9% 23% 19% 21% 8%
AVERAGE 33% 21% 44% 42% 45% 19%
Sowing date Baudin Gairdner Hamelin Vlamingh Stirling as
malting Stirling as
shochu
Late May 38% 21% 55% 52% 52% 21%
Early June 47% 35% 57% 51% 57% 24%
Late June 16% 9% 25% 27% 30% 14%
Early July 13% 0% 13% 7% 13% 0%

Agribusiness Crop Updates 2008
Crop Updates is a partnership between the Department of Agriculture and Food, Western Australia and the Grains Research & Development Corporation
33
Table 4. Average premium ($/t) over feed barley for Baudin, Gairdner, Hamelin, Vlamingh and Stirling meeting malting barley receival standards and for Stirling meeting shochu barley receival standards when grown under the same management over 5 seasons (2002-2006)
Season Baudin Gairdner Hamelin Vlamingh Stirling as
malting Stirling as
shochu
2002 $13.41 $8.31 $16.94 $16.74 $16.47 $20.88
2003 $21.80 $10.21 $27.05 $23.47 $25.76 $29.58
2004 $10.48 $9.40 $20.20 $13.78 $18.52 $21.30
2005 $28.79 $23.13 $28.38 $18.96 $20.00 $21.88
2006 $5.98 $4.29 $9.47 $5.76 $8.30 $9.43
AVERAGE $14.80 $9.71 $19.85 $15.44 $17.86 $20.67
Max. achievable premium ($/t)
$49.00 $47.50 $49.00 $41.50 $40.00 $55.00
Vlamingh as a malt barley versus feed barley
Whilst Vlamingh looks very competitive against current malting barley varieties the question is how does it perform against currently available feed barley varieties, as the analyses performed in Tables 1 to 4 did not have feed comparators.
Variety testing data shows Vlamingh is a high yielding barley and that none of the currently available feed barley varieties out yield it by more than 10% in all Agzones (Table 5). Only a few out yield it by 5%, but none across all Agzones. Feed varieties that out yield Vlamingh by 5% or more are Buloke (Agzones 2, 4 and 6), Dash (Agzones 4, 5 and 6), Maritime (Agzones 2, 3, 4, 5, and 6) and Molloy (Agzone 2). The yield of Vlamingh however is not high enough for it to be grown as a feed alternative to Baudin or Gairdner in the event that there is a limited market size for Vlamingh as a malting barley.
The matrix table, Table 6, shows the equivalent yield a feed barley must achieve to return the same profit as a malting barley at a range of feed barley prices from $170/t to $380/t with malting barley premiums over the feed barley price ranging from $10/t to $80/t. The assumption in this table is that the input cost of growing a feed and malt barley is the same. Any variety-based premium, protein premium and end point royalty payments for recently released malting or feed varieties must also be taken into account when comparing.
Table 6 shows that in economic terms, a 10% yield advantage is the minimum advantage required for growers to seriously consider switching from growing a malting variety like Vlamingh to a feed barley variety. This is based on an assumption of a malt premium of $40/t, a feed price of $200/t, half the Vlamingh grown meets the malting specifications and the two crops have the same input costs.
If feed barley prices were to remain above $300/t, then a yield difference of 6 to 7% becomes the critical point to switch to feed barley. Even in this scenario very few feed barley varieties would consistently give higher returns than Vlamingh. This is because Vlamingh has a grain plumpness similar to Stirling and a higher chance of making malting than Baudin and Gairdner (Table 3) in its area of adaptation and sown in line with the management guidelines indicated in Farmnote 289 titled Vlamingh: A high yielding malting barley adapted to medium and high rainfall areas of Western Australia. Agzone 4 would be one environment where feed barley is likely to be a better choice than Vlamingh, due to the lower chance of making malting standards in that environment.
This analysis shows that should Vlamingh gain international market acceptance, it could be widely sown in Western Australia, predominantly in medium and high rainfall areas.

Agribusiness Crop Updates 2008
Crop Updates is a partnership between the Department of Agriculture and Food, Western Australia and the Grains Research & Development Corporation
34
Table 5. Grain yield of Vlamingh compared to other barley varieties (as a percentage of Vlamingh) grown in Western Australia for each of the six Agzones in Western Australia. Data only presented where there are 5 or more observations in an Agzone. Analysis is an indirect analysis with not all varieties sown in all 335 trials (Source: DAFWA CVT data 1999-2006)
Variety Agzone 1 Agzone 2 Agzone 3 Agzone 4 Agzone 5 Agzone 6
Varieties currently received as malting
Baudin 93 101 97 98 98 97
Gairdner 96 100 98 96 96 99
Hamelin 88 97 91 96 92 90
Schooner 88 95 89 96 90 89
Stirling 87 95 88 96 92 87
Vlamingh 100 100 100 100 100 100
Varieties currently received as feed
Barque 94 102 98 106 102 100
Buloke 101 105 103 107 104 105
Dash - 103 101 107 107 109
Doolup 97 103 95 101 99 97
Harrington 82 87 85 83 86 83
Maritime 99 106 105 114 109 112
Molloy 95 105 98 104 102 96
Mundah 97 104 94 103 98 96
Yarra 98 103 98 103 102 101
Vlamingh yield (t/ha) 2.83 2.46 3.05 1.51 2.34 2.76
Table 6. Equivalent yield of extra feed barley (%) needed to return the same profit as 1 t of malting barley with the same input costs
Feed price ($/t)
Malting premium ($/t)
$10 $20 $30 $40 $60 $80
Equivalent yield of feed barley (%) needed to return the same profit as 1 t of malting barley
$170 6% 12% 18% 24% 35% 47%
$200 5% 10% 15% 20% 30% 40%
$230 4% 9% 13% 17% 26% 35%
$260 4% 8% 12% 15% 23% 31%
$290 3% 7% 10% 14% 21% 28%
$320 3% 6% 9% 13% 19% 25%
$350 3% 6% 9% 11% 17% 23%
$380 3% 5% 8% 11% 16% 21%
The comparison between Vlamingh and feed barley could change in 2009 with the increased availability of the new feed barley varieties Fleet, Hindmarsh, Hannan, Roe and Lockyer. Yield data for those varieties was not included in Table 5 as they will more or less be undergoing seed bulk up in Western Australia in the 2008 season.
CONCLUSION
Based on its maturity, economic analysis and agronomic research data, Vlamingh is suggested for sowing in medium and high rainfall areas (Figure 1). It is not suggested for normal sowing opportunities in low rainfall areas (Agzone 4 and part of Agzone 5) due to the risk of running out of soil moisture for grain filling. For the 2008 season growers should bear in mind the location of potential receival sites in their area before embarking on a planting program with Vlamingh, as the market demand for Vlamingh is unknown.

Agribusiness Crop Updates 2008
Crop Updates is a partnership between the Department of Agriculture and Food, Western Australia and the Grains Research & Development Corporation
35
a) b) c)
Figure 1. Adaptation maps for (left to right) a) Gairdner; b) Baudin; and c) Vlamingh based on maturity and probability of meeting malting barley receival specifications showing increasing areas of suitability due to genetic improvements in grain plumpness.
KEY WORDS
barley, malt, feed, economic analysis, Vlamingh A, Western Australia
ACKNOWLEDGMENTS
The work covered in this paper is funded by the Department of Agriculture and Food, Western Australia (DAFWA) with support from the GRDC. The authors acknowledge the support of our technical staff Sue Cartledge and David Dodge and contributions from staff of DAFWA’s other Barley Projects – Breeding, Pathology, CVT and Grain Products Laboratory.
Project No.: DAW00148 and DAW00149
Paper reviewed by: Lisa Sherriff

Agribusiness Crop Updates 2008
Crop Updates is a partnership between the Department of Agriculture and Food, Western Australia and the Grains Research & Development Corporation
36
Barley yields higher in wide rows with stubble retained in a very dry season at Merredin Glen Riethmuller1, Bill Bowden2 and Paul Blackwell3, Department of Agriculture and Food, Western Australia; 1Merredin, 2Northam and 3Geraldton
KEY MESSAGES
Hamelin barley yielded higher in 360 mm rows than narrower rows when stubble was retained but there was no effect of row spacing on yield where stubble was burnt in this long term experiment. This result is in contrast to the previous years where the wide rows yielded less than the narrower rows.
The 360 mm row spacing stubble retained treatment yielded 0.2 t/ha ($60/ha at $300/t) more than the 360 mm burnt stubble treatment.
Ryegrass seed set was higher with stubble retained than burnt and was higher with wider rows.
Implications for growers are in-keeping with the general finding that wider rows may only help in low yielding (less than 1.0 t/ha) situations/seasons and weed control can be an issue.
AIMS
To investigate the effect of row spacing and stubble retention on the yield and seed quality of Hamelin barley.
METHOD
This continuing experiment at the Merredin Research Station was initiated in 1987 by Steve Porritt to investigate stubble and row spacing interactions in wheat (87M71). Each year the same treatment is applied to the same plot. Treatments are burnt and retained stubble, with row spacings of 90, 180, 270 and 360 mm with six replications and a plot width of five metres. The soil is a red-brown sandy clay loam (salmon gum, gimlet). Stubble was cut to 20 cm long at harvest each year to allow stubble handling. 2005 was Kaspa field peas averaging 1.9 t/ha (May-October rainfall 240 mm) and 2006 was Bonnie Rock wheat averaging 2.4 t/ha (May-October rainfall 154 mm but 92 mm January-February rain).
Sowing date: 26 June 2007 (May-October rainfall 163 mm).
Seed rate: 101 kg/ha Hamelin barley pickled with Baytan. Germination 95%, seed weight 38.9 g/1000.
Viable seed sown: 247 seeds/m2
Fertiliser: 83 kg/ha double super (analysis 17.7% P, 16.2% Ca, 3.6% S, 0.08% Zn, 0.08% Cu).
Banded 20 mm below the seed (with the seed on 90 mm instead of two passes).
Seeder: All points were 40 mm wide. Janke 110 mm wide chamfered ‘V’ press wheels were set at 3 kg/cm width with 140 mm ring harrow attached.
Sprays: 26 June 1.0 L/ha Treflan + 2.0 L/ha Spray.Seed 250 + extra 1.0 L/ha Treflan (only on 270 and 360 mm rows IBS).
31 July 0.05 kg/ha Affinity (carfentrazone-ethyl) + 0.333 L/ha Agritone (MCPA). 13 August 1.0 L/ha Decision®.
Harvester: KEW 1.62 m wide (4 rows for 360 mm spacing) without Rytec ryegrass catcher system but crop lifters were used for better ryegrass capture.
Harvest date: 6 November 2007
The treatments were sown with a no-till systems approach with all non-sowing tines removed. The fertiliser was banded 20 mm below the seed for all treatments except the 90 mm row spacing which had the fertiliser with the seed (as it was thought two passes may mix in the trifluralin near the seed). Extra Treflan was added to the 270 and 360 mm rows to be consistent with the label for wider rows (it was suggested by agronomy consultants that otherwise it is biased against the wide rows, therefore allowing more ryegrass in the wide rows).

Agribusiness Crop Updates 2008
Crop Updates is a partnership between the Department of Agriculture and Food, Western Australia and the Grains Research & Development Corporation
37
The Decision® herbicide yellowed the crop very badly. Abandoning the experiment was considered around the second week of September (spray to reduce weed seed set in the area). However a grower at the WANTFA field day expressed extreme disappointment at spraying out experiments as
he felt there is always something to learn in bad years − so the experiment continued. Some unexpected rain in October also helped fill some grain.
RESULTS
Leaf spotting and some bent leaves were apparent after the Affinity spray so on 15 August four whole top samples of between 30 and 45 plants were taken for CSBP analysis on the first three reps; stubble 180 mm, burnt 180 mm, stubble 360 mm and burnt 360 mm.
Total nitrogen was low, zinc was marginal and copper and boron were high and there appeared no treatment effects except maybe more nitrate N in the 360 mm rows. Due to the low season rainfall it was decided not to add any more fertilisers, including zinc spray.
The average seed depth was slightly deeper with the stubble retained which is consistent with other years, probably due to the more friable soil (Table 1).
The plant establishment was similar for all treatments however the 7th row from the side of the ten 360 mm rows had a blanking cap left on in the seed box so the missed row effectively gave a row spacing of 540 mm. This missed row then gave an opportunity to see if even wider rows would have an effect.
The centre four rows of the six 360 mm rows were harvested to give a guard row each side as well as the two effective 540 mm rows were harvested afterwards. The yields were very low due to the low rainfall but for the first time in this experiment there was an interaction of stubble and row spacing (Table 1). There was no effect of row spacing on yield of the burnt treatments but in the stubble retained treatments the yield increased with increasing row spacing. The protein also reflected the yield differences with lower in the higher yielding treatments. Also the crop was taller in the wider rows and taller with stubble retained. The stubble had no effect on yield with the two effective 540 mm rows but the burnt treatment was higher than the any other burnt treatments, which is unexplained.
Table 1. Seed depth, plant density, yield, protein and crop height with row spacing and stubble
Treatments Seed depth
(mm) 31-7-07
Plant density (pl/m2) 31-7-07
Harvest yield (t/ha)
6-11-07
Protein
(%)
Crop height (mm)
Stubble burnt
1. 90 mm rows 29 115 0.343 15.3 208
2. 180 mm rows 22 121 0.329 15.2 207
3. 270 mm rows 26 131 0.331 14.8 218
4. 360 mm rows 27 132 0.340 14.9 215
540 mm rows* - - 0.476 14.2 -
Burnt mean 26 125 0.335 15.0 212
Stubble retained
5. 90 mm rows 36 122 0.388 15.4 217
6. 180 mm rows 34 143 0.442 14.6 227
7. 270 mm rows 31 123 0.458 14.6 247
8. 360 mm rows 28 126 0.542 14.3 250
540 mm rows - - 0.515 14.8 -
Stubble mean 32 128 0.458 14.7 235
lsd (5%) stubble F pr
4.6 0.012
ns 0.388
0.0339 < 0.001
ns 0.118
8.6 < 0.001
lsd (5%) spacing F pr
ns 0.339
ns 0.172
0.0480 0.022
0.537 0.039
12.2 0.002
lsd Stub x Spac F pr
ns 0.468
ns 0.076
0.0678 0.020
ns 0.473
ns 0.160
C. of V. (%) 17.8 11.9 14.6 4.4 6.6
* Statistics do not apply to the 540 mm rows but are there to show continuity of row spacing.

Agribusiness Crop Updates 2008
Crop Updates is a partnership between the Department of Agriculture and Food, Western Australia and the Grains Research & Development Corporation
38
The barley 1000 grain weight was higher with stubble retained than burnt and increased with increasing row spacing (Table 2).
The 1000 grain weight of the 540 mm rows was slightly higher with the burnt treatments for unknown reasons and was above all other row spacings. The screenings of the 540 mm rows were high but slightly lower than the other row spacings.
Overall the screenings was very high due to the season but were slightly less with stubble retained and tended to reduce with increasing row spacing.
The hectolitre weight tended to increase with increasing row spacing.
There were no grain moisture effects from any treatments.
Table 2. Grain weight, screenings, hectolitre weight and moisture with row spacing and stubble
Treatments 1000 grain
weight (g)
Screenings < 2.5 mm
(% wt)
Hectolitre weight (kg/hL)
Moisture
(%)
Stubble burnt
1. 90 mm rows 26.9 72.6 67.8 9.62
2. 180 mm rows 26.7 72.2 67.4 9.73
3. 270 mm rows 27.6 71.0 68.6 9.80
4. 360 mm rows 28.2 65.3 69.0 9.73
540 mm rows* 31.1 53.7 70.1 9.87
Burnt mean 27.4 70.3 68.2 9.72
Stubble retained
5. 90 mm rows 27.2 70.8 67.5 9.78
6. 180 mm rows 28.1 61.5 68.3 9.77
7. 270 mm rows 29.0 60.6 69.0 9.80
8. 360 mm rows 29.7 57.2 69.2 9.82
540 mm rows 30.5 56.8 69.8 9.75
Stubble mean 28.5 62.5 68.5 9.79
lsd stubble F pr
0.68 0.002
4.69 0.002
ns 0.250
ns 0.398
lsd spacing F pr
0.96 0.001
6.63 0.027
0.79 0.002
ns 0.850
lsd Stub x Spac F pr
ns 0.510
ns 0.496
ns 0.500
ns 0.901
C. of V. (%) 4.1 12.1 1.4 2.9
* Statistics do not apply to the 540 mm rows but are there to show continuity of row spacing.
The in-grain ryegrass (measured from the harvest grain sample) was relatively low compared to earlier years but still increased with increasing row spacing and increased more with stubble retained than burnt (Table 3).
The ryegrass seed weight also increased with increasing row spacing as in 2006. This may suggest the ryegrass seed in the narrower rows may not be as vigorous as the wider rows for the following crop.
There was around six times more in-grain ryegrass with the stubble retained than burnt in the two 540 mm rows.

Agribusiness Crop Updates 2008
Crop Updates is a partnership between the Department of Agriculture and Food, Western Australia and the Grains Research & Development Corporation
39
DISCUSSION
The increase in yield with increasing row spacing and stubble retained may be due to the stubble holding more surface soil water as there was little soil water deep in the profile. The crop roots may have been very shallow because of the light rainfall events (12.2 mm on 8 October was the highest daily rainfall event in the growing season from sowing with the average being 2.6 mm over the 50 days of rain) and the narrow rows may have used this water early but the wider rows may have made use of this stored water to fill more grain.
This is the first year of this experiment that this has occurred so it must be put in context with all other years where yields decreased with increasing row spacing.
The increase in ryegrass with wider rows must also be taken into account for future crops. Alternate chemical groups, weed seed removal systems at harvest or shielded spraying may have to be used to keep weed numbers down in wide rows.
Table 3. In-grain ryegrass and ryegrass seed weight with row spacing and stubble
Treatments In-grain ryegrass
log (seed/m2)* Ryegrass seed weight
(g/1000)
Stubble burnt
1. 90 mm rows 0.100 (0.3) 1.78
2. 180 mm rows 0.281 (0.9) 1.86
3. 270 mm rows 0.322 (1.1) 2.36
4. 360 mm rows 0.664 (3.6) 2.17
540 mm rows** 1.245 (17.0) -
burnt mean 0.342 (1.2) 2.04
Stubble retained
5. 90 mm rows 0.313 (1.1) 2.15
6. 180 mm rows 0.484 (2.0) 2.10
7. 270 mm rows 1.190 (14.4) 2.15
8. 360 mm rows 1.180 (14.2) 2.31
540 mm rows 2.030 (105.0) -
Stubble mean 0.791 (5.2) 2.18
lsd (5%) Stubble F pr
0.148 < 0.001
ns 0.086
lsd (5%) Spacing F pr
0.209 < 0.001
0.218 0.012
lsd Stub x Spac F pr
0.296 0.008
ns 0.064
C. of V. (%) 44.6 12.4
* All logs are base 10 of (data + 1). Numbers in brackets are the antilog − 1. ** Statistics do not apply to the 540 mm rows but are there to show continuity of row spacing.
CONCLUSION
1. In this very dry season the row spacing had no effect on the barley yield in the burnt treatments but the yield increased with increasing row spacing with the stubble retained treatments. The 360 mm stubble treatment yielded 0.2 t/ha ($60/ha at $300/t) more than 360 mm burnt.
2. The stubble retained treatments were up to 35 mm taller than the burnt treatments and crop height tended to increase with increasing row spacing.
3. Ryegrass seed set was higher with stubble retained than burnt and was higher with wider rows.
4. Implications for growers are in-keeping with the general finding that wider rows only help in low yielding (less than 1.5 t/ha) situations/seasons and weed control can be an issue.

Agribusiness Crop Updates 2008
Crop Updates is a partnership between the Department of Agriculture and Food, Western Australia and the Grains Research & Development Corporation
40
KEY WORDS
barley, row spacing, stubble, no-till, ryegrass, yield
ACKNOWLEDGMENTS
The author would like to thank Aaron Middleton and the staff at the Merredin Research Station (Alan Harrod, Leanne Young, Nicola Stanwyck and Elmer Kidson) for their patience in looking after this experiment.
Project No.: CRF
Paper reviewed by: Jeff Russell

Agribusiness Crop Updates 2008
Crop Updates is a partnership between the Department of Agriculture and Food, Western Australia and the Grains Research & Development Corporation
41
Herbicide tolerance of current/new wheat varieties
Dr Harmohinder Dhammu, Research Officer, Department of Agriculture and Food, Western Australia, Northam
KEY MESSAGES
This paper summarises research into herbicide tolerance of commonly grown and new wheat varieties in WA from 1999-2006.
AIM
To identify herbicide sensitivities or tolerances of wheat varieties and thus avoid potential yield losses.
METHOD
Table 1 summarises the herbicide X variety interactions using the following symbols based on the yield response across the herbicide crop tolerance trials conducted in WA from 1999-2006. The trials sites were Buntine, Esperance, Katanning, Merredin, Mullewa and Newdegate.
– not tested or insufficient data
no significant yield reductions at the label recommended rates in 2+ trials
x% yield reduction (warning), significant yield reduction at the label recommended rate in 1 trial only
x-y% yield reduction (warning), significant yield reduction at the label recommended rate in 2+ trials
The values in the parenthesis (x) are the number of trials in which a particular variety was tested against a particular herbicide.
Note: Always adhere to label recommendations. The Department of Agriculture and Food does not endorse the use of herbicides above the registered rate, off-label use of herbicides or off-label tank mixes. Crop tolerance and yield responses to herbicides are strongly influenced by seasonal conditions.
RESULTS AND DISCUSSION
The herbicide tolerance trials conducted over the last 8 years in WA indicate that some wheat varieties are more susceptible to damage from certain herbicides than others (Table 1). The variation in tolerance may be due to differences in morphological or physiological characters and/or internal ear development stages among the varieties. The level of tolerance amongst varieties varies with the rate of herbicide, the environmental conditions when the herbicide is applied to the crop, and the stage of the crop growth. Seasonal variability makes it essential to test herbicide and variety interaction over several seasons and locations. The risk of crop damage from a herbicide, should be balanced against the potential yield loss from both the weed competition and the number of weed seeds returning to the soil seed bank. Small yield reductions due to herbicide damage in sensitive varieties may not be easily detected at the paddock level, but which over larger areas can be of great economic importance.

Agribusiness Crop Updates 2008
Crop Updates is a partnership between the Department of Agriculture and Food, Western Australia and the Grains Research & Development Corporation
42
Table 1. Tolerance of wheat varieties to herbicides from 1999 to 2006 (table continued over subsequent two pages)
Varieties
Arr
ino
Bin
nu
Cali
ng
iri
Carn
am
ah
EG
A B
on
nie
Ro
ck
EG
A E
ag
le
Ro
ck
GB
A
Sa
pp
hir
e
We
sto
nia
Wy
alk
atc
hem
Ya
nd
an
oo
ka
Year of testing and trial sites 1999-2001
2006 1999-2001
1999-2003
2002-2004
2004-2005
2004, 2006
1999-2003
2001-2006
2005-2006
Herbicides/ha Timing ADEF CD ADEF ABCDEF DE E CE ABCDEF BCDEF CDE
Avadex® BW 2 L (Tri-allate) IBS (6) – () () () – – 31 (10) () –
Glean® 12.5 g (Chlorsulfuron) IBS 37 (6) – 12-25 (6) () () – – (10) () –
Glean® 20 g (Chlorsulfuron) IBS (6) () () () () () () () () ()
Logran® 35 g (Triasulfuron) IBS () – () () () – – () () –
Logran® B Power 50 g (Triasulfuron + Butafenacil)
IBS – () – () () () () () () ()
Stomp®330 1.8 L (Pendimethalin) IBS 13 (7) () () 36 (13) () () ()
21-24 (11)
() ()
Treflan® 400 1 L (Trifluralin) IBS () – () () () – – () () –
Triflur® X 2 L (Trifluralin) IBS – () – – () () () – () ()
Yield® 250 EC 2 L (Oryzalin + Trifluralin)
IBS () – 12 (10) – – – () () –
Diuron 1 L + Dual® 0.5 L (Diuron + Metolachlor)
IBS () – () 17 (10) () – – () 18 (5) –
Boxer* Gold 2.5 L (s-Metolachlor + Prosulfocarb)
IBS – () – – – – – – () ()
Diuron 1 L + Glean® 15 g (Diuron + Chlorsulfuron)
IPP () – () () – – – 14 – –
Wildcat® 0.5 L (Fenoxaprop-P-ethyl) Z12-Z13 () – () () – – – () – –
Topik® 240 EC 0.210 L (Clodinafop) Z12-Z13 – – – – – – – () –
Hoegrass® 375 1.5 L (Diclofop-methyl) Z12-Z13 () – () () – – – () – –
Hoegrass® 375 2 L (Diclofop-methyl) Z12-Z13 – () – () () () () – 20 (7) ()
The names in the parenthesis are the chemical names. * Registration is due in early 2008. IBS = Incorporated by seeding/applied before seeding, IPP = Immediately post plant. A = Buntine, B = Esperance (Fleming gravely sand, pH-4.5 in Cacl2), C = Katanning (Duplex sandy loam, pH-5.2), D = Merredin (Clay loam/loam, pH-5.1-5.3), E = Mullewa (Sandy loam/red loam, pH-4.6-6.4) and F= Newdegate (Duplex sand over clay, pH-4.1).

Agribusiness Crop Updates 2008
Crop Updates is a partnership between the Department of Agriculture and Food, Western Australia and the Grains Research & Development Corporation
43
Table 1 continued …
Varieties
Arr
ino
Bin
nu
Cali
ng
iri
Carn
am
ah
EG
A B
on
nie
Ro
ck
EG
A E
ag
le
Ro
ck
GB
A
Sa
pp
hir
e
We
sto
nia
Wy
alk
atc
hem
Ya
nd
an
oo
ka
Year of testing and trial sites 1999-2001
2006 1999-2001
1999-2003
2002-2004
2004-2005
2004, 2006
1999-2003
2001-2006
2005-2006
Herbicides/ha Timing ADEF CD ADEF ABCDEF DE E CE ABCDEF BCDEF CDE
Decision® 1 L (Diclofop + Sethoxydim)
Z12-Z13 – – – (3) () () – () () –
Cheetah® Gold 1 L + Hasten® 1% (Diclofop + Sethoxydim + Fenoxaprop)
Z12-Z13 – () – – – – – – (2) ()
Axial® 300 mL (Pinoxadin) Z12-Z13 – () – – – – – – () ()
Achieve® 250 g (Tralkoxydim) Z12-Z13 (6) – () () () – – () () –
Achieve® 380 g (Tralkoxydim) Z12-Z13 – () – – () () () – () ()
Hoegrass® 200 mL + Achieve® 200 g (Diclofop-methyl + Tralkoxydim)
Z12-Z13 – () – 10 (6) () () () () 19-30 (11)
30 (3)
Eclipse® 10 g (Metosulam) Z12-Z13 (4) – 12 (4) () – – – () () –
Jaguar® 1.0 L (Bromoxynil + Diflufenican)
Z12-Z13 (6) () 15-19 (6) () () () () () () ()
Monza® 25 g (Sulfosulfuron) Z12-Z13 – (2) – () () () () () () ()
Ally® 5 g (Metsulfuron) Z13-Z14 (5) 18 (2) 11(5) 15 (11) () () () 14-26 (9) () 17 (3)
Atlantis® 330 mL (Mesosulfuron-methyl) Z13-Z14 – () – () () () – () ()
Broadside® 1 L (Bromoxynil + MCPA + Dicamba)
Z13-Z14 (6) () () 8-10 (12) () – – () () ()
Broadside® 1.4 L (Bromoxynil + MCPA + Dicamba)
Z13-Z14 – – – () – – – () –
Hussar® 200 g (Iodosulfuron-methyl) Z13-Z14 – () – () () 34 (2) () () () ()
Metaven® L 3.0 L (Flamprop-M-methyl)
Z13-Z14 – 19 (2) – () () () () () () ()
Paragon® 0.375 mL (Picolinafen + MCPA)
Z13-Z14 – – – – () () – – () –
The names in the parenthesis are the chemical names. A = Buntine, B = Esperance (Fleming gravely sand, pH-4.5 Cacl2), C = Katanning (Duplex sandy loam, pH-5.2), D = Merredin (Clay loam/loam, pH 5.1-5.3), E = Mullewa (Sandy loam/red loam, pH-4.6-6.4) and F = Newdegate (Duplex sand over clay, pH-4.1).

Agribusiness Crop Updates 2008
Crop Updates is a partnership between the Department of Agriculture and Food, Western Australia and the Grains Research & Development Corporation
44
Table 1 continued …
Varieties
Arr
ino
Bin
nu
Cali
ng
iri
Carn
am
ah
EG
A B
on
nie
Ro
ck
EG
A E
ag
le
Ro
ck
GB
A
Sa
pp
hir
e
We
sto
nia
Wy
alk
atc
hem
Ya
nd
an
oo
ka
Year of testing and trial sites 1999-2001
2006 1999-2001
1999-2003
2002-2004
2004-2005
2004, 2006
1999-2003
2001-2006
2005-2006
Herbicides/ha Timing ADEF CD ADEF ABCDEF DE E CE ABCDEF BCDEF CDE
Tigrex® 1.0 L (Diflufenican + MCPA) Z13-Z14 (7) () 16 (7) 30 (13) () () ()
18-41 (11)
() ()
Buctril® MA 1 L (Bromoxynil + MCPA) Z13-Z14 () – 9 (4) () – – – 12 (6) () –
Buctril® MA 1.4 L(Bromoxynil + MCPA) Z13-Z15 – () – () () () () () () 6 (3)
Affinity® 50 g + MCPA 0.5 L (Carfentrazone-ethyl + MCPA)
Z13-Z14 () () 9-15 (4) () () () () () 22 (11) 17 (3)
Eclipse® 5 g + MCPA LVE 0.5 L (Metosulam + MCPA)
Z13-Z14 – () – – () () () – () ()
Lontrel® 300 0.3 L (Clopyralid) Z13-Z14 – – – – () – – – () –
Diuron 0.375 L + MCPA 0.5 L (Diuron + MCPA)
Z13-Z14 () – 16 (7) () – – – () () –
Diuron 0.5 L + 2,4-D (amine) 0.25 L (Diuron + 2,4-D)
Z13-Z14 – – – () () – – () () –
Glean® 3 g + Ally® 3 g + MCPA 0.3 L (Chlorsulfuron + Metsulfuron + MCPA)
Z13-Z14 – – – () – – – () () –
MCPA (amine) 500 1.25 L (MCPA) Z15-Z16 – – – () 18 (3) – – () () –
MCPA (amine) 500 2 L (MCPA) Z15-Z16 – () – – () 18 (2) () – () ()
2,4-D Amine 500 1 L (2,4-D) Z15-Z16 (2) – () () () – – 11-35 (6) () –
2,4-D Amine 625 1.3 L (2,4-D) Z15-Z16 – () – – () 19 (2) () – () ()
2,4-D LV Ester 600 (2,4-D) Z15-Z16 – – – 39 (2) – – – 41 (2) – –
Kamba® 500 0.28 L (Dicamba) Z15-Z16 – – – () () – – 32 (2) 29 (3) –
The names in the parenthesis are the chemical names. A = Buntine, B = Esperance (Fleming gravely sand, pH-4.5 Cacl2), C = Katanning (Duplex sandy loam, pH-5.2), D = Merredin (Clay loam/loam, pH-5.1-5.3), E = Mullewa (Sandy loam/red loam, pH-4.6-6.4) and F = Newdegate (Duplex sand over clay, pH-4.1).

Agribusiness Crop Updates 2008
Crop Updates is a partnership between the Department of Agriculture and Food, Western Australia and the Grains Research & Development Corporation
45
A. Some comments regarding safe use of herbicides
When using trifluralin, Yield, Stomp and Avadex, ensure sown seed is placed below the herbicide treated soil band; otherwise severe root retardation may result. Surface crusting may exacerbate emergence problems. Old seed with reduced vigour, varieties with short coleoptiles, and seed dressings that reduce coleoptile length should be avoided. If sowing with knife points, and using higher label rates, avoid treated soil being thrown, blown or washed into the furrows.
Diuron 1.0 L + Dual (Metolachlor 720 g/L) 0.5 L/ha have been recorded to cause crop damage more often on lighter than on heavier soil types. If using knife point and press wheels, pre-plant application is recommended (0-7 days) as knife points leave open furrows/slots which can lead to crop damage if herbicide is washed into the furrows. If using a ‘Full Cut’ seeding system that leaves a relatively smooth surface, this mixture can be applied post plant pre-emergent within three to four days of planting.
Metribuzin 150 g ai/ha is registered as a pre-emergent herbicide for the wheat variety EGA Eagle Rock. To achieve good control of annual ryegrass and barley grass Treflan®480 at 1.0 L/ha can also be mixed with the recommended rated of metribuzin. Trial work has indicated that a two way mix of
metribuzin 150 g ai/ha (e.g. Lexone 200 g/ha) with Diuron® 1.0 L or Stomp® 330E 1.8 L, or three way mix with Diuron 1.0 L and Dual Gold 250 mL/ha, is safe on this variety. Any weed escapes after metribuzin use, especially brome grass, could possibly be controlled/suppressed, by application of Monza® @ 25 g/ha at 2-3 leaf or Atlantis® @ 330 mL/ha at 3-4 leaf stage of the crop. Do not use metribuzin (alone or in mixture with other herbicides) on other wheat varieties (e.g. Carnamah), as large yield reductions have been recorded in the trials. Moreover metribuzin is registered for use on EGA Eagle Rock and Blade only.
Where marginal zinc and copper deficiency conditions exist, Glean and Logran may exacerbate such deficiencies.
B. Safe timings for phenoxy herbicides’ application
MCPA, 2,4-D and dicamba are the main phenoxy herbicides used in wheat. Wheat tolerance to these herbicides depends on the stage of ear development. Wheat is most sensitive to these herbicides at the double ridge/floral initiation stage of ear development. Spraying advice is based on leaf and tiller development, but not all varieties have the same correlation between leaf/tiller and ear development. Thus different varieties become safe to spray at slightly different growth stages. Long season varieties take longer to reach the safe stage.
To use higher rates of MCPA amine (2.0 L/ha) and 2,4-D amine-625 (1.3 L/ha) in Wyalkatchem, Westonia, Amery, Tincurrin, Kulin apply these herbicides at Z15-Z16 (5-6 leaves on the main stem). For EGA Eagle Rock, Carnamah, Camm, Brookton, Karlgarin and Cranbrook apply at Z16-Z17 and in Calingiri and Spear apply at Z17-Z18. At these stages floral initiation will be completed in the above varieties.
In addition, if plants are under severe water stress, the internal development can also be delayed by about one leaf. Again, add one leaf to those leaf numbers mentioned above for the different varieties, to allow for this.
Do not apply these phenoxy herbicides between flag leaf emergence and the soft dough stage on any variety. Generally MCPA amine is safer than 2,4-D amine, especially on later developing varieties.
Dicamba (and mixtures with 2,4-D or MCPA) should be applied not later than Zadoks stage 30 (pseudo-stem elongation, but first node not yet above soil surface).
C. Waterlogging and crop safety
A number of products, including Group A and B herbicides, are tolerated by wheat because they are metabolised within the seedling. If a seedling’s growth is retarded by waterlogging, cold or any other factor, its metabolism is reduced, and toxic levels of herbicide can accumulate within the plant. There were many cases of such damage in 1999.

Agribusiness Crop Updates 2008
Crop Updates is a partnership between the Department of Agriculture and Food, Western Australia and the Grains Research & Development Corporation
46
There have also been many examples of trifluralin reducing emergence where the paddocks were waterlogged. It is suspected that this was due to increased uptake by the coleoptile from the wet soil. If there is any chance of extreme waterlogging just after seeding, crop damage is more likely. In areas where this is likely safer products, or post-emergent spraying, are recommended.
KEY WORDS
wheat, herbicide, tolerance, grain yield
ACKNOWLEDGMENTS
Thanks to GRDC for funding. Thanks also due to Steve Bell (Wongan Hills), Colin Boyd (Esperance), Steve Crook (Newdegate), Vince Lambert (Katanning), David Nicholson (Geraldton), Chris Roberts (Northam) and Leanne Young (Merredin) for their excellent technical assistance. Dr Terry Piper (Ex-Research Officer, DAFWA, Northam) also contributed in this research work up till 2003.
Project No.: DAW 0134
Paper reviewed by: Steve Penny

Agribusiness Crop Updates 2008
Crop Updates is a partnership between the Department of Agriculture and Food, Western Australia and the Grains Research & Development Corporation
47
Herbicide tolerance of new oat varieties
Harmohinder Dhammu1, Research Officer, Vince Lambert2 and Chris Roberts1, Technical Officers, Department of Agriculture and Food, Western Australia; 1Northam and 2Katanning
KEY MESSAGES
• The oat varieties Kojonup, Mitika and Wandering showed good tolerance to a range of commonly used herbicides/mixtures.
• Mitika showed sensitivity to Paragon and 2,4-D LV ester, Kojonup showed sensitivity to 2,4-D LV ester and Wandering showed sensitivity to dicamba.
• The new herbicide Preceptwas tolerated well by all the varieties.
• The unregistered herbicides in oats Triflur X, Stomp and Boxer Gold (lower rate) were tolerated well by all the named varieties.
Note: Always adhere to label recommendations. The Department of Agriculture and Food does not endorse the use of herbicides above the registered rate, off-label use of herbicides or off-label tank mixes. Crop tolerance and yield responses to herbicides are strongly influenced by seasonal conditions. Rates of unregistered herbicides or off label herbicides tested in this experiment have been purposely omitted.
AIM
To evaluate the herbicide tolerance of recently released and potential new oat varieties.
METHOD
A field trial was laid out in criss-cross design under weed free conditions at GSARI Katanning in which the four oat varieties Kojonup, Mitika, Wandering and Saia along with three potential new varieties WAOAT2231, WAOAT2227 and SV97001-13-4, were sown on 26 June 2007 on a loamy soil (CaCl2 measured pH 5.1) with three replications. Three main varieties Kojonup, Mitika and Wandering were sown 3 cm deep in 10 m wide parallel randomised strips at 75 kg/ha using a combine 753 with knife points and press wheels. The potential new varieties along with Saia oats (randomised) were sown adjacent to the named varieties in 1.44 m wide parallel strips also at 75 kg/ha using a cone seeder with knife points and press wheels. Agstar Extra at 90 kg/ha was applied with the seed.
A range of herbicide treatments (Table 1) were applied randomly in three meter wide strips across all the variety strips before crop seeding (26 June), at 2-3 leaf stage (26 July), 3-4 leaf stage (2 August), 5-6 leaf stage (22 August) and after crop anthesis (10 October). Every 11th plot was kept as an untreated control to assess the spatial variability. At the time of pre-emergent herbicide treatments application (26 June), gravimetric soil moisture content at 0-10 and 10-20 cm depth was 10 and 7%, respectively. To determine the effect of pre-emergent herbicide treatments (selected only) on plant density/plant tillers, the oat plant heads of the three main named varieties were counted from two randomly selected 25 cm x 25 cm quadrates per plot (8 November). The oat varieties were also assessed for visual injury in terms of leaf spotting, yellowing, height and biomass reduction at 2-4 weeks after each treatment application and again at heading stage using a 0 to 100% scale, where 0 = no visible injury and 100 = complete plant death (16 August, 26 September and 8 November). In
early September, manganese deficiency was observed across all the varieties, so Mantrac at 0.5 L/ha was applied on 6 September. A low density of wild radish was removed by hand weeding (5 and 6 September and 2 and 3 October). The plants of WAOAT2231, WAOAT2227, SV97001-13-4, Saia and Wandering (reference variety) were assessed for hay yield by cutting at the ground level from a 1.44 m X 1 m quadrat at soft to hard dough stage and oven drying at 60oC for 72 hrs. Three
varieties − Kojonup, Mitika and Wandering were taken to maturity and harvested on 11 December. The net plot size for Kojonup and Mitika was 10.4 m x 1.8 m, whereas for Wandering it was 7.9 m x 1.8 m.
Total rainfall from June to December at Katanning was 333.6 mm. The monthly distribution of the rainfall from June–October was quite uniform and highest rainfall during this period was in July (26%).

Agribusiness Crop Updates 2008
Crop Updates is a partnership between the Department of Agriculture and Food, Western Australia and the Grains Research & Development Corporation
48
As label rates of Dual Gold (either alone or in mixture with other herbicides) provide relatively poor weed control, higher than label rates of this products was evaluated to determine if label rates could be revised for more effective weed control in oats.
RESULTS AND DISCUSSION
The effect of registered herbicides during early crop growth, at heading stage and on grain yield (Table 1) and hay yield (Table 2) of oat varieties was as follows:
• Dual Gold either alone or in mixture with diuron at the rates tested was tolerated well by all the named and potential new varieties, and the results are consistent with the previous trial results.
• Jaguar, Tigrex, Paragon and Affinity + MCPA caused slight to moderate leaf spotting
across all the varieties. The intensity of symptoms was greater with Paragon (at Z13-Z14)
than other herbicides. The only Jaguar, Tigrex, Paragon or Affinity + MCPA treatment
and variety combination that resulted in significant grain and hay yield losses was Paragon
0.5 L/ha at Z15-Z16 which caused a significant reduction in Mitika grain yield. Paragon use is not registered in oats at earlier timing (Z13-Z14).
• Broadstrike and Gleancaused an estimated 20% biomass reduction in all the varieties during
early crop growth stages. Broadstrike also caused moderate yellowing across all the varieties. These negative effects decreased with advancement in crop growth and there was no significant grain and hay yield reduction in any of the oat varieties.
• 2, 4-D LV ester 0.8 L/ha caused a significant grain yield reduction in Kojonup and Mitika and
Kamba 0.4 L/ha had the same effect in Wandering. 2, 4-D ester (800) 0.7 L/ha and Kamba 0.5 L/ha at Z15-Z16 also caused significant grain yield reduction across all the varieties in 2006 experiments. Interestingly MCPA amine and 2,4-D LV ester resulted in an estimated 20% biomass/height reduction in Saia oats 4 weeks after their application, but this negative effect was not reflected in the hay yield of this variety.
• Precept is a new herbicide for broadleaf weed control in wheat, barley, oats, triticale and cereal rye. It is a mixture of pyrasulfotole (Group F) and MCPA LVE (Group I) and is similar to
Tigrex with a different sub group of Group F. All the oat varieties showed good tolerance to
Precept.
The effect of unregistered herbicides during early crop growth, at heading stage and on grain yield (Table 1) and hay yield (Table 2) of oat varieties was as follows:
• Triflur X and Stomp at the rates tested did not have any negative effect on growth and development, number of heads and grain yield of Kojonup, Mitika and Wandering. These results are consistent with 2006 trial results.
• Boxer Gold at the highest rate tested resulted in a significant reduction in Mitika grain yield which is inconsistent with 2006 trial results.
• Triflur X, Stomp and Dual Gold at the highest rates tested resulted in poor crop establishment/ biomass reduction (10-20% estimated on 16 August) of the potential new varieties and Saia oats. Kojonup, Mitika and Wandering were not affected in the same way. This could be due to slightly shallower seeding of potential new varieties (and Saia oats) with a cone seeder than the main named varieties with a combine. However, there was no significant negative effect on hay yield of the potential new varieties and Saia oats with these treatments. Good crop growing conditions at Katanning last year might have supported some compensatory growth (e.g. more tillers) in these treatments to produce hay yield similar to untreated control plots.
• Logran and Eclipse applied at Z69 (anthesis completed) were found safe on all the oat varieties, but these herbicides are not registered for such a late application in cereals/oats.
KEY WORDS
oats, herbicide, tolerance, grain yield, hay yield
ACKNOWLEDGMENTS
We gratefully acknowledge GRDC for funding this project. Thanks to Russel Quartermaine, Technical Officer, GSARI, Katanning for his technical assistance.
Project No.: DAW 0134
Paper reviewed by: Dr Ken Flower and Dr Raj Malik

Agribusiness Crop Updates 2008
Crop Updates is a partnership between the Department of Agriculture and Food, Western Australia and the Grains Research & Development Corporation
49
Table 1. Effect of herbicides on grain yield (% of untreated control) of oat varieties at Katanning during 2007 (07NO28)
No. Herbicides (rate/ha) Timing Kojonup Mitika Wandering
0 Untreated Control >>>Yield (t/ha)
100 (4.0)
100 (4.1)
100 (4.3)
1 *Triflur x Lower rate Before 102 103 97
2 *Triflur x Higher rate seeding 101 98 99
3 *Stomp 330 Lower rate " 106 104 115
4 *Stomp 330 Higher rate " 97 102 99
5 †Dual Gold Lower rate " 102 103 99
6 †Dual Gold Higher rate " 101 110 106
7 †Diuron " 107 99 100
8 †Diuron + Dual Gold " 91 95 100
9 *Boxer Gold Lower rate " 105 100 104
10 *BoxerGold Higher rate " 96 91 96
11 Glean 20 g + BS1000 0.1% Z12-Z13 98 97 95
12 Jaguar 1 L " 105 98 100
13 Tigrex 1 L Z13-Z14 108 101 100
14 Paragon " 103 107 102
15 Precept 1 L + Hasten 1% " 97 110 104
16 Buctril MA 1.4 L " 91 96 93
17 Diuron 0.5 L + MCPA (amine) 500 0.5 L " 98 95 97
18 Eclipse 5 g + MCPA LVE 500 0.5 L " 96 110 107
19 Affinity 50 g + MCPA amine 500 0.5 L " 99 94 96
20 Broadstrike 25 g + Uptake oil 0.5% " 100 105 100
21 Paragon 0.5 L Z15-Z16 93 89 92
22 MCPA amine 500 2 L " 90 102 102
23 2 4-D (amine) 625 1.3 L " 94 103 102
24 2 4-D LV ester (xtra) 0.8 L " 83 91 94
25 Kamba 500 (dicamba) 0.4 L " 95 98 91
26 Logran + Uptake oil Z69 + (After 108 104 109
27 Eclipse + Uptake oil anthesis) 95 92 95
lsd (0.05) Herbicides v/s untreated control 12 9 9
lsd (0.05) Herbicides v/s Herbicides 15 12 12
CV (%) 11 9 9
Treatment 18 applied with Uptake oil 0.5%.
* Not registered for use in oats in WA, consequently the application rates of these herbicides have been purposely omitted.
† Applied at higher than the label rates, consequently the application rates of these herbicides have been purposely omitted.
Not registered for use in oats in WA at this crop growth stage.
Figures in bold are significantly lower yielding than the untreated control.

Agribusiness Crop Updates 2008
Crop Updates is a partnership between the Department of Agriculture and Food, Western Australia and the Grains Research & Development Corporation
50
Table 2. Effect of herbicides on hay yield (% of untreated control) of oat varieties at Katanning during 2007 (07NO28)
No. Herbicides (rate/ha) Wandering Saia SV97001
-13-4 WAOAT
2227 WAOAT
2231
0 Untreated Control >>>Dry weight (t/ha)
100 (11.6)
100 (10.3)
100 (11.9)
100 (9.7)
100 (10.9)
1 *Triflur X Lower rate 91 103 104 109 94
2 *Triflur X Higher rate 92 104 104 107 97
3 *Stomp 330 Lower rate 105 109 101 115 100
4 *Stomp 330 Higher rate 89 97 91 97 107
5 †Dual Gold Lower rate 90 94 103 112 105
6 †Dual Gold Higher rate 94 93 114 106 107
7 †Diuron 102 102 106 119 99
8 †Diuron + Dual Gold 108 109 107 125 115
9 *Boxer Gold Lower rate 93 112 101 103 103
10 *BoxerGold Higher rate 91 99 108 113 106
11 Glean 20 g + BS1000 0.1% 94 112 105 104 107
12 Jaguar L 102 113 112 102 116
13 Tigrex L 106 108 111 129 114
14 Paragon 112 105 101 100 100
15 Precept 1 L + Hasten 1% 100 113 103 111 111
16 Buctril MA 1.4 L 97 101 105 109 103
17 Diuron 0.5 L + MCPA (amine) 500 0.5 L 93 116 92 120 105
18 Eclipse g + MCPA LVE 500 0.5 L 93 108 108 108 113
19 Affinity 50 g + MCPA amine 500 0.5 L 86 105 109 106 104
20 Broadstrike 25 g + Uptake oil 0.5% 101 98 96 115 102
21 Paragon L 87 101 91 116 104
22 MCPA amine 500 2 L 98 105 102 111 104
23 2,4-D (amine) 625 1.3 L 90 110 92 122 104
24 2,4-D LV ester (xtra) 0.8 L 98 112 101 126 107
25 Kamba 500 (dicamba) 0.4 L 100 99 106 118 114
26 Logran + Uptake oil 113 111 107 116 114
27 Eclipse + Uptake oil 117 93 90 105 96
lsd (0.05) Herbicides v/s untreated control 15 13 13 14 13
lsd (0.05) Herbicides v/s Herbicides 19 16 16 18 16
CV (%) 14 11 12 12 12
Treatments 1-13 applied before seeding, 14-15 at Z12-Z13, 16-23 at Z13-Z14, 24-28 at Z15-Z16 and 29-30 at
Z69+ (after crop anthesis). Treatment 18 applied with Uptake oil 0.5%.
* Not registered for use in oats in WA, consequently the application rates of these herbicides have been purposely omitted.
† Applied at higher than the label rates, consequently the application rates of these herbicides have been purposely omitted.
Not registered for use in oats in WA at this crop growth stage.
Figures in bold are significantly lower yielding than the untreated control.

Agribusiness Crop Updates 2008
Crop Updates is a partnership between the Department of Agriculture and Food, Western Australia and the Grains Research & Development Corporation
51
Managing nitrogen inputs in malting barley
Andrea Hills1 and Blakely Paynter2, Department of Agriculture and Food, Western Australia; 1Esperance and 2Northam
Contact: Andrea Hills, DAFWA, Esperance; Ph: (08) 9083 1144 or [email protected]
KEY MESSAGES
• Site and nitrogen rate are the primary determinants of grain protein levels in barley; the impact of variety and split applications are secondary.
• Splitting nitrogen applications offers growers the capacity to tailor nitrogen inputs to the crop growth and seasonal forecast.
• Nitrogen application generally decreases average grain weight in barley and this can result in increased screenings.
• Differences in the variety response to applied nitrogen is related to their grain shape. Screenings in narrow grain varieties such as Gairdner and Baudin are more sensitive to applied nitrogen than varieties like Stirling and Vlamingh which have a plumper grain shape.
• As screenings of Baudin are more sensitive to increasing rates of nitrogen than Vlamingh, there is a greater risk of exceeding screening levels in Baudin with high rates of nitrogen or poor spring finishes.
• The impact on screenings is the greatest negative factor in a grower applying the right amount of nitrogen to meet target yield potential and produce a 10 to 11% protein crop. The malting market will however not accept barley with a grain protein below 9.5% and growers are urged to match fertiliser nitrogen supply to yield potential, paddock and soil type supply and variety being grown.
AIMS
Over the last five seasons the receival standards for barley grain protein have tightened reflecting international market signals. The most obvious change has been the introduction of a minimum protein level for delivery as malting barley and the progressive increase in the minimum protein level. Malting barley with grain protein below 9.5% is no longer segregated into malt barley stacks and no longer receives the malting premium.
Significant tonnages of Baudin and Gairdner are delivered each year with grain protein levels below 9.5% and as such this grain is downgraded to feed. Growers and their consultants regularly ask us what is the most efficient way to achieve grain protein levels of 10 to 11% in malting barley to meet market specifications? Do late applications increase protein levels significantly more than the same rate applied earlier in the season? How late can applications of nitrogen be made without significantly increasing the risk of exceeding screening limits?
In an attempt to address these questions this paper compared the performance of Baudin and the newest malting variety Vlamingh to different rates and timings of nitrogen application. Baudin and Vlamingh differ in their growth habit (semi-dwarf versus tall) and grain plumpness but are of similar maturity and grain yield.
METHOD
Small plot research trials were conducted over three years (2005 to 2007) at a number of different medium to high rainfall locations around Western Australia (Table 1). Sowing dates and rainfall received between May to October for each site is listed in Table 2. Trials were sown with a small plot air-seeder sowing seed over 6 to 8 rows on 25 to 18 cm row spacing. Seed was treated with triadimenol as Zorro® at 400 mL/100 kg seed and sown to establish 150 plants/m2. Plant establishment counts were taken at four weeks after seeding. Nitrogen, as urea, was topdressed onto plots by hand and Table 1 list the rates of nitrogen (as urea) used and the timing of its application. Plots were harvested with a small plot harvester, weighed and sub-sampled. The grain sub-samples were cleaned over a 1.5 mm sieve and measured for average grain weight, hectolitre weight, screenings, grain brightness and grain protein.

Agribusiness Crop Updates 2008
Crop Updates is a partnership between the Department of Agriculture and Food, Western Australia and the Grains Research & Development Corporation
52
Table 1. Nitrogen rates and application times for trials from 2005 to 2007 (WAS is weeks after sowing, Z31 is stem elongation, Z39 is flag leaf emergence)
Year Site N rate Application times (Method)
2005
Brookton
Gairdner River
Gibson
Katanning
Meckering
Ravensthorpe
Scaddan
Wagin
30, 100 Tillering (4 to 6WAS)
2006
Calingiri
Morbinning
30, 50, 90 0WAS, 6WAS, Z31, 6WAS + Z31, 6WAS + Z39,
Z31 + Z39
90, 110 0WAS, Z39
Katanning 20, 40, 60, 80 0WAS, 6WAS, Z31, 6WAS + Z31, 6WAS + Z39,
Z31 + Z39
60, 80 0WAS, Z39
Gibson
Scaddan
Jerramungup
30, 90 0WAS, 6WAS, Z31, 6WAS + Z31, 6WAS + Z39,
Z31 + Z39
2007
Jacup
Gibson
Wittenoom Hills
0, 20, 60, 100 0WAS, 4WAS, Z31, Z39, 4WAS + Z31, 4WAS + Z39,
Z31 + Z39
Calingiri
Mt Kokeby 0, 20, 60, 100
0WAS, 6WAS, Z31, 6WAS + Z31, 6WAS + Z39, Z31 + Z39
Table 2. Growing season rainfall and date of sowing for barley trial sites in 2005 to 2007
Year Site Date sown May-Oct. rainfall (mm)
2005 Brookton 18 May 383
Gairdner 25 May -
Gibson 19 May 453
Katanning 30 May 383
Meckering 11 May 282
Ravensthorpe 1 June 219
Scaddan 30 May 278
Wagin 13 June 337
2006 Calingiri 24 May 202
Katanning 31 May 188
Morbinning 30 June 186
Gibson 15 May 239
Scaddan 16 May 178
Jerramungup 26 May 133
2007 Wittenoom Hills 16 May 224
Gibson 11 May 300
Jacup 30 May 212
Calingiri 30 May 205
Mt Kokeby 29 May 244

Agribusiness Crop Updates 2008
Crop Updates is a partnership between the Department of Agriculture and Food, Western Australia and the Grains Research & Development Corporation
53
RESULTS
Nitrogen effects on screenings (% < 2.5 mm)
Tables 3, 4 and Figure 1 show how screenings increase with increasing rates of nitrogen applied early in the season (at sowing or six weeks after sowing). These increases in screenings are associated with a decrease in average grain weight (data not shown). In 2005 (Table 2), the spring rainfall was good and overall screening levels were low. In 2006 and 2007 the season was drier (Table 2) and the difference between sites and varieties is greater, with Vlamingh having significantly lower screenings than Baudin at each rate of nitrogen application (with the exception of Wittenoom Hills in 2007 where both varieties were very high in screenings). There is a consistent upwards trend with increasing rates of nitrogen. Screenings in Baudin generally increase at a greater rate than those of Vlamingh.
Table 3. Screenings (% < 2.5 mm) of Baudin and Vlamingh barley at two nitrogen rates (kg N/ha applied at 6 WAS) at eight sites in 2005
Variety Baudin Vlamingh
N rate 30 100 30 100
Brookton 1 4 1 1
Gairdner 1 4 1 1
Gibson 6 12 7 9
Katanning 3 5 3 3
Meckering 4 11 4 8
Ravensthorpe 2 3 1 1
Scaddan 3 4 2 2
Wagin 11 18 10 15
ANOVA Significance LSD (0.05)
Site p < 0.001 2
Variety p < 0.001 0
N rate p < 0.001 0
Site x N rate p < 0.001 2
Variety x N rate p = 0.024 1
Table 4. Screenings (% < 2.5 mm) from four rates of nitrogen (kg N/ha) applied to Baudin and Vlamingh barley six weeks after sowing for three sites in 2006
Site Variety and N rate 0 20 40
Calingiri Baudin 15 19 23
Katanning 28 35 33
Morbinning 40 50 61
Calingiri Vlamingh 6 9 8
Katanning 13 11 22
Morbinning 10 16 24
ANOVA Significance LSD (0.05)
Site p < 0.001 6
Variety p < 0.001 1
N rate p < 0.001 2
Site x N rate p < 0.001 7
Variety x N rate p < 0.001 3

Agribusiness Crop Updates 2008
Crop Updates is a partnership between the Department of Agriculture and Food, Western Australia and the Grains Research & Development Corporation
54
0
10
20
30
40
50
60
0
20
60
100 0
20
60
100 0
20
60
100 0
20
60
100 0
20
60
100
Brookton Calingiri Gibson Jacup Witt Hills
Baudin Vlamingh
% S
cre
en
ing
s <
2.5
mm
Figure 1. Screenings (% < 2.5 mm) from four rates of nitrogen applied at sowing (0, 20, 60 100 kg N/ha)
to Baudin and Vlamingh barley at five sites in 2007.
The effect of timing of nitrogen applications on screenings is variable across sites and years (Table 5). At Gibson for example in 2006, split applications at stem elongation (4WAS + Z31 and 6WAS + Z31) produced significantly lower levels of screenings (although the absolute level is above market specifications of 30% for that year) while at Scaddan there was a similar trend with the 6WAS + Z31 treatment producing similar levels as applications made at sowing or 4WAS (Table 4).
Table 5. Screenings (% < 2.5 mm) from split applications of nitrogen (90 kg N) made at sowing, four weeks after sowing (4WAS), six weeks after sowing (6WAS) and in combinations out to stem elongation (Z31) in 2006
Site Gibson Scaddan
N method Baudin Vlamingh Baudin Vlamingh
0WAS 70 55 29 10
4WAS 72 56 28 14
6WAS 74 45 34 13
4 + 6WAS 76 58 36 16
4WAS + Z31 65 39 34 10
6WAS + Z31 65 45 27 12
ANOVA Significance LSD (0.05)
Site p = 0.004 17
Variety p = 0.007 11
Method p < 0.001 4
Site x Method p = 0.004 17
Nitrogen applied at flag leaf emergence (Table 6) did not increase screenings relative to nitrogen applied at sowing. Applications at this late stage are subject to influence by soil moisture conditions as a dry spring results in nitrogen being unavailable to the crop. However, at least two of the sites in Table 5 (Calingiri and Katanning) received sufficient spring rain that would have made the late applied nitrogen available to plants, so the comparisons remain valid. In 2007 it is questionable whether nitrogen was available to plants at flag leaf emergence (Figure 2). Many of the applications including a flag timing were lower than that stem elongation alone, suggesting that either the nitrogen was not available to be used, or that the nitrogen actually lowered screenings to similar or better than screenings for nitrogen up front, which would be unexpected. In all of these trials, the rate of nitrogen applied has more impact on screenings than the method or timing of its application.

Agribusiness Crop Updates 2008
Crop Updates is a partnership between the Department of Agriculture and Food, Western Australia and the Grains Research & Development Corporation
55
Table 6. Screenings (% < 2.5 mm) from nitrogen applications at flag leaf emergence (Z39) versus nitrogen applied at sowing (0WAS) for the barley varieties Baudin and Vlamingh at three sites in 2006
Variety Baudin Vlamingh
N method 0WAS 0WAS + Z39 0WAS 0WAS + Z39
Calingiri 25 26 9 9
Katanning 43 31 12 14
Morbinning 65 76 30 30
ANOVA Significance LSD(0.05)
Site p < 0.001 7
Variety p < 0.001 2
Method ns -
Site x Method p = 0.002 8
Variety x Method ns -
0
10
20
30
40
50
60
20 60 100 20 60 100 20 60 100 20 60 100
Baudin Vlamingh Baudin Vlamingh
Brookton Calingiri
0WAS 6WAS 6WAS+Z31 6WAS+Z39 Z31 Z31+Z39
% s
cre
en
ing
s <
2.5
mm
5%lsd (N method) = 3%
Figure 2. Screenings (% < 2.5 mm) from split nitrogen applications at two sites in 2007. Application
times were 0WAS, 6WAS, 6WAS + Z31, 6WAS + Z39, Z31, Z31 + Z39. LSD (0.05) for Method = 3%.
Figure 3 clearly shows the difference between Baudin and Vlamingh for screenings using a number of application methods out to flag leaf emergence. Statistically, the timing of nitrogen applications was just outside significance (F pr. = 0.053) and the results show that splitting nitrogen applications out to stem elongation and flag leaf emergence did not increase screenings.

Agribusiness Crop Updates 2008
Crop Updates is a partnership between the Department of Agriculture and Food, Western Australia and the Grains Research & Development Corporation
56
0
10
20
30
40
50
60
70
80
50 90 50 90 40 60
Morbinning Calingiri Katanning
% S
cre
en
ing
s <
2.5
mm
Figure 3. Screenings (% < 2.5 mm) at three sites in 2006 for Baudin (first five black columns) and
Vlamingh (second five white columns) when two rates of nitrogen (50 and 90 or 40 and 60) are added in combinations of; 6WAS, 6WAS + Z31, 6WAS + Z39, Z31, Z31 + Z39. LSD (0.05) for variety = 1.5%, N rate = 2.6%, Method = 2.4%, Site x Variety = 0.1% and Variety x N rate = 4.1%.
Nitrogen effects on grain protein (%) and grain yield (t/ha)
The trials done during 2005 to 2007 have shown that there is little effect of variety on protein (Tables 7, 8, 9,10 and 11). Grain yield response to nitrogen is highly site dependent (Tables 7 and 8). Predicting where a site is on the response curve may be difficult, as demonstrated by the sites at Katanning and Meckering in 2005 (Table 7) where both increased in grain yield by 0.6 t/ha with the higher rate of nitrogen, but protein levels at Katanning increased by only 0.2% while the increase at Meckering was 0.6%. Knowing the potential yield of a site is an important component of determining a site’s response.
Site and nitrogen rate are the primary determinants of grain protein. Nitrogen application as late as flag leaf emergence (Tables 10 and 11) does not consistently increase grain protein, although the general trend is present. At Gibson and Scaddan in 2006 (Table 9), applying 90 kg N/ha at four weeks after sowing was effective in increasing grain protein relative to applying at sowing. However, at Scaddan applications at six weeks and the split four and six weeks after sowing, also significantly increased protein levels. Applying nitrogen late in the season did not statistically increase yield in 2006 (Table 10) but did in 2007 (Table 11).
Table 7. Grain yield (t/ha) and grain protein (%) of Baudin and Vlamingh barley at two nitrogen rates (kg N/ha applied at 6 WAS) at eight sites in 2005
Grain yield (t/ha) Grain protein (%, db)
Variety Baudin Vlamingh Baudin Vlamingh
N rate 30 100 30 100 30 100 30 100
Brookton 4.4 5 4.4 5.1 9.8 10.4 9.4 10.9
Gairdner 3.6 4.4 3.4 4.2 9.6 10.1 9.3 10.0
Gibson 4.2 4.6 4.1 4.4 12.2 12.6 12.5 13.5
Katanning 2.9 3.5 2.5 2.9 10.3 10.5 9.9 10.6
Meckering 2.6 3.2 2.3 3.1 9.8 10.4 9.4 10.3
Ravensthorpe 3.2 3.4 3.2 3.5 10.4 12.7 10.5 13.1
Scaddan 4.1 4.1 4.0 4.2 10.2 11.4 10.8 12.0
Wagin 2.6 2.5 2.1 2.0 10.5 12.3 11.7 13.5
ANOVA Significance LSD (0.05) Significance LSD (0.05)
Site p < 0.001 0.40 p < 0.001 0.4
Variety p < 0.001 0.05 p < 0.001 0.1
N rate p < 0.001 0.05 p < 0.001 0.1
Site x N rate p < 0.001 0.40 p < 0.001 0.3
Variety x N rate p < 0.001 0.10 p < 0.001 0.1

Agribusiness Crop Updates 2008
Crop Updates is a partnership between the Department of Agriculture and Food, Western Australia and the Grains Research & Development Corporation
57
Table 8. Grain protein (%) and grain yield (t/ha) from four nitrogen rates applied to Baudin and Vlamingh barley at six weeks after sowing for three sites in 2006
Site N rate Grain yield (t/ha) Grain protein (%, db)
0 20 40 60 0 20 40 60
Calingiri Baudin 2.94 3.20 3.27 3.22 10.2 10.6 11.2 11.7
Katanning 2.29 2.21 2.16 2.01 12.4 13.3 14.0 14.7
Morbinning 2.69 2.83 2.76 2.64 10.5 10.8 12.2 13.2
Calingiri Vlamingh 3.22 3.33 3.49 3.69 10.3 11.0 11.2 11.3
Katanning 2.30 2.33 2.17 2.09 12.5 13.5 14.4 15.2
Morbinning 2.99 3.19 3.12 3.04 9.9 11.1 12.1 13.4
ANOVA Significance LSD (0.05) Significance LSD (0.05)
Site p < 0.001 0.26 p < 0.001 0.5
Variety p < 0.001 0.04 ns -
N rate p = 0.003 0.06 p < 0.001 0.2
Site x N rate p < 0.001 0.26 p < 0.001 0.5
Variety x N rate ns - ns -
Table 9. Grain protein levels (%) and grain yield (t/ha) from split applications of nitrogen (90 kg N) for two sites in 2006 applied in various combinations at sowing (0WAS), four weeks after sowing (4WAS), six weeks after sowing (6WAS), and stem elongation (Z31)
Grain yield (t/ha) Grain protein (%, db)
N method Gibson Scaddan Gibson Scaddan
0WAS 2.37 3.24 12.9 12.8
4WAS 2.29 3.15 13.6 13.8
6WAS 2.64 3.23 12.8 13.7
4 + 6WAS 2.32 3.11 12.6 13.7
4WAS + Z31 2.70 3.14 13.3 12.9
6WAS + Z31 2.65 3.25 12.7 12.8
ANOVA Significance LSD (0.05) Significance LSD (0.05)
Site p = 0.02 0.51 p = 0.008 0.3
Variety ns - ns -
Method p < 0.001 0.12 p < 0.001 0.4
Site x Method p = 0.003 0.50 p = 0.005 0.6
Variety x Method ns - ns -
In 2007, most nitrogen applications made six weeks or more after sowing had significantly higher protein levels than applying all nitrogen upfront at sowing (Table 11). Grain yield peaked at Mt Kokeby at 100 kg N/ha applied six weeks after sowing or split between six weeks and stem elongation while the optimum at Calingiri was 60 kg N/ha with no effect of application time.

Agribusiness Crop Updates 2008
Crop Updates is a partnership between the Department of Agriculture and Food, Western Australia and the Grains Research & Development Corporation
58
Table 10. Grain protein (%) and grain yield (t/ha) from nitrogen applications at flag leaf emergence (Z39) versus nitrogen applied at sowing (0WAS) for the barley varieties Baudin and Vlamingh at three sites in 2006
Grain yield (t/ha) Grain protein (%, db)
Variety Baudin Vlamingh Baudin Vlamingh
N method 0WAS 0WAS + Z39 0WAS 0WAS + Z39 0WAS 0WAS + Z39 0WAS 0WAS + Z39
Calingiri 3.10 3.35 3.48 3.61 11.7 11.7 11.5 12.1
Katanning 2.12 2.28 2.31 2.39 14.1 13.9 13.9 14.2
Morbinning 2.86 2.55 3.23 3.12 12.5 14.6 12.7 13.3
ANOVA Significance LSD (0.05) Significance LSD (0.05)
Site p < 0.001 0.36 p = 0.003 0.9
Variety p < 0.001 0.10 ns -
Method ns - p = 0.008 0.4
Site x Method p = 0.009 0.37 p = 0.033 1.0
Variety x Method ns - ns -
Table 11. Grain protein (%) and yield (t/ha) from three nitrogen rates and six application times at two sites in 2007. Application times were 6 weeks after sowing (6WAS), 6WAS + stem elongation (Z31), 6WAS + flag leaf emergence (Z39), Z31, Z31 + Z39
Grain yield (t/ha)
Mt Kokeby Calingiri
20 60 100 20 60 100
0WAS 2.85 3.46 3.89 2.68 2.94 2.97
6WAS 2.98 3.56 4.10 2.73 2.97 2.94
6WAS + Z31 2.95 3.71 4.06 2.61 2.93 2.96
6WAS + Z39 2.84 3.53 3.81 2.66 2.90 2.99
Z31 2.98 3.56 3.85 2.60 2.96 2.95
Z31 + Z39 2.77 3.42 3.81 2.50 2.89 2.90
ANOVA Significance LSD (0.05)
Site p = 0.007 0.33
Variety p < 0.001 0.04
Method p < 0.001 0.07
N rate p < 0.001 0.05
Site x Variety p = 0.01 0.33
Grain protein (%, db)
Mt Kokeby Calingiri
20 60 100 20 60 100
0WAS 9.3 9.6 10.8 8.8 10.1 11.8
6WAS 9.9 9.8 10.2 9.1 10.9 12.9
6WAS + Z31 9.8 10.7 11.3 9.4 11.0 12.5
6WAS + Z39 9.6 10 10.3 9.1 11.3 12.8
Z31 9.8 9.7 10.6 9.3 10.7 12.9
Z31 + Z39 9.8 10.6 10.5 9.6 11.8 12.7
ANOVA Significance LSD (0.05)
Site p = 0.011 0.5
Variety p = 0.08 0.2
Method p = 0.004 0.4
N rate p < 0.001 0.3
Site x Variety ns -

Agribusiness Crop Updates 2008
Crop Updates is a partnership between the Department of Agriculture and Food, Western Australia and the Grains Research & Development Corporation
59
CONCLUSION
This paper compared the response of Baudin and Vlamingh to applied nitrogen as a single application or multiple applications and compliments earlier published work by Paynter (2005) comparing Baudin and Gairdner.
Across both studies results shown that rate of nitrogen is more important than application timing in achieving grain protein between 10 to 11%. It is critical to match yield potential with the level of nitrogen required to achieve that yield potential. There are a number of decision support tools such as ‘Select Your Nitrogen’ developed by the Department of Agriculture and Food, Yield Prophet and others, that can assist in the determination of nitrogen requirements for a given rotation, soil type and expected grain yield.
While the rate applied is more important than application timing, timing is still an important component of getting the rate right. Our research shows that farmers can split nitrogen applications and sow with a starter amount of nitrogen and then delay the second application out to stem elongation or beyond. The advantage of this is a better assessment of the yield potential of each crop as its growth reflects seasonal challenges such as disease pressure, growing conditions and the ability to take seasonal forecasts for spring rainfall into account.
Generally late applications don’t increase protein levels significantly more than the same rate applied earlier, however increases in grain protein can result in higher screenings. Increases in screenings are also possible. The conditions that lead to protein increases along with increased screenings are not fully understood.
REFERENCES
Paynter, B.H. (2005). Low protein management in Gairdner and Baudin barley. In ‘Proceedings of the 12th Australian Barley Technical Symposium’) (Hobart, Tasmania).
KEY WORDS
grain protein, screenings, nitrogen, timing
ACKNOWLEDGMENTS
The work covered in this paper is funded by the Department of Agriculture and Food, Western Australia (DAFWA) with support from the GRDC. We would like to acknowledge the work of Sue Cartledge, Owen Coppen, Chris Mathews, Colin Boyd, Stewart Smith and Steven Crook in sowing, managing, harvesting and assessing trials.
Project No.: DAW00148
Paper reviewed by: Kevin Young, AGT
Agribusiness Crop Updates 2008
Crop Updates is a partnership between the Department of Agriculture and Food, Western Australia and the Grains Research & Development Corporation
60
Decision tools for optimal N on cereal crops
David and Sally Cox, Jeremy Lemon* and Andrea Hills* *Department of Agriculture and Food, Western Australia, Esperance
KEY MESSAGES
A new nitrogen decision support system has been developed by a farmer using NDVI scanning technology, together with 'nitrogen rich strips‘, to sense current crop N status and estimate optimum crop N requirement.
AIMS
The malting barley industry needs to consistently produce parcels of malting barley with a grain protein level between 10-11% to meet international market demand for high quality barley. While the simple answer to the problem of low grain protein is to apply generous rates of fertiliser nitrogen as necessary, nitrogen fertilisers are a significant input cost that many farmers in the medium to high rainfall zones of Western Australia seek to optimise.
Decision support tools that optimise nitrogen input give growers greater confidence in determining what rates of nitrogen to apply to crops of malting barley without foregoing yield or protein (too little N) or net profit (too much N).
Optimising nitrogen applications also improves the environmental impact of the farming system since the risk of soil nitrogen levels surplus to the crop’s requirement is lower, reducing the amount of unused nitrogen that could otherwise leach into ground water or drainage lines.
However, decision support tools need to be sufficiently robust to work over the large range of environmental conditions and soil types present in the Western Australian agricultural region. This trial compared three different decision support tools to optimise malting barley nitrogen applications; Select Your Nitrogen (SYN) in conjunction with PYCAL, Yield Prophet and the In-season Nitrogen Calculator, developed locally.
Timing of nitrogen applications on barley crops was also compared. The advantage of delaying nitrogen applications until later in the season is that growers have a longer period to assess crop yield potential. Given the prolific tillering of Baudin, there is also less chance of excessive screenings if most of the required N is applied after tiller formation.
METHOD
The In-season Nitrogen Calculator – a new decision tool
David Cox has developed an equation to calculate optimum nitrogen rates for cereals. This has been developed and tested, primarily in wheat crops, over the past few years in the high and medium rainfall zones of the south east.
The In-season Nitrogen Calculator uses normalised differential vegetative index (NDVI) readings taken no later than 60 days after sowing (before full canopy closure), comparing the growth in a nitrogen non limited ’N rich strip‘ in the paddock to the rest of the crop which has only received a starter amount of nitrogen (e.g. 20 kg N/ha). The N rich strips that are used, although narrow (1 m wide) and never greater than one per cent of paddock area, must be representative of each management zone or paddock. NDVI readings were taken using a Greenseeker® NIR crop sensing device at 44 days after sowing.
Applying this to a malt barley crop is a new step and requires a slightly different approach than that for wheat. The In-season Nitrogen Calculator uses the maximum historic paddock yield to scale the expected yield response to additional N rather than potential yield inferred from sensing.
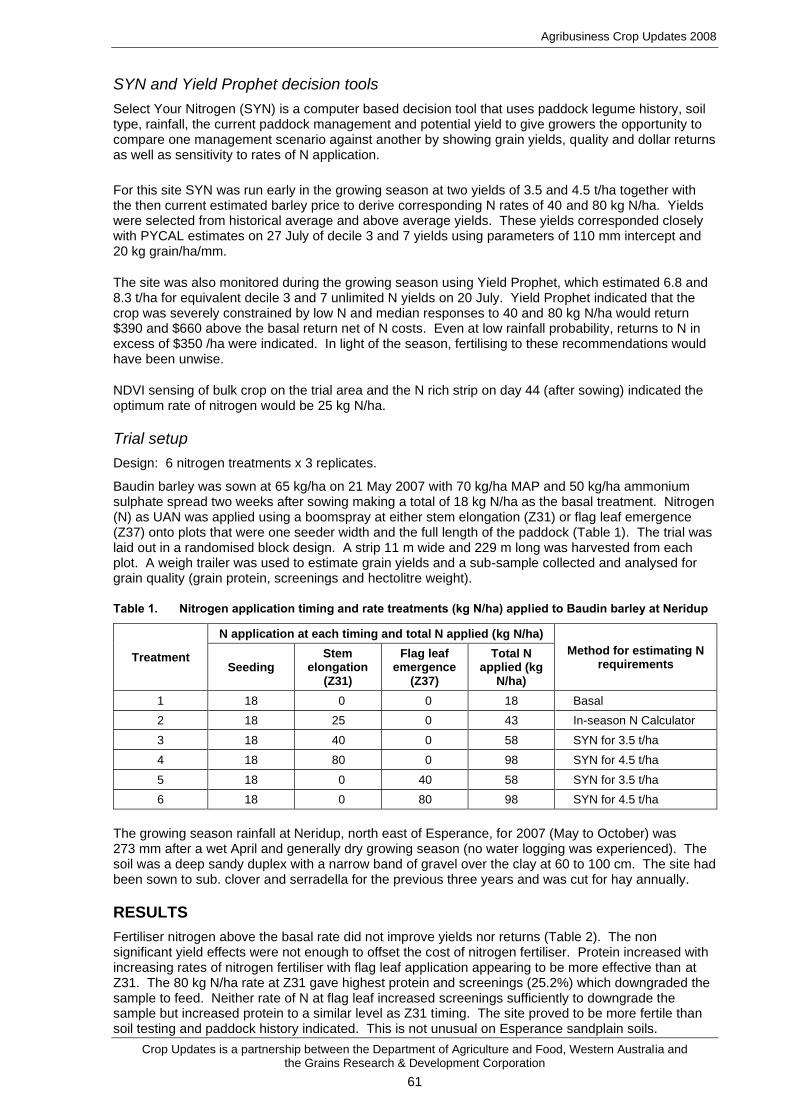
Agribusiness Crop Updates 2008
Crop Updates is a partnership between the Department of Agriculture and Food, Western Australia and the Grains Research & Development Corporation
61
SYN and Yield Prophet decision tools
Select Your Nitrogen (SYN) is a computer based decision tool that uses paddock legume history, soil type, rainfall, the current paddock management and potential yield to give growers the opportunity to compare one management scenario against another by showing grain yields, quality and dollar returns as well as sensitivity to rates of N application.
For this site SYN was run early in the growing season at two yields of 3.5 and 4.5 t/ha together with the then current estimated barley price to derive corresponding N rates of 40 and 80 kg N/ha. Yields were selected from historical average and above average yields. These yields corresponded closely with PYCAL estimates on 27 July of decile 3 and 7 yields using parameters of 110 mm intercept and 20 kg grain/ha/mm.
The site was also monitored during the growing season using Yield Prophet, which estimated 6.8 and 8.3 t/ha for equivalent decile 3 and 7 unlimited N yields on 20 July. Yield Prophet indicated that the crop was severely constrained by low N and median responses to 40 and 80 kg N/ha would return $390 and $660 above the basal return net of N costs. Even at low rainfall probability, returns to N in excess of $350 /ha were indicated. In light of the season, fertilising to these recommendations would have been unwise.
NDVI sensing of bulk crop on the trial area and the N rich strip on day 44 (after sowing) indicated the optimum rate of nitrogen would be 25 kg N/ha.
Trial setup
Design: 6 nitrogen treatments x 3 replicates.
Baudin barley was sown at 65 kg/ha on 21 May 2007 with 70 kg/ha MAP and 50 kg/ha ammonium sulphate spread two weeks after sowing making a total of 18 kg N/ha as the basal treatment. Nitrogen (N) as UAN was applied using a boomspray at either stem elongation (Z31) or flag leaf emergence (Z37) onto plots that were one seeder width and the full length of the paddock (Table 1). The trial was laid out in a randomised block design. A strip 11 m wide and 229 m long was harvested from each plot. A weigh trailer was used to estimate grain yields and a sub-sample collected and analysed for grain quality (grain protein, screenings and hectolitre weight).
Table 1. Nitrogen application timing and rate treatments (kg N/ha) applied to Baudin barley at Neridup
Treatment
N application at each timing and total N applied (kg N/ha)
Method for estimating N requirements Seeding
Stem elongation
(Z31)
Flag leaf emergence
(Z37)
Total N applied (kg
N/ha)
1 18 0 0 18 Basal
2 18 25 0 43 In-season N Calculator
3 18 40 0 58 SYN for 3.5 t/ha
4 18 80 0 98 SYN for 4.5 t/ha
5 18 0 40 58 SYN for 3.5 t/ha
6 18 0 80 98 SYN for 4.5 t/ha
The growing season rainfall at Neridup, north east of Esperance, for 2007 (May to October) was 273 mm after a wet April and generally dry growing season (no water logging was experienced). The soil was a deep sandy duplex with a narrow band of gravel over the clay at 60 to 100 cm. The site had been sown to sub. clover and serradella for the previous three years and was cut for hay annually.
RESULTS
Fertiliser nitrogen above the basal rate did not improve yields nor returns (Table 2). The non significant yield effects were not enough to offset the cost of nitrogen fertiliser. Protein increased with increasing rates of nitrogen fertiliser with flag leaf application appearing to be more effective than at Z31. The 80 kg N/ha rate at Z31 gave highest protein and screenings (25.2%) which downgraded the sample to feed. Neither rate of N at flag leaf increased screenings sufficiently to downgrade the sample but increased protein to a similar level as Z31 timing. The site proved to be more fertile than soil testing and paddock history indicated. This is not unusual on Esperance sandplain soils.

Agribusiness Crop Updates 2008
Crop Updates is a partnership between the Department of Agriculture and Food, Western Australia and the Grains Research & Development Corporation
62
Table 2. Grain yield, grain quality and return from N application relative to basal N application
Treatment Total
fertiliser N (kg N/ha)
Grain yield (t/ha)
% Protein
Screenings (% < 2.5
mm)
Hectolitre kg/hL
Return net of N
above nil
Basal N only 18 4.46 10.5 6.0 68.5 $0
25N @ Z31 (In-season N calculator)
43 4.43 10.7 8.7 68.7 -$49
40N @ Z31 (SYN for 3.5 t) 58 4.59 11.3 9.1 67.6 -$41
80N @ Z31 (SYN for 4.5 t) 98 4.60 12.6 25.2 65.7 -$264
40N @ flag emergence 58 4.58 11.9 15.5 66.8 -$45
80N @ flag emergence 98 4.73 11.8 11.1 66.9 -$52
lsd 5% - 0.45 5.29 1.2
F prob. ns < 0.001 < 0.001 0.002
Values in bold differ significantly from the basal values at the 5% level.
CONCLUSION
Nitrogen decision systems give estimates of N requirements according to expected seasonal conditions. If conditions change, then required rates change. In the comparison of N decision systems tested here, flaws in underestimating paddock fertility and overestimating yield potential lead to costly overfertilising. The new In-season Nitrogen Calculator was closest to the actual requirement of N at this site. This technique estimates current N status of the crop during late tillering and shows potential to estimate nitrogen requirements to optimise yield, protein and return.
Grain yield on this site was unresponsive to N but deferred application of N at flag leaf increased protein similar to Z31 timing with lower screenings.
KEY WORDS
barley, protein, NDVI, late nitrogen, Yield Prophet, SYN
Project No.: DAW00148
Paper reviewed by: Blakely Paynter

Agribusiness Crop Updates 2008
Crop Updates is a partnership between the Department of Agriculture and Food, Western Australia and the Grains Research & Development Corporation
63
Wheat varieties respond differently to potassium application on potassium responsive soils Paul Damon and Zed Rengel, Faculty of Natural and Agricultural Sciences, University of Western Australia
KEY MESSAGES
• Relative grain yield response to K application was similar for all wheat varieties with respect to natural variability in productivity.
• The response of varieties to K application was influenced by site and/or seasonal factors. Where seasonal conditions during grain filling were unfavourable, varieties differed in their capacity to maintain high grain quality.
BACKGROUND
Our previous screening experiments have found significant differences among wheat varieties in their tolerance to soil K deficiency stress (K efficiency) under glasshouse and field conditions.
Wheat varieties with contrasting efficiency for K uptake and utilisation were identified.
AIMS
To evaluate the magnitude of variation in K efficiency among wheat varieties under conventional agronomic management practices and differing seasonal conditions in the wheatbelt of WA.
METHOD
Site 1: West Moora
The experiment was conducted at a site approximately 17 km WNW of Moora (S30o31’30’’; E117o52’40’’, elevation 240 m). Soil at the site was yellowish/brown, siliceous sand. The rotation history was long-term unimproved, non-leguminous pasture with diverse species composition. The topsoil (0-10 cm) contained (in mg/kg soil) N (3), bicarbonate-extractable P (Colwell 1963) (4), bicarbonate-extractable K (Colwell & Esdaile 1968) (18) and S (2). Organic carbon content (Walkley and Black 1934) was 0.59% and pH (CaCl2) was 5.0. The subsoil (10-30 cm) contained (in mg/kg soil) N (2), P (4), K (19) and S (1.5) with organic carbon 0.17% and pH (CaCl2) 4.8.
The experiment was sown on 30 May 2007 and harvested at maturity on 15 November. Plots were 30 m long and 1.5 m wide, with rows 0.22 m apart. Seed, treated with Jockey® at 450 mL/kg, was sown at the rate of 60 kg/ha using a tyned cone seeder. Basal nutrients (Super Cu, Zn, Mo at 300 kg/ha) were (in kg/ha) P (27), S (30), Ca (57), Cu (1.8), Zn (0.9) and Mo (0.18) applied in a band approximately 3 cm below the seed at sowing. Nitrogen was applied as urea at 75 kg N/ha; broadcast 7 weeks after sowing when plants were at the early tillering growth stage (Zadok 1.4 - 2.2; Zadok et al. 1974). Potassium fertiliser treatments were applied at the same time as urea, broadcast as Muriate of Potash (KCl; 49.5% K) at nil, 15 or 50 kg K/ha. Four mm of precipitation fell the day after application of N and K fertilisers and 43 mm fell in the following week.
Total precipitation at the site during the experimental period was 181 mm at the West Moora weather station, with 42, 100, 68, 53, 35 and 0 mm reported for the months of June, July, August, September, October and November, respectively. Fifty-nine mm of rainfall was recorded between the watery-ripe growth stage and maturity. The monthly average minimum temperature ranged from 7.4 to 13.4oC in September and November, respectively. The monthly average maximum temperature ranged from 18 to 29oC in August and November, respectively.
Above-ground biomass was sampled 15 weeks after sowing (19 September) when cv. Cadoux was at anthesis (Zadok 6) and all other varieties at the watery ripe (Zadok 7.1) growth stage. Whole shoots were cut at ground level from 5 quadrants per plot; each being 0.22 m2. All samples were dried in a forced-draught oven at 70oC for 48 h before weighing. Samples were then ground and sub-samples were digested in HNO3/HClO4 acids (Simmons 1978) before measuring K concentration by atomic

Agribusiness Crop Updates 2008
Crop Updates is a partnership between the Department of Agriculture and Food, Western Australia and the Grains Research & Development Corporation
64
absorption spectrometry (AAnalyst 300, Perkin Elmer, Norwalk, CT, USA). Potassium content of samples was calculated as the product of K concentration and dry weight. Plots were again sampled 24 weeks after sowing when all varieties were at physiological maturity (Zadok 9.3). Whole shoots were cut at ground level from 4 quadrants per plot; each being 0.22 m2. For each sample, the number of heads was counted and total biomass weighed, before separating grain from other plant material using a Kimseed Seed Cleaner (Kimseed International Pty Ltd, Osborne Park, Western Australia). Grain was weighed before measuring 1000-grain weight (weight of 1000 grains), hectolitre weight, % screenings and % protein (as total N * 6.25). Harvest index was calculated as the ratio of grain weight to total shoot weight for the mature quadrant samples.
Site 2: Harrismith North
The experiment was conducted at a site approximately 2 km NW of Harrismith (S32o54’30’’; E117o51’33’’, elevation 370 m). Soil at the site was grey, siliceous sand with a farming history of cereal cropping/pasture rotation, with barley in the previous season. The experiment was sown on 30 May 2007 and harvested at maturity on 22 November. Plots were 27 m long and 1.5 m wide, with a row spacing of 0.25 m. Seed, treated with Jockey® fungicide at 450 mL/kg, were sown at the rate of 60 kg/ha using a tyned cone seeder. Basal nutrients (Super Cu, Zn, Mo at 300 kg/ha) were (in kg/ha) P (27), S (30), Ca (57), Cu (1.8), Zn (0.9) and Mo (0.18) applied in the furrow, 3 cm below the seed at sowing. Basal N and treatment K fertilisers were applied as at Site 1, when plants were at the 4-leaf growth stage (Zadok 1.4; Zadok et al. 1974). 3 mm of precipitation fell 4 days after application of N and K fertilisers and no additional precipitation was recorded until 2 weeks after application.
Total precipitation at the site during the experimental period was 181 mm at Dudinin (about 8 km NE of the site), with 41, 96, 38, 35, 18 and 0 mm reported for the months of June, July, August, September, October and November, respectively. Only 18 mm of rainfall was recorded between anthesis and maturity. The monthly average minimum temperature at Narrogin (70 km west of the site) ranged from 6.2 to 7.6oC in June and October, respectively. The monthly average maximum temperature ranged from 16 to 22oC in August and October, respectively.
Above-ground biomass was sampled 17 weeks after sowing (27 September) when all varieties were at the anthesis growth stage (Zadok 6). Whole shoots were cut at ground level from 4 quadrants per plot; each being 0.25 m2. Samples were dried, weighed and analysed for K by the same method as for Site 1. Plots were again sampled 24 weeks after sowing when all varieties were at physiological maturity (Zadok 9.3). Whole shoots were cut at ground level from 4 quadrants per plot; each being 0.25 m2. Samples were weighed and the number of heads counted, before separating grain from other plant material. Grain was analysed by the same methods as for Site 1.
All data were analysed by Analysis of Variance (Genstat 9) and mean values were compared by lsd (5%).
RESULTS
Grain and shoot yield
Varieties differed in terms of grain yield and shoot biomass at Site 1 and, to a lesser extent, at Site 2. There was a general increase in grain yield in response to K application at both sites. Shoot biomass was responsive to K application only at Site 1, where increased shoot biomass was measured at anthesis and at maturity. There was an early response to K, during the vegetative growth stage, at Site 1, with more dramatic responses to K application measured for shoot biomass than grain yield. However, all varieties except Carnamah produced more shoot biomass at maturity with K applied at 50 kg/ha than without K (lsd = 0.05) (data not shown), Wyalkatchem was the only variety to yield significantly more grain with an increase in K fertilisation (Figure 1). Varieties responded differently to K application in terms of grain yield and shoot biomass at Site 1, but the differences were small in the context of the natural variation in productivity across the site. At anthesis, shoot biomass response to K was similar among varieties, with none of the varieties significantly responsive to K application for above-ground biomass based on lsd (5%) for individual mean values, despite the general biomass increase on average across all varieties where K was applied (p < 0.05).
At Site 2, K application increased grain yield, on average, across all varieties (p < 0.01) (Figure 2). Although there was no significant interaction effect between variety and K application, Wyalkatchem yielded significantly more grain with K applied at 50 kg/ha than without, whereas the other varieties did

Agribusiness Crop Updates 2008
Crop Updates is a partnership between the Department of Agriculture and Food, Western Australia and the Grains Research & Development Corporation
65
not. This result is consistent with the results at Site 1, indicating that Wyalkatchem was generally more responsive to K fertilisation in terms of grain yield than the other varieties. There was no significant effect of K treatment on above-ground shoot biomass at maturity or at anthesis. In contrast to Site 1 it is apparent that K was not limiting for early, vegetative growth at Site 2, but was critical during post-anthesis growth; notably grain filling. This difference in the nature of the responses to K may be attributed to the difference in seasonal conditions (rainfall) between sites during grain filling.
Potassium application increased the number of heads per square metre (p < 0.01), but not the number of grains per head or the harvest index at Site 1 (Figure 1). Cadoux and Nyabing were the only varieties that responded to K application by increasing the number of heads per square metre, based on lsd (5%) for means. The number of heads did not have a major influence on grain yield: more heads for Cadoux and Nyabing where K was applied did not correspond to increased grain yield for these varieties. Furthermore, capacity to convert shoot biomass to grain (harvest index) was not influenced by K application.
Grain yield was highly correlated with shoot biomass (r = 0.97) indicating that grain yield was determined by capacity to accumulate shoot biomass at Site 1, with favourable conditions for conversion of shoot biomass to grain yield regardless of K availability. At Site 2, harvest index, number of heads per square metre and number of grains per head were influenced by variety (p < 0.01), but not K application. Although harvest index was not influenced by K application at Site 2, grain yield was not as closely correlated with shoot biomass (r = 0.83) as at Site 1 (r = 0.97).
Grain quality
Grain quality was generally good at Site 1 whether K was applied or not, perhaps due to the favourable conditions of mild temperatures and timely precipitation (59 mm) during grain filling. Potassium application resulted in an increase in average grain size (p < 0.05), % screenings (p = 0.068) and hectolitre weight (p < 0.01), on average, for all varieties. However, none of the varieties responded to K application on an individual basis for any of the grain quality parameters based on lsd (5%) of mean values. Grain protein content was not affected by K application.
At Site 2, grain quality was generally variable, perhaps due to the low amount of precipitation (18 mm) during grain filling. Average 1000-grain weight, hectolitre weight and protein content were strongly influenced by K application and variety (p < 0.05), but there was no significant interaction. On an individual variety basis, K application at 50 kg/ha increased the 1000-grain weight for Cadoux and Nyabing, and hectolitre weight for Cadoux, while reducing grain protein content for Carnamah, with other varieties not significantly affected. While grain protein content exceeded 10.5% for all varieties where no K was applied, K applied at 50 kg/ha pushed protein content below 10.5% for all varieties except Wyalkatchem. The effect of K on grain content can be attributed to a dilution effect due to increased grain size. Screenings were less than 5% for all varieties at all K treatments.
Harvest index was not influenced by K application at either site, in contrast to the results of previous studies, where a high harvest index of varieties was a major factor associated with tolerance to K deficiency stress. However, Cadoux and Nyabing, which had comparatively low harvest indices, were susceptible to reduced grain quality under K deficiency stress compared to Bonnie Rock, Carnamah and Wyalkatchem.
Shoot K content and K uptake
All varieties took up more K and had a higher K concentration in shoots at anthesis with K applied at 50 kg/ha than without at both sites. There were differences among varieties (p < 0.05) in their content and concentration of K in shoots at anthesis without or with K applied at 50 kg/ha at Site 1 (Figure 1). At Site 1, capacity to take up K during vegetative growth may have influenced capacity to yield grain at maturity, with shoot K content at anthesis correlated with grain yield at maturity (r = 0.73). It is unclear whether differences between varieties in K uptake during vegetative growth were associated with differences in response to K for grain yield at maturity. Wyalkatchem achieved near-maximum K uptake at the low rate (15 kg/ha) of K application, whereas other varieties took up a similar amount of K at the nil and 15 kg/ha treatments. However, this capacity for efficient K fertiliser acquisition was not reflected in any superior capacity to yield grain at the low, compared to nil, K treatment.
At Site 2, the content and concentration of K in shoots was similar among varieties at all K treatments, indicating that differences in soil K availability across the site were greater than the differences between varieties for K uptake. Subsequently, in the context of the similarity among varieties for K

Agribusiness Crop Updates 2008
Crop Updates is a partnership between the Department of Agriculture and Food, Western Australia and the Grains Research & Development Corporation
66
uptake and shoot growth at anthesis, the capacity of varieties to maintain high grain quality at Site 2 cannot be attributed to K uptake. Because K is involved with the translocation of sugars and carbohydrates within the plant, it is feasible that some varieties (e.g. Wyalkatchem) had a more robust capacity for translocation of carbohydrates to grain under unfavourable conditions. Alternatively, K is important in regulating water use efficiency, so varieties may have differed in their capacity to efficiently use soil water under K-deficient, compared to K-sufficient, conditions in a water-limited environment.
1.0
1.1
1.2
1.3
1.4
1.5
1.6
1.7
1.8
Bonnie Rock Cadoux Carnamah Nyabing Wyalkatchem
gra
in y
ield
(t/
ha)
K0
K15
K50
130
140
150
160
170
180
190
200
Bonnie Rock Cadoux Carnamah Nyabing Wyalkatchem
Num
ber
of
heads /
m^2
K0
K15
K50
6
7
8
9
10
11
12
Bonnie Rock Cadoux Carnamah Nyabing Wyalkatchem
Shoot
K c
oncentr
ation (
mg/g
)
K 0
K 15
K 50
10
12
14
16
18
20
22
24
26
28
30
Bonnie Rock Cadoux Carnamah Nyabing Wyalkatchem
Shoot
K c
onte
nt
(kg/h
a)
K 0
K 15
K 50
Figure 1. Grain yield at Site 1 for wheat varieties with K applied at 15 kg/ha, 50 kg/ha or not applied.
Error bars are ±standard errors of means.
1.90
2.00
2.10
2.20
2.30
2.40
2.50
2.60
2.70
Bonnie Rock Cadoux Carnamah Nyabing Wyalkatchem
Gra
in y
ield
(t/
ha)
K0
K15
K50
35
37
39
41
43
45
47
Bonnie Rock Cadoux Carnamah Nyabing Wyalkatchem
1000 g
rain
wt
(g)
K 0
K 15
K 50
9.5
9.7
9.9
10.1
10.3
10.5
10.7
10.9
11.1
11.3
11.5
Bonnie Rock Cadoux Carnamah Nyabing Wyalkatchem
gra
in p
rote
in (
%)
K 0
K 15
K 50
81
82
83
84
85
86
87
Bonnie Rock Cadoux Carnamah Nyabing Wyalkatchem
hecto
litre
weig
ht
(kg)
K 0
K 15
K 50
Figure 2. Grain yield and quality parameters at Site 2 for wheat varieties with K applied at 15 kg/ha,
50 kg/ha or not applied. Error bars are ± standard errors of means.

Agribusiness Crop Updates 2008
Crop Updates is a partnership between the Department of Agriculture and Food, Western Australia and the Grains Research & Development Corporation
67
KEY WORDS
genotypic differences, K efficiency
FURTHER READING
Damon, P.M. and Rengel, Z. (2007). Wheat genotypes differ in K efficiency under glasshouse and field conditions. Australian Journal of Agricultural Research 58, 816-825.
ACKNOWLEDGMENTS
GRDC funded this project through the Sustainable Farming Systems Program. T. Hilder (DAFWA), R. Lunt (DAFWA) and technical staff at the Geraldton and Newdegate RSUs were responsible for site selection and the implementation and management of the experiments. Staff at Wongan Hills provided the seed for the experiments.
Project No.: UWA00031
Paper reviewed by: Bill Bowden

Agribusiness Crop Updates 2008
Crop Updates is a partnership between the Department of Agriculture and Food, Western Australia and the Grains Research & Development Corporation
68
Leaf disease management in continuous barley in the northern and central grainbelt of WA Geoff Thomas1, Ciara Beard2, Anne Smith2, Kith Jayasena3 and Sean Kelly1, Department of Agriculture and Food, Western Australia; 1South Perth, 2Geraldton and 3Albany
KEY MESSAGES
• Seasonal conditions impact strongly on occurrence and development of barley disease, and on yield response to fungicide application. Yield responses to fungicide application are more likely in high rainfall areas than low rainfall areas.
• In-furrow and foliar fungicide applications reduce severity of powdery mildew and can provide subsequent yield and gross margin responses.
• Foliar fungicide application can reduce net blotch infection, but yield responses are dependant on favourable seasonal conditions.
• Foliar fungicide applications at tillering reduce disease levels in lower canopy leaves, but do not provide upper canopy protection or yield responses, unless supported with follow up applications.
• In high disease risk scenarios, a combination of in-furrow fungicide or foliar spray at Z31, combined with foliar application at Z37 to Z55, provides significant control for a range of diseases and results in higher yield.
AIMS
To compare the benefits in continuous barley rotations of early foliar disease control strategies with the conventional application of foliar sprays later in the season.
INTRODUCTION
Recent trends in grain production have seen increasing areas of barley sown on or adjacent to previous barley crops. This raises the risk associated with stubble borne diseases such as net type net blotch (NTNB) and spot type net blotch (STNB), especially increasing the risk of infection occurring early in the season. Additionally, the increased areas sown to varieties susceptible to powdery mildew has seen an increase in the importance of this disease. This has prompted demand for better solutions to foliar disease management, particularly early season management.
A range of fungicide options are available for early and late season disease management. These include seed dressing, in-furrow and foliar application. The relative efficacy of these fungicide strategies, and particularly their efficacy for disease management, in continuous barley crops was investigated in 2006 and 2007 in a series of trials in the central and northern agricultural regions.
METHOD
Six experiments were carried out in the central and northern agricultural regions during 2006 and 2007. These experiments targeted Baudin (at Kokeby and two Calingiri sites) and Hamelin (at East Beverley, Mingenew and Yuna) sown onto barley stubble. All trials used a similar randomised factorial design (12 treatments with 4 replicates). Plots were 20 m x 1.8 m with single cone seeder width wheat buffers between all plots. A range of standard fungicide applications, both at seeding and foliar applied, were tested. All seed received Baytan® C @ 150 g/100 kg seed (including a Baytan only control treatment), except one treatment with Jockey® @ 450 mL/100 kg seed. In-furrow fungicide (Impact® in-furrow @ 400 mL/ha) was applied to compound fertiliser and drilled with the seed. Foliar fungicide (Tilt® 250 EC @ 250 mL/ha) was applied by boom in 80 L of water/ha using fanjet nozzles set at 0.5 m above crop height. Foliar applications were made at mid-tillering (Z14/24), stem extension (Z31), flag leaf emergence (Z37) and heading (Z55). All plots were assessed regularly for presence and severity of foliar disease. All plots were harvested and yield and grain quality assessed.

Agribusiness Crop Updates 2008
Crop Updates is a partnership between the Department of Agriculture and Food, Western Australia and the Grains Research & Development Corporation
69
RESULTS
Yuna 2007 – Low levels of NTNB were evident in the trial. An assessment of disease severity at Z31 indicated that the in-furrow treatment had slightly reduced necrotic leaf area on leaf 3. Following Z31, dry seasonal conditions resulted in significant moisture stress and eventual crop death.
Mingenew 2006 – Disease levels were low through the early season, however STNB developed so that 40-60% of leaf area on the top 4 leaves was diseased at grain fill. These disease levels occurred despite only 130 mm of rain falling during the growing season. There were no early fungicide effects on disease levels, however, in assessments at Z55, Z65 and Z83, small but significant reductions in disease severity were seen in the flutriafol in-furrow and Z37 propiconazole applications. Yield in Baytan control plots was 1.23 t/ha. The small fungicide disease responses were not reflected in yield or quality responses for any treatment (Table 1).
East Beverley 2006 − Sowing was delayed due to dry conditions in May/June, and eventually occurred on 27 June. At the tillering application (Z14/24) there were low levels of NTNB with no evidence of in-furrow or seed dressing fungicides reducing infection compared to Baytan control plots.
At stem extension (Z31) necrotic leaf area, including NTNB, on the 3rd and 4th leaves (from the top of canopy) was approaching 50%. Infection was reduced by the flutriafol in-furrow and the tillering application of propiconazole. By Z41 (early booting) fungicide applications at Z14/24 and Z31 had reduced infection in the lower canopy. However, at these times levels of NTNB were low in the upper canopy (< 5% on leaves 1 and 2) and no fungicide effects were evident. By Z75-80 all leaves were 80-100% necrotic with no treatment differences. Yield in Baytan control plots was 2.26 t/ha and additional fungicide treatments did not result in higher yield or significant quality improvements (Table 1).
Calingiri 2006 − Both NTNB and powdery mildew occurred in this trial. Powdery mildew assessments were made at tillering, flag emergence and late booting. Two weeks after the first fungicide treatment (applied at Z14/24), severity of powdery mildew was approximately 5% in Baytan control plots. Jockey seed treatment, flutriafol in-furrow and Tilt spray (Z14) all significantly reduced infection. Two weeks following the Z31 application, infection level in Baytan control plots was approx. 8%, with flutriafol in-furrow and Z31 spray reducing infection. The effect of the Z14 spray was diminishing. One week after Z37 spray, both flutriafol in-furrow and Z31 spray remained effective, the Z37 spray had begun to take effect, but the effect of the Z14 spray had ended.
A similar trend emerged with NTNB infection. Flutriafol in-furrow reduced infection until late in the season. The Z31 and Z37 sprays were highly effective and the Z55 application reduced late infection.
The combined effect of these diseases was measured as the percentage necrotic leaf area. Flutriafol in-furrow significantly reduced necrosis at all assessments prior to the final assessment at the milky dough stage. Foliar spray applications were effective in reducing necrosis during the season. Applications at Z31, Z37 and Z55 reduced leaf necrosis on the upper canopy measured at milky dough stage. The Z14 application reduced necrosis in lower canopy at early assessments but was less effective on upper leaves in the later part of the growing season.
Yield in Baytan control plots was 3.1 t/ha, Jockey seed treatment and propiconazole application at six weeks (Z14) did not significantly improve yield. Application of flutriafol in-furrow or foliar applications at Z31 (stem extension) or Z37 (flag leaf emergence) resulted in significantly higher yield (Table 2). All treatments achieved malting standard. Gross margin increases of more than $50/ha were achieved from in-furrow and Z31 and Z37 foliar fungicide treatments.
Kokeby 2007 – This trial was sown relatively late (28 May) into a Gairdner barley stubble, in a paddock which had three previous barley crops. One replicate of this trial had significant levels of Rhizoctonia bare patch and root lesion nematode, a recognised risk associated with continuous cereal cropping. Fungicide had no effect on crop establishment. Assessments were made at five times during the season. Disease levels were low, powdery mildew did not occur and NTNB was sporadic. Both Wirrega blotch and ring spot were present in higher levels than usually seen, possibly as a result of high levels of barley grass contamination throughout the trial area. Small fungicide responses were noticed in the necrotic leaf area measured, however differences were generally marginal. Necrosis levels in Jockey® treated plots were slightly higher late in the year, however this was not related to presence of higher levels of disease and did not seem to negatively impact on yield. The foliar application at Z39 slightly reduced necrotic leaf area. There was no significant benefit from fungicide application in terms of yield, with an average yield across all treatments of 4.28t/ha (Table 3).
Calingiri 2007 – The trial was sown under marginal moisture conditions (30 May) resulting in slightly staggered germination, but developed well without any pre-seeding fungicide effects on establishment. There were appreciable levels of NTNB in the trials from seedling stage to flag leaf emergence.

Agribusiness Crop Updates 2008
Crop Updates is a partnership between the Department of Agriculture and Food, Western Australia and the Grains Research & Development Corporation
70
Following flag leaf emergence the disease did not develop further and all treatments had similar levels of disease later in the season. There was no evidence of other foliar diseases in this trial. Assessments of NTNB and necrotic leaf area indicated that 2-3 weeks after each foliar application (Z24, Z31, Z33) significant disease reductions were evident. However, the effect of the early application (Z24 at 6 weeks) was not noticeable by the Z33 application. In late September and into October the trial suffered some moisture stress and Take-all became evident in one replicate. The trial site had been under at least four years continuous cereal and the presence of Take-all is a risk under these circumstances. By mid-October, when significant rain occurred, the majority of leaves had senesced but stems and heads were still green, this appears to have boosted yield. The average trial yield was 2.9 t/ha with no significant fungicide responses measured (Table 3).
Table 1. Effect of pre-seeding and foliar fungicides on average % leaf area diseased on the top four leaves of Hamelin barley at Mingenew and East Beverley in 2006
Mingenew (STNB) East Beverley (NTNB)
% Leaf area diseased Yield
t/ha
% Leaf area diseased Yield
t/ha Z31 Z83 Z31# Z75
FACTOR 1 (Fungicide treatment)
Baytan® C @ 150 g/100 kg seed 5.3 53.9 1.23 67.7 88.1 2.26
Jockey® @ 450 mL/100 kg seed 5.9 55.8 1.24 63.4 93.8 2.40
Baytan® C + Impact® in-furrow 4.6 47.9 1.16 52.4 88.6 2.31
Baytan® C + Tilt® 250 EC at 6 wks 4.7 50.6 1.21 44.4 87.2 2.26
Baytan® C + Tilt® 250 EC at Z31 - 51.2 1.20 - 89.5 2.15
Baytan® C + Impact® + Tilt® at Z55 - 41.4 1.11 - -
LSD 5% ns 3.1 *** ns 14.8* ns 0.18
FACTOR 2 (Flag leaf spray)
Nil 5.0 52.8 1.18 - 89.2 2.28
Tilt® 250 EC at Z37 4.9 47.8 1.21 - 88.5 2.31
LSD 5% ns 1.8 *** ns ns ns
# Average of leaves three and four.
* Significant at 0.05 level (i.e. P < 0.05); ** Significant at 0.01 level (i.e. P < 0.01); *** Significant at 0.001 level (i.e. P < 0.001).
Table 2. Effect of fertiliser and foliar applied fungicides on foliar disease and yield of Baudin barley sown at Calingiri in 2006
% Leaf area diseased Yield t/ha NTNB
Z49# Mildew Z49#
Necrotic leaf area
Z49# Z71##
FACTOR 1 (Fungicide treatment)
Baytan® C @ 150 g/100 kg seed 13.8 5.2 21.4 55.9 3.39
Jockey® @ 450 mL/100 kg seed 10.4 4.0 17.1 50 3.33
Baytan® C + Impact® in-furrow 5.2 1.1 9.4 45.8 3.68
Baytan® C + Tilt® 250 EC at 6 wks 9.9 4.1 16.5 54.8 3.41
Baytan® C + Tilt® 250 EC at Z31 3.8 1.7 8.3 43.7 3.65
Baytan C + Tilt @ 250 mL/ha at Z37 4.3 2.6 9.7 - -
Baytan® C + Impact® + Tilt® at Z55 - - - 25.6 3.74
LSD 5% 4.2*** 2.5* 6.1** 11.6*** 0.24*
FACTOR 2 (Flag leaf spray)
Nil - - - 55.5a 3.43
Tilt® 250 EC at Z37 - - - 39.1b 3.64
LSD 5% 6.7*** 0.14*
# Average of top three leaves.
## Average of top four leaves.
* Significant at 0.05 level (i.e. P < 0.05); ** Significant at 0.01 level (i.e. P < 0.01); *** Significant at 0.001 level (i.e. P < 0.001).

Agribusiness Crop Updates 2008
Crop Updates is a partnership between the Department of Agriculture and Food, Western Australia and the Grains Research & Development Corporation
71
Table 3. Effect of fertiliser and foliar applied fungicides on foliar disease and yield of Baudin barley sown at Kokeby and Calingiri in 2007
Kokeby 2007 Calingiri 2007
% LAA# Z32
Z65 Yield t/ha
% LAA# Z31
Z75 Yield t/ha
FACTOR 1 (Fungicide treatment)
Baytan® C @ 150 g/100 kg seed 13.4 28.4 4.42 43.7 46.6 2.84
Jockey® @ 450 mL/100 kg seed 11.3 40.0 4.29 43.0 50.4 3.03
Baytan® C + Impact® in-furrow 10.0 30.1 4.17 41.8 46.3 2.98
Baytan® C + Tilt® 250 EC at 6 wks 14.7 32.6 4.21 27.8 53.0 3.00
Baytan® C + Tilt® 250 EC at Z31 9.2 30.9 4.35 - 47.8 2.87
Baytan® C + Impact® + Tilt® at Z55 - - 4.45 - 48.1 3.02
LSD 5% 3.1* 4.4* ns 4.7*** ns ns
FACTOR 2 (Flag leaf spray)
Nil - 34.4 4.27 - 50.9 2.92
Tilt® 250 EC at Z37 - 30.5 4.36 - 46.5 2.99
LSD 5% 2.8** ns 2.6** ns
# % leaf area diseased, top four leaves.
* Significant at 0.05 level (i.e. P < 0.05); ** Significant at 0.01 level (i.e. P < 0.01); *** Significant at 0.001 level (i.e. P < 0.001).
CONCLUSION
Continuous barley cropping increases risk of stubble borne diseases such as NTNB, STNB and scald, particularly early season infection. Baudin is susceptible to both NTNB and STNB, while Hamelin is susceptible to NTNB and moderately susceptible to STNB. As a result, both these varieties are vulnerable to early infection by the net blotches.
Infection by either STNB or NTNB occurred in all trials and was evident at tillering in most of the trials as a result of sowing into barley stubbles. However, disease levels were moderate in most trials and seasonal conditions were not favourable for later season development of disease in at least three of the trials. Foliar fungicide applications with propiconazole gave significant reduction in disease levels. However, in five of the six trials, significant yield responses were not evident. Although fungicide application can reduce net blotch levels, yield responses will be minimal and gross margin responses break-even or negative, unless seasonal conditions favour late season disease development or there are other diseases present as well. This indicates that yield responses to fungicide application are less likely in crops grown in lower rainfall areas.
Powdery mildew was present in only one of the six trials, where severity of the disease was moderate. In this trial best long term protection was provided by flutriafol in-furrow and propiconazole foliar applications at Z31 or Z37. In combination with reductions in NTNB, significant yield responses occurred with these treatments.
Application of fungicide at six weeks after sowing (tillering) reduced infection by NTNB and powdery mildew at the time of spraying, but did not affect level of disease at grain fill. It is likely that in most situations delaying foliar application until Z31 will provide more significant yield benefits. Possibly under higher powdery mildew pressure than occurred in these trials earlier foliar fungicide application may still be warranted.
Flutriafol-in-furrow is registered for management of powdery mildew and scald in barley but not for net blotch. In four of these trials, where low-moderate levels of net blotch were present, flutriafol-in-furrow reduced necrotic leaf area and in some cases these effects were evident until late in the crop’s growth. This effect does not appear to be consistent and did not result in a yield response. Further examination under higher disease pressure is required.

Agribusiness Crop Updates 2008
Crop Updates is a partnership between the Department of Agriculture and Food, Western Australia and the Grains Research & Development Corporation
72
While disease levels were low in these trials, results indicate that the standard Z31 or Z37 application times are most effective and earlier applications do not have lasting efficacy. The use of flutriafol in-furrow can provide significant control of powdery mildew and may reduce leaf necrosis in the absence of powdery mildew. Under high disease pressure (high rainfall, susceptible variety, barley stubble) combination of flutriafol in-furrow with foliar application or a two spray strategy are likely to be most effective. Under lower disease pressure, yield responses to fungicide application are less likely.
KEY WORDS
barley, Baudin, Hamelin, disease management, powdery mildew, net blotch, fungicide
Project No.: DAW00106: Managing disease constraints in Western Region farming systems
Paper reviewed by: Vivien Vanstone

Agribusiness Crop Updates 2008
Crop Updates is a partnership between the Department of Agriculture and Food, Western Australia and the Grains Research & Development Corporation
73
Temperature and moisture requirements of leaf, stem and stripe rusts of wheat Geoff Thomas, Rob Loughman and Bill MacLeod, Department of Agriculture and Food, Western Australia, South Perth
KEY MESSAGES
• Cool wet conditions favour rust infection but lengthen latent periods (time between infection and sporulation).
• At warmer temperatures latent periods shorten significantly, however infection frequencies also reduce, particularly in stripe rust.
• Available leaf wetness from either rainfall or high relative humidity is a major determinant of infection success.
• Late winter and early spring in WA provide suitable environmental conditions for all rusts.
• Stripe rust is less able to infect during high summer temperatures than stem or leaf rust.
• Autumn weather conditions are suitable for infection of all rusts, green regrowth in this period poses the greatest risk of stripe rust carryover.
AIM
To determine how the seasonal environmental variables, moisture and temperature, impacted on the efficiency of infection and latent period of the three wheat rusts.
INTRODUCTION
Wheat in Australia is subject to infection by three predominant rust species, leaf rust (Puccinia triticina), stem rust (P. graminis f. sp. tritici) and stripe rust (P. striiformis f. sp. tritici). Environmental conditions play a major part in the seasonal and regional importance of these rusts within Western Australia (WA). Temperature and moisture are the two key factors dictating the success or failure of infection of susceptible wheat. Moisture is essential for germination and penetration of all three rusts. Once penetration has occurred temperature becomes the key environmental driver of continuing disease development. The optimal environments for infection of wheat differ for each rust species.
METHOD
Twenty-nine separate experiments were carried out on a two to four week cycle between June 2005 and November 2006. In each experiment, pots containing two week old seedlings of rust susceptible wheat cultivar Tincurrin were inoculated separately with stem, leaf or stripe rust. At each inoculation time, nine replicate pots were inoculated with each rust species by suspending rust urediniospores??? in Pegasol mineral oil and applying as an aerosol. Inoculated plants at each time were split into three
groups: ‘A’ plants − immediately subjected to prevailing field conditions; ‘B’ plants − 24 hours moist
incubation (100% leaf wetness) and then subjected to prevailing field conditions; ‘C’ plants − 24 hours moist incubation (100% leaf wetness) and then maintained under ideal conditions in a glasshouse. Effectively ‘C’ plants were positive controls, ‘B’ plants had infection guaranteed but disease development was dependent on weather, particularly temperature. In ‘A’ plants both infection and disease development was dependant on weather conditions. All plants were observed daily for rust symptoms. Latent period was calculated as the day on which 50% of chlorotic lesions exhibited sporulation and was calculated only for those plants achieving sporulation. Rust severity was assessed 14 days after inoculation and for ‘A’ and ‘B’ plants expressed as a severity index, proportional to positive control ‘C’ plants.
RESULTS AND DISCUSSION
The experimental period encompassed two winter cropping periods and a hot dry summer fallow period. Daily mean temperatures typically ranged from 10-15°C during winter and 20-30°C during summer (Figure 1). Latent period of the three rusts (measured in ‘B’ plants) showed similar seasonal responses being shortest during the warm summer period and longest in the cool winter period (Figure 1). Using a 10 day average temperature from the time of inoculation in all experiments, the latent period of stripe rust reduced from 16 days at 12ºC to 10 days at 24ºC. Over the same temperature range the latent period of stem rust reduced from 14 to 8 days and leaf rust from 13 to 7 days (Figure 2).

Agribusiness Crop Updates 2008
Crop Updates is a partnership between the Department of Agriculture and Food, Western Australia and the Grains Research & Development Corporation
74
Sporulation in moist incubated ‘B’ and ‘C’ plants occurred in all experiments (except a single stripe rust experiment in February 2006 where temperatures were very high), however this was not the case with ’A’ plants which relied on rainfall or dew to provide leaf wetness. In the growing season months of April-October, sporulation was observed on ‘A’ plants in 15/17 leaf rust, 10/17 stem rust and 14/17 stripe rust inoculations. During 11 experiments in the warmer and drier months of November-March this reduced to 5/11 leaf rust, 4/11 stem rust and 2/11 stripe rust inoculations (Figure 3). Infection frequency dropped for all rusts but stripe rust infection was least likely to occur in the warm summer temperatures.
The average severity index of infection in stripe rust ‘B’ plants (guaranteed infection) during the summer (Nov.-Mar.) period was less than half of the severity during the growing season (Apr.-Oct.). In both stem and leaf rust summer severity was ~75% of growing season severity.
Infection in all rusts was closely related to relative humidity (RH). In more than 90% of cases successful infection was related to days with maximum RH > 95%. Analysis of weather conditions during the experimental period shows that > 95% RH can occur without rainfall and so successful rust infection is not solely related to rainfall frequency.
Assessment of stripe rust progression in field plots across Western Australia in 2005 and 2006 indicate that disease spread in many sites slowed in late September into October. At most sites this corresponded with increasing temperature and reduced incidence of high RH. At the same time crops are reaching advanced growth stages where adult plant resistance is most effective. In general temperature, rainfall and RH conditions become less favourable for rust, particularly stripe rust, earlier in central and northern areas than in southern regions. This corresponds with field observations where stripe rust progression in central regions has halted whilst it continues in lower great southern and southern regions.
4
8
12
16
Late
nt period (
days) Leaf rust Stem rust Stripe rust
5
10
15
20
25
30
1/07/05 1/09/05 1/11/05 1/01/06 1/03/06 1/05/06 1/07/06 1/09/06 1/11/06
Tem
pera
ture
(C
)
Mean daily temp
10 day moving average temp
Figure 1. Daily mean temp. June 2005-Nov. 2006 and latent period (2 experiment moving average) of leaf, stem and stripe rusts in inoculated and moist incubated (‘B’ plants) Tincurrin wheat.
4
8
12
16
20
10 15 20 25 30
10 Day Average Temp (°C)
Late
nt
Period (
days)
Stripe rust
Leaf rust
Stem rust
Figure 2. Impact of 10 day av. temp. following inoculation on latent period of leaf, stem and stripe rusts in inoculated and moist incubated (‘B’ plants) Tincurrin wheat.

Agribusiness Crop Updates 2008
Crop Updates is a partnership between the Department of Agriculture and Food, Western Australia and the Grains Research & Development Corporation
75
Figure 3. Incidence of infection in a) leaf rust and b) stripe rust inoculated Tincurrin wheat plants immediately subjected to prevailing field conditions (‘A’) between July 2005 and November 2006.
CONCLUSION
In WA, the cool wet conditions of winter/spring favour rust infection but lengthen latent periods. As temperatures become warmer latent periods shorten significantly, however infection frequencies also reduce. Available leaf wetness appears to be a major determinant of successful infection, however over summer if moisture is present leaf and stem rust infection is more likely than stripe rust. Accordingly longer dry summers are likely to reduce the chances of early rust build-up. All rusts were able to successfully initiate infection in autumn conditions; therefore green bridge present in autumn can easily host infection. Autumn regrowth surviving into the cropping season provides the greatest risk for early infection of crops and rust development.
KEY WORDS
stripe rust, leaf rust, stem rust, latent period
Project No.: DAW00106: Managing disease constraints in the Western Region farming systems
Paper reviewed by: Bill MacLeod

Agribusiness Crop Updates 2008
Crop Updates is a partnership between the Department of Agriculture and Food, Western Australia and the Grains Research & Development Corporation
76
Fungicide options for controlling diseases in oats
Raj Malik1 and Blakely Paynter2, Department of Agriculture and Food, Western Australia; 1Katanning and 2Northam
Contact: Raj Malik, DAFWA, Katanning; Ph: (08) 9821 3247 or [email protected]
KEY MESSAGES
• Research is being undertaken to evaluate potential new fungicide options for controlling septoria, stem and leaf rust and/or bacterial leaf blight in oats.
• The only disease that developed in trials was septoria, despite being inoculated with rust spores, having infected straw spread after sowing and being sown into oat stubble.
• Five fungicides − Tilt® (propiconazole) and Opus® (epoxiconazole), Tilt Xtra® (cypraconazole + propiconazole), Amistar Xtra® (azoxystrobin + cypraconazole), and Bravo® (chlorothalonil) – effectively reduced septoria levels in the canopy when applied at stem elongation stage.
• No improvement in hay yield was observed when a range of fungicides were applied either to the seed, at mid tillering (Z22) or at stem elongation (Z31), despite septoria being present.
• Foliar spray of Tilt Xtra, Amistar Xtra and Impact fungicides significantly improved the grain yield of oats at Narrakine but not at Katanning.
AIMS
Producing high quality oaten hay for export market is extremely important. Quality hay is measured as a combination of biochemical and visual quality standards. The visual appearance of hay is important for price negotiations particularly in the export market because there is a human element involved in the purchase. Leaf disease can influence the visual appearance of hay. An economic study conducted by Department of Agriculture and Food, Western Australia suggests a precautionary fungicide application may increase the value of oaten hay by up to $20/t due to receival into higher paying grades. This equates to a $100/ha improvement in returns for a hay yield of 6 t/ha.
Septoria, stem rust, leaf rust and bacterial leaf blight are leaf diseases that occur often in oaten hay crops in Western Australia. Each of the diseases is capable of resulting in significant yield reductions. Despite the effort to improve the resistance levels of oat varieties to leaf diseases, agronomic solutions must be used to reduce the impact of leaf diseases with current resistance levels. Fungicide applications are becoming an increasingly important part of disease control strategies. However, currently in Western Australia there are limited control options available for oats. There are only three seed dressings (which control smut only) and two foliar fungicides registered for use on oats. Propiconazole and tebuconazole control leaf and stem rust and only propiconazole is registered to suppress septoria. There are no registered fungicides for the control or suppression of bacterial leaf blight.
Overseas data suggests that there are a range of new generation fungicides that may control these diseases. Information on the effectiveness of this range of non-registered fungicides is required to determine whether there is merit in seeking product registration to provide a broader range of disease control options for Western Australian grown oats. The newer chemistry strobilurins may offer a tool that will maintain green leaf area. In addition, little documented public evidence exists on the impact of diseases on other hay quality characteristics.
The objective of this study was to investigate the effectiveness of a range of registered and non-registered fungicides in controlling foliar diseases of oats and their impact on yield and quality of oats grown both for hay and grain. The data presented in this paper are from RIRDC funded project (Project no.: FCR06-04) to evaluate fungicide options for hay oats over the 2007 and 2008 cropping seasons. Hopefully this work leads to new registrations that will assist growers manage leaf disease in oats. This project is being undertaken with Rural Directions in South Australia to:
− evaluate the effectiveness of a range of registered and non-registered fungicides on controlling septoria, stem and leaf rust and/or bacterial leaf blight in oaten hay;
− determine whether control of leaf diseases leads to improvements in visual and chemical hay quality, and hay yield; and
− calculate the cost effectiveness of fungicide use, including as a precautionary application.

Agribusiness Crop Updates 2008
Crop Updates is a partnership between the Department of Agriculture and Food, Western Australia and the Grains Research & Development Corporation
77
METHOD
Design: 1 variety x 15 fungicide treatments x 4 reps
Two small plot trials were set up at Katanning and Narrakine in the 2007 season. The trials were sown on oaten hay crop stubble to increase the probability of leaf disease occurring. Carrolup (susceptible to all leaf diseases) was sown at 3 cm depth with an experimental seeder in 20 m length plots over 8 rows (18 cm row spacing). The trial was sown in a randomised block design with four replications spread over two banks. A barley buffer was sown between each oat plot to avoid fungicide spray drift into neighbouring treatment. Fertiliser (MacroPro Plus® @ 150 kg/ha drilled and NPK Blue Special® @ 250 kg/ha top dressed) were applied at the time of seeding.
The fungicide options examined included three seed dressings, two copper based fungicides to control bacterial leaf blight for application at mid tillering (Z22) and eight foliar fungicides for application at stem elongation (Z31). The fungicides evaluated, their active ingredients and their application timing is listed in Table 1. Please note that many of the products listed in Table 1 are not registered for use on oats and were applied for experimental research purposes only. Before using a foliar fungicide on oats, please check that it is a registered product and do not apply the product within the with-holding period.
Table 1. Fungicide options evaluated and spray timing
Fungicide Active ingredient Spray timing Application rate per ha
Control Nil Nil Nil
Jockey® Fluquinconazole Seed dressing 400 mL
Real® Triticonazole Seed dressing 150 mL
Maxim L® Metalaxyl-M & Fludioxonil Seed dressing 400 mL
Oxydul DF® Copper Oxychloride Z22 2.5 kg
Ridomil Gold Plus® Metalaxyl & Copper Hydroxide Z22 2.25 kg
Tilt® Propiconazole Z31 500 mL
Opus® Epoxiconazole Z31 500 mL
Tilt Xtra® Cypraconazole + Propiconazole Z31 500 mL
Amistar Xtra® Azoxystrobin + Cypraconazole Z31 800 mL
Bravo® Chlorothalonil Z31 1,800 mL
Folicur® Tebuconazole Z31 290 mL
Triad® Triadimefon Z31 1000 mL
Impact® Flutriafol Z31 500 mL
Plant establishment counts were taken at four weeks after seeding. Foliar leaf disease measurements were taken between flag leaf emergence (Z39) and panicle emergence (Z55). In each plot ten tillers were randomly selected and the flag-1, flag-2 and flag-3 leaves were rated for disease severity based on the percentage of leaf area exhibiting chlorosis and/or necrosis. From each plot, hay was hand cut at the watery ripe stage (Z71) as per the protocols used by the National Oat Breeding Program. The samples were oven dried for several days and weighed to determine hay yield. Ten random tillers were then used to determine stem diameter and leaf colour.
Plots were harvested with a small plot harvester, grain weighed and sub-sampled. The grain sub-samples was cleaned over a 1.5 mm sieve. Only hay yield, stem diameter, hay greenness and grain yield data were available at the time of printing. Samples will measured for average grain weight, hectolitre weight, screenings, grain brightness, grain protein, grain oil% and groat%. Samples will also be milled and analysed for dry matter, acid detergent fibre, neutral detergent fibre, crude protein, in vitro digestibility, metabolisable energy and water soluble carbohydrates on a NIRS6500 machine.

Agribusiness Crop Updates 2008
Crop Updates is a partnership between the Department of Agriculture and Food, Western Australia and the Grains Research & Development Corporation
78
RESULTS
Only septoria blotch was recorded at both Katanning and Narrakine (Figure 1) despite of all the efforts made to generate multiple diseases pressure. Background disease levels on the control plots were approximately 30% LAI (leaf area infected) at Katanning and 40% LAI at Narrakine.
Applying foliar fungicides reduced the septoria severity significantly (p < 0.05) at both locations when
compared with untreated plots. Five fungicides in particular − propiconazole (Tilt®) and epoxiconazole (Opus®), Cypraconazole + Propiconazole (Tilt Xtra®), Azoxystrobin + Cypraconazole (Amistar Xtra®) and Chlorothalonil (Bravo®) – were effective in controlling septoria when applied at stem elongation stage.
A significant location x fungicide interaction also occurred (p < 0.05) suggesting that the efficacy of fungicides varied with location depending on the leaf disease severity. At Katanning, where disease pressure was less, the diseased leaf area reduced by 54, 83, 81, 82 and 26% with the application of Tilt®, Opus®, Tilt Xtra®, Amistar Xtra® and Bravo®, respectively. At Narrakine the disease severity was higher and the corresponding reduction in disease infected leaf area was 70, 90, 85, 85 and 62% respectively, for the afore mentioned products.
0.0 5.0 10.0 15.0 20.0 25.0 30.0 35.0 40.0 45.0
Control
Jockey
Real
Maxim L
Oxydul DF
Ridomil Gold Plus
Tilt
Opus
Tilt Xtra
Amistar Xtra
Bravo
Folicur
Triad
Impact
Fungicide
% Leaf area infected (F-1 to F-3)
Katanning Narrakine
Figure 1. Per cent leaf area infected (F-1 to F-3) measured during panicle emergence at Katanning and Narrakine for a range of registered and un-registered fungicides. (LSD (p < 0.05) at Katanning: fungicide vs fungicide = 8.9%, fungicide vs control = 7.7%; Narrakine = fungicide vs fungicide = 8.1%, fungicide vs control = 7.0%.)
There was no significant impact of any of the fungicides tested on hay yield, stem thickness or hay greenness (Table 2). However, whilst not significant, there was a slight improvement in hay colour in the upper canopy due to fungicide application in the order of 3 to 14% at Katanning and 9 to 18% with the foliar application of Tilt®, Opus®, Tilt Xtra®, Amistar Xtra® and Bravo® fungicides. There was no noticeable effect with the other foliar fungicides evaluated.
There was no significant impact of fungicide application on grain yield at Katanning, but grain yields at Narrakine were improved (Table 2). At this site, the grain yield of Tilt Xtra®, Amistar Xtra® and Impact® treated plots was significantly higher than untreated plots (p < 0.05). The grain yield improvement was due to these fungicides was 9.0%, 14.0 and 8.0%, respectively over control. There was no improvement in grain yield with Opus® despite a reduction in septoria levels comparable to Tilt Xtra® and Amistar Xtra® (Figure 1). Reduction in leaf area infected with septoria due to the application of Tilt® and Bravo® also did not result in any significant differences in grain yield at Narrakine.

Agribusiness Crop Updates 2008
Crop Updates is a partnership between the Department of Agriculture and Food, Western Australia and the Grains Research & Development Corporation
79
Table 2. Effect of various fungicides on grain and hay yield (t/ha), stem thickness (mm) and greenness of oaten hay (SPAD units)
Fungicide
Hay yield (t/ha)
Stem thickness (mm)
Leaf greenness (SPAD units)
Grain yield (t/ha)
Katanning Narrakine Katanning Narrakine Katanning Narrakine Katanning Narrakine
Control 10.3 7.8 6.3 5.9 31.8 34.8 3.38 2.77
Jockey® 9.7 8.0 6.4 5.9 31.1 34.4 3.34 2.74
Real® 10.8 7.9 6.1 6.2 32.7 34.8 3.45 2.83
Maxim L® 10.2 8.1 6.0 5.7 30.2 34.7 3.19 2.93
Oxydul DF® 10.2 7.9 6.2 6.2 32.2 35.3 3.36 2.81
Ridomil Gold Plus® 10.1 7.9 6.1 5.8 30.4 34.5 3.34 2.84
Tilt® 10.8 8.0 6.7 6.1 36.7 36.3 3.66 2.83
Opus® 10.5 7.9 6.4 5.7 36.7 39.7 3.43 2.91
Tilt Xtra® 10.4 8.8 6.3 6.0 37.4 37.5 3.57 3.02
Amistar Xtra® 10.3 8.2 6.6 5.9 36.6 37.3 3.44 3.16
Bravo® 10.7 8.7 6.4 6.0 34.7 36.0 3.34 2.86
Folicur® 10.2 8.1 6.1 6.1 35.4 35.6 3.46 2.84
Triad® 10.1 8.2 6.1 6.4 34.3 36.5 3.64 2.87
Impact® 10.5 7.7 6.1 6.1 35.7 36.0 3.70 2.99
Mean 10.3 8.1 6.3 6.0 34.0 35.9 3.45 2.89
LSD (p < 0.05) NS NS NS NS NS NS NS S
Fungicide vs fungicide 0.21
Fungicide vs control 0.18
S = significant (p < 0.05); NS = non significant.
CONCLUSION
Whilst reductions in leaf area infected with septoria were noted when Tilt® (propiconazole, Opus® (epoxiconazole), Tilt Xtra® (cypraconazole + propiconazole), Amistar Xtra® (azoxystrobin + cypraconazole), and Bravo® (chlorothalonil) were applied at stem elongation (Z31), no impacts on hay yield were observed. Reductions in grain yield were however only observed at Narrakine and only with the application of Tilt Xtra®, Amistar Xtra® and Impact® but not Opus®, Tilt® or Bravo®. This research will continue in 2008.
ACKNOWLEDGMENTS
This research was funded by the DAFWA with financial support from Rural Industries Research and Development Corporation (RIRDC). Trials were managed by the Research Support Unit at Katanning.
Project No.: FCR06-04
Paper reviewed by: Blakely Paynter

Agribusiness Crop Updates 2008
Crop Updates is a partnership between the Department of Agriculture and Food, Western Australia and the Grains Research & Development Corporation
80
Survey of wheat root diseases under intensive cereal production in Western Australia during 2005-2007
Ravjit Khangura, William MacLeod, Vivien Vanstone, Colin Hanbury, Mehreteab Aberra, Gordon MacNish and Robert Loughman, Department of Agriculture and Food, Western Australia, South Perth
KEY MESSAGES
• Results from a root disease survey conducted during 2005-2007 indicate that root and crown diseases occurred at damaging levels across all cropping districts of WA in paddocks frequently cropped to wheat.
• The most important fungal diseases identified were Rhizoctonia bare patch, Fusarium crown rot and take-all. Root lesion nematode also occurred frequently during the three years of the survey.
• Not all samples taken from paddocks under intensive cereal production indicated damaging levels of root diseases. Further research is planned to examine factors that contribute to the levels of root disease in intensive cereal cropping systems.
AIMS
A survey was conducted to determine the incidence and relative importance of root-infecting pathogens of wheat in relation to continuous cereal cropping. Information obtained from this survey will be used to determine future research needs for cereal root disease management in Western Australia.
METHOD
In 2005, wheat crops were surveyed mainly from the northern and central regions. Due to dry seasonal conditions in 2006 and 2007, the survey was focused in the southern region in 2006 and predominantly in the south in 2007, with only a few samples collected from the northern region. A total of 77, 71 and 55 wheat crops were surveyed in 2005, 2006 and 2007, respectively. From each crop, at least 100 plants were collected during anthesis, along a pre-determined transect. The roots of plants were thoroughly washed under running tap water and assessed for severity of the root diseases Rhizoctonia bare patch, Take-all, Fusarium crown rot and cereal cyst nematode. Soil from all samples was retained for extraction and enumeration of root lesion nematode. Details of wheat variety, date of sowing, paddock history and rainfall zone was collected for each sample.
RESULTS
Fungal root diseases
Rhizoctonia bare patch, Fusarium crown rot and take-all are the most important fungal pathogens associated with wheat roots in all three years of the survey, and particularly in 2007. In 2005, Rhizoctonia bare patch and Fusarium crown rot were detected in 59% and 15% of samples respectively. These diseases were detected in 92% and 49% of samples, respectively, in 2006 and 91% and 64% of, samples, respectively, in 2007. Likewise, the prevalence of Take-all was also higher in 2007 (78%) than in 2005 (27%). Percentage of paddocks with a damaging level of at least one of these three diseases (at least 5% incidence) was substantially higher in 2007 than in 2006 or 2005 (Figure 1). The presence of one disease does not preclude others, in each year of the survey several paddocks were identified with damaging levels of two or more fungal pathogens and often with high levels of RLN. The intensity incidence of both Rhizoctonia-bare patch and Take-all appeared to be similar in different agricultural regions, however the incidence of Fusarium crown rot appeared to be higher in the Southern and South-Coastal areas. The high incidence of root disease observed in 2006 and 2007 compared with 2005 could be attributed either to differences in regional climate between northern and southern cropping zones, different seasonal conditions between years or different cropping practices.

Agribusiness Crop Updates 2008
Crop Updates is a partnership between the Department of Agriculture and Food, Western Australia and the Grains Research & Development Corporation
81
Nematodes
The average Statewide density of root lesion nematode (RLN) was 8, 13 and 7 RLN/g dry soil in 2005, 2006 and 2007 respectively (Table 2). In 2005, 2006 and 2007, respectively, there were 49, 45 and 34% crops with more than 5 RLN/g dry soil. The comparatively lower level of RLN in 2007, compared to 2006, is more likely to be due to the areas sampled and/or cropping history rather than the seasonal conditions. The predominant species of RLN was Pratylenchus neglectus, although P. teres was also identified in some samples. Cereal cyst nematode was observed in two samples in 2005 only.
Table 1. Average incidence, range and percentage samples with various fungal root diseases in WA during 2005-2007
Incidence of various fungal diseases during 2005-2007
2005 2006 2007
Average [Range]
% samples Average [Range]
% samples Average [Range]
% samples
Rhizoctonia bare-patch
6 [0-47] 59 15 [0-72] 92 24 [0-70] 91
Fusarium crown rot
2 [0-75] 15 5 [0-64] 49 13 [0-69] 64
Take-all 3 [0-35] 25 1.2 [0-18] 55 11 [0-48] 78
Table 2. Root lesion nematode (RLN) prevalence (% samples infected) and population density (RLN/g dry soil) in WA during 2005-2007
Year % samples with
RLN
% samples with > 5 RLN / g dry
soil
RLN/g dry soil
Mean Range
2005 86 49 8 0- 51
2006 89 45 13 0-129
2007 80 34 7 0- 43
0
10
20
30
40
50
60
70
80
2005 2006 2007
pe
rce
nta
ge
cro
ps
wit
h >
5%
in
cid
en
ce
Take-all
AG8
FCR
Figure 1. Percentage crops with damaging level (> 5% incidence) of fungal disease in Western Australia during the 2005-2007 seasons. Take-all, Rhizoctonia bare patch caused by Rizoctonia solani (AG8), and Fusarium crown rot (FCR).

Agribusiness Crop Updates 2008
Crop Updates is a partnership between the Department of Agriculture and Food, Western Australia and the Grains Research & Development Corporation
82
CONCLUSION
Recent root disease surveys have identified the fungal diseases Rhizoctonia bare patch and Fusarium crown rot, and the root lesion nematode, as serious impediments to intensive cereal production, particularly in the southern region of Western Australia. The levels of severe Rhizoctonia and crown rot appear to have significantly increased when comparing results with a similar survey conducted by DAFWA in the late seventies and early eighties. However, Take-all levels appear to have declined over the past 25 years. Several paddocks badly affected by one or more of these root diseases will be monitored as ‘focus paddocks’ and this information will supplement further research to identify cultural practices and other interventions that could ameliorate the impact of these diseases on cereal production.
KEY WORDS
root disease, Rhizoctonia bare patch, Take-all, Fusarium crown rot, cereals, root lesion nematode, cereal cyst nematode
ACKNOWLEDGMENTS
Thanks to Jeremy Lemon and GID project staff for help with collecting samples and Dominie Wright and Helen Hunter for processing samples. We also thank GRDC for funding this research.
Project No.: GRDC (DAW00106, DAW00124)
Paper reviewed by: Geoff Thomas
Agribusiness Crop Updates 2008
Crop Updates is a partnership between the Department of Agriculture and Food, Western Australia and the Grains Research & Development Corporation
83
Epidemiology studies on Wheat Streak Mosaic Virus in 2007 Brenda Coutts, Geoff Strickland, Monica Kehoe, Dustin Severtson and Roger Jones, Department of Agriculture and Food, Western Australia, South Perth
KEY MESSAGES
• In August 2007, a WSMV outbreak was detected in a wheat crop in the Koorda district. At this site, the preceding summer and autumn were wet leading to an extensive ‘green ramp’ of growth of grasses and volunteer wheat in which Wheat Curl Mite (WCM) spread Wheat Streak Mosaic Virus (WSMV).
• WSMV incidence and WCM populations in the wheat crop declined rapidly with increasing distance from the virus source, an adjacent pasture with WSMV-infected volunteer wheat. Within the wheat crop margin WSMV incidence reached 40% and WCM numbers eventually reached 4,800 mites/ear.
• Alternative WSMV grass hosts identified at this or other sites in 2007 were annual ryegrass, barley grass, small burr grass, stink grass, wild oats and witch grass.
AIMS
Only one wheat crop with a high Wheat Streak Mosaic Virus (WSMV) incidence was recorded in 2007. This is attributable to an extremely dry period preceded the growing season in most grainbelt regions. The infected site near Koorda in the eastern central low rainfall zone was exceptional in that it was in a locality that experienced a series of isolated thunderstorms in summer and autumn (cyclonic rains). This article reports a case history study at this WSMV outbreak site where the wheat curl mite (WCM) spread into a wheat crop (cv. Machete) from an adjacent infected pasture. Outside of growing season surveys in 2007 for alternative grass and volunteer cereal hosts of WSMV and WCM are also reported here.
METHOD
Gradients were constructed to demonstrate the effect of proximity to virus source on spread of the virus and its mite vector into the wheat crop. Samples for WSMV testing consisted of one shoot/plant. Wherever possible, random samples were taken from one plant every five paces. The samples were sent to the laboratory for virus testing. To estimate WCM population densities, samples of randomly collected plants were transported to the laboratory where the mites were counted under a microscope. Counts were done on the uppermost leaf blade near the sheath on each plant or, when wheat plants were in ear, on five grains/ear. Some sub-samples of mites collected from wheat and grasses were sent to the Centre for Environmental and Adaptation Research at the University of Melbourne for species identification using molecular methods.
RESULTS
Outbreak site
The infected wheat crop consisted of a 300 m wide strip running west to east. The prevailing wind blew along the length of this strip. On its north side, there was a pasture consisting of volunteer wheat and other grass species (the 2006 crop in this paddock was wheat). When the site was visited in September wheat plants with WSMV symptoms were concentrated close to the fence line with their incidence declining further into the crop. The sample test results revealed a marked decline in WSMV incidence over distance from the fence line, dropping from 40% to 2% over 200m (Figure 1).
Many volunteer wheat plants in the adjacent pasture showed typical WSMV symptoms, but no symptoms were evident in any of the grasses. The incidences of WSMV detected in 100 shoots each of volunteer wheat, barley grass (Hordeum sp.) and annual ryegrass (Lolium rigidum) were 19%, 4%, and 2% respectively, while it was 1% in 160 shoots of wild oats (Avena fatua). No WSMV was detected in 150 shoots of windmill grass (Chloris sp.).

Agribusiness Crop Updates 2008
Crop Updates is a partnership between the Department of Agriculture and Food, Western Australia and the Grains Research & Development Corporation
84
WCM numbers were monitored three times in the wheat crop and on each occasion plants were collected randomly at each of four positions (10 m, 30 m, 80 m and 180 m). WCM was most abundant within 30 m of the fence line where the population density increased dramatically late in the growing season (Figure 2). WCM numbers were always minimal at and beyond 80 m from the fence line. On the first two dates when mites were counted, the highest WCM numbers were 15 mites/leaf and 22/leaf respectively. On third date, however, the WCM population density closest to the fence line reached 4,800/ear.
0
5
10
15
20
25
30
35
40
0 50 100 150 200 250 300
Distance from fence-line (m)
% W
SM
V i
ncid
en
ce
Figure 1. Gradient of infection from the fence line adjacent to the WSMV-infected pasture into the crop of wheat.
0
10
20
30
0 20 40 60 80 100 120 140 160 180
Distance from fence line (m)
Me
an
WC
M p
er
lea
f
0
500
1,000
1,500
2,000
2,500
3,000
3,500
4,000
4,500
Me
an
WC
M p
er
ea
r (2
5 O
ct.
)
21-Aug-07
12-Sep-07
25-Oct-07
Figure 2. Density of WCM on wheat plants out from the fence line adjacent to the WSMV-infected pasture into the wheat crop.
Other sites
Over summer and autumn in 2007, potential WSMV alternative hosts were sampled at 67 other sites (5,583 samples), mostly roadside ditches and verges. Most samples were healthy, but WSMV was detected at isolated sites in annual ryegrass, small burr grass (Tragus australianus), stink grass (Eragrostis cilianensis) and witch grass (Panicum capillare) at incidences of 10%, 6%, 2% and 5% respectively.

Agribusiness Crop Updates 2008
Crop Updates is a partnership between the Department of Agriculture and Food, Western Australia and the Grains Research & Development Corporation
85
During 2007, potential hosts of WCM were inspected for the presence of mites across a wide area of the wheatbelt. Wheat, barley and oats, and seven grass species were sampled from farms and roadsides at 27 sites and 10-20 plant tillers or seed ears were inspected per site. Apart from the outbreak site at Koorda, WCM was confirmed on only four other occasions, all on wheat. A few grass samples (Digitaria spp., windmill grass, witch grass and annual ryegrass) contained unidentified species of eriophyid mites, some of which potentially were WCM.
CONCLUSION
The WSMV outbreak was preceded at the affected site by sufficient summer and early autumn rainfall to establish a substantial ‘green ramp’ of grasses and volunteer cereals, in which WCM became abundant and a WSMV epidemic developed. This ‘green ramp’ persisted through to the late autumn sowing of wheat in the adjacent paddock. In this outbreak, the principal source of WSMV and WCM was external to the crop (i.e. an adjacent pasture) rather than internal (i.e. seed-borne WSMV infection). The mites spread the virus from the pasture into the wheat crop causing a 40% virus incidence at the crop margin, but much less infection deeper into the crop.
This outbreak resembles those in the Merredin district in 2006 in that a combination of high temperatures and sufficient pre-season rainfall generated a substantial ‘green ramp’ of grasses and volunteer cereals before wheat was sown in late autumn, providing ideal conditions for WCM to multiply and spread WSMV. However, where grasses and volunteer cereals were not controlled adequately within paddocks in 2006, internal virus sources resulted in widespread WSMV infection across the whole paddock rather than the 2007 scenario of spread mainly into the crop margin. The 2006 generalised spread scenario can cause major yield loss.
KEY WORDS
Wheat Streak Mosaic Virus, wheat curl mite
ACKNOWLEDGMENTS
We thank the farmers who provided access to their farms and associated cropping information, Michelle Schiffer for help with WCM identifications, Sandy Lloyd for help in identifying grass species, and Peter Mangano, Bill MacLeod and Vanessa Stewart for collecting some of the samples and liaison with farmers. Thanks to GRDC for providing funding.
Project No.: DAW00106 ‘Managing disease constraints in Western Region farming systems’
Paper reviewed by: John Botha

Agribusiness Crop Updates 2008
Crop Updates is a partnership between the Department of Agriculture and Food, Western Australia and the Grains Research & Development Corporation
86
Bacterial diseases that affect WA export hay quality
Dominie Wright and Megan Jordan, Department of Agriculture and Food, Western Australia, South Perth
KEY MESSAGES
• Stripe blight and halo blight are the two bacterial diseases of oat in Western Australia.
• The yield loss associated with these diseases is thought to be small but is unknown due to the lack of research in this area.
• The main concern for Western Australia is the impact on the export hay market, due to the loss of quality in the leaf greenness because of disease.
• A seed test has been developed for growers to determine if seed infection is present and whether this seed can be used. At present the impact of seed infection on yield loss is not known.
INTRODUCTION
There are two main bacterial diseases of oats in Western Australia. These are stripe blight caused by Pseudomonas syringae pv. striafaciens and halo blight caused by P. syringae pv. coronafaciens. Stripe blight appears to be more prevalent in Western Australia than halo blight.
As their names suggest, the two pathogens are very similar. Both pathogens belong in the P. syringae group of bacteria. However, they do have a different host range and cause different symptoms on the hosts. These bacteria are not toxic to animals but cause quality loss in the plants through loss of green leaf area.
SYMPTOMS
The two diseases have different symptoms, and can be readily distinguished from each other during early infection. Stripe blight, as the name suggests, produces long lesions that lengthen. The lesions can look water-soaked initially and then become red-brown stripes and often have yellow margins. The disease starts at the leaf tip so can be mistaken for a tip burn due to chemicals or nutrient deficiency. The symptoms for stripe blight are often along the edges of the leaves except under heavy disease pressure where the whole leaf will appear blighted. Stripe blight can often be mistaken for the disease red leather leaf which does not occur in Western Australia. Halo blight appears as a pale green to straw coloured oval spot with a yellow halo. The spots tend to occur in the middle of the leaf. The centre of the spot becomes depressed over time and turns grey in colour and dry. The spots have a pale green to yellow margin that can be quite wide.
DISEASE CYCLE
The primary infection occurs from stubble, volunteer crops or from the seed. After primary infection occurs in the crop, secondary infection will spread throughout the canopy. The bacteria enter through the stomata of the leaves or through wounds. They are spread by wind and rain. If there is an exudate (which can happen with stripe blight under humid conditions), insects moving around in the crop will also spread the bacteria between plants.
HOST RANGE
Stripe blight has only been detected on oat in Western Australia. It has also been detected in South Australia and occasionally in NSW. However, in parts of Europe, Northern and Southern America, Japan and Korea and in Africa the pathogen has been detected on barley and maize.
The literature shows that halo blight has a wider host range (although it has only been detected on oat in Western Australia). Wild oat (Avena fatua) and rye (Secale cereale) are also major hosts for the pathogen. Minor hosts include barley (Hordeum vulgare), wheat (Triticum aestivum), maize (Zea mays) and most of the grasses such as pairiegrass (Bromus catharticus) and perennial ryegrass (Lolium perenne).

Agribusiness Crop Updates 2008
Crop Updates is a partnership between the Department of Agriculture and Food, Western Australia and the Grains Research & Development Corporation
87
In North America, halo blight is very common in oat. If infection occurs during head emergence, the yield is reduced. However, infection earlier in the season appears to have little impact on yield (Dickson, 1947). There is no literature on the impact of stripe blight on yield. It is likely that infection during head emergence will result in a yield penalty. If infection earlier in the season is unlikely to result in a yield penalty.
STRIPE BLIGHT IN WESTERN AUSTRALIAN CROPS
Over the last five years there appears to have been an increase in the incidence of the disease in crops. This is based on the number of samples submitted to AGWEST Plant Laboratories and phone calls received describing symptoms. In 2007, a large number of growers in the central region had stripe blight in oat crops. This increase is most likely due to a number of factors:
1. An increase in planting density. This creates a more humid canopy within the crop and bacteria thrive in humid conditions.
2. An increase in the inputs into the system such as nitrogen. Again, this increases the crop canopy and the lushness of the leaves.
3. There has been an increase in the level of infection in the seed being used. Literature suggests that only circumstantial evidence exists to suggest that the disease is seedborne. However, a number of authors have stated that it does occur. Dickson (1947) found that spikelet infection occurs as the head is emerging from the boot, and leads to infection on the hull and pericarp of the seed. Halo blight has been detected on the glumes of rye in the US.
Due to the likelihood that the disease is seedborne, a seed test has been developed to detect P. syringae in oats. Currently, the test can detect a level of 1% infection in 250 g of seed. However, work is required to determine how a 1% infection in seed translates to yield loss or marketability for hay crops. There is little published evidence of seed transmission, however, the pattern of spread and occurrence in WA is indicative of seed-borne transmission.
CONCLUSION
There are no chemicals registered for control of bacterial diseases in oat. Fungicides do not control diseases caused by bacteria. The most effective control would be the use of rotation (two years with a non cereal crop), and use clean seed from an uninfected crop.
KEY WORDS
oat, Avena sativa, Pseudomonas syringae pv. striafaciens, Pseudomonas syringae pv. coronafaciens, stripe blight, halo blight, bacterial disease
REFERENCES
Dickson (1947). Diseases of Field Crops. McGraw – Hill Publication. London 1956.
ACKNOWLEDGMENTS
Thanks to Penny Goldsmith for her help in developing the seed test and Bill MacLeod for providing the money and the time for the work to be done, through the GRDC funded pathology project.
Project No.: DAW 00159
Paper reviewed by: Vivien Vanstone and Bill MacLeod

Agribusiness Crop Updates 2008
Crop Updates is a partnership between the Department of Agriculture and Food, Western Australia and the Grains Research & Development Corporation
88
Hardpan penetration ability of drought-stressed wheat under pot and field conditions Xinhua He1, Eli Manyol1, Song-Ai Nio1, Imran Malik1, Tina Botwright-Acuña1,2 and Len Wade1,3 1School of Plant Biology, University of Western Australia, WA 2Tasmanian Institute of Agricultural Research, University of Tasmania, TAS 3E.H. Graham Centre, Charles Sturt University, NSW
KEY MESSAGES
A modified artificial thin wax layer was used to evaluate effects of hardpan and water stress on root penetration ability and root dry matter (DM) production of 24 wheat cultivars and breeding lines under drought-stressed (DS) and well-watered (WW) conditions in a controlled environment.
Field experiments were performed to relate differences in root penetration ability through the wax layer technique to wheat rooting depth and above-ground DM production in two contrasting soil types (sandy duplex vs red clay) at Merredin, Western Australia.
Genotypic variation in the ability of wheat roots to penetrate soil hardpans was observed under both controlled and field conditions. Our results may provide potential application in interpreting the field performance of wheat growing in hostile soils and in identifying promising cultivars or lines for future breeding programs.
INTRODUCTION
Hardpans of compacted soil generally form at depths of 0.15 to 0.25 m (Hamblin et al. 1982), in response to traffic from farm machinery and livestock, intensive cropping and inappropriate soil management (Hamza and Anderson 2005). It is estimated that in south-western Australia 24% of agricultural land is highly susceptible and 43% moderately susceptible to subsoil compaction (D. Van Gool, DAFWA, personal communication). Hardpans are undesirable as they limit the ability of wheat roots to access water and nutrients at depth. We have previously developed and validated a laboratory-based method (thin wax-layer) for assessing the ability of wheat genotypes to penetrate hardpans under contrasting water regimes (Botwright Acuna and Wade 2005). However, no attempt has been made to relate differences in root penetration ability identified using the laboratory-based method with wheat growth in the field. Consequently, the aim of the present study was to further assess the validity of the thin wax-layer technique by growing 24 wheat cultivars and breeding lines (entries, thereafter) in two contrasting soil types at Merredin, Western Australia. Specifically we: (1) evaluated the ability of roots to penetrate a thin wax layer when grown under drought-stressed and well-watered conditions in pots in the laboratory; (2) compared wheat rooting in two contrasting soil types (sandy duplex vs red clay); and (3) related differences in root penetration ability through thin wax layers to their rooting depth in the field.
METHOD
Measuring wheat root penetration using the wax-layer technique
A total of 24 wheat entries were selected for use in the present study (Table 1; Acuna et al. 2008). Wheat was grown in PVC pots (0.1 diameter and 0.5 m tall) containing soil with a simulated hardpan (35:65 = wax:petroleum jelly, 3 mm thick and 100 mm diameter) at 0.24 m from the surface of the soil. This artificial hardpan provides sufficient resistance to root growth to quantify root penetration ability of wheat (Botwright Acuna and Wade 2005). Plants were grown in controlled conditions with a 21/16oC day/night temperature, a 10 h day length and 70% relative humidity. The soil was a mix of loam, river sand and sawdust (50:40:10, pH 5.5-6.5) and amended with appropriate macro- and micro-nutrients. Five experiments (runs) were undertaken with two different water regimes of drought-stressed (DS) and well-watered (WW) conditions, respectively. Soil columns were weighed every two to three days to measure plant water-use. Plants were harvested at 28, 36, 38, 49 and 52 days after sowing (DAS). Numbers of seminal and nodal root axes were counted from the soil column at depths of 0.0–0.12 and 0.12–0.24 m above the wax-layer; and below the wax-layer. Root and shoot DM was measured after
oven-drying at 70C for 24 hrs.
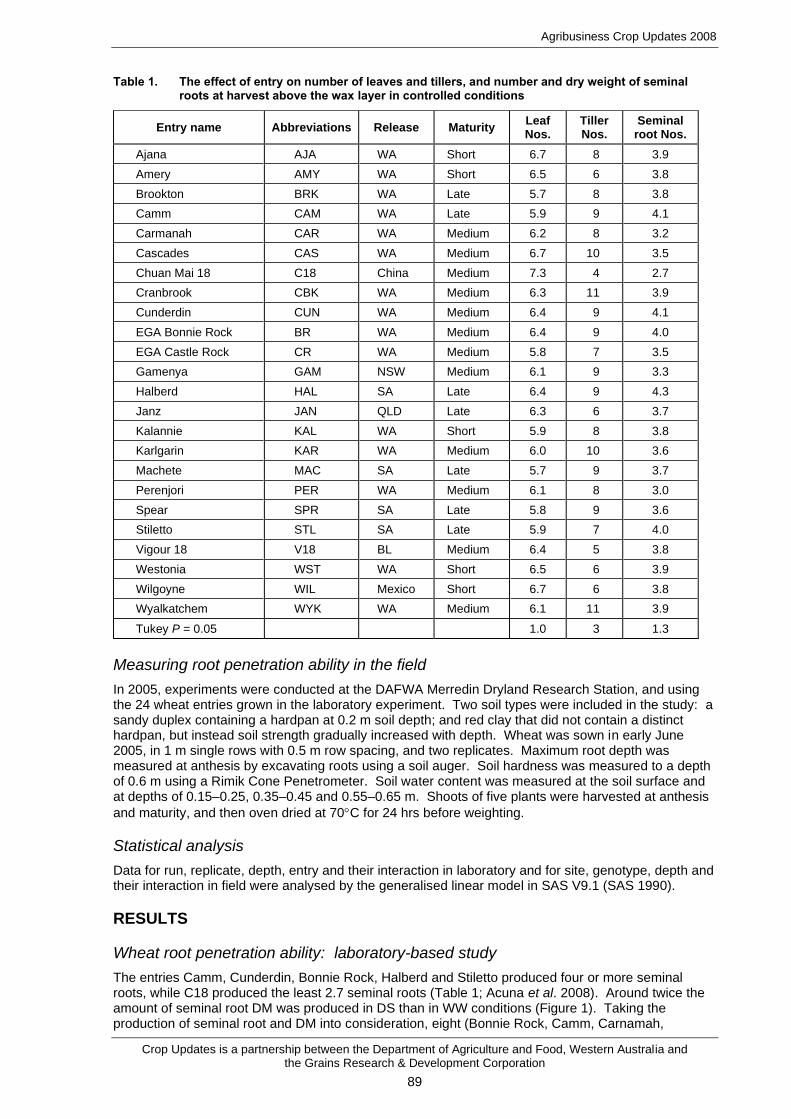
Agribusiness Crop Updates 2008
Crop Updates is a partnership between the Department of Agriculture and Food, Western Australia and the Grains Research & Development Corporation
89
Table 1. The effect of entry on number of leaves and tillers, and number and dry weight of seminal roots at harvest above the wax layer in controlled conditions
Entry name Abbreviations Release Maturity Leaf Nos.
Tiller Nos.
Seminal root Nos.
Ajana AJA WA Short 6.7 8 3.9
Amery AMY WA Short 6.5 6 3.8
Brookton BRK WA Late 5.7 8 3.8
Camm CAM WA Late 5.9 9 4.1
Carmanah CAR WA Medium 6.2 8 3.2
Cascades CAS WA Medium 6.7 10 3.5
Chuan Mai 18 C18 China Medium 7.3 4 2.7
Cranbrook CBK WA Medium 6.3 11 3.9
Cunderdin CUN WA Medium 6.4 9 4.1
EGA Bonnie Rock BR WA Medium 6.4 9 4.0
EGA Castle Rock CR WA Medium 5.8 7 3.5
Gamenya GAM NSW Medium 6.1 9 3.3
Halberd HAL SA Late 6.4 9 4.3
Janz JAN QLD Late 6.3 6 3.7
Kalannie KAL WA Short 5.9 8 3.8
Karlgarin KAR WA Medium 6.0 10 3.6
Machete MAC SA Late 5.7 9 3.7
Perenjori PER WA Medium 6.1 8 3.0
Spear SPR SA Late 5.8 9 3.6
Stiletto STL SA Late 5.9 7 4.0
Vigour 18 V18 BL Medium 6.4 5 3.8
Westonia WST WA Short 6.5 6 3.9
Wilgoyne WIL Mexico Short 6.7 6 3.8
Wyalkatchem WYK WA Medium 6.1 11 3.9
Tukey P = 0.05 1.0 3 1.3
Measuring root penetration ability in the field
In 2005, experiments were conducted at the DAFWA Merredin Dryland Research Station, and using the 24 wheat entries grown in the laboratory experiment. Two soil types were included in the study: a sandy duplex containing a hardpan at 0.2 m soil depth; and red clay that did not contain a distinct hardpan, but instead soil strength gradually increased with depth. Wheat was sown in early June 2005, in 1 m single rows with 0.5 m row spacing, and two replicates. Maximum root depth was measured at anthesis by excavating roots using a soil auger. Soil hardness was measured to a depth of 0.6 m using a Rimik Cone Penetrometer. Soil water content was measured at the soil surface and at depths of 0.15–0.25, 0.35–0.45 and 0.55–0.65 m. Shoots of five plants were harvested at anthesis
and maturity, and then oven dried at 70C for 24 hrs before weighting.
Statistical analysis
Data for run, replicate, depth, entry and their interaction in laboratory and for site, genotype, depth and their interaction in field were analysed by the generalised linear model in SAS V9.1 (SAS 1990).
RESULTS
Wheat root penetration ability: laboratory-based study
The entries Camm, Cunderdin, Bonnie Rock, Halberd and Stiletto produced four or more seminal roots, while C18 produced the least 2.7 seminal roots (Table 1; Acuna et al. 2008). Around twice the amount of seminal root DM was produced in DS than in WW conditions (Figure 1). Taking the production of seminal root and DM into consideration, eight (Bonnie Rock, Camm, Carnamah,

Agribusiness Crop Updates 2008
Crop Updates is a partnership between the Department of Agriculture and Food, Western Australia and the Grains Research & Development Corporation
90
Halberd, Janz, Machete, Stiletto, and Wilgoyne) of the 24 entries had superior root penetration ability in both well-watered and drought-stressed conditions, whilst three (C18, Cranbrook and Karlgarin) failed to penetrate the wax layer and died afterwards under drought-stressed conditions (Figure 1).
WW number of seminal roots
0 1 2 3 4
DS
nu
mb
er
of
sem
inal ro
ots
0
1
2
3
4
AJA
AMY
BKT
CAM
CARCAS
C18
CUN
BR
CR
GAM
HAL
JAZKAL
KAR
MACPER
SPRSTL
CBK
V18
WST
WIL
WYK
(a)
WW seminal DM (mg)
0 25 50 75 100 125 150 175 200
DS
sem
inal D
M (
mg
)
0
50
100
150
250
AJA
AMY
BKT
CAM
CAR
CAS
C18
CUN
BR
CR
GAM
HAL
JAZ
KAL
KAR
MAC
PER
SPR
STL
CBK
V18
WSTWIL
WYK
(b)
WW number of seminal roots
0 1 2 3 4
DS
nu
mb
er
of
se
min
al ro
ots
0
1
2
3
4
AJA
AMY
BKT
CAM
CARCAS
C18
CUN
BR
CR
GAM
HAL
JAZKAL
KAR
MACPER
SPRSTL
CBK
V18
WST
WIL
WYK
(a)
WW seminal DM (mg)
0 25 50 75 100 125 150 175 200
DS
se
min
al D
M (
mg
)
0
50
100
150
250
AJA
AMY
BKT
CAM
CAR
CAS
C18
CUN
BR
CR
GAM
HAL
JAZ
KAL
KAR
MAC
PER
SPR
STL
CBK
V18
WSTWIL
WYK
(b)
Figure 1. Effect of water regime on seminal root number (a) and dry matter below the wax layer (b) for 24 wheat entries. Refer to Table 1 for entry abbreviations. DS, drought stress; WW, well-watered. LSD’s: (a) DS = 1.5, WW = 3.0; (b) DS = 190, WW = ns.
Root penetration ability in field trials
In the field, maximum rooting depth varied between soil type and wheat entries. For example, rooting depth varied from 0.35 to 0.62 m in the sandy duplex (Figure 2), and from 0.42 to 0.65 m in the red clay soil (data not shown, refer to Acuna et al. 2008). There was a positive relationship (P = 0.02, r2 = 0.28) between root depth and above-ground DM at anthesis in the sandy duplex site (Figure 2a; Acuna et al. 2008), but not in the red clay (data not shown, refer to Acuna et al. 2008). Among the 24 wheat entries, four entries (Brookton, Cunderdin, Halberd and Vigour 18) in the sandy duplex and five entries (Brookton, Cunderdin, Halberd, Vigour 18 and Wilgoyne) in the red clay had deeper roots than other entries (Figure 2b). As four (Brookton, Cunderdin, Halberd and Vigour 18) of the eight superior entries also showed superior root penetration ability at both sites in the field, there was an overall consistency. However, there were several exceptions, which we assume was due to root ‘escape’, via rapid root elongation to depth before the soil dried and penetration resistance increased.
CONCLUSION AND FUTURE WORK
Results demonstrate differences in the rooting ability of 24 wheat cultivars and breeding lines to penetrate the modified thin wax layer under DS and WW conditions in the controlled environment. Results have also shown differences in both rooting depth and above-ground DM in the field with two contrasting soil types (a sandy duplex and a red clay) at Merredin, Western Australia.
Further work is required to validate the use of thin wax-layer technique for assessing wheat root penetration through soil hardpans. Future studies will include: (1) A mechanistic study to confirm the benefits of rapid root elongation ability, hardpan penetration ability, or both, to improve access of roots to water and nutrients from deeper soil layers. (2) Screening doubled-haploid lines (DHLs) from the Cranbrook (poor) x Halberd (good) population, in order to identify genetic control of these traits, including quantitative trait loci. (3) Field validation studies on sandy duplex and red clay soils at Merredin, using contrasting cultivars (Cranbrook and C18 [poor] vs Halberd and Bonnie Rock [good]), and contrasting DHLs from the Cranbrook/Halberd population. In conjunction with previous experiments (Botwright Acuna and Wade 2005; Botwright Acuna et al. 2008), these data will permit assessment of genotype by environment interaction for root traits, identification of desired traits and lines for greater root access and water and nutrient acquisition from depth, and the likely benefits from incorporating these traits in a breeding program.

Agribusiness Crop Updates 2008
Crop Updates is a partnership between the Department of Agriculture and Food, Western Australia and the Grains Research & Development Corporation
91
Above-ground DM (g m-2)
150 200 250 300 350 400 450
Ro
ot
dep
th (
m)
AJA
AMY
BRK
CAM
CAR
CAS
C18
CRA
CUN
BR
CR
GAM
HAL
JAN
KAL
KAR
MAC
PER
SPR
STLV18
WST
WIL
WYK
(a)
Root depth on red clay (m)
0.4 0.5 0.6 0.7
Ro
ot
dep
th o
n s
an
dy d
up
lex (
m)
0.4
0.5
0.6
0.7
CAM
CAR
CAS
C18
CBK
CUN
BR
CR
GAM
HAL
JAN
KAL
KAR
MAC
PER
SPR
STLV18
WST
WIL
WYK
(b)
Figure 2. Relationship between root depth and above-ground DM at maturity for sandy duplex (P = 0.02,
r2 = 0.28) (a), and site entry interaction for root depth at two sites (b) at Merredin in 2005. LSD = 0.15 at P = 0.05. Refer to Table 1 for entry abbreviations.
REFERENCES
Botwright Acuna, T. and Wade, L.J. (2005). Root penetration ability of wheat through thin wax layers under drought and well-watered conditions. Australian Journal of Agricultural Research 56: 1235-1244.
Botwright Acuna, T., Pasuquin, E. and Wade, L.J. (2008). Genotypic differences in root penetration ability of wheat through thin wax layers in contrasting water regimes and in the field. Plant and Soil (DOI: 10.1007/s11104-007-9428-9).
Hamblin, A.P., Tennant, D. and Cochrane, H. (1982). Tillage and the growth of a wheat crop in a loamy sand. Australian Journal of Agricultural Research 33: 887-897.
Hamza, M. and Anderson, W. (2005). Soil compaction in cropping systems: a review of the nature, causes and possible solutions. Soil Tillage Research 82: 121-145.
SAS (1990). SAS/STAT user’s guide, Version 6. SAS Institute, Cary, NC, USA.
KEY WORDS
hardpan, root penetration ability, seminal roots, water-stressed, wheat
ACKNOWLEDGMENTS
This work is funded by the GRDC Initiative ‘Root Systems for Australian Soils’ (UWA00090).
Project No.: GRDC UWA00090
Paper reviewed by: Dr Louise Barton, The University of Western Australia
Agribusiness Crop Updates 2008
Crop Updates is a partnership between the Department of Agriculture and Food, Western Australia and the Grains Research & Development Corporation
92
Calculating the risk − the SEPWA Harvest Calculator
Nigel Metz, South East Premium Wheat Growers Association
KEY MESSAGES
• Yield decreases with each day a ripened crop remains unharvested. Previous research had quantified yield loss at approximately 0.5% per day for cereal crops along the south coast of WA.
• The SEPWA Harvest Calculator has been developed to allow growers to apply research results to individual harvest programs to evaluate alternative management approaches.
• The calculator is especially useful for growers who have regularly had their harvest programs slowed due to high grain moisture levels. To the calculator assess the net benefit of adopting a grain moisture management technique aimed at speeding up their harvest program.
BACKGROUND
The SEPWA Harvest Calculator has been developed by the South East Premium Wheat Growers Association (SEPWA) as part of the GRDC project ‘Opening the Harvest Window – for Yield, Quality, and Profit on the South Coast of WA’. The framework is based on information published in the booklet ‘The WA Guide to High Moisture Harvest Management, Grain Storage and Handling’. This booklet contains the technical background to the management approaches of high moisture grain harvesting. Growers should consult this booklet before adopting any management changes to their harvest program. Copies of the booklet are free from The CBH Group, Ground Cover direct or on line at: www.sepwa.org.au.
The SEWPA Harvest Calculator is designed to assist grain growers to explore the costs and benefits of harvesting at higher grain moisture levels. The calculator is primarily aimed at wheat and barley grain growers in the south coast region of Western Australia and assesses potential to speed up harvest by commencing the program earlier and working for longer hours each day. Growers in other regions of Australia may also find the calculator useful for harvest management planning.
The harvest calculator can be accessed from the SEPWA home page: www.sepwa.org.au by following the link on the right hand side to the ‘SEPWA Harvest Calculator’ or via direct link: http://www.sepwa.org.au/harvestcalculator/index.html.. It is numeracy based and will operate at slow line speeds often experienced in country WA.
THE BASIC WORKINGS OF THE SEPWA CALCULATOR
Yield decreases with each day a post maturity crop remains unharvested field. Research in Esperance has shown daily weight losses for cereal crops can be between 0.18 to 0.75% of yield. The Calculator has a default average daily weight loss figure of 0.5%, however this can be altered according to specific circumstances.
The calculator considers that the earlier and additional daily harvest hours (in the mornings and evenings when grain moisture is higher) limits the total daily weight loss by completing the harvest program at a faster rate. On the other hand, the additional grain harvested each day at the higher moisture content has a management cost, be it via blending, aerated storage or drying. When asked to calculate the Harvest Calculator gives the output of two alternative management approaches to a growers’ individual harvest program. Efficiencies arising from reduced stop/start frequencies in the harvest program are not considered in the output.
Growers customise the calculator to their harvest program
The SEPWA Harvest Calculator allows growers to customise the input information for their individual cereal harvest program. For example the size of the cereal harvest program, average yield, harvest capacity and costs and likely daily harvest hours are considered. The calculators output figures compare the net financial gain (or loss) of harvesting only under the traditional 12.5% moisture level, to that of the traditional 12.5% moisture level plus the additional hours of grain harvested at higher moisture. The yield benefits and cost of adopting the chosen high moisture management are built into
Agribusiness Crop Updates 2008
Crop Updates is a partnership between the Department of Agriculture and Food, Western Australia and the Grains Research & Development Corporation
93
this net financial comparison. Growers can run simulations of various cost, price and yield scenarios then view the effect on their net harvest returns with alternative harvest management approaches.
What about quality downgrades?
Grain quality downgrades from weather damage has long been an issue for grain growers. The most feasible means for growers to avoid quality downgrading is by harvesting at the earliest possible date. In the calculator output, there is a scenario analysis for a weather event on the 12th day of the harvest program. The calculator provides a sensitivity analysis of this potential weather event causing a value downgrading of between $5 and $30 per tonne. The net dollar gain/loss from the high moisture management approach is then compared for the whole harvest program in relation to this quality downgrading value.
Other features
Combined with the calculator as part of the web site is a page where south coast growers may assess their risk of grain quality losses and the likelihood for delay in harvest from rainfall events. This is provided via harvest rainfall records for the whole south coast region with the number of rainy days as well as historical rainfall years that have had less than 25 mm, 25 mm to 50 mm and greater than 50 mm of rain during November and December. As well as this data, the delivery history for wheat to Esperance and Albany for the past five years can be viewed for quality parameters. In combination with this there are also the past 10 years’ grain prices and discounts from premium grade. Finally there is a built in tool for converting grain prices (being FIS or FOB) to a net farm gate price. This information is important in considering the various simulations a grower many calculate for their harvest program. For example the weather data will help them assess their potential daily harvest hours and rainfall risk.
CONCLUSION
Growers are often surprised by the effect of different harvest management options on their individual business cost structure as shown by the harvest calculators output. All growers have, at some stage, experienced some form of crop loss which they have lamented as lost income. The SEPWA harvest calculator allows growers to context their risk profile of this and then run simulations with real figures that relate to their production system and crop income situation.
KEY WORDS
SEPWA, harvest management, grain moisture, crop loss
ACKNOWLEDGMENTS
IT design and support − Michael Fewings – Strike one. Weather data – David Hall, DAFWA.
Project No.: SEP 00003
Paper reviewed by: Harvey Jones, DAFWA

Agribusiness Crop Updates 2008
Crop Updates is a partnership between the Department of Agriculture and Food, Western Australia and the Grains Research & Development Corporation
94
The relationship between grain moisture and atmospheric conditions in cereal crop harvesting on the South Coast of WA
Nigel Metz, South East Premium Wheat Growers Association (SEPWA)
KEY MESSAGES
• Grain moisture peaks in the hours after sunrise: Maximum grain moisture levels where observed at all sites (for the 24 hour daily cycle) between 06:30 and 10:00 in the morning.
• Grain moisture is on a time lag following atmospheric relative humidity (RH): In general terms grain moisture at all sites moved in a several hour time lag to the cyclic movement atmospheric RH.
• Harvesting conditions can improve later into the evening: Heat stored in the soil can be radiated back into the crop later at night when the sea breeze eases and this tends to improve harvesting conditions.
• Increases in moisture receival limits have increased available harvest hours: The observation period at the Carmody site showed that by increasing the maximum moisture limit from 12.5% to 13.5% the available harvest hours was increased from 2.5 hours to 10.5 hours for the 24 hr period.
AIMS
To determine more accurately the interaction between grain moisture and atmospheric conditions so growers can optimising their daily cereal crop harvest operations.
METHOD
During the harvest season of 2007, four round the clock harvest trials were conducted to quantify the relationship between ambient air conditions and grain moisture. The four trial sites were based in the Esperance region in two wheat and two barley crops. The other main variable in the trial design was the distance of the production environment from the ocean. For this reason each of the trials sites are described in terms of location as distance from the ocean.
The hosting farmers harvested their crop as per normal. Outside this time intermittent harvesting was continued to collect grain samples at hourly intervals. Atmospheric observations and grain sampling started at 0700 the first day and continued for at least the following 30 hours.
Atmospheric conditions were assessed by micro weather stations to monitor temperature and relative humidity (RH). These micro weather stations were I-button semi conductors encased in a stainless steel capsule, around the size of a 5¢ piece and. Three micro weather stations were installed at each site housed in a section of 50 mm slotted PVC pipe. The first was in the top 50 mm of soil; the second was located at the height of the grain heads in the crop; and the third sensor was set at 1000 mm above ground level for comparison with standard weather measurements taken by regional weather stations.
General harvest-ability of the crop was noted throughout the observations of crop cutting at the header front, ground speed/crop throughput in t/hr, engine horse power requirement and grain sample characteristics (indicating grain separation and threshing performance).
From these observations a time log of grain moisture, atmospheric conditions and harvest ability characteristics was produced for data interpretation.

Agribusiness Crop Updates 2008
Crop Updates is a partnership between the Department of Agriculture and Food, Western Australia and the Grains Research & Development Corporation
95
RESULTS
Trial Site #1 – Carmody – 02/11/07 – Corner of Cascade and Edwards Rd – 53 km from the ocean
Crop type: Baudin Barley; Yield: 2 t/ha; Crop height: 300 mm
Trial observations: Day 1 began with a cool morning with a light NE breeze and the day later warmed to a top of 32oC. Just prior to sunset temperature dropped rapidly coinciding with a rapid increase of RH. Harvest conditions became tough in the hour after sunset and header ground speed needed to be decreased to accommodate this. The temperature continued to decline to minimum of 7.7oC at 06:00 on day 2 and this coincided with the toughest harvesting conditions. Day 2 was a fine day with the temperature reaching 26.2oC when the trial concluded at 13:00.
Carmody's barley site - weather conditions and grain moisture
04 - 05/11/07
5
10
15
20
25
30
7:57 9:37 11:17 12:57 14:37 16:17 17:57 19:37 21:17 22:57 0:37 2:17 3:57 5:37 7:17 8:57 10:37 12:17
time (WDT)
Tem
pera
ture
an
d G
rain
MC
%
0
20
40
60
80
100
RH
%
Temperature Grain MC % RH %
Sunset Sunrise
Moderate NE breezeBreeze
increasing
SE cool
change
Breeze
moderated and
moved ENE
Moderate ENE
breeze
No dew
Figure 1.
Trial Site #2 – Atherton’s – 10 – 11/11/07 − Middle Rd Jerdacuttup, Adjacent to the Oldfield river reserve, 16 km from the ocean
Crop type: Baudin Barley; Yield: 3.5 t/ha; Crop height: 300 mm
Trial observations: At the start of the trial there was 100% cloud cover with occasional drizzle. As the cloud started to break around 10:30 harvest conditions soon improved, despite a cool SSE breeze. A maximum temperature of 23.2oC was reached at 14:09. Tough harvesting conditions were experienced through the night due to a cool southerly breeze. Day 2 was clear with improved harvesting conditions from 08:00 onwards.

Agribusiness Crop Updates 2008
Crop Updates is a partnership between the Department of Agriculture and Food, Western Australia and the Grains Research & Development Corporation
96
Atherton's barley site - weather conditions and grain moisture
10 - 11/11/07
5
10
15
20
25
30
6:49 8:29 10:09 11:49 13:29 15:09 16:49 18:29 20:09 21:49 23:29 1:09 2:49 4:29 6:09 7:49 9:29 11:09 12:49
time (WDT)
Tem
pera
ture
an
d G
rain
MC
%
0
20
40
60
80
100
RH
%
Temperature Grain MC % RH %
Cool SSE breeze,
strengthening
Breeze
easing
SunsetSunrise
SE breeze
occasional
drizzle
Cool ESE breeze
Very light
dew
Still
Figure 2.
Trial Site # 3 – Stewart’s – 15 - 16/11/07 − Top of Wittenoom Hills Rd, Wittenoom Hills, 50 km from the ocean
Crop type: Sapphire Wheat; Yield: 3.3 t/ha; Crop height: 550 mm
Trial observations: The morning of day 1 was fully overcast with a SSE breeze and occasional misty drizzle. By 12:00 there was a completely clear sky with optimal harvesting conditions. After sunset the breeze moderated and moved E as the evening progressed. Although harvest conditions were tough following sunset they improved latter in the night. Day 2 was warm, with a light easterly breeze making for optimal harvesting conditions.
Stewart's wheat site - weather conditions and grain moisture
15 -16/11/07
5
10
15
20
25
30
7:05 8:45 10:25 12:05 13:45 15:25 17:05 18:45 20:25 22:05 23:45 1:25 3:05 4:45 6:25 8:05 9:45 11:25 13:05 14:45
time (WDT)
Tem
pera
ture
an
d G
rain
MC
%
0
20
40
60
80
100
RH
%
Temperature Grain MC % RH %
SE breeze
Sunset Sunrise
Light SSE
breeze, fine
misty drizzle
Very light
dew
Breeze easing
and moved E Light E breeze Still
Figure 3.

Agribusiness Crop Updates 2008
Crop Updates is a partnership between the Department of Agriculture and Food, Western Australia and the Grains Research & Development Corporation
97
Trial Site #4 – Fowler’s – 23 − 24/11/07 − Fisheries Rd 28 km East of Condingup, 18 km from the ocean
Crop type: Eagle Rock Wheat; Yield: 4.5 t/ha; Crop height: 700 mm
Trial observations: There had been heavy dew in the hours prior to commencement of the trial on day 1. Despite this harvest conditions quickly improved as the day moved towards a maximum temperature of 41.2oC at 13:38. Cool temperatures and higher RH caused tougher harvesting conditions after midnight until just after sunrise. Day 2 was hot with temperatures recorded above 45oC, giving perfect harvesting conditions not often experienced this close to the ocean.
Fowler's wheat site - weather conditions and grain moisture
23 - 24/11/07
5
10
15
20
25
30
35
40
45
6:58 8:38 10:18 11:58 13:38 15:18 16:58 18:38 20:18 21:58 23:38 1:18 2:58 4:38 6:18 7:58 9:38 11:18 12:58 14:38
time (WDT)
Tem
pera
ture
an
d G
ran
MC
%
0
20
40
60
80
100
RH
%
Temperature Grain MC % RH %
Humid SE
sea breeze
arrival
Sunset Sunrise
Light
ENE
Heavy
dew
Light NNE
breeze
SE breeze
increasing
Still
Very light
dew
Light NNE
breeze
Figure 4.
DISCUSSION AND CONCLUSION
Grain moisture peaks in the hours after sunrise (Figure 5): Maximum grain moisture levels where observed at all sites (for the 24 hour daily cycle) between 06:30 and 10:00 in the morning. Given that this is traditionally when growers would first start to assess grain moisture and commence the day’s harvest, grower’s perception of overall grain moisture may have been skewed towards over estimation.
Atherton's site - grain moisture over time
12.5
13
13.5
14
14.5
15
15.5
16
16.5
7:05
9:05
11:05
13:05
15:05
17:05
19:05
21:05
23:35
3:35
6:05
8:05
10:05
12:05
14:05
time (WDT)
Gra
in m
ois
ture
%
Sunset Sunrise
.
Figure 5.

Agribusiness Crop Updates 2008
Crop Updates is a partnership between the Department of Agriculture and Food, Western Australia and the Grains Research & Development Corporation
98
Grain moisture is on a time lag following atmospheric RH (Figure 6): In general terms grain moisture at all sites followed movement in atmospheric RH by a several hour time lag. The time lag between a change in general direction of RH and then a change in directional trend of grain moisture was between 1.5 and 4.5 hours, with two to three hours being the most common observation. With this in mind growers may be able to use general trend changes in atmospheric RH% as an indicator of grain moisture changes.
Atherton's site - grain moisture in relation to relative humidity and
harvest ability
0
20
40
60
80
100
6:49
8:29
10:09
11:49
13:29
15:09
16:49
18:29
20:09
21:49
23:29
1:09
2:49
4:29
6:09
7:49
9:29
11:09
12:49
time (WDT)
RH
%
12.5
13
13.5
14
14.5
15
15.5
16
Gra
in m
ois
ture
%
RH % top - 1000mm Grain MC %
Sunset Sunrise
2 hrs
2 hrs
Figure 6.
Harvesting conditions can improve later into the evening (Figure 7): Many growers have commented that harvest conditions improve later into the evening. Data was recorded at the Stewarts’ trial site that helps validate this comment. Following the breeze easing at approximately 21:45 the atmospheric temperature stabilised and RH also decreased slightly, which in turn improved the general harvest conditions. The data suggests that the lower wind speed allowed heat that was stored in the soil from the lower temperature reading in the top 50 mm of soil to be radiated back into the vicinity of the crop and hence improving the harvesting conditions in the hours after sunset.
Stewart's site - weather conditions 15 - 16/11/07
0
5
10
15
20
25
30
35
40
6:45
8:25
10:05
11:45
13:25
15:05
16:45
18:25
20:05
21:45
23:25 1:0
52:4
54:2
56:0
57:4
59:2
511
:0512
:4514
:25
time (WDT)
Tem
pera
ture
oC
0
20
40
60
80
100
120
RH
%
Temperature top - 1000mm Temperature lower - top 50mm of soil RH % top - 1000mm
SE breeze
Sunset Sunrise
Light SSE
breeze, fine
misty drizzle
Very light
dew
Breeze easing
and moved ELight E breeze
Still
Figure 7.

Agribusiness Crop Updates 2008
Crop Updates is a partnership between the Department of Agriculture and Food, Western Australia and the Grains Research & Development Corporation
99
Increases in moisture limits have dramatically increased harvest hours (Figure 8): In the past 2 seasons SEPWA has negotiated with bulk handlers and grain marketers for the maximum moisture receival limit to be lifted from 12.5% to 13.5%. Feedback from growers has been extremely positive in regards to more harvest hours each day. The length of harvest programs in the south coast region has been significantly shortened. The observation period at the Carmody site provided a specific working example of this (Figures 1, 2 and 8), where an increase in moisture limit from 12.5% to 13.5% increased the harvest hours from 2.5 hours to 10.5 hours.
Carmody's site - grain moisture over time and available harvest hours
11.5
12
12.5
13
13.5
14
14.5
15
15.5
16
7:07
9:07
11:07
13:07
15:07
17:07
19:07
21:07
23:07
1:07
5:07
7:07
9:07
11:07
13:07
time (WDT)
Gra
in m
ois
ture
%
2.5 hrs
10.5 hrs
Figure 8.
KEY WORDS
SEPWA, harvest challenge, grain moisture, temperature, relative humidity
ACKNOWLEDGMENTS
Host farmers; Carmodys, Athertons, Stewarts and Fowlers, Department of Agriculture and Food, WA staff David Hall and Jeremy Lemon and CBH Esperance.
Project No.: SEP 00004
Paper reviewed by: Steve Penny
Agribusiness Crop Updates 2008
Crop Updates is a partnership between the Department of Agriculture and Food, Western Australia and the Grains Research & Development Corporation
100
Varietal accreditation for Australian barley
Linda Price, Barley Australia
KEY MESSAGES
• Barley Australia is an industry sponsored body responsible for national varietal accreditation of malting barley in Australia.
• Barley varieties are now accredited on an Australia-wide basis; a malting barley variety is deemed suitable to produce malt and beer from across Australia regardless of whether it is purchased by any one company in any one region for malting and brewing purposes.
• When any nationally accredited variety of malting barley is purchased its end use is at the discretion of the individual marketer and/or maltster which accumulated the barley. However, only Barley Australia nationally accredited malting barley varieties may be marketed as such to maltsters and brewers. The list of nationally accredited malting barley varieties is housed in Barley Australia.
• Barley Australia comprises seven founding members from all the major barley growing States in Australia – Victorian-based maltsters ADM Malting Australia and Barrett Burston, QLD and NSW-based grain marketer GrainCorp; South Australian and Victorian marketer ABB Grain and maltster Joe White Maltings, WA-based maltings Kirin Australia and WA’s coarse grains marketer Grain Pool.
BACKGROUND ON EVALUATION FOR VARIETY ACCREDITATION
Barley Australia is going into its fourth year in 2008 and the company is poised to deliver a number of benefits to its grain marketing and maltster members and the broader Australian barley industry as per its vision statement: Quality barley for Australia and the world. One of the principal roles for Barley Australia is the administration of the national varietal accreditation evaluation process and management of the national Accredited Varieties list.
Varietal accreditation
The varietal evaluation process takes place over a two year period – ideally over two consecutive seasons, however this has not been achieved over the past three years due to seasonal difficulty in obtaining a malting receival-standard grade on the varieties up for evaluation (small grain, high protein, etc., which was a function of season rather than agronomic characteristics).
The process is essentially responsible for determining a variety’s suitability for the malting and brewing process; and the agronomic suitability of the variety is determined by the plant breeder in conjunction with their research counterparts and is signed off on at around the same time the variety enters the varietal accreditation process.
The barley councils around Australia (Northern, South Eastern, South Australian and Western) are important forums for the industry at a regional level to discuss marketing, agronomic and quality issues with new and older varieties. They aid decisions on what varietal specific segregations need to be established to meet market requirements for each season.
The brand Barley Australia Accredited Variety − Malt is a registered trademark with IP Australia. If it is not a Barley Australia accredited malting barley variety it may not be branded as a malting variety. This is an important strategy to provide confidence to international barley buyers on varietal quality and performance thereby enhancing the reputation of Australian product in the international marketplace.
Variety evaluation
The varietal accreditation evaluation process takes place nationally, and involves two years of commercial scale malting through the nation’s maltsters and two years of pilot scale brewing The data gathered over this time frame is also aligned with other industry gathered data on the variety. Barley Australia will only provide malting accreditation once these evaluation processes are completed, and quality benchmarks for new varieties met or exceeded.

Agribusiness Crop Updates 2008
Crop Updates is a partnership between the Department of Agriculture and Food, Western Australia and the Grains Research & Development Corporation
101
To enter commercial malting evaluation in the first instance, the variety must make the national malting receival standards in quality when it is harvested. A decision also has to be taken as whether the variety is intended for export or domestic use. The barley is either intended for the sugar adjunct market or starch adjunct market and is then malted and brewed accordingly.
The commercial malt is pilot brewed in Melbourne at the Pilot Brewing Australia plant to replicate the way beer is made in the Asian marketplace using starch adjunct brewing methods (if the barley line in question is a destined export variety), or conversely replicated to mimic Australia style brewing recipes which use sugar adjunct brewing methods.
Barley varieties that are badged with a ‘Barley Australia Accredited Variety’ logo signify to purchasers that the variety of barley or malt they are purchasing is deemed suitable for malting and brewing by the Australian industry, and this suitability is for either, or both liquid and solid adjunct brewing styles.
This year there will be new varieties entering the evaluation process, in addition to varieties that are currently under evaluation, namely Grout and WI3416. The new varieties to go up for first year evaluation will be determined in March this year.
The Barley Australia website, www.barleyaustralia.com.au lists all the Australian barley varieties currently accredited as well as those under evaluation.
In addition to evaluation of varieties for the Barley Australia Accredited Malting stamp, Pilot Brewing Australia also compares new varieties to existing varieties both from Australia and overseas. This benchmarking process is important for our industry to establish how our varieties compare in the international marketplace in terms of quality and performance and provides useful feedback to barley breeders, maltsters and marketers of barley.
DIFFERENT VARIETIES FOR DIFFERENT BEERS
Malt made from barley, is often referred to as the ‘soul’ of the beer. As one of the main ingredients in beer it not only provides the characteristic flavours and colour that beer drinkers are familiar with but also contributes to the whole brewing process (along with water, hops and yeast).
There are many styles of beer (newly created styles and brews from recipes dating back to ancient times) which use markedly different techniques of brewing, and importantly, different quality characteristics of the underlying main ingredient – malt made from barley.
In the markets where Australian malt and barley is sold, these quality characteristics are divided into two main categories – those characteristics required for starch adjunct brewing and those required for sugar adjunct brewing.
In most Asian brewed beers, some solid form of starch like rice or sorghum or corn (an additive, or adjunct to the brew) is added during the brewing process in addition to the malt. The adjunct provides additional sugars, and as such this market is often referred to as a ‘starch adjunct’ market.
This export, or ‘starch adjunct’ market requires barley processing quality parameters such as diastatic power (a measure of the enzymes contained in the malted barley that break down sugars) to be at a high level. The high level of these enzymes is required to convert starch in the adjunct (e.g. raw rice) and the starch in the processed malt to sugar. The converted sugar is what yeast ferment into alcohol in the brewing process.
Alternatively, in the Australian marketplace we mostly brew beer with the addition of a sugar adjunct which is usually provided in a liquid syrup form. Hence this market is termed a ‘sugar adjunct’ market as the added sugar is literally an adjunct to the brew. The enzymes at work in the brewing process (represented by the levels of diastatic power) here are not required to modify starches into sugars in the added syrup as it is already in accessible form for the yeast.
In other words the malt needs to work ‘harder’ in a brew containing starch adjuncts (like in the export market), than in an Australian style brew that includes these easily accessible sugars in liquid syrup form, or ‘sugar adjunct’.

Agribusiness Crop Updates 2008
Crop Updates is a partnership between the Department of Agriculture and Food, Western Australia and the Grains Research & Development Corporation
102
Other quality parameters required in barley and malt will also differ depending on the malting and brewing processes and beer types that each customer or market is making.
In past years, Australia has lagged a little behind our principal competitors in Canada and the EU in the production of barleys and malts with the characteristics suited to the export, or starch adjunct marketplace.
It has taken a concerted effort from the Australian barley industry to raise the bar on new varieties developed and released over the past five years; in fact the quality of Australian barleys is now considered the best in the world by international customers.
The efforts of Australia’s barley breeders have seen the release of varieties such as Flagship and Baudin, which have barest the benchmark on critical parameters like diastatic power, the amount of malt extracted from the barley and its ability to be fermented into alcohol. This has helped to increase Australia’s market share and improve productivity for our brewing customers in Asia.
The new wave of varieties currently under evaluation for malting and brewing, such as Grout and Buloke are set to consolidate the improvement in Australian barley quality the ultimate outcome being increased market share for Australian barley into the Asian market.
Matching the inherent quality parameters of a barley variety to a specific end market is imperative when breeding a new barley variety: Barley Australia is listening to Australia’s customer requirements and effectively passing this message back to our breeding programs.
CONCLUSION
The constant review of older varieties and benchmarking the performance of new varieties against existing varieties – both from Australia and overseas – means that Australia can continue to deliver new improved varieties of malting barley to the marketplace.
Industry endorsed accreditation, whereby all of industry agrees the malting status of a variety, provides an industry-determined united front for the Australian barley industry. It delivers consistency in quality, branding and varietal description in varieties from Australia. The commercial companies (end users) in the industry work together with the breeding and research sectors to ensure messages about future trait requirements are captured in the new wave of varieties, and thorough ‘road testing’ of the varieties through the varietal accreditation process ensures solid performance data can be provided to customers, aiding a rapid adoption of the new varieties launched into the market.
KEY WORDS
Barley Australia, national varietal accreditation, sugar adjunct, starch adjunct
Agribusiness Crop Updates 2008
Crop Updates is a partnership between the Department of Agriculture and Food, Western Australia and the Grains Research & Development Corporation
103
Applying data mining tools to improve grain quality for growers Dean Diepeveen1, Leisa Armstrong2, Peter Clarke1, Doug Abrecht1, Rudi Appels2 and Matthew Bellgard3 1Department of Agriculture and Food, Western Australia 2Edith Cowan University, Western Australia 3Centre of Comparative Genomics, Murdoch University
KEY MESSAGES
Most of the crop variety information from breeding organisations promotes the positive aspects of varieties included, rather than a grower specific view.
The grower needs to take into account across all the new varieties improved germplasm traits when making cropping decisions.
Data mining techniques offer opportunities for summarising diverse data into a coherent format which is understandable by growers.
Data mining offers opportunities to improve the process of identifying and recommending new varieties as it can facilitate the analysis of multiple information sources.
Data mining can provide both the crop breeder and grower with a more translucent view of the general trends in the performance and other plant traits of new varieties.
AIMS
This research uses published information from several Western Australian information sources, which is available to growers and applies data mining techniques in order to determine if improvements can be made in the identification of crop variety performance. Furthermore, the research addresses the idea that data mining may be one approach that can be used to address concerns relating to crop variety recommendations and other factors that affect the variety decisions.
The research aims to assess whether data mining could improve on the current traditional statistical analysis methods used to choose new crop varieties. An examination will be made on the application of multivariate algorithms to a sample wheat dataset and inferences will be made as to whether this could further assist wheat grower’s decision-making on crop variety choices.
METHOD
Information on various plant traits such as Grain Yield (GY), Grain Protein (WP), Seivings (SV03) and Grain Weight (HWT) were collected from three field sources from trials carried out in the Western Australian wheatbelt (Ref. 1, 2, 3). Information was collected on the performance of four recently released variety ‘Westonia’, ‘Wyalkatchem’, ‘Carnamah’ and ‘Calingiri’. Data mining techniques were used to develop a series of classifying variables such as location, year , trial-type, soil in order to collate the available information. Furthermore, data selection was then done with the outcome variables GY, WP, SVO3, and HWT to ensure some balance between these traits. Results were then collated into a table for analyses using the ‘R’ software (Ref. 4). Data from 2005 and 2006 was chosen in order to minimise the effect of seasonal climatic conditions across datasets. The data mining technique of multivariate analysis was carried out using Asreml-R (Ref. 5) library within R.
RESULTS
Differences were found in the analysis between the four varieties when using just one trait as apposed to variety yield estimates with four traits. Table 1 displays information published by DAFWA on suggested yields from trials conducted by DAFWA. Table 2 shows the estimated yields from NVT results when using Residual Maximum Likelihood (REML) with variety modelled as fixed and trials as random. Table 3 displays variety estimates using a multivariate model when using all four traits GY, WP, SV03 and HWT. The multivariate model used a random trait by variety term and a sparse trait by trial term.

Agribusiness Crop Updates 2008
Crop Updates is a partnership between the Department of Agriculture and Food, Western Australia and the Grains Research & Development Corporation
104
Table 1. Suggested variety yields (Data source 1)
Agzone1 Rank Agzone2 Rank Agzone3 Rank Agzone4 Rank Agzone5 Rank Agzone6 Rank
Calingiri 2.78 1 2.44 4 3.37 1 1.9 1 1.94 4
Carnamah 2.63 2 2.76 3 3.15 3 1.67 4 2.1 3 2.86 3
Wyalkatchem 2.55 3 2.82 2 3.08 4 1.85 2 2.23 1 2.98 1
Westonia 2.48 4 2.88 1 3.28 2 1.8 3 2.19 2 2.95 2
Table 2. Estimated variety yields (Data source 2)
Agzone1 Rank Agzone2 Rank Agzone3 Rank Agzone4 Rank Agzone5 Rank Agzone6 Rank
Calingiri 2.29 2 2.95 1 2.55 3 2.67 3 2.86 1 2.86 2
Carnamah 1.95 4 2.82 2 3.07 1 2.62 4 2.44 3 3.23 1
Wyalkatchem 2.92 1 2.63 4 1.86 4 3.25 1 2.52 2 2.08 4
Westonia 2.02 3 2.81 3 2.76 2 2.97 2 1.71 4 2.69 3
Table 3. Multivariate variety yields using traits GrainYield, Protein, Seivings, and GrainWeight
Agzone1 Rank Agzone2 Rank Agzone3 Rank Agzone4 Rank Agzone5 Rank Agzone6 Rank
Calingiri 2.21 2 2.56 1 2.43 3 2.17 3 2.22 2 2.54 2
Carnamah 2.08 4 2.46 4 2.55 1 2.15 4 2.1 3 2.62 1
Wyalkatchem 2.57 1 2.52 3 2.18 4 2.67 1 2.38 1 2.27 4
Westonia 2.12 3 2.53 2 2.5 2 2.37 2 1.81 4 2.48 3
The results show differences up to 1.1 tonnes/hectare between the different data sources and multivariate estimates. Using all three datasets in the multivariate model results in show much lesser differences between varieties for each agzone when. Figure 1 illustrates these differences as a graph for each variety within agzone combination.
Figure 1: Variety Yield Estimates
0
0.5
1
1.5
2
2.5
3
3.5
4
Agzone1 Agzone2 Agzone3 Agzone4 Agzone5 Agzone6
Variety
Yie
ld (
kg/h
a)
Data1 Calingiri
Data2 Calingiri
Multi Calingiri
Multi Calingiri
Data1 Carnamah
Data2 Carnamah
Multi Carnamah
Multi Carnamah
Data1 Westonia
Data2 Westonia
Multi Westonia
Multi Westonia
Data1 Wyalkatchem
Data2 Wyalkatchem
Multi Wyalkatchem
CONCLUSION
This research paper shows that growers can make better decisions based on current variety information when techniques are used to combine the data. Data mining techniques, as applied in this study, suggest that when the data is integrated, the yield differences available to growers may not be reflected in the grower paddocks.
Agribusiness Crop Updates 2008
Crop Updates is a partnership between the Department of Agriculture and Food, Western Australia and the Grains Research & Development Corporation
105
KEY WORDS
data mining, crop breeding, grain quality and wheat yield
REFERENCES
South East Premium Wheat Growers Association, ‘SEPWA trials’, http://www.sepwa.org.au/agronomy.html (accessed 24/08/2007).
Department of Agriculture and Food, Western Australia, ‘Wheat variety guide 2007 Western Australia’ http://www.agric.wa.gov.au/content/fcp/cer/wh/wheatvarguide07.pdf (accessed: 24/08/2007).
National Variety Trials and Australian Crop Accreditation System Limited, ‘Trial report search’ http://www.acasnvt.com.au/ACAS/TrialReport.aspx (accessed 24/08/2007).
R Development Core Team (2007). ‘R: A language and environment for statistical computing. R Foundation for Statistical Computing’, Vienna, Austria. ISBN 3-900051-07-0, URL http://www.R-project.org.
Gilmour, A.R, Gogel, B.J., Cullis, B.R. and Thompson, R. (2006), ‘Asreml User Guide Release 2.0’ ISBN 1-904375-23-5 VSN International Ltd, Hernel Hempstead, HP1 1ES, UK http://www.asreml.com.
Frank, E., Hall, M., Trigg, L., Holmes, G. and Witten, I.H. (2004). Data mining in bioinformatics using Weka. Bioinformatics, 20(15), 2479-2481.
Witten, I.H. and Frank, E. (2005). Data Mining. Practical Machine Learning and Techniques. San Francisco: Morgan Kaufman.
Paper reviewed by: Steve Penny