CROP PROTECTION PROGRAMME Rice sheath blight complex … · 2006-07-10 · Pathogen epidemiology...
102
CROP PROTECTION PROGRAMME Rice sheath blight complex caused by Rhizoctonia species: Pathogen epidemiology and management strategies R 7778 (ZA 0406) FINAL TECHNICAL REPORT 1 June 2000 – 30 November 2003 Project Leader Dr. S. Sreenivasaprasad Warwick HRI, University of Warwick, UK 28.05.2004 Project Collaborators Dr. M.M. Rahman, Bangladesh Rice Research Institute Prof. Mohsin Ali, University of Rajshahi, Bangladesh Dr. Ranajit C. Adhikari, Rural Development Academy, Bangladesh Mr. Nurul Islam, Bangladesh Academy for Rural Development Dr. S.Muthumeenakshi, Warwick HRI This publication is an output from a research project funded by the United Kingdom Department for International Development for the benefit of developing countries. The views expressed are not necessarily those of DFID. [R7778, Crop Protection Programme]
Transcript of CROP PROTECTION PROGRAMME Rice sheath blight complex … · 2006-07-10 · Pathogen epidemiology...
CROP PROTECTION PROGRAMME
Rice sheath blight complex caused by Rhizoctonia species: Pathogen epidemiology and management strategies
R 7778 (ZA 0406)
FINAL TECHNICAL REPORT
1 June 2000 – 30 November 2003
Project Leader Dr. S. Sreenivasaprasad
Warwick HRI, University of Warwick, UK
28.05.2004
Project Collaborators Dr. M.M. Rahman, Bangladesh Rice Research Institute
Prof. Mohsin Ali, University of Rajshahi, Bangladesh Dr. Ranajit C. Adhikari, Rural Development Academy, Bangladesh
Mr. Nurul Islam, Bangladesh Academy for Rural Development Dr. S.Muthumeenakshi, Warwick HRI
This publication is an output from a research project funded by the United Kingdom Department for International Development for the benefit of developing countries. The views expressed are not necessarily those of DFID. [R7778, Crop Protection Programme]
CONTENTS
Page No. List of Tables 1 List of Figures 2 List of Appendices 3 List of Acronyms 4 Acknowledgements 6 Biometrician certification 7 Executive summary 8 Background 11 Project Purpose 14 References 15 Research Activities 19
1. Socio-economic surveys 19
2. Disease surveys 19
3. Pathogen isolation, pathogenicity tests and interactions 22
4. Molecular diagnostics 24
5. Disease management 25 Outputs 27
1. Socio-economic surveys 27
2. Disease surveys 36
3. Occurrence and distribution of Rhizoctonia spp. 48
4. Molecular diagnostics of Rhizoctonia spp. 54
5. Disease management 62
6. Capacity strengthening and dissemination of outputs 69 Contribtuiton of outputs to developmental impact 69 Project outputs dissemination list 71 Equipment inventory 75 Appendices 76
1
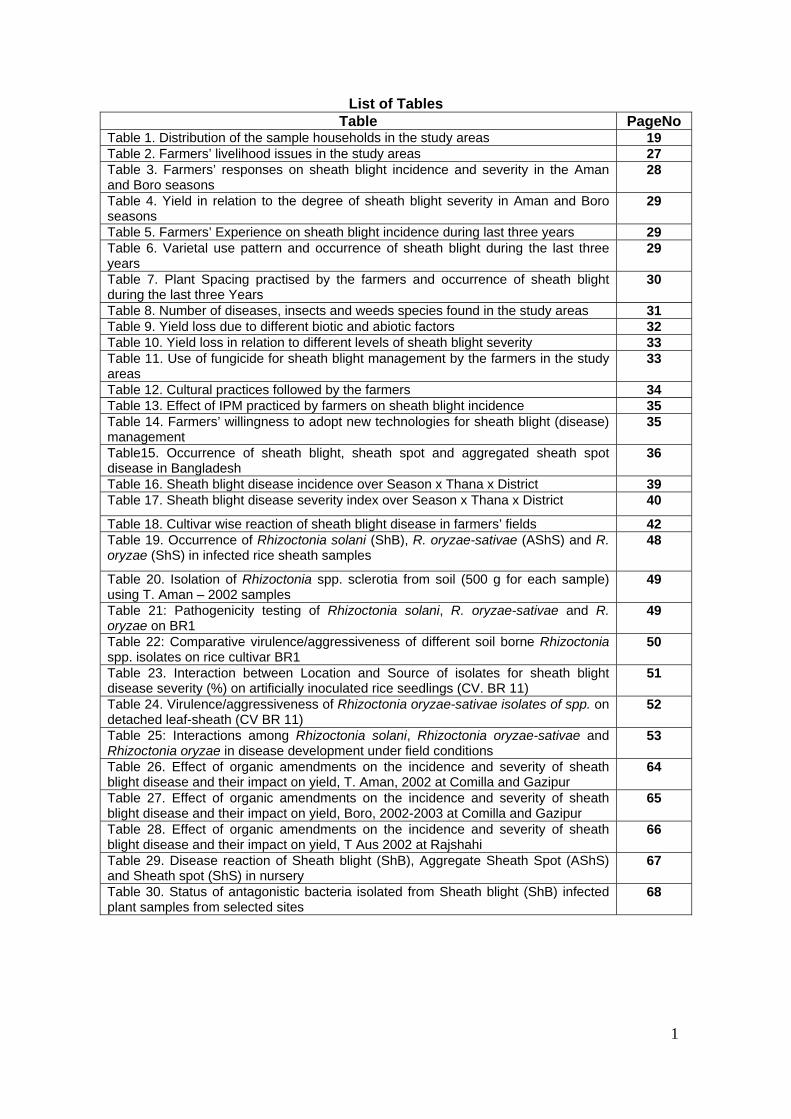
List of Tables Table PageNo
Table 1. Distribution of the sample households in the study areas 19 Table 2. Farmers’ livelihood issues in the study areas 27 Table 3. Farmers’ responses on sheath blight incidence and severity in the Aman and Boro seasons
28
Table 4. Yield in relation to the degree of sheath blight severity in Aman and Boro seasons
29
Table 5. Farmers’ Experience on sheath blight incidence during last three years 29 Table 6. Varietal use pattern and occurrence of sheath blight during the last three years
29
Table 7. Plant Spacing practised by the farmers and occurrence of sheath blight during the last three Years
30
Table 8. Number of diseases, insects and weeds species found in the study areas 31 Table 9. Yield loss due to different biotic and abiotic factors 32 Table 10. Yield loss in relation to different levels of sheath blight severity 33 Table 11. Use of fungicide for sheath blight management by the farmers in the study areas
33
Table 12. Cultural practices followed by the farmers 34 Table 13. Effect of IPM practiced by farmers on sheath blight incidence 35 Table 14. Farmers’ willingness to adopt new technologies for sheath blight (disease) management
35
Table15. Occurrence of sheath blight, sheath spot and aggregated sheath spot disease in Bangladesh
36
Table 16. Sheath blight disease incidence over Season x Thana x District 39 Table 17. Sheath blight disease severity index over Season x Thana x District 40
Table 18. Cultivar wise reaction of sheath blight disease in farmers’ fields 42 Table 19. Occurrence of Rhizoctonia solani (ShB), R. oryzae-sativae (AShS) and R. oryzae (ShS) in infected rice sheath samples
48
Table 20. Isolation of Rhizoctonia spp. sclerotia from soil (500 g for each sample) using T. Aman – 2002 samples
49
Table 21: Pathogenicity testing of Rhizoctonia solani, R. oryzae-sativae and R. oryzae on BR1
49
Table 22: Comparative virulence/aggressiveness of different soil borne Rhizoctonia spp. isolates on rice cultivar BR1
50
Table 23. Interaction between Location and Source of isolates for sheath blight disease severity (%) on artificially inoculated rice seedlings (CV. BR 11)
51
Table 24. Virulence/aggressiveness of Rhizoctonia oryzae-sativae isolates of spp. on detached leaf-sheath (CV BR 11)
52
Table 25: Interactions among Rhizoctonia solani, Rhizoctonia oryzae-sativae and Rhizoctonia oryzae in disease development under field conditions
53
Table 26. Effect of organic amendments on the incidence and severity of sheath blight disease and their impact on yield, T. Aman, 2002 at Comilla and Gazipur
64
Table 27. Effect of organic amendments on the incidence and severity of sheath blight disease and their impact on yield, Boro, 2002-2003 at Comilla and Gazipur
65
Table 28. Effect of organic amendments on the incidence and severity of sheath blight disease and their impact on yield, T Aus 2002 at Rajshahi
66
Table 29. Disease reaction of Sheath blight (ShB), Aggregate Sheath Spot (AShS) and Sheath spot (ShS) in nursery
67
Table 30. Status of antagonistic bacteria isolated from Sheath blight (ShB) infected plant samples from selected sites
68

2
List of Figures
Figure Page No. Fig.1. Location of the rice sheath blight disease complex survey sites (indicated as red triangles) in Bangladesh during 2001-03
19
Fig. 2. Schematic presentation of Rhizoctonia rice sheath disease complex survey protocol
21
Fig. 3. Schematic presentation of sampling pattern in a field; spots (each 1 m x 1 m area) showing the position where from disease records were taken/soil samples were collected
21
Fig. 4 Mean incidence of sheath blight, aggregate sheath spot and sheath spot in Bangladesh
36
Fig. 5 Sheath blight incidence and severity across seasons 38 Fig. 6. Seasonal occurrence of sheath spot and aggregate sheath spot disease 38
Fig. 7. Geographical effect on sheath blight incidence and severity 38 Fig. 8. Mean incidence of sheath spot and aggregate sheath spot across locations 38 Fig. 9. Field wise sheath blight disease severity in TA01 across four survey locations
40
Fig. 10. Field wise sheath blight disease severity in TA02 across four survey locations
41
Fig. 11. Field wise sheath blight disease severity in Boro 2001-02 across four survey locations
41
Fig. 12. Effect of crop pattern on the incidence and severity of sheath blight 42 Fig. 13. Cultivar adoption (% field) in wet season T. Aman, 2001-2 in four locations of Bangladesh
44
Fig. 14. Horizontal progress and severityof sheath blight disease across growth stages, Rajshahi T Aman 01
45
Fig. 15. Horizontal progress and severityof sheath blight disease across growth stages, Rajshahi Boro2001-02
45
Fig. 16. Horizontal progress and severityof sheath blight disease across growth stages, Rajshahi T Aman 02
46
Fig. 17 Correlation between rice grain yield and disease severity 46 Fig. 18. Grain yield (t/ha) vs sheath blight disease severity 46 Fig. 19. Estimated yield loss (kg/ha) across locations and their grand mean 47 Fig. 20. Relative virulence/aggressiveness of plant and soil isolates of Rhizoctonia solani from different locations
50
Fig. 21. Virulence/aggressiveness of plant and soil borne R. solani isolates from the four sites
51
Fig. 22. A, Gel panel showing amplification of R. solani – specific product with target species isolates only as part of the development of diagnostic PCR tests. B, Gel panels showing the application of diagnostic PCR to detect pathogen specific fragments directly in infected tissue
54
Fig. 23. Venn diagram showing the level of occurrence of the three pathogens following diagnostic PCR analysis of sheath infected samples originally identified based on symptoms
55
Fig. 24. Gel pictures showing the extent of genetic diversity observed among R. solani populations in Bangladesh using a collected from across the country, along with some reference cultures. A, SSR-PCR profiles. B. AFLP profiles
58
Fig. 25. Comparative analysis of Rhizoctonia solani isolates from plant and soil origin. A, diagnostic PCR with R. solani-specific primers. B, SSR-PCR profiles
60

3
. List of Appendices
Appendix Page No. Appendix 1. Diseases reported by the farmers in the study areas 76 Appendix 2. Different pests resported by farmers in the study areas 77 Appendix 3. Different species of weeds reported by farmers in the study areas 78 Appendix 4. Sheath blight disease incidence and severity shown by field and corresponding host variety in T. Aman 2001 at Bogra
79
Appendix 5. Sheath blight disease incidence and severity shown by field and corresponding host variety in T. Aman 2002 at Bogra
80
Appendix 6: Sheath blight disease incidence and severity shown by field and corresponding host variety in Boro 2001-2 at Bogra
81
Appendix 7. Sheath blight disease incidence and severity shown by field and corresponding host variety in T. Aman 2001 of Comilla
82
Appendix 8. Sheath blight disease incidence and severity shown by field and corresponding host variety in T. Aman 2002 of Comilla
83
Appendix 9. Sheath blight disease incidence and severity shown by field and corresponding host variety in Boro 2001-2 of Comilla
84
Appendix 10. Sheath blight disease incidence and severity shown by field and corresponding host variety in T. Aman 2001 of Gazipur
85
Appendix 11. Sheath blight disease incidence and severity shown by field and corresponding host variety in T. Aman 2002 of Gazipur
86
Appendix 12. Sheath blight disease incidence and severity shown by field and corresponding host variety in Boro2001-2 of Gazipur
87
Appendix 13. Sheath blight disease incidence and severity shown by field and corresponding host variety in Rajshahi, T. Aman 2001
88
Appendix 14. Sheath blight disease incidence and severity shown by field and corresponding host variety in Rajshahi, T. Aman 2002
89
Appendix 15. Sheath blight disease incidence and severity shown by field and corresponding host variety in Rajshahi, Boro 2001-02
90
Appendix 16. Sheath blight disease incidence and severity shown by field and corresponding host variety in Rajshahi, T. Aus 2003
91
Appendix 17. Isolation status of Rhizoctonia solani, Rhizoctonia oryzae-sativae and Rhizoctonia oryzae from infected sheath samples
92
Appendix 18. Virulence of Rhizoctonia solani isolates of plant and soil origin across four locations
93
Appendix 19. Rice sheath disease symptoms and Rhizoctonia species cultural morphology
95
Appendix 20. Rhizoctonia spp. isolates used for molecular characterisation 96 Appendix 21. Plant and soil Rhizoctonia isolates used in comparative analysis by SSR-PCR
98
Appendix 22. Enumerators for survey wrok at various sites being centrally trained at BRRI, Gazipur by project PIs (A) and pathology and socio-economics partners meeting at BRRI, Gazipur to discuss project activities
99
Appendix 23. Enumerators and project staff carrying out soci-economic (A) and disease (B) surveys
100
Appendix 24. Bioassays to test the antagonistic potential of bacteria isolated from diseased rice sheath samples (A) and plot tests to assess the effect of organic amendments on rice sheath blight (B)
101
.

4
List of Acronyms BRRI Bangladesh Rice Research Institute IRRI International Rice Research Institute HRI/Warwick HRI Horticulture Research International DFID Department for International Development CPP Crop Protection Programme CRRI Central Rice Research Institute °C Degrees Celcius dNTP Deoxy nucleoside triphosphate DNA Deoxyribonucleic Acid EDTA Disodium ethylene diamine tetraacetic acid M Molar mM Millimolar ml Millilitre mg Milligram μl Microlitre μg Microgram NaCl Sodium chloride ng Nanogram rpm Revolutions per minute Tris Tris hydroxymethyl amonimethane SDS Sodium dodecyl sulphate UV Ultra violet v/v Volume per volume w/v Weight per volume RDA Rural Development Academy BARD Bangladesh Academy of Rural Development CABI CABI Bioscience, UK NRI Natural Resources Institute NR Int Natural Resources International IRD Institute for Research and development BSMRAU Bangabandhu Sheik Mujubur Rahman Agricultural University IPSA Institute of Postgraduate Studies in Agriculture FTR Final Technical Report BINA Bangladesh Institute of Nuclear Agriculture ShB Sheath blight AShS Aggregate Sheath Spot ShS Sheath Spot RS Rhizoctonia solani RO Rhizoctonia oryzae ROS Rhizoctonia oryzae- sativae TA/T.Aman Transplanted Aman season IPM Integrated Pest Management PCR Polymerase Chain Reaction AFLP Amplified Fragment Length Polymorphism SSR Simple Sequence Repeat AEZ Agro-ecological zone OM Organic matter MVs Modern varieties HYVs High yielding varieties CV Cultivar PDA Potato dextrose agar PDB Potato dextrose broth RLH Relative lesion height
5
SES Standard Evaluation System SI Severity index DAI Days after incoculation CRD Complete randomized block design KBA King’s B agar h Hour CS Crop sequence ANOVA Analysis of variance DMRT Duncan’s multiple range test FB Fluorescent bacteria UPGMA Unweighted pair grouping by mathematical average rDNA Ribosomal DNA/ribosomal RNA gene block RFLP Restriction fragement length polymorphism RAPD Random amplied polymorphic DNA PETRRA Poverty elimination through rice research assistance
6
Acknowledgements
This publication is an output from a research project funded by the United Kingdom
Department for International Development (DFID) for the benefit of developing
countries. The views expressed are not necessarily those of DFID. Project R7778,
DFID-Crop Protection Programme managed by the Natural Resources International,
UK.
We would like to thank Dr. F. M. Kimmins, Dr. A. Ward and Dr. T.C.B. Chancellor for
their help and support in initiating the project. We are grateful to the Department for
International Development (DFID) – Crop Protection Programme (CPP) for funding this
project.
Grateful thanks are also extended to the Director Generals of BRRI, RDA and BARD
for their support and cooperation in carrying out this project.
BRRI pathologists Dr. N.R. Sharma, Dr. M. Latif, Dr. Ansar Ali, Mr. M. Hossain, Dr.
Taher Mia and Dr. M.Nahar led the various activities at project sites Gazipur, Comilla,
Bogra and Rajshahi. Dr. D.N.R. Paul, Head, Biometrics Division, BRRI co-ordinated the
collation and analysis of data centrally at BRRI-HQ, Gazipur and Mr. M. A. S. Azad,
Agricultural Economics Division, BRRI, contributed to the analysis of the socio-
economic survey data. We gratefully acknowledge the contributions made by these
colleagues, and other technical staff and enumerators at BRRI and partner
organisations.
Our primary recognition is to the farmers and key informers who cooperated patiently in
the surveys for no direct reward.

7
Biometricians Signature Uniform biometric methodologies and analysis for surveys, sampling and pathology experiments were done centrally at BRRI-HQ, Gazipur in consultation with Dr. DNR Paul and Mr. M.A.S Azad. Molecular data analyses were done according to standard methodologies used by HRI-biometrics in consultation with Drs. Andrew Mead and James Lynn. I confirm that the biometric issues have been adequately addressed in the Final Technical Report: Signature: Name (typed): Dr. D.N.R Paul Position: Head, Biometrics Division, BRRI, Bangladesh Date: 15.04.2004

8
Executive Summary Sheath blight disease is recognized as a high priority constraint to rice production in Bangladesh. A socio-economic survey of 400 farm households (100 each) in Bogra, Rajshahi, Comilla and Gazipur districts was conducted and the data are centrally archived at BRRI-HQ (Pathology & Biometrics Divisions), Gazipur. This database is a compilation of information related to rice production, pest and disease management aspects with particular reference to Rhizoctonia sheath diseases and livelihood issues of the farmers. Following are some of the key issues that emerged. Sheath blight, locally described as kalopocha/pochon/kholpora is considered as the major rice disease by the farmers in all four districts surveyed. Up to 73 and 11 % farmers during Aman season and up to 60 and 16 % farmers during Boro season reported moderate and high disease, respectively. Losses based on farmers’ yield estimates ranged between 30 –32 % in both Aman and Boro in general. However, in the Boro season, Bogra and Comilla farmers’ reported higher losses compared to Gazipur and Rajshahi. High yielding cultivars such as BR11 and Swarna are widely used and are highly susceptible. Farmers practising higher spacing and using different varieties in general reported lower disease problems compared to those following lesser or haphazard spacing and also varieties with large number of tillers. Some farmers were misled into non-target use of pesticides and improper spacing or sowing to control diseases and weren’t aware of the negative effect of over doses of N-fertiliser on sheath blight severity. Farmers with moderate level of schooling and IPM trained farmers were more conscious of disease management and in relation to practising IPM and a good level of demonstration effect was observed. Further, above 90 % of the farmers were willing to adopt improved varieties and any new disease management technologies e.g. amendments and/or biocontrol agents. Thus there is both a crucial need and excellent potential for up take, adoption and impact by supporting participatory research/validation and training/demonstration programmes for rice farmers for pest and disease management and enhancing rice production. Occurrence and severity of sheath blight (ShB Rhizoctonia solani), sheath spot (ShS, R. oryzae) and aggregate sheath spot (AShS, R. oryzae sativae) were surveyed in Bogra, Comilla, Gazipur and Rajshahi during 2001-03 in wet season transplanted Aman 2001(T Aman 01), winter boro 2001-2 and T. Aman 2002 for all the locations with an additional monitoring in T. Aus at Tanore upazilla of Rajshahi. In each location, 72 fields were assessed during various stages of the crop. Sheath blight was the most prevalent disease (20.8% mean), in all the locations and seasons with low level incidence (around 2.0 % mean) of aggregate sheath spot and sheath spot. The incidence and severity of ShB varied significantly among the seasons and locations. Interaction effect between locations and seasons was also significantly varied. Among the seasons, Aus was the most favorable for sheath blight diseases followed by T. Aman (wet season) and Boro. Highest incidence (48.4%) and severity (33.2%) of sheath blight was recorded in T. Aus (Rajshahi). In Boro season, the severity of ShB was the least compared to either T. Aman or T. Aus. Among the locations, the incidence of ShB was comparable at Bogra, Comilla and Gazipur with higher level of incidence in Rajshahi and mean severity index was also highest in Rajshahi (16.6%). Wide scale adoption of highly susceptible cultivars, intensification with mono crop rice cultivation appeared to be the major causes of high sheath blight. However, sheath blight disease was least in rice - potato cropping pattern. Irrespective of location, season and year vertical spread and severity of the disease increased as the crop approached maturity and the overall yield loss was estimated to range between 136 to 762 kg/ha. Molecular diagnostic tools including PCR primers with enhanced specificity to the three Rhizoctonia spp., PCR protocols and DNA extraction methodologies for rapid and reliable analysis of fungal and plant specimens and pathogen/disease diagnosis have been designed, tested and developed. Utilisation of these tools in combination with
9
intensive disease surveys confirmed Rhizoctonia solani causing sheath blight as the dominant pathogen (more than 80%) and importantly identified wide occurrence of aggregate sheath spot pathogen Rhizoctonia oryzae-sativae (48 %) either singly or along with R. solani in rice production systems in Bangladesh. Use of independent molecular markers such as AFLPs and SSRs, revealed considerable genetic variation with continuous distribution of R. solani populations in cluster analysis rather than location or host gene pool related groups. A collection of well characterised isolates that form a baseline for long term monitoring and use in resistance screening work has been established. Sclerotia were isolated from more than 90 soil samples from Bogra, Comilla and Gazipur and in general above 60 % of the sclerotia were not viable. Within viable populations, recovery of R. solani ranged from from 50 – 90% and only around 9% Rhizoctonia oryzae-sativae. Pathogenicity testing of 32 R. solani isolates from both plant and soil sources from four sites revealed significant variation in their aggressiveness irrespective of the source and location underlining the importance of using appropriate set of isolates in screening tests. A collection of well-characterised isolates that form a baseline for long term monitoring and use in resistance screening work has been established. Interestingly, comparative molecular analysis of up to 40 R. solani isolates from corresponding plant and soil samples revealed more differences than similarities. This clearly emphasises the need to further investigate and take into consideration the relative importance of the number of pathogen infection units present in soil versus the spread of infection within the canopy in implementing disease control measures. Further, inoculation of more than one Rhizoctonia species combinations under artificial conditions influenced the sheath disease severity and the potential impact of high level of co-occurrence of R. solani and Rhizoctonia oryzae-sativae also needs to be further investigated in disease development and management. A total of fifteen organic amendments were tested for the control of Sheath blight in T. Aus, T. Aman and Boro during 2002-2003 in Comilla, Gazipur and Rajshahi regions. In Comilla, among the organic amendments tested compost, pulse bran and rice bran showed the better results while urmoi (Sapium indicum), bishkatali (Polygonum hydropiper) and compost showed good indication for the control of sheath blight and increased yield as well in Gazipur. In Rajshahi, pressmud, sawdust and rice bran reduced disease severity. Thirty rice varieties/lines were artificially screened at Rajshahi for their reaction to R. solani isolated from ShB infected rice plants. None of the entries showed resistant reaction. Sixteen entries namely, BR3, BR10, BR22, BR23, BR25, BRRI dhan29, BRRI dhan31, BRRI dhan32, BRRI dhan34, BRRI dhan38, BRRI dhan41, BR6194-27-2-2-1, BR6241-62-2-1, BR6004-75-4-HR1, BINA dhan4, BINA dhan6 showed moderately tolerant reaction (< 5) and rest of the entries including exotic and native cultivars appeared highly susceptible to sheath blight (ShB) in Rajshahi. While in Gazipur, BR10, BRRIdhan38, BR6194-27-2-2-1, BR6241-62-2-1 and Kumragoir showed moderately tolerant reaction against ShB but aggregate sheath spot and sheath spot showed very little disease severity on the test cultivars. Infected plant samples were assayed for the presence of antagonistic bacteria. Out of 119 samples tested 19 showed florescent bacteria (FB) from which 139 colonies of FB were isolated. Among them 38 colonies showed higher level of antagonism against ShB pathogen in bioassays and offer the potential for disease control. A number of activities were undertaken contributing to capability strengthening at the partner organisations and also dissemination of project outputs. Ms. Shamima Akter, BRRI pathology staff was provided a three-month research training attachment at HRI in fungal pathology and molecular diagnostics and in-country review meetings were organised annually. Enumerators were trained centrally at BRRI leading to a skill base that could be utilised by these organisations in future research activities. A leaflet on project activities and some of the key findings has been produced for local dissemination. A stakeholder workshop was organised on 3rd Dec. 2003 at BRRI-Gazipur with 25

10
participants from BRRI-HQ and outstations including pathologists, breeding, socio-economics, biometrics and agronomy scientists and scientists from BARD, RDA, Uni. of Rajshahi, BINA and BSMR Agric Univ (IPSA). Strong partnership has also been established between BRRI, RDA, BARD and University of Rajshahi and local Agricultural offices leading to close working links between organisation dealing with rice R & D and extension work. Close linkages were established with a range of organisations involved in rice sheath disease research, leading to exchange of knowledge and material. For example, with BSMRAU (formerly IPSA), Bangladesh and Imperial College, UK where BRRI pathologists were carrying out PhD programmes on related topics and also project leaders visits to CRRI and University of Madras, India and IRD, France to discuss ShB research and present seminars on project outputs. Project staff also presented outputs at important conferences such as Global Food Security, London and International congress of Plant pathology, New Zealand.

11
Background Sheath blight is one of the most destructive necrotrophic diseases of rice (Ou, 1985; Rush and Lee, 1992; Banniza et al., 1999; Banniza and Holderness 2001) and is a major constraint to rice production in many parts of Asia, including Bangladesh (Sharma and Teng, 1996). The disease, hitherto attributed to Rhizoctonia solani (RS), is endemic in rice growing regions and the pathogen survives as sclerotia in soil and in debris from previous crops. The disease is most severe when sclerotia and the debris float to the surface of the flood water and initiate infection on the lower sheaths starting at the maximum tillering stage of growth (Rush and Lee, 1992). The disease also spreads through airborne basidiospores (Lee and Rush, 1983) and there have been reports of seedborne inoculum (Kannaiyan and Prasad, 1978). The versatility of the pathogen, its competitive saprophytic ability and the prolonged survival of the propagules in soil make this disease extremely difficult to control. MVs cover about 90% of boro rice; 25-55% of aus and aman rice. This is more than 50% of the rice area in Bangladesh (Chowdhury, 1999). The susceptibility of MVs to several major pests and diseases is a common reason for production losses (Karim, 1999). Sheath blight is recognised as a high priority constraint to rice production in Bangladesh and there are very few MVs that are resistant to sheath blight. Since commercial rice cultivars are susceptible to sheath blight disease, particularly the high tillering varieties, or have only low level of resistance (Rush et al., 1995) there is little constraint on the pathogen. As a consequence, the impact of the disease is expected to increase with the expected increase in rice cropping. Despite efforts to understand the physiological basis of disease resistance in rice (Manibhushanrao et al., 1985, 1986, 1987), and resistance breeding programmes, only moderate field resistance has been achieved against sheath blight (Reddy et al., 1997; Kumari et al., 1998). Enhanced resistance to sheath blight has been achieved experimentally through induced resistance and cross protection using abiotic and biotic agents, respectively (Kalaiselvi et al., 1986; Waheeta et al., 1987; Manibhushanrao et al., 1988) and genetic engineering (Lin et al., 1995; Datta et al., 1999). Despite these efforts, growers have little practical alternative but to use fungicides to control the disease. In the last 2-3 years, hybrid rice varieties from India and China are being released to farmers in Bangladesh and sufficient field testing needs to be carried out under local conditions (Bhuiyan and Karim, 1999). In the host resistance component of the project, a number of hybrid rice and other elite varieties will be tested for their response to the sheath blight complex. Bangladesh, with its tropical monsoon climate, has three dominant seasons. Four types of rice are grown such that this is the predominant crop grown throughout the year. Bangladesh is divided into 30 Agro-ecological zones (AEZs) based on land and soil types, physical and ecological factors, i.e. patterns of rainfall, temperature and humidity during the year. These factors all have an impact on the severity of rice diseases (Shahjahan, 1994). Sheath blight is generally known to be wide spread in the north and central regions covering a number of AEZs. When controlling diseases to increase food grain production the impact of management practices on other floodplain producers need to be considered (Barr, 1998). To this end, minimising the load of chemical pesticides should produce a cleaner and safer environment. The Comilla region of Bangladesh could be considered as the rice bowl; rice cropping in this region is intense, with up to three cycles, and sheath blight is considered to be an increasing problem. Nutrient management for rice is considered to be a major issue in this region and in Bangladesh as a whole. Sheath blight (ShB) disease infection on rice plants is a complex phenomenon and is a difficult task to understand by the farmers because it involves numerous subtle interrelationships with host species and their varieties, cultural practices, fertiliser dose and various environmental factors etc. Farmers’ perception is one of the faculties of perceiving the interrelationships. On the other hand, farmers’ perception and favour depend largely on literacy, training, technical knowledge, up to date information, availability of inputs and friendly ecosystem.

12
Therefore, to control sheath blight disease eminently farmers’ perception might be the favourite prerequisite. The present socio-economic survey was conducted in order to assess the farmers’ perceptions on Sheath blight disease that would help to develop appropriate and sustainable control measure and ultimately gain higher profit from the rice farming through proper disease management. The major objectives are to know the farmers’ perception about sheath blight diseases, assess the causes of incidence and damage to rice crops, estimate yield losses and current practices and future options for disease control. In the order of 80-100 million additional people have to be fed each year (IRRI, 1989). The problem is acute in Asia where the average population growth rate is estimated to be 2.4% per annum from 1987-2005 and 1.3% from 2006-2030. Eight hundred million to 1 billion tonnes of rough rice will be needed by 2030 (McDonald, 1996). Rice sheath disease caused by Rhizoctonia solani is one of the major constraints to rice production in Bangladesh. Earlier reports indicated that three species of Rhizoctonia namely Rhizoctonia solani, Rhizoctonia oryzae and Rhizoctonia oryze-sativae cause sheath blight, sheath spot and aggregated sheath spot disease on rice respectively (Miah et al., 1985; Shahjahan, 1991). The later two diseases produce almost similar symptoms as sheath blight. Pathogenic isolates of Rhizoctonia oryze-sativa was isolated from rice in northern parts of Bangladesh (Ali, 2002). However, little is known about the presence of other Rhizoctonia sp on the rice host, their ecological distribution, epidemiology, pathogenic behavior etc. in the context of Bangladesh. Therefore, intensive surveys/investigation on the Rhizoctonia rice sheath diseases was carried in four geographic locations (districts) of Bangladesh during 2001-2003 to monitor the occurrence of sheath blight (R. solani), sheath spot (R. oryzae) and aggregated sheath spot (R. oryzae sativa) diseases and understanding the co-existence of the and pathogens and epidemiology. Recently, in India, Rhizoctonia oryzae (RO, sheath spot) and R. oryzae-sativae (ROS, aggregate sheath spot) have also been recognised as causal agents of rice sheath blight complex (DFID-CPP Project R6643, Rutherford et al., 1999). RS, RO and ROS show differential sensitivity to fungicides and produce overlapping symptoms that are difficult to distinguish in the field. Little is known about the epidemiology of these three pathogens or the relative importance of each as causal agents of the disease. This has led to increased difficulties in implementing appropriate control measures, particularly at the early stages of disease development. Accurate diagnosis of these pathogens is also essential to ensure success in rice breeding programmes aimed at developing sheath blight resistant varieties. Future differentiation of these pathogens will be facilitated by a PCR- based method, which is capable of identifying each species in planta (R6643, Johanson et al., 1998). This methodology will enhance efforts to determine the presence/relative frequency of RS, RO and ROS at different stages, sites and seasons of rice cultivation, notably at the tillering, panicle initiation and booting stages, and the relative survivability of each species as potential inoculum sources in Bangladesh. In 1988 occurrence of R. oryzae and R. oryzae-sativae in Bangladesh on Bangladesh Rice Research Institute (BRRI) farm was reported (Shahjahan et al., 1988). As the disease causes substantial loss to rice crop and its incidence and severity are increasing with intensive rice cultivation sustainable control needs to be developed. In this regard understanding the epidemiology of three Rhizoctonia species involved in rice sheath blight disease complex in four locations of Bangladesh, identify the frequency of occurrence of Rhizoctonia solani (RS), R. oryae (RO) and R. oryae-sativae (ROS) in complex and which species are the major pathogen, analyse the sclerotia/propagules from soil and plant samples and to understand the interactions between the three Rhizoctonia species in colonization and predisposition of the host.
13
To reduce growers’ dependence on fungicides, methods that are cost effective and that can be readily incorporated into integrated management programmes need to be developed. In this scenario, it is essential to exploit biological/natural resources for disease management. Pathologists in a number of countries have initiated programmes on biological control of rice sheath blight (e.g. Mew and Rosales, 1986; Rabindran and Vidhyasekaran, 1996; Shahjahan et al., 2001). Antagonists isolated from soil or the rice rhizosphere were tested against RS and were generally identified as Pseudomonas fluorescens. Although a peat-based formulation of this bacterium has been developed in India (Rabindran and Vidhyaseharan, 1996), there is little evidence that the technology has reached farmers. The biocontrol potential of Trichoderma and Gliocladium spp. against sheath blight pathogen has also been tested (Manibhushanrao et al., 1989; Elavarasan, 1989) and the potency of G. virens under field conditions confirmed (Baby and Manibhushanrao, 1993). Other studies have focused on antagonists, particularly yeasts, on the rice phylloplane against sheath blight (Shahjahan et al., 2001). Organic matter (OM) content of most soils in Bangladesh is low; intensive cropping has led to nutrient mining and more than 50% of the soils have an OM content below the critical level. Application of N fertiliser alone over the years has caused nutrient imbalance, leading to loss of productivity (Karim 1999). The incorporation of organic amnedments has been shown to effectively control rice sheath blight under both glass house and field conditions (Kannaiyan and Prasad, 1981). Organic amendments such as oilseed cakes, green leaf manures and agro-industrial wastes improve the physico-chemical properties of the soil and, more importantly, N in amended soils is leached more slowly (Baby, 2001). Amendment with organic substances also results in rapid stimulation of soil microflora both in the rhizosphere and non-rhizosphere, and significantly, increased the populations of Trichoderma spp. (Baby and Manibshushanrao, 1993). Enhanced microbial populations result in competition, high levels of fungistasis, propagule lysis and increased level of CO2. The integrated exploitation of biocontol agents and organic amendments has been suggested as an effective method to control rice sheath blight disease (Baby, 2001). Miah et. al. (1983) reported that disease severity and yield loss were higher at boot stage than mid-tillering, maximum-tillering and panicle initiation stages. The yield reduction due to sheath blight disease in Bangladesh has estimated to be from 14-31% under experimental and farmer’s field condition (Shajahan et al., 1986). Resistance to sheath blight has been investigated by researchers in several countries. No immunity has been found in elsewhere, but several cultivars with moderate resistance have been identified. Preliminary investigations in Japan suggest that the Indica types of rice are more tolerant than the Japonica types. Among the cultivars grown in the southern United States, highest level of resistance is found in the short and medium-grain types, which are more, like the Japonica rice (Webster and Gunnell, 1992). More recently, there has been increased interest in characterising R-gene mediated partial resistance in rice against ShB. Further, information in relation to disease management by organic amendments and bio-control in Bangladesh is scanty. In view of this, experiments were undertaken to identify suitable organic amendment(s), to identify host resistance sources and to identify potential antagonistic bacteria for biocontrol of sheath blight.

14
Project Purpose New knowledge developed, validated and promoted that reduces poverty through improved and sustainable management of important fungal diseases of food crops (rice sheath blight complex caused by Rhizoctonia spp.) Rice is the foremost staple food in Bangladesh and provides more than 40% of national employment. It has been estimated that by 2020, rice production in Bangladesh will have to increase by 60% to feed the growing population. The average land-use intensity has already reached 180% in Bangladesh, one of the highest in the world. The susceptibility of MVs to several major pests and diseases is a common reason for production losses. Sheath blight is recognised as a high priority constraint to rice production in Bangladesh and there are very few MVs that are resistant to sheath blight. There is a serious lack of knowledge of the epidemiology of the Rhizoctonia spp. pathogens involved in the complex and their specific roles in disease epidemics. In the last 2-3 years, hybrid rice varieties from India and China are being released to farmers in Bangladesh, without sufficient field-testing under local conditions. In the host resistance component of the project, a number of hybrid rice and other elite varieties will be tested for their response to the sheath blight complex. Use of agro-industrial wastes as organic amendments to improve the physico-chemical and biological characteristics of the soils and better crop/disease management is a possibility. Sheath blight is anticipated being of increasing economic significance, particularly with the demand for increased rice production and the agricultural land being diverted for other uses. Specific objectives of the project are to establish the epidemiology of the Rhizoctonia species involved in the sheath disease complex and to develop sustainable management strategies utilising host resistance, cultural and biological control, in order to ameliorate the constraint posed by the rice sheath blight disease complex. This will be achieved by assessing the diversity and distribution of three pathogens and their importance in the disease development utlising diagnostic molecular tools and also by gaining on understanding of the farmers’ perception of the disease and constraints to its management as well as establishing baseline data on the incidence and severity of the disease at hot spots. A number of disease management options - organic amendments, antagonists and host resistance that can be integrated will be assessed Achievement of the project objectives will lead to the development of knowledge, diagnostic tools and resources essential to develop and promote improved management of rice sheath blight complex, which is a primary objective of the target institutions.

15
References Ali, M. A. (2002). Biological variation and chemical control of Rhizoctonia solani
causing rice sheath blight disease in Bangladesh. Ph.D. thesis, University of London, pp.202.
Baby, U.I. and Manibhushanrao, K. (1993) Control of rice sheath blight through the
integration of fungal antagonists and organic amendments. Tropical Agriculture 70, 240-244.
Baby, U.I. (2001) Biocontrol strategies for the management of rice sheath blight
disease. In (Eds.) Sreenivasaprasad, S. and Johnson, R. Major Fungal Diseases of Rice Recent Advances, Kluwer Academic Publishers, The Netherlands, pp. 253 – 269.
Banniza, S., Sy, A.A., Bridge, P. D., Simons, S.A. and Holderness, M. (1999)
Characterization of populations of Rhizoctonia solani in paddy rice fileds in Cote d Ivoire. Phytopathology 89, 414 – 420.
Banniza, S. and Holderness, M. (2001) Rice sheath blight – pathogen biology and
diversity. In (Eds.) Sreenivasaprasad, S. and Johnson, R. Major Fungal Diseases of Rice Recent Advances, Kluwer Academic Publishers, The Netherlands, pp. 201 – 211.
Barr, J.J.F. (1998) Systems investigation of livelihood strategies and resource use
patterns on Bangladesh flood plains. AFSRE 15th International Symposium Proceedings,pp. 994-1003.
Bhuiyan, S.I. and Karim, A.N.M.R. (1999). Rice production in Bangladesh: An
overview. In (Eds.) Bhuiyan, S. I. and Karim, A.N.M.R. Increasing rice production in Bangladesh: Challenges and strategies BRRI, Dhaka and IRRI, Philippines, pp. 1-12.
Biswas, A. (1999). Resistance in rice germplasm to sheath blight disease in West
Bengal, India. Environmental Ecology 17, 1039 – 140. Chowdhury, M.S.U. (1999). Rice research in Bangladesh: Preparing for the 21st
century. In (Eds.) Bhuiyan, S. I. and Karim, A.N.M.R. Increasing rice production in Bangladesh: Challenges and strategies BRRI, Dhaka and IRRI, Philippines, pp. 79 – 90.
Datta, K., Velazhahan, R., Oliva, N., Ona, I., Mew, T., Khush, G.S., Muthukrishnan, S.
and Datta, S.K. (1999) Over-expression of the cloned rice thaumatin-like protein (PR-%) gene in transgenic rice plants enhances environmental friendly resistance to Rhizoctonia slonai causing sheath blight disease. Theoretical and Applied Genetics 98, 1138-1145.
Elavarasan, A. (1989) Studies on the biocontrol potential of Gliocladium virens against
rice sheath blight disease. M.Phil. dissertation, University of Madras. Hashiba, T. and T. Ijiri (1989). Estimation of yield loss and computerized forecasting
system (BLIGHTAS) for rice sheath blight disease. Tropical Agriculture Research Series No. 22:163-171
IRRI (1989). Towards 2000 and Beyond. International Rice Research Institute. Manila,
Philippines.

16
IRRI (1993). Rice Facts. International Rice Research Institute. Manila, Philippines. Johanson, A., Turner, H.C., McKay, G.J. and Brown, A.E. (1998) A PCR-based method
to distinguish fungi of the rice sheath blight complex, Rhizoctonia solani, R. oryzae and R. oryzae-sativae. FEMS Microbiology Letters 162, 289-294.
Kalaiselvi, K., Sreenivasaprasad, S. and Manibhushanrao, K. (1986) Acquired resistance
of rice leaves to Rhizoctonia solani. International Rice Research Newsletter 11, 16. Kannaiyan, S. and Prasad, N.N. (1978) Seed-borne nature of sheath blight pathogen
Rhizoctonia solani in rice. International Rice Research Newsletter 3, 10. Kannaiyan, S. and Prasad, N.N. (1981) Effect of organic amendments on seedling
infection of rice caused by Rhizoctonia sloani. Plant and Soil 62, 131-133. Karim, Z. (1999). Accelerating the growth of agriculture in Bangladesh. In (Eds.)
Bhuiyan, S. I. and Karim, A.N.M.R. Increasing rice production in Bangladesh: Challenges and strategies BRRI, Dhaka and IRRI, Philippines, pp. 53-64.
Kobayashi, T.; Ijiri, T.; Mew, T. W.; Maningas, G. and T. Hashiba (1995). Computerized
forecasting system (BLIGHTAS IRRI) for rice sheath blight disease in the Philippines. Ann. Phytopathol. Soc. Jpn. 61: 562-568
Kumari, S.L., Joseph, T., Nayar, N.K. and Niza, T.J.R. (1998) Field tolerance levels of
indica rice varieties for major diseases of Kerala. Crop Research 15, 112-114. Lee, E.N. and Rush, M.C. (1983) Rice sheath blight: a major disease. Plant Disease
67, 829-832. Lin, W., Anuratha, C.S., Datta, K., Potrykus, I., Muthukrishnan, S., Datta, S.K. (1995)
Genetic engineering of rice for resistance to sheath blight. Bio/Technology 13, 686-691.
Manalo, J.O., Mew, T.W., Teng, P.S., Velilla, A. R. and Borromeo, E.S. (2001)
Populations of rice sheath blight in the Ilocos Norte rice –based ecosystem. In (eds) Mew, T.W., Borromeo, E.S. and Hardy, B. Exploiting biodiversity for sustainable pest management. IRRI, Philippines, pp. 101 – 111.
Manibhushanrao, K. and Sreenivasaprasad, S. (1985) Inhibition of polygalacturonase
activity of rice pathogens by the oxidised products of chlorogenic acid. Current Science 54, 146-148.
Manibhushanrao, K., Sreenivasaprasad, S. and Parvathi, V. (1986) Changes in phenolic
constituents of rice in response to Rhizoctonia solani infection. Indian Journal of Botany 9, 104-111.
Manibhushanrao, K., Zuber, M. and Sreenivasaprasad, S. (1987) Mycelial aminoacid
composition of differentially virulent isolates of Rhizoctonia solani. Current Science 56, 619-621.
Manibhushanrao, K., Sreenivasaprasad, S. and Chitralekha, R.S. and Kalaiselvi, K.
(1988) Cross protection in rice to sheath blight. Journal of Indian Botanical Society 67, 97-100.

17
Manibhushanrao, K., Sreenivasaprasad, S., Baby, U.I. and Joe, Y. (1989) Susceptibility of rice sheath blight pathogen to mycoparasites. Current Science 58, 515 – 518.
Matsumoto, M. and Matsuyama, N. (2001) RFLP analysis of the PCR-amplified 28S
ribosomal DNA for revision of genetic relationships in Rhizoctonia spp. In (Eds.) Sreenivasaprasad, S. and Johnson, R. Major Fungal Diseases of Rice Recent Advances, Kluwer Academic Publishers, The Netherlands, pp. 213 – 222.
McDonald, D. J. (1996). Temperate Rice Technology for the 21st century-the new
South Wales example. In: Proceedings of the workshop on temperate rice: achievement and potential in 21-24th Feb.1994, New South Wales, Australia. Vol.1, pp1-12.
Mew, T.M. and Rosales, A.M. (1986) Bacterization of rice plants for control of sheath
blight caused by Rhizoctonia solani. Phytopathology 76, 1260-1264. Miah, S. A., Shahjahan, A. K. M., Sharma, N. R, Hossain, M. A., and Ahmed, H. U.
1983. Critical stage (s) of infection for sheath blight and stem rot of rice. Abst. Section 1. No. 123: 65-66. Eighth Annual Bangladesh science Conference. Feb.5-9.
Miah, S. A., Shahjahan, A. K. M., Hossain, M. A. and Sharma, N. R. 1985. Survey of
rice disease in Bangladesh. Trop. Pest Mana. 31(3): 208-213. Ou, S. H. (1985) Rice diseases. CMI. Kew, England. 380p. Pan, X.B., Rush, M.C., Sha, X.Y., Xie, Q.J., Linscombe, S.D., Stetina, S.R., Oard, J.H.
(1999) Major gene, nonallelic sheath blight resistance from the rice cultivars Jasmine 85 and Teqing. Crop Science 39, 338 -346.
Rabindran, R. and Vidhyasekharan, P. (1996) Development of a formulation of
Pseudomonas fluorescens PFALR2 for management of rice sheath blight. Crop Protection 15, 715-721.
Reddy, M.M., Madhusudan, T., Kulkarni, N. and Kashikar, M. (1997) Sources of
resistance to sheath blight. International Rice Research Notes 22, 25. Rush, M.C. and Lee, F.N. (1992) Sheath blight. In: Compendium of Rice diseases,
Eds. R.K. Webster and P.S. Gunnal. APS, St Paul, MN, pp. 22-33. Rush, M.C., Pan, X.B., Sha, X.Y., Linscombe, S.D., Xie, G.J. and Erwin, S.R. (1995)
Development of sheath blight resistance in rice. 87th Annual Rice Research Report, Rice Research Station, Crowley, LA, pp. 380-390.
Rutherford, M.A., Turner, H.C. and Bridge, P.D. (1999) Investigation of the Rhizoctonia
sheath blight complex in rice. Final Technical Report (R6643), DFID – NRIL-CPP. Shahjahan, A. K. M., Sharma, N. R., Ahmed, H. U. and Miah, S. A. 1986. Yield loss in
modern rice varieties due to sheath blight in Bangladesh. J. Agric. Res. 11: 82-90.
Shahjahan, A. K. M., S. I. Akanda, H. U. Ahmed, and S. A. Miah. 1988. Aggregate sheath
spot caused by Rhizoctonia oryzae-sativae in BRRI farm. Bangladesh J Plant Path. 4 (1&2): p.146.

18
Shahjahan, A. K. M. 1991. Comparative studies on sheath blight, sheath spot, and aggregate sheath spot of rice caused by three Rhizoctonia species. Bangladesh J. Plant Path. 7(1&2): 25-31.
Shahjahan, A.K.M. (1994) Practical approaches to rice blast management in tropical
monsoon ecosystems, with special reference to Bangladesh. In: Rice Blast disease. Eds. R.S. Zeigler, S.A. Leong and P.S. Teng.
Shahjahan, A.K.M., Rush, M.C. and Groth, D.E. (2001) Phylloplane yeasts as potential
biocontrol agents for rice sheath blight disease. In (Eds.) Sreenivasaprasad, S. and Johnson, R. Major Fungal Diseases of Rice Recent Advances, Kluwer Academic Publishers, The Netherlands, pp. 235 - 252 .
Sharma, N.R. and Teng, P.S. (1996) Rice sheath blight: effect of crop growth stage on
disease development and yield. Bangladesh Journal of Plant Pathology 12, 1-2. Sreenivasaprasad, S. (2000). Isolation of fungal nucleic acids. In (Eds) Rapley, R. and
Walker, J. M. Nucleic Acids Protocols Handbook. Eds, Humana Press, NJ, U.S.A., pp. 37-45.
Tan, W. and Mew, T.W. (2001) Bacterial antagonists against Rhizoctonia solani AG1 in
irrigated rice ecosystems. . In (eds) Mew, T.W., Borromeo, E.S. and Hardy, B. Exploiting biodiversity for sustainable pest management. IRRI, Philippines, pp. 113 – 131.
Ui, T., T. Naiki and M. Akimoto. (1976) A sieving flotation technique using hydrogen
peroxide solution for determination of sclerotial population of Rhizoctonia solani Kuhn in soil. Annals of the Phytopathological society of Japan.42;46-48.
Waheeta, A., Sreenivasaprasad, S., Chitralekha, R.S. and Manibhushanrao, K. (1987)
Induced resistance in rice to sheath blight disease. Current Science 56, 486- 489. Webster, R. K. and P. S. Gunnell. (1992) Compendium of Rice Diseases. APS press,
American Phytopathological Society, 62 p. Zou, J.H., Pan, X.B., Chen, Z.X., Xu, J.Y., Lu, J.F., Zhai, W.X. and Zu, L.H. (2000)
Mapping quantitative trait loci controlling sheath blight resistance in two rice cultivars (Oryza sativa L.). Theoretical and Applied Genetics 101, 569 – 573.
19
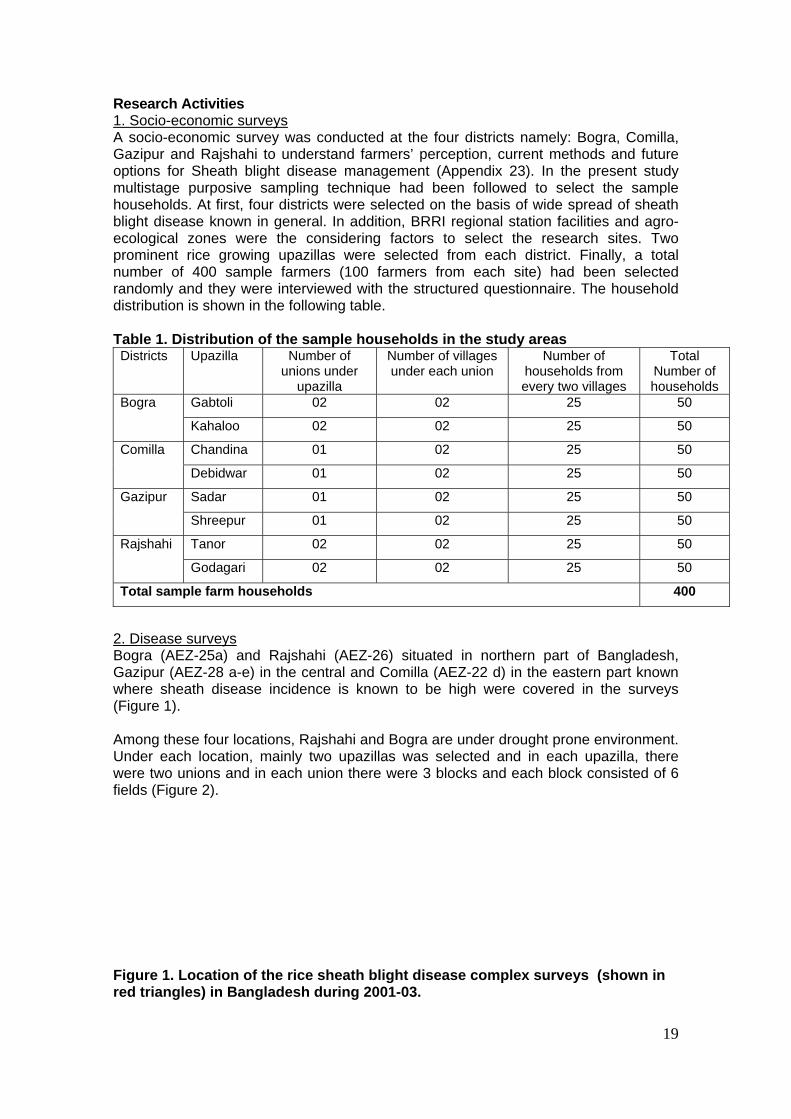
Research Activities 1. Socio-economic surveys A socio-economic survey was conducted at the four districts namely: Bogra, Comilla, Gazipur and Rajshahi to understand farmers’ perception, current methods and future options for Sheath blight disease management (Appendix 23). In the present study multistage purposive sampling technique had been followed to select the sample households. At first, four districts were selected on the basis of wide spread of sheath blight disease known in general. In addition, BRRI regional station facilities and agro-ecological zones were the considering factors to select the research sites. Two prominent rice growing upazillas were selected from each district. Finally, a total number of 400 sample farmers (100 farmers from each site) had been selected randomly and they were interviewed with the structured questionnaire. The household distribution is shown in the following table. Table 1. Distribution of the sample households in the study areas Districts Upazilla Number of
unions under upazilla
Number of villages under each union
Number of households from every two villages
Total Number of households
Gabtoli 02 02 25 50 Bogra
Kahaloo 02 02 25 50
Chandina 01 02 25 50 Comilla
Debidwar 01 02 25 50
Sadar 01 02 25 50 Gazipur
Shreepur 01 02 25 50
Tanor 02 02 25 50 Rajshahi
Godagari 02 02 25 50
Total sample farm households 400
2. Disease surveys Bogra (AEZ-25a) and Rajshahi (AEZ-26) situated in northern part of Bangladesh, Gazipur (AEZ-28 a-e) in the central and Comilla (AEZ-22 d) in the eastern part known where sheath disease incidence is known to be high were covered in the surveys (Figure 1). Among these four locations, Rajshahi and Bogra are under drought prone environment. Under each location, mainly two upazillas was selected and in each upazilla, there were two unions and in each union there were 3 blocks and each block consisted of 6 fields (Figure 2). Figure 1. Location of the rice sheath blight disease complex surveys (shown in red triangles) in Bangladesh during 2001-03.
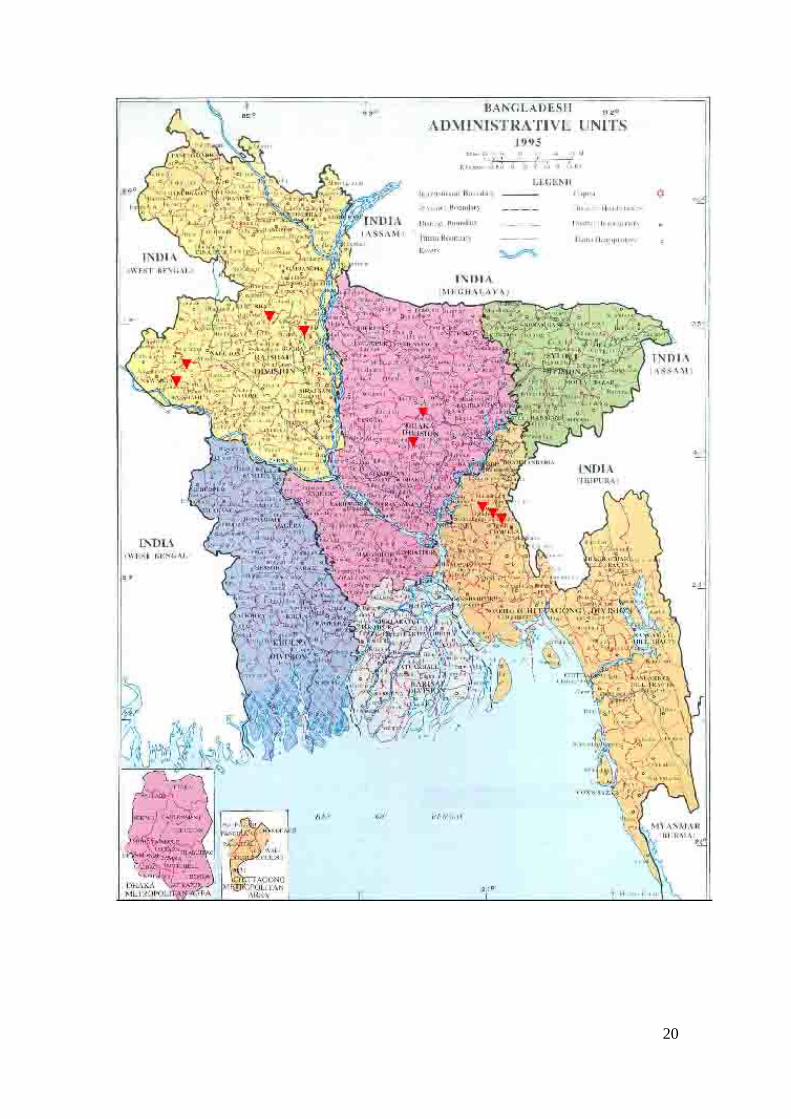
20

21
BANGLADESH
Comilla Rajshahi Gazipur Bogra
Upazilla 1 Upazilla 2
Union 1 Union 2
Block 2
Block 3
Block 1
Field 5
Field 6
Field 3
Field 2
Field 4
Field 1
Figure. 2. Schematic presentation of Rhizoctonia rice sheath disease complex survey protocol
Spot 3
Spot 1 Spot 4
Spot 5
Spot 2
Figure 3. Schematic presentation of sampling pattern in a field; spots (each 1 m x 1 m area) showing the position from where disease records were taken/soil samples were collected

22
In each field there were five spots of 1 m2 area (Figure 3). Surveys were made in three seasons namely Transplanted Aman 2001(T Aman 01), Boro 2001-2 and T. Aman 2002 for all the locations. An additional survey was conducted in Tanore upazilla of Rajshahi during T. Aus 2003. Data of the diseases were taken in 2-3 stages of the crop, maximum tillering to panicle initiation, boot to flowering and flowering to milking stages. Data for each disease were summarised by the variables Incidence (I) and Severity Index (SI) (Hashiba and Ijiri, 1989). where
I/Horizontal development (A) = (Number of diseased plants/Sum of sampled plants) x 100 RLH/ Vertical progress (X) = (Lesion height/plant height) x 100 SI = (1.62*X-32.4)*A/100
Where, X = vertical progress of the infected plant population &
A = horizontal progress Estimated yield loss was calculated following the model of Kobayashi et al. (1995): estimated yield loss (Kg/ha)(L) = (41.31X-826.2)*A/100. Data analyses were performed by IRRISTAT with the mean data of six fields in each block and the block mean were considered as replication. 3. Pathogen isolation, pathogenicity tests and interactions Isolation of Rhizoctonia spp. from infected plant samples Infected plant samples collected during 2001-2002 disease surveys from four sites (Bogra, Comilla Gazipur, and Rajshahi) were preserved in refrigerator. The symptoms produced by the three pathogens are shown in Plate 1. Individual samples were cut into small pieces. The cut pieces were washed with sterile water (for 2 minutes) and then surface sterilised by Chlorox (for 2 minutes) and then finally washed with sterile water (for 2-3 minutes). These were dried on sterile tissue paper. Dried samples were placed on the water agar plate and incubated at 25+ 20C for growth. Fungal hyphal tips emerging after 2-3 days of incubation were transferred to potato dextrose agar (PDA) medium and incubated for 48-72 h for growth of the fungus. The fungus was identified based on mycelial growth, colony character, sclerotia formation and sclerotial size. The colony characters of the three Rhizoctonia species are shown in Plate 2. Where appropriate, PCR based diagnostic tests were used to confirm the identity of the pathogen isolates, using previously characterised reference isolates. Individual cultures were grown in culture test tube containing PDA and preserved in room temperature for future use. Representative samples from a total of 1799 infected plant specimens collected from four sites were used for this purpose (Appendix 17). Isolation and identification of ShB sclerotia from soil samples of infected rice fields Soil samples collected from three different sites Gazipur, Comilla and Bogra were used for this purpose. A composite sample of 500 g from each filed was blended with 2 l of water in a blender for 2-5 seconds. The mixture was then sieved to separate sclerotia from soil sample (Ui et al., 1976). Sclerotia with plant debris remained on a sieve and soil particle passed through the sieve and was collected in water in a beaker. Sclerotia with some plant debris floated on water and rest of the debris remained under water in beaker. This mixture was sieved through a piece of tissue paper in glass funnel. The sclerotia with some debris trapped on the tissue paper was air dried for thirty minutes. These sclerotia were separated from debris under a stereomicroscope, plated on PDA and incubated at 280C for germination. The cultural characteristics of Rhizoctonia spp. were checked and preserved for further use.

23
Pathogenicity of Rhizoctonia solani, R. oryzae-sativae and R. oryzae isolates from infected plant samples Three species of Rhizoctonia, isolated from infected plant samples were evaluated for their virulence in green house during T. Aus 2003. Twenty five-day old seedlings of rice variety BR1 were transplanted in pots at 2 seedlings/hill. The pots were fertilised as per recommended dose. The plants were inoculated at maximum tillering stage using PDA grown cultures of the pathogens. The inocula were placed at the base of each hill between the tillers and held with a rubber band and a bamboo stick. The experiment was laid out in completely randomized block design (CRD) with three replications. Data on % tiller infection and % relative lesion height (RLH%) was recorded at mature stage. To test the pathogenicity of Rhizoctonia spp. from rice field soils, four isolates of R. solani and two isolates of R. oryzae-sativae isolated from soil from four different sites were evaluated for their virulence as described above. Pathogenicity of Rhizoctonia solani isolates of diverse origin The experiment was conducted at the BRRI Rajshahi in order to know the isolates capability of causing disease on rice, to understand whether isolate sources have any effect on virulence. Isolates present n soil loose viability over time. Understanding the role of this soil borne isolates is extremely important for epidemiology and management. Pathogenicity on detached leaf sheath: Rice plants of cultivar BRRIdhan30 were used. A CRD design was followed with six - nine replications. A piece of top stem-leaf (flag leaf sheath) sheath approximately 10-15 cm long was selected and kept in a beaker with H2O (preferably sterile water). The pieces was washed into 10% Ethanol for 1 min Then these were wash in antibiotic solution (streptomycin 1-5 mg or chloramphenicol @ 250mg/l). Then it was washed further in clean water. The excess water was removed from the cut pieces of leaf-sheath by sterile tissue paper or cloths. Inoculum (sclerotia of similar size or PDA plug of 2-3 mm diameter of growing mycelium or single colonized rice hull) was insert at the rear cut side of each piece. The single inoculated stem-leaf-sheath piece was placed into a sterile test tube of slightly longer than the piece such a way that inoculated side would go to the bottom of the tube. The tubes were incubated in desiccators (with some water for maintaining high relative humidity (90-100%) at 20-32 0C or at ambient temperature either in dark or light. The disease progress was monitored everyday starting from three days after inoculation (DAI) until any isolate produces lesions covering upto the uppermost part of the piece this would happen usually within 7-10 DAI or more. Pathogenicity of sheath blight pathogen on rice seedlings: The experiment was conducted in pots of 12-15 cm diameter. The pots were filled up with compost, gently compacted, soaked with water and left overnight for drain out excess water. Three holes (1 -2 cm depth) were made approximately equal distance from each other on the compost surface of the pot and 4-6 sprouted seeds of susceptible cultivar (BR 11) placed in each hole and covered up gently by compost. Seedlings were allowed to grow 5-10 cm long and healthy seedlings of approximately same age were maintained as control and the seedlings growing together from a point were considered a hill. Inoculations were made with a growing mycelial plug (3-mm dia.) at the base of seedlings and center for each hill and the posts were covered up immediately (to prevent dry up of inoculum plug) with a polyethylene case or equivalent. The pots were left in a tray with water and placed taking care to prevent high temperature (temperature inside plastic case not to exceed 32 0C). The disease progress was monitored starting 7 days after incubation. Final disease measurement

24
was taken as soon as the disease (lesions) caused by any isolate covers the topmost leaf sheath. Incidence and RLH were taken for each isolate from which severity index was calculated. Data for each seedling were taken (21 day after inoculation) separately for each hill and each hill was considered a replication; care was taken to maintain high RH throughout. Interactions among Rhizoctonia solani (RS), Rhizoctonia oryzae-sativae (ROS) and Rhizoctonia oryzae (RO) under field condition Twenty-five day old seedlings of BR11 were transplanted in 3m x 3m unit plots with three replications at 15 x 20-cm spacing. Standard agronomic practices were followed to grow the plants. There were 11 treatments including control. Plants were inoculated with 7-10 days old culture of RS, RO and ROS grown on rice hull medium at panicle initiation stage. The experiment was laid out in CRD design. 4. Molecular diagnostics Cultures broadly representing the disease surveys were used for this activity. Routine cultures were maintained on PDA and liquid cultures were grown in potato dextrose broth (PDB). Mycelial mats were harvested after five to seven days and freeze dried. Approximately 50 –100 mg of ground mycelial powder was used for DNA extractions using commercial kits (Qiagen/Sigma). Infected samples were ground under liquid nitrogrn to fine powder and used for DNA extraction following a rapid protocol (Sreenivasaprasad, 2000) as below. 75 mg of infected tissue was ground with a pinch of autoclaved sand using a mortar and pestle and stored in 2ml microfuge tubes. In order to break open cells 500μl of lysis buffer (0.2 M Tris pH8, 0.25 M NaCl, 25 mM EDTA, 0.5% SDS and 5% skimmed milk) was added to the ground sample and vortexed vigourously till no clumps were visible. Samples were incubated in a water bath at 60˚C for 15 minutes and then centrifuged (13,000 rpm) for 5 minutes to settle sand and cell debris. The supernatent containing the DNA was carefully removed by pipetting and transferred to 1.5ml microfuge tubes. The volume of supernatent was determined visually and an equal volume of isopropanol was added to each sample. Isopropanol instantly precipitates larger DNA. The samples were then mixed and centrifuged for 5 minutes to collect DNA which formed a pellet at the base of the microfuge tubes. The supernatent was discarded from the microfuge tubes and 750μl of 70% ethanol was added to dissolve salt. The pellet in the microfuge tubes was dislodged and mixed in the 70% ethanol after which samples were centrifuged for 5 minutes. 70% ethanol wash was repeated again as outlined above. Residual ethanol was allowed to evaporate by air drying for 30 minutes. 150μl of distilled water was then added to the dry pellets to dissolve DNA, which was stored in a freezer (Sreenivasaprasad, 2000). Diagnostic PCR tests for the three pathogens and corresponding diseases were optimised by designing new primers based on sequence data available in the databases in general and characterised isolates. Further, thermal cycling parameters particularly higher annelaing temperature and reduced annelaing time were followed to enahnce specificity. The crudely extracted DNA from plant material was diluted 1:10 with water and 5μl was used as template DNA in PCR analysis. DNA from each sample was tested for the presence of R. oryzae sativae, R. oryzae and R. solani using species-specific primers developed from the rRNA gene block sequences. In addition each sample was tested with universal ITS1 forward and ITS4 reverse primers to confirm that the DNA sample was amenable to PCR amplification. R. solani, R. oryzae sativae and R. oryzae genomic DNA obtained from fungal cultures were included as controls. In addition DNA from healthy rice plant and distilled water were used as controls. The reaction mix contained taq polymerase, dNTPs and buffer. The specific primers were developed at Warwick HRI and used along with ITS1 and ITS4 conserved

25
primers. PCR was conducted in a Phoenix thermal cycler (Helena Biosciences), at the following thermal cycling profile : STAGE 1 : 94°C for 2 minutes; 60°C for 1 minute (1 cycle), STAGE 2 : 72°C for 30 seconds; 94°C for 30 seconds; 60C for 30 seconds (40 cycles) and STAGE 3 : 72°C for 10 minutes (1 cycle). Ready mix red taq from Sigma was used in 20 ul reactions and an aliquot tested on agarose gel. Positive controls based on non-specific amplification of ribosomal DNA-ITS regions and negative controls without DNA were routinely maintained. Care was taken to avoid cross contamination in PCR tests and where necessary/feasible reactions were set up in laminar flow bench. To generate molecular profiles for genetic characterisation of various Rhizoctonia isolates simple sequence repeat (SSR) and amlification fragment length polymorphism (AFLP) PCR based markers were used with up to six primers. Aliquots of the reactions were run on agarose gel and photographic images recorded for analysing the profiles. Phoretix gel compare software which incorporates cluster analysis was used to assess relatedness of the isolates. 5. Disease management Efficacy of organic amendments A total of six experiments were conducted on station at BRRI, Comilla, Gazipur and Rajshahi in T. Aus, T. Aman and Boro during 2002-2003. Rice varieties BR24 or BR26, BR11 and BRRIdhan28 or BRRI dhan29 were used in T. Aus, T. Aman and Boro seasons, respectively. A total of fifteen organic matters namely, compost (5.56t/ha), vermicompost (3.33t/ha), pressmud (3.33t/ha) mustard oil cake (3.33t/ha), wheat bran (3.33t/ha), pulse bran (3.33t/ha), rice bran (3.33t/ha), saw dust (3.33t/ha), poultry manure (3.33t/ha), royna (2.22t/ha), bishkatali, sonalu (2.22t/ha), urmoi (Sapium indicum) (2.22t/ha), Neem (2.22t/ha), and dhol kalmi (2.22t/ha) were tested for the control of sheath blight disease. After 1st ploughing, the selected organic matters were incorporated in soil and allowed 10 days for decomposition. Upon decomposition, final land preparation was done and young rice seedlings were transplanted. The experiment was set up following CRD design with three replications. One or two control treatments were maintained. The plot size was 3mX 3m and naturally infection with ShB was monitored except in Rajshahi where due to very low incidence of sheath blight in the field the experimental plots were inoculated with R.solani inocula fifteen days before land preparation. Recommended fertiliser doses and cultural practices were followed (BRRI, 2000). Data on % RLH, % tiller infection, severity index and grain yield were recorded at grain filling stage. Screening rice varieties/lines with Rhizoctonia spp. isolates A total of 35 rice cultivars/advanced lines were screened against sheath blight (ShB), aggregate sheath spot (AShS) and sheath spot (ShS) diseases at the BRRI regional stations Rajshahi and Gazipur in T. Aman, 2002. In Rajshahi, cultivars were tested against R. solani. Twenty five-day-old rice seedlings were transplanted at two seedlings per hill. Single row of 3-m long was used for each test entry. Susceptible check, swarna was transplanted in every alternate row. The spacing was 20 cm x 20 cm. But in Gazipur, A pot experiment was done and cultivars were screened against ShB, AShS, and ShS separately. Recommended fertilisers were applied and appropriate cultural management was accomplished as and when necessary. Artificial inoculation was made at 70 days (maximum tillering stage) in middle 3 hills for each row (for field) or water level at base of a hill in the pot. The experiments were laid out in CRD design with 3 replications, respectively. Disease data was recorded from inoculated tillers following the Standard Evaluation System for rice (IRRI, 1996).

26
Isolation of antagonistic bacteria for biocontrol The experiment was conducted to assess whether any antagonistic bacteria could be found against the sheath blight pathogen from infected plant samples. The infected plant samples (collected during T. Aman 2002 from four sites (Bogra, Comilla, Gazipur and Rajshahi) were cut into small pieces. Every piece containing ¼ infected portion & ¾ healthy portion. Two pieces of infected plant samples were soaked in 20 ml distilled water in a small beaker for one hour. Then samples were shaken by hand for few minutes and a loopful of water used to soak infected samples was streaked on King’s B. Agar (KBA) plate. These plates were kept in the incubator (28oC) for 24 hours for bacterial growth. These were put under a UV light to identify fluorescent bacteria. The fluorescent bacteria (single colony) observed were transferred to KBA slants (culture tubes). In bioassays, bacteria were streaked onto potato dextrose agar (PDA) plates having the pathogen Rhizoctonia solani to record antagonism between bacteria and the pathogen. Based on the degree of antagonism the bacterial isolates were grouped into (i) Good - retaining antagonism for 72 h and beyond, (ii) Mederate - inhibition zone merged by 72 h and (iii) Poor - inhibition merged by 48 h.

27
Outputs 1. Socio-economic and disease surveys conducted in four key rice growing districts in Bangladesh provided baseline information on the impotance of the disease, its occurrence and the range of varieties used by famers and the constrains faced by the farmers and their perception of the disease and its management. Diversity, distribution, pathogenicity and epidemiology of the three Rhizoctonia species involved in rice sheath blight diseases and the most important species have been established based on pathological and molecular assays and the knowledge disseminated to target beneficiaries: 2. Varietal screening has led to the identification of a number of promising varieties that could be used for promotion and/or in BRRI breeding programmes. A range of organic amendments was tested among which some showed the potential to decrease the disease and to incrase the biomass/yield. Antagonistic bacteria that inhibit the pathogen in cultural bioassys have been identified and offer the scope to test them for disease control. Annual review meetings and a stake holder workshop held in- country with participation from BRRI HQ and sub-stations as well as other agencies related to rice R & D in Bangladesh provided opportunities for discussion and local disseminartion of outputs. Project outputs have been presented at national and international conferences for wider dissemination. A three month research attachment was offered to BRRI pathology staff and close linkages were maintained with IPSA and Imperial College where BRRI pathologists were carrying out PhD programmes and also with previous CPP project outputs contributing to capability strengthening and dissemination. 1. Socio-economic surveys and farmers’ perception of sheath blight disease and its management The survey was carried out to gain anunderstanding of the livelihood isses of the rice farmers in Bangladesh in relation to ShB management (Appendix 23). Average family size of the households was 6-8 in the study areas. Most of the farmers had a secondary level of education indicating that the farmers are now more educated than in the past. The majority of the selected households depended on agriculture and it was the main source of livelihood (Table 2). The share of agriculture in total annual income was comparatively low in case of Gazipur and Comilla and high in Bogra and Rajshahi. Male farmers were more involved in agricultural activities than the female. The participation of female members in agricultural activities was limited to a few task and those were confined to homestead areas only. Table 2. Farmers’ livelihood issues in the study areas Variables Bogra Comilla Gazipur Rajshahi
Age of the households (years) 45 51 46 43
Education of the households (years of schooling)
8 6 6 6
Family size (no.) 6 8 7 6
Farm size (decimal) 186 139 241 266
Annual income (Tk) 57630 93664 317219 80692
Share of agriculture in total annual income (%)
77 42 23 77
Average hours spent in agriculture by household heads (hours/day)
7.72 5.12 5.03 5.87
Average hours spent in agriculture by household spouses (hours/day)
8.62 3.69 3.84 4.51

28
Membership of households in different organization (%)
27 21 42 31
Access to credit facilities (% of households)
40 31 15 43
Access to agriculture support service (% of households)
27 32 16 45
Farmers had only limited knowledge of sheath blight disease and at the time of interviews a large number of farmers could not clearly distinguish between symptoms of diseases and insect damage rather any infestation was considered as insect attack. So they applied insecticide even if the infestation is caused by fungus or others organisms. As a result, despite the inputs the level of infestation increases resulting in damage to the crop. Thus emphasis was given to collecting information on disease incidence and severity, experience of the disease during last three years, disease management methods, consequences of varietal repetition on sheath blight incidence, effect of plant spacing, number of seedlings per hill, yield loss due to biotic and abiotic factors and effect of pests and diseases in general. Farmers did not know sheath blight disease as as such, however, after briefing about the disease and showing the symptom they could identify the disease. In local dialect in different areas sheath blight is called Kalopocha or Pochon or Kholpora. Among the surveyed Households 55% Aman and 53% Boro farmers opined that their rice fields were infested with Sheath blight disease moderately and only 11% Aman and 6% Boro farmers mentioned high infestation with the same disease. Disease severity repoted was more in Aman than Boro season when moderate and high severity is considered collectively (Table 3). Table 3. Farmers’ responses on sheath blight incidence and severity in the Aman and Boro seasons
Percent of farmers responded
Bogra Comilla Gazipur Rajshahi All locations Disease severity
Aman Boro Aman Boro Aman Boro Aman Boro Aman Boro
None 40 48 48 37 38 38 10 43 34 42
Moderate 49 52 44 60 54 58 73 41 55 53
High 11 00 08 03 08 04 17 16 11 06
According to the survey, yield loss was most common in HYV rices. In general, irrespective of disease occurrence, rice production was higher in Boro season and lower in Aman season. The environment in Aman season is much more congenial for disease development than Boro season. So, disease incurred more loss in Aman season. Yield loss is relatable to the degree of severity, for example when disease severity was high the rice yielded 3.04 t/ha in Aman season and 3.80 t/ha in Boro season, but when disease infestation was moderate rice yielded 3.57 and 4.76 t/ha from Aman and Boro seasons, respectively. When rice fields were free from diseases both Aman and Boro gave the highest yields 3.85 and 5.07 t/ha, respectively (Table 4).

29
Table 4. Yield in relation to the degree of sheath blight severity in Aman and Boro seasons
Average yield (t/ha)
Bogra Comilla Gazipur Rajshahi All locations Disease severity
Aman Boro Aman Boro Aman Boro Aman Boro Aman Boro
None 3.28 4.89 3.93 5.74 4.49 4.84 3.69 4.79 3.85 5.07
Moderate 3.06 4.61 3.81 5.46 4.19 4.78 3.22 4.19 3.57 4.76
High 2.82 NA 3.69 4.71 2.78 3.31 2.87 3.39 3.04 3.80
NA: In Bogra high severity of sheath blight disease was not recorded in Boro season.
Farmers were asked about the incidence of sheath blight disease during last three years. According to 57% Boro and 67% Aman farmers the disease appeared every year, whilst other famers mentioned irregular incidence (Table 5). Though farmers were not familiar to the disease sometimes block supervisors of DAE and organizers of CARE helped them by identifying the disease. Table 5. Farmers’ Experience on sheath blight incidence during last three years
Percent of farmers responded
Bogra Comilla Gazipur Rajshahi All locations Incidence of disease Ama
n
Boro Aman Boro Aman Boro Aman Boro Aman Boro
Every year
61 53 69 63 47 19 91 93 67 57
Not every year
30 35 13 07 14 14 09 06 17 16
Not sure 09 12 18 30 37 67 00 01 16 27
Repeated used of same variety year after year appears to be one of the causes of the spread and higher incidence of the disease. Almost 61% Aman and 48% Boro farmers who observed the sheath blight disease used the same variety for the last three years (Table 6). On the contrary, farmers who used different varieties in different years reported lesser incidence of the diease in general. More farmers reported sheath blight occurrence in Aman season than Boro season in all locations of Bogra, Comilla, Gazipur and Rajshahi districts. Results indicated that varietal repetition leads to recurrent incidences of sheath blight. Rotation of varieties may be one option for partial control of the disease.
Table 6. Varietal use pattern and occurrence of sheath blight during the last three years
Percent of farmers responded
Bogra Comilla Gazipur Rajshahi All locations Occurrence of ShB disease Aman Boro Aman Boro Aman Boro Aman Boro Aman Boro
Observed (61) (53) (69) (63) (47) (19) (91) (93) (67) (57)
Same variety 53 (32)
52 (28)
62 (43)
41 (26)
43 (20)
27 (05)
85 (77)
70 (65)
61 (43)
48 (31)

30
Different variety
47 (29)
48 (25)
36 (25)
59 (37)
57 (27)
68 (13)
13 (12)
19 (18)
38 (23)
49 (23)
Not sure 00 (00)
00 (00)
02 (01)
00 (00)
00 (00)
05 (01)
02 (02)
11 (10)
01 (01)
04 (03)
Not observed
(39) (47) (31) (37) (53) (81) (09) (07) (33) (43)
Note: Figures in the parentheses indicate the number of respondents
Almost 100% farmers preferred transplanting method both in Aman and Boro seasons but broadcast or direct seeded method is followed to some iextent in Aus season. Haphazard or closer spacing increased the severity of the sheath blight disease. Reported observations suggest that during last three years sheath blight disease incidence was noticed by 74% Aman and 60% Boro farmers foolowing 6"x 6" spacing and 21% Aman and 15% Boro farmers following 8"x 8" spacing (Table 7). Therefore, lesser the spacing higher the disease incidence and with higher the spacing less disease incidence occurred. Farmers’ perception on the severity of sheath blight disease in relation to number of seedling per hill was found to vary with respect to location. The farmers of Bogra repoted that lower the number of seedling per hill higher the disease severity. On the other hand, Comilla farmers had just the opposite view. In Rajshahi and Gazipur districts farmers reported no such relationship.
Table 7. Plant Spacing practised by the farmers and occurrence of sheath blight during the last three Years
Percent of farmers responded
Bogra Comilla Gazipur Rajshahi All locations Plant spacing (Inc. × Inc.) Aman Boro Aman Boro Aman Boro Aman Boro Aman Boro
Observed (61) (48) (69) (63) (46) (19) (90) (57) (66) (47)
6 × 6 79 (48)
50 (24)
65 (45)
43 (27)
91 (42)
52 (10)
60 (54)
95 (54)
74 (47)
60 (29)
8 × 6 21 (13)
46 (22)
00 (00)
22 (14)
00 (00)
32 (06)
00 (00)
00 (00)
5 (3)
25 (11)
8 × 8 00 (00)
04 (02)
35 (24)
35 (22)
09 (4)
16 (03)
40 (36)
05 (03)
21 (16)
15 (7)
Not observed
(39) (52) (31) (37) (54) (81) (10) (43) (34) (53)
Note: Figures in the parentheses indicate the number of respondents
In the study areas 47% Aman and 25% Boro farmers could recognise the sheath blight disease clearly. Locally they called it Kalopocha or Pochon or Kholpora. About 33% farmers who took IPM training could recognise sheath blight disease directly and 30% Boro farmers could recognise Kholpocha (sheath rot). Other diseases farmers could recognise and mentioned were Thorpora (Neck blast), Gorapocha (Foot rot), and Patafuta or Patadag (Brown spot) and their approximate percentages were 48%, 19%, and 15% respectively (Appendix 1). Incidence of stem rot, root knot, tungro, bakane and BLB was mostly mentioned by Gazipur and Comilla farmers. Relatively smaller number/range of diseases was observed in Aman compared to Boro season (Table 8), however, the disease severity and yield loss were more in Aman season.

31
Table 8. Number of diseases, insects and weeds species found in the study areas
Number of diseases, insects and weeds
Bogra Comilla Gazipur Rajshahi All locations Items Aman Boro Aman Boro Aman Boro Aman Boro Ama
n
Boro
Diseases 2 (59)
5 (16)
6 (40)
7 (5)
8 (5)
9 (12)
1 (84)
2 (67)
4 (47)
6 (25)
Insects 8 12 11 11 6 6 8 6 8 9
Weeds 8 12 11 11 6 6 8 6 8 9
Note: Figures in the parentheses indicates the number of farmers reporting sheath blight disease. Insects substantially reduce rice yields in the tropics like Bangladesh. In this environment insects are more prolific than in a cool dry environment. In Bangladesh, where year round continuous cropping is practised, there are overlapping insect generations through out the year. Insect infestation in the rice fields was common the study area. The major insects recognized by the farmers were Mazra (Stemborer), Pamri, Ledapoka, Gandi, Foring, Sabujpoka, Patamoranopoka, Makorsa, Ghorapoka, Chungipoka and Chotka. Stem borer was recognized by 80% Boro and 72% Aman farmers. The existence of Pamri, Ledapoka, Gandi, Sobujpoka and Brown plant hopper (BPH) were could be reported by 27%, 29%, 20%, 17% and 10% farmers, respectively (Appendix 2). It appears the pest population levels are higher in Boro than Aman season. Weeds are a major constraint to rice production. Almost all farmers practiced weeding and the major weeds in the study areas were Shama (Echinochloa crusgalli), Mutha (Cyperus sp.), Fimbristylis (Fimbristylis littoralis), Amrul (Lemma polyrhiza), Chachra (Scirpus erectus), Durbaghas (Cynodon dactylon), Kochuripana (Eichhornia crassipes), and Panikochu (Monochoria vaginalis), Appendix 3. About 98% farmers opined that they weeded two times in a crop season and 69% respondents mentioned that they rouged off-type plants at least once. Standing water inhibits weed growth, but semi-dry land encourages them, as a result, sometimes weeds are more in Boro than Aman season, as observed during the surveys (Table 8). Rice yield loss is caused by a number of biotic and abiotic factors. Although variation was observed between the two seasons a number of constraints hindered the production. The level of yield loss due to all of these constraints is shown in table 9. As reported by them, farmers incurred maximum yield loss due to the incidence of diseases amounting to almost 11% of the total yield during the Aman season. The yield loss during Boro season was 6% of the total production. Among other constraints to rice production, insect attack, weeds and rats were the three most common concerns to farmers during Aman. In Boro besides diseases, insects and weeds were the major hazards faced by farmers. Often drought in Aman and excessive rainfall, storm and typhoon in Boro caused losses to a certain extent.

32
Table 9. Yield loss due to different biotic and abiotic factors Yield loss (kg/ha)
Bogra Comilla Gazipur Rajshahi All locations Yield loss Factors
Aman Boro Aman Boro Aman Boro Aman Boro Aman Boro
Diseases 230 (7.0)
260 (5.3)
770 (16.1)
570 (9.4)
320 (6.8)
180 (3.5)
500 (13.6)
190 (4.1)
455 (11)
300 (06)
Insects 70 (2.1)
80 (1.6)
280 (5.8)
180 (3.0)
30 (0.62)
310 (6.0)
270 (7.5)
110 (2.4)
163 (04)
170 (03)
Weeds 10 (0.2)
70 (1.4)
190 (4.0)
160 (2.7)
140 (3.1)
70 (1.25)
80 (2.3)
70 (1.4)
105 (02)
93 (02)
Rats 03 (0.07)
20 (0.4)
90 (1.8)
40 (0.7)
60 (1.3)
60 (1.2)
80 (2.3)
30 (0.6)
58 (01)
38 (01)
Birds 01 (0.03)
01 (0.02)
30 (2.8)
60 (0.9)
20 (0.5)
30 (0.51)
20 (0.6)
00 (00)
18 (01)
23 (0.4)
Drought 32 (0.96)
00 (00)
00 (00)
00 (00)
10 (0.2)
02 (0.03)
10 (0.3)
10 (0.14)
13 (0.4)
03 (0.04)
Heavy rainfall/ Flood
00 (00)
00 (00)
0 (00)
50 (0.8)
3.4 (0.07)
00 (00)
30 (0.95)
30 (0.6)
08 (0.3)
20 (0.4)
Hail storm 0.33 (00)
0.00 (00)
20 (0.5)
00 (00)
00 (00)
00 (00)
00 (00)
10 (0.14)
05 (0.13)
03 (0.04)
Cold 00 (00)
70 (1.4)
20 (0.3)
40 (0.6)
00 (00)
00 (00)
00 (00)
10 (0.14)
05 (0.1)
30 (0.5)
Winds 00 (00)
00 (00)
00 (00)
00 (00)
10 (0.2)
00 (00)
00 (00)
10 (0.14)
03 (0.08)
03 (0.03)
Typhoons 0.00 (00)
10 (0.2)
20 (0.33)
30 (0.4)
00 (00)
00 (00)
00 (00)
10 (0.14)
05 (0.8)
13 (0.19)
Others 0.00 (00)
0.00 (00)
10 (0.3)
10 (0.1)
00 (00)
00 (00)
00 (00)
00 (00)
03 (0.08)
03 (0.03)
Note: Figures in the parentheses indicate percent of total yield loss.
Sheath blight is recognised as a high priority constraint among the disease to rice production in Bangladesh. Most of the popular modern rice varieties (BR11, Swarna, Parija etc.) cultivated in Bogra, Comilla, Gazipur and Rajshahi were reported to be susceptible to sheath blight disease. Contribution of rice yield loss due to sheath blight out of total loss in Aman and Boro season in Bogra, Comilla, Gazipur and Rajshahi was estimated as 30 and 34% ; 32 and 44%; 31 and 22% and 32 and 23%, respectively. The survey results revealed that average rice yield loss due to sheath blight disease was 32% in Aman and 30% in Boro seasons in Bangladesh. Based on the information gathered from farmers, it apppers the incidence of high severity of sheath blight leads to higher yield losses to the farmers. This might be as high as 498 kg/ha in Aman season and 340 kg/ha Boro season. When disease severity was moderate, per hectare loss incurred was 208 kg and 158 kg in Aman and Boro seasons respectively (Table 10). The same trend occurs in Bogra, Comilla, Gazipur and Rajshahi districts.

33
Table 10. Yield loss in relation to different levels of sheath blight severity Yield loss (kg/ha)
Bogra Comilla Gazipur Rajshahi All locations Season and severity
Due to disease
Due to Sheath blight
disease
Due to disease
Due to Sheath blight diseas
e
Due to disease
Due to Sheath blight
disease
Due to disease
Due to Sheath blight
disease
Due to disease
Due to Sheath blight
disease
Aman
None 10 0 140 0 280 0 130 0 140 0
Moderate 330 150 460 330 350 200 240 150 345 208
High 580 570 630 580 400 370 500 470 528 498
Boro
None 10 0 0 0 120 0 50 0 45 0
Moderate 150 100 270 200 210 170 270 160 225 158
High 0 0 590 590 420 410 380 360 348 340
It has been recorded that 90% farmers in Boro season and 100% farmers in Aman season never used any chemicals, only 10% used fungicides during the sheath blight attack to control the disease in Boro season in Bogra district (Table 11). On an average 71% Aman and 59% Boro farmers of all districts never used any fungicides and 26% Aman and 32% Boro farmers applied fungicides during the spread of the disease. Very few farmers applied fungicides before appearance of the disease. It is also important to mention that farmers very often used insecticides and fungicides rather confusingly. It was observed in many instances that farmers applied insecticides to control diseases. However, the farmers who got IPM training in most cases could follow proper disease and pest control measures. Table 11. Use of fungicide for sheath blight management by the farmers in the study areas
Percent of farmers responded
Bogra Comilla Gazipur Rajshahi All locations Fungicide Application Aman Boro Aman Boro Aman Boro Aman Boro Ama
n
Boro
None 100 90 28 28 90 73 66 46 71 59 Before 00 00 07 14 00 00 06 22 03 09 During 00 10 65 58 10 27 28 32 26 32
Farmers followed spacing adjustment and this reduced sheath blight disease during Aman and Boro seasons as reported by 39% and 24% farmers, respectively. Balanced fertiliser use, burning stubbles and weeding were reported by as many as 20 - 39% farmers (Table 12). Other minor practices were green manuring, use of resistant varieties, burning and rotting straws, IPM practice etc. It appears farmers were not aware that over doses of N-fertiliser application could cause heavy sheath blight.

34
Table 12. Cultural practices followed by the farmers
Percent of farmers responded
Bogra Comilla Gazipur Rajshahi All locations Disease management techniques Aman Boro Aman Boro Aman Boro Aman Boro Aman Boro
Green manuring 5 4 - - - - - - 5 4
Spacing adjustment
4 4 83 69 49 4 81 19 39 24
Haphazard sowing 4 4 - - - - - - 4 4
Balanced fertilizer use
1 1 52 40 12 34 39 5 26 20
Burning stubbles 1 1 74 58 56 57 1 - 33 39 Not burning stubbles/weeding
1 1 58 43 - 15 - - 30 20
Burn straw 2 1 - - - 20 - - 2 11
Rotten straw 4 5 - - - 13 - - 4 9
Rouging 2 1 31 19 22 - - - 18 10
Resistant/ LV cultivation
5 1 3 8 - - - - 4 5
Parching/Biological control
- - 18 5 - 25 - - 18 15
IPM Practice 66 54 55 56 67 56 91 56 70 56
Others - - 12 9 6 1 22 2 13 4
Note: Some farmer followed more than one practice.
In the study areas a large number of farmers practised IPM in their fields. The farmers whose education level was 5-10 years of schooling appeared to practice IPM more regularly than those whose education level was above 10 or below 5 years of schooling. At the same time the majority of the farmers whose age was within 31-50 their involvement was more than those whose age was below 30 or above 50 years. Generally IPM practice is more in Boro season than Aman season. In Aman season farmers mostly depend on nature and no control measures are taken against insects and diseases but in Boro season 100% farmers cultivate HYVs and all cultural practices including IPM are followed against disease and insects. It should be noted here that in Bangladesh at the moment IPM training is being given to the farmers for insect pest control but not for diseases. During Boro while practicing the IPM method, only 45% farmers experienced no disease spread while 50 % experienced moderate level of disease and 5% high disease severity. Among the farmers who did not practice IPM no disease spread was reported in 40% cases while moderate spread in 53% (Table 13). This indicates that there is no relationship between the current IPM practiced and disease spread. The same trend was observed during the Aman season.

35
Table 13. Effect of IPM practiced by farmers on sheath blight incidence Number of farmers responded
IPM Practiced IPM not practiced
Season Districts
High Moderate None Χ2 High Moderate None Χ2
Bogra 5 34 20 6 15 20
Comilla 3 20 19 5 24 29
Gazipur 6 23 14 2 28 21
Aman
Rajshahi 16 53 7
0.000615ns
1 20 3
0.0000138ns
Bogra 0 39 33 0 13 15
Comilla 0 24 19 3 35 17
Gazipur 1 19 16 3 39 22
Boro
Rajshahi 11 31 33
0.002471ns
5 10 10
0.0000565ns
Note: ns = Not significance
Until now no effective means to control the sheath blight disease is readily available to the farmers. Thus, when they were asked about their willingness to adopt either organic amendments or biological control or their combined application, no one disagreed to follow such options. From the table 13 it is found that 73-94% farmers agreed to amend their soil by using either organic manure or biological agents or agreed to use both the options for Sheath blight. But in Boro season 69-92% farmers agreed to follow organic amendments, biological control agents and combined application of both. To avoid disease almost 100% farmers agreed to choose improved resistant varieties (Table 14). Thus there is considerable scope to promote any technologies suitable for sheath blight management. Table 14. Farmers’ willingness to adopt new technologies for sheath blight (disease) management
Percent of farmers agreed
Bogra Comilla Gazipur Rajshahi All locations Future disease management
Aman Boro Aman Boro Aman Boro Aman Boro Aman Boro
Organic amendments
99 96 92 87 88 91 97 94 94 92
Biological control agents
99 99 44 38 83 83 97 93 81 78
Combined application
99 100 49 47 47 82 97 45 73 69
Improved varieties
99 100 96 98 98 100 99 97 98 99
Based on the survey results and discussions the following conclusions can be made: Sheath blight is considered as a major disease by the farmers in all study sites in Bangladesh. The major portion of the yield loss is caused by this disease. Some HYVs like BR11, Swarna, Pariza are more susceptible to this disease than local cultivars. Repeated cultivation of modern rice varieties appears to aggravates the disease incidence. Disease incidence is increased by close and haphazard spacing follwoed by some farmers, modern cultivars with large number of tillers and early maturing. The educated and trained farmers are more conscious about sheath blight (disease) management than others. There is a crucial need to arrange training programmes for the rice growers to build awareness about the sheath blight (disease) management. Considerable scope for impact with awareness builing and up take of any new technologies.

36
2. Disease surveys Occurrence of Rhizoctonia diseases on rice Based on the symptoms, sheath blight (ShB), sheath spot (ShS) and aggregated sheath spot (AShS) diseases were recorded from all the locations and seasons (Table 15, Figure 4 and Appendix 23). Irrespective of location and season, sheath blight was the most prevalent with a mean of 20.8% incidence. AShS and ShS occurred only at low levels.
0
5
10
15
20
25
Percentage
Fig. 4. Mean incidence of sheath blight, sheath spot and aggregated sheath spot disease of rice in Bangladesh*
Series1 20.8 2.1 2.0
ShB ShS AShS
In activity 3, only a limited number of R. oryzae has been isolated while R. oryzae-sativae has been isolated from a large number of samples either collected as AshS or ShB clearly showing the wide presence of this pathogen in the rice fields/rice cropping systems of Bangladesh. Wide scale distribution of ShB disease in the rice field confirms that inoculum of ShB pathogen is readily available in these locations. Table15. Occurrence of sheath blight, sheath spot and aggregated sheath
spot disease in Bangladesh Rhizoctonia sheath disease* Districts Season
ShB ShS ASS Bogra
T. Aman 01 13.6 1.6 2.8 Boro 2001-2 13.1 0.3 0.4 T. Aman 02 16.2 0.6 0.9 Comilla T. Aman 01 16.4 5.9 5.0 Boro 2001-2 30.2 16.3 16.3 T. Aman 02 6.5 0.7 0.4
* Mean of the data obtained from Bogra, Comilla, Gazipur and Rajshahi (T. Aman, T. Aus & Boro) during 2001-2003

37
Gazipur T. Aman 01 16.0 1.6 0.1 Boro 2001-2 9.5 0.01 0.005 T. Aman 02 18.9 0.1 0.0 Rajshahi T. Aman 01 37.4 0.14 0.3 Boro 2001-2 20.8 0.03 0.03 T. Aman 02 23.4 0.08 0.04 T. Aus 03 48.4 0.07 0.4
2. = Mean of the data obtained from 72 fields from each location
(District) Seasonal influence on the occurrence of Rhizoctonia diseases Seasonal distribution of different Rhizoctonia diseases is presented in Figures 5 & 6. It is observed from the figure that crop seasons showed noticeable influence on the incidence of the disease particularly ShB. ANOVA test for incidence and severity of sheath blight disease showed significant variation among seasons at p=0.01 level. Interaction effect between location and season was also significant (Table 15 & 16). Among the seasons, Aus was the most �avourable for sheath blight followed by T. Aman (wet season) and Boro. Highest incidence (48.4%) and severity (33.2%) of sheath blight were recorded in T. Aus. In Boro season, the severity of ShB was the least compared to either T. Aman or T. Aus despite the closer incidence level with T. Aman. The results indicated that vertical progress of the disease was affected by cold temperature in Boro season, however, when the temperature starts to increase (>15 0C in the month of February) the pathogen becomes active and initiates infection on rice and progresses until maturity. It was observed that last stage of Boro rice allows high level of infestation especially sheath blight disease and hence the pathogen multiplies and leave sclerotia and mycelial population in soil and on left over rice straw. As a result, following rice crops, wet season aman or aus become exposed to high number of viable and virulent inoculum that increases the chances of having severe infestation of the disease. In Aus season, particularly T. Aus, the crop receives high rainfall which increased relative humidity, �avourable temperature along with highly susceptible cultivar perhaps the reason of having the highest infestation of the Rhizoctonia diseases in Aus. Almost all the T. Aman rice is grown under rainfed condition therefore disease level varied greatly between years.

38
Fig 5. Sheath blight incidence and severity index across season*
0
20
40
60
Season
I and
SI (
%)
Incidence 22.5 17.1 18.7 48.4
Severity Index 10.3 11.2 7.1 33.2
TA'01 TA'02 Boro01-2 T.Aus'03
Fig. 6. Seasonal occurance of Sheath spot and Aggregated sheath spot
disease*
0.0
2.5
5.0
Season
Inci
denc
e
ShS 2.30 0.38 4.10 0.07
ASS 2.04 0.33 4.17 0.43
TA01 TA02 Boro01-2 T.Aus03
Geographical influence on the occurrence of Rhizoctonia diseases ShB, ShS and AshS diseases were recorded in all the four locations. Details of the results are summarised in Figures 7 & 8. Among the diseases, sheath blight caused the highest incidence while AshS and ShS were of low level in all the four locations. Geographical effect on these diseases is shown by the Figures 7 & 8. Statistical analysis of ShB disease showed significant variation between locations. Interaction effect of District X Thana X Season for incidence and severity was significant at p = 0.01. Details of the interaction effect of sheath blight disease incidence and severity are presented in Tables 16 & 17. The highest sheath blight disease severity was recorded in Rajshahi (16.6%), which was followed by Gazipur and Bogra. In contrast, the lowest ShB severity was recorded in comilla (4.8%). It is interesting to note that the lowest incidence of ShS and AshS associated with highest severity of ShB in Rajshahi and the highest incidence of ShS and AshS was associated with the lowest severity of ShB. The results indicate that ShB pathogen might have been suppressed by ShS and AshS perhaps by antagonistic interactions among them. Experiments carried out under activity 3 also have given similar interesting results indicating interactions among the three species in disease intiation and development and further critical investigations need to be carried out.
Fig. 7. Geographical effect on sheath blight disease incidence and severity
0
10
20
30
Location
I and
SI (
%)
Incidence 15 18 17.5 27.2
Sev. Index 7.1 4.8 9.7 16.6
Bogra Comilla Gazipur Rajshahi
Fig. 8. Mean incidence of sheath spot and aggregated sheath spot across location
0.0
2.5
5.0
7.5
10.0
Location
Inci
denc
e (%
)
ShS 0.81 7.64 0.58 0.08
ASS 1.34 7.24 0.04 0.19
Bogra Comilla Gazipur Rajshahi

39
ShB disease severity for each field of T. Aman 01, Boro 01-2 and T. Aman 02 are shown in Figures 9 -11. It is seen from the figure 9 that the pattern of sheath blight severity was inconsistent (both high and low severity were recorded) in general, even between fields of an individual block for a particular location (except Comilla). In Comilla, sheath blight severity was far lower than all other location (Fig. 9-11). Disease severity was highly inconsistent in T. Aman 02 so was in Boro 2001-2 for Bogra, Gazipur and Rajshahi. The severity index of many fields of these regions exceeded the threshold level and requires appropriate control measure to minimise yield loss. Sporadic sheath blight outbreak across the location is a common phenomenon for the disease.
Variation in ShB severity between fields was noticeable even within the same block perhaps due to the variation of initial inoculum and also variation in crop management practices (Appendix 4 -16 and Figures 9 -11). ShB, ShS and AshS are soil borne pathogens and disseminate locally mainly during land preparation through agricultural implements and irrigation water. Inoculums produced in the previous crop dislodged on to the soil can cause infection to the succeeding crop and again multiply. Concentration of higher number of pathogen propagules in a particular field within a block is not unlikely and that might be another reason for variation of incidence and severity between fields. Variation in cultivar used and cultural practices e.g. fertiliser use, between fields might have also affected the disease incidence. Table 16. Sheath blight disease incidence over Season x Thana x District
Thana (T) District (d) T1 T2
D- Mean Diff
Season=TA 2001 Bogra 13.6 c 16.5 b 15.0 -2.9 ns Comilla 15.1 c 17.8 b 16.4 -2.7 ns Gazipur 27.2 b 15.3 b 21.2 11.9 * Rajshahi 40.0 a 34.8 a 37.4 5.2 ns Season=TA 2002 Bogra 16.5 b 16.8 ab 16.6 -0.4 ns Comilla 5.7 c 7.4 b 6.5 -1.8 ns Gazipur 28.8 a 15.1 ab 22.0 13.7 ** Rajshahi 26.1 ab 20.6 a 23.4 5.5 ns Season=Boro 2001-2 Bogra 16.1 b 10.8 bc 13.4 5.2 ns Comilla 57.8 a 4.4 c 31.1 53.4 ** Gazipur 3.0 c 15.8 ab 9.4 -12.8 * Rajshahi 17.5 b 24.1 a 20.8 -6.6 ns T-Mean 22.3 16.6 19.4 5.7 In a column under each S, means followed by a common letter are not significantly different at the 5% level by DMRT. Comparison: S.E.D. LSD(5%) LSD(1%)
2-S*T*D means 5.0 10.0 13.2

40
Table 17. Sheath blight disease severity index over Season x Thana x District
Thana (T) District (d) T1 T2
D- Mean Diff
Season=TA 2001 Bogra 5.1 c 5.3 bc 5.2 -0.15 ns Comilla 9.5 bc 11.4 ab 10.4 -1.9 ns Gazipur 13.4 b 2.7 c 8.0 10.7 ** Rajshahi 20.4 a 14.7 a 17.5 5.7 ns Season=TA 2002 Bogra 9.1 b 9.2 ab 9.2 -0.1 ns Comilla 2.3 c 3.7 b 3.0 -1.4 ns Gazipur 19.5 a 10.9 a 15.2 8.6 ** Rajshahi 19.1 a 15.9 a 17.5 3.2 ns Season=Boro 2001-2 Bogra 7.3 ab 6.7 bc 7.0 0.6 ns Comilla 0.1 c 2.0 c 1.0 -1.9 ns Gazipur 1.9 bc 9.7 b 5.8 -7.9 * Rajshahi 11.9 a 17.6 a 14.7 -5.8 ns T-Mean 10.0 9.1 9.5 0.8 In a column under each S, means followed by a common letter are not significantly different at the 5% level by DMRT. Comparison: S.E.D. LSD(5%) LSD(1%)
2-S*T*D means 3.2 6.4 8.5
Fig. 9. Field wise sheath blight disease severity in TA 01 across 4 locations of Bangladesh
-10
10
30
50
70
90
1 6 11 16 21 26 31 36 41 46 51 56 61 66 71 76Field
Seve
rity
Inde
x (%
)
BOGRA COMILLA GAZIPUR RAJSHAHI

41
Fig. 10. Field wise sheath blight disease severity in TA 02 across 4 locations of Bangladesh
0102030405060708090
1 6 11 16 21 26 31 36 41 46 51 56 61 66 71 76
Field
Seve
rity
Inde
x (%
)
BOGRA COMILLA GAZIPUR RAJSHAHI
Fig. 11. Field wise sheath blight disease severity in Boro2001-2 across 4 locations of Bangladesh
0
20
40
60
80
1 6 11 16 21 26 31 36 41 46 51 56 61 66 71 76
Field
Sev
erity
Inde
x (%
)
BOGRA COMILLA GAZIPUR RAJSHAHI
Effect of rice variety and crop sequence on the incidence and severity of sheath blight disease
The results are shown in Figs. 12 and 13 and Table 18). Cultivar wise sheath blight disease incidence, RLH and severity are presented in Table 18. In general, BR11 was the most predominant variety in all the locations. Swarna was predominant rice variety in T. Aman season in Rajshahi while BR22 in Comilla region (Fig 13). These varieties were highly susceptible to ShB. Among the T. Aman varieties the highest vertical and horizontal spread was noted with these varieties. Irrespective of location, the mean disease severity was also highest with Swarna (18.5%) followed by BR11 (9.1%). High susceptibility with these cultivars might be related to wide scale adoption and repeated cultivation over a long period. More importantly tillering habit, leaf color (greenness), tallness, fertiliser application etc affected the overall severity of the disease.
In all the locations, considerable varietal diversity was noted for Boro but in T. Aman, the dominant varieties BR11, BR22 and Swarna covered the most area although other cultivars were grown. In general, the vertical spread (RLH) in the aus and boro varieties was higher than wet season aman. In T. Aus, Nayanmoni and Parijat were the most

42
predominant rice varieties. Although BRRIdhan28 is recommended for winter Boro but farmers in Tanore do grow in T. Aus and all these varieties were highly infested by the ShB (Table 4). Despite the high susceptibility in Nayanmoni and Parijat farmers were compelled to grow those as other varieties weren’t readily available. Diversity in T. Aus cultivars particularly as Parijat, Nayanmoni and Purbachi (high yielding and short duration) is extremely important for the timing of the crop.
Data of T. Aman 2002 and T. Aus 2003 of Rajshahi were used to see the effect of crop sequence (CS) on the incidence and severity of sheath blight disease. In the interpretation, CS-1 indicates at least one rice crop in a year round cycle. Under rain fed condition, T. Aman-Mustard/chickpea/Barley/Fallow pattern was followed but CS-1 (P/W) was under irrigated condition where, T. Aman-Potato/Veg/Wheat-Jute/Fallow was followed. CS-2 and CS-3 were under irrigated situation where two (T. Aman-Mustard/Fallow-Boro) and three (T. Aman-Boro-T. Aus) rice was grown.
Fig. 12 Effect of crop pattern on the incidence and severity of sheath blight
0
20
40
60
80
Cropping pattern
Per
cent
age
Incidence 8.4 11 32.2 51.9
Severity 4.9 4 23.4 39.3
CS-1 CS- CS-2 CS-3
Table 18. Cultivar wise reaction of sheath blight disease in farmers’ fields Sheath blight disease reaction* Variety
Bogra Comilla Gazipur Rajshahi RLH I SI RLH I SI RLH I SI RLH I SI
T. Aman2001-2 BR11 52.2 17.2 8.7 59.1 15.5 9.5 55.9 23.3 14.4 42.8 23.1 8.6
BR14 - - - - - - 55.3 18.9 9.3 - - -
BR23 51.0 5.4 2.7 44.1 9.0 3.6 52.1 10.7 5.5 - - -
BR22 - - - 63.5 11.0 7.0 - - - - - -
BR30 45.5 9.1 8.4 69.6 1.3 5.1 50.8 18.5 8.0 - - -
BR31 - - - - - - - - - 40.2 22.8 7.7
BR32 61.3 9.6 6.4 51.7 11.7 7.2 55.8 17.7 5.7 50.4 7.0 4.3
N.sail 62.5 2.2 1.9 - - - 38.8 17.7 9.0 - - -
Pajam 46.6 14.9 7.1 - - - 56.5 16.7 11.1 - - -
Swarna 50.0 27.2 14.5 - - - - - - 56.4 39.7 22.5
Boro 2001-2
BR1 55.4 8.3 5.3 - - - - - -

43
BR3 - - - 49.3 4.1 1.9 - - -
BR14 48.7 23.2 11.5 44.5 9.9 1.6 56.9 8.7 5.1 - - -
BR15 44.4 11.9 4.7 - - - - - - - - -
BR16 - - - 39.4 23.6 1.5 52.9 3.3 1.8 - - -
BR26 44.0 9.8 3.8 - - - - - - - - -
BR28 52.7 12.1 7.6 22.4 56.5 0.4 57.8 3.2 1.9 62.0 18.2 12.0
BR29 42.7 11.1 4.4 34.4 23.7 0.9 58.2 3.5 2.2 61.5 10.3 6.9
BR36 54.0 12.1 6.7 - - - - - - 71.5 7.4 6.1
Purbachi 48.4 12.2 5.6 - - - 57.0 14.7 9.0 - - -
Parija 54.2 17.2 9.5 - - - - - - 63.7 24.9 17.7
IR20 - - - - - - - - - 63.0 18.2 13.0
IR50 20.2 46.8 0.1 - - - 64.7 25.2 17.9
Iratom - - - 20.2 58.1 0.1 58.4 19.6 12.2 - - -
Joya - - - 48.5 5.2 2.4 - - - - - -
T. Aus
N.Moni - - - - - - - - - 57.3 48.2 31.8
Parija - - - - - - - - - 54.6 35.3 24.3
BR28 - - - - - - - - - 82.3 57.2 53.8
* = Data are the mean of individual variety with unequal replication
Sheath blight incidence and severity was affected greatly between crop sequences (CS) (Fig 12). Both incidence and severity were very low in CS-1 compared to either CS-2 or CS-3 (Fig. 12). Data from Figure 12 indicates that lower severity in CS-1 is perhaps due to prolong winter period between rice crops. More importantly in the harbouring environment, during potato/wheat/jute growing time, possibly the pathogen propagules under go changes due to biotic and a biotic stresses that reduce the viability of the inoculum therefore, lower incidence of ShB is not unlikely in CS-1. On the other hand, in CS-2 and CS-3 the pathogen can easily shift from one rice crop to another and thus continue infestation in the field at the highest level. Therefore, management effort should be directed toward intensified rice production system where the repeated cycles of pathogen infection will be high.

44
Bogra-TA, 2001
Pajam15%
BR237% BR11
43%
Shalla9%
Others11%
Sw arna6%
Badia9%
Bogra-TA, 2002
BR1158%Pajam
24%
Badia7%
Others7%
BR304%
Comilla-TA, 2001
BR2231%
BR3218%
BR1151%
Comilla, TA2002
BR2262%BR32
7%
BR237%
Ghigos13%
Others11%
Rajshahi-TA,2001
Sw arna51%
BR1128%
BR316%
Others 15%
Rajshahi-TA, 2002
Sw arna64%BR11
3%
BR3229%
Others 4%
Gazipur-TA, 2001
BR1169%
N. sail7%
Others 24%
Gazipur-TA, 2002
BR1173%
Pajam10%
Others 11%
N. sail6%
Fig. 13. Cultivar adoption (% field) in wet season T. Aman, 2001-2 in four locations of
Bangladesh
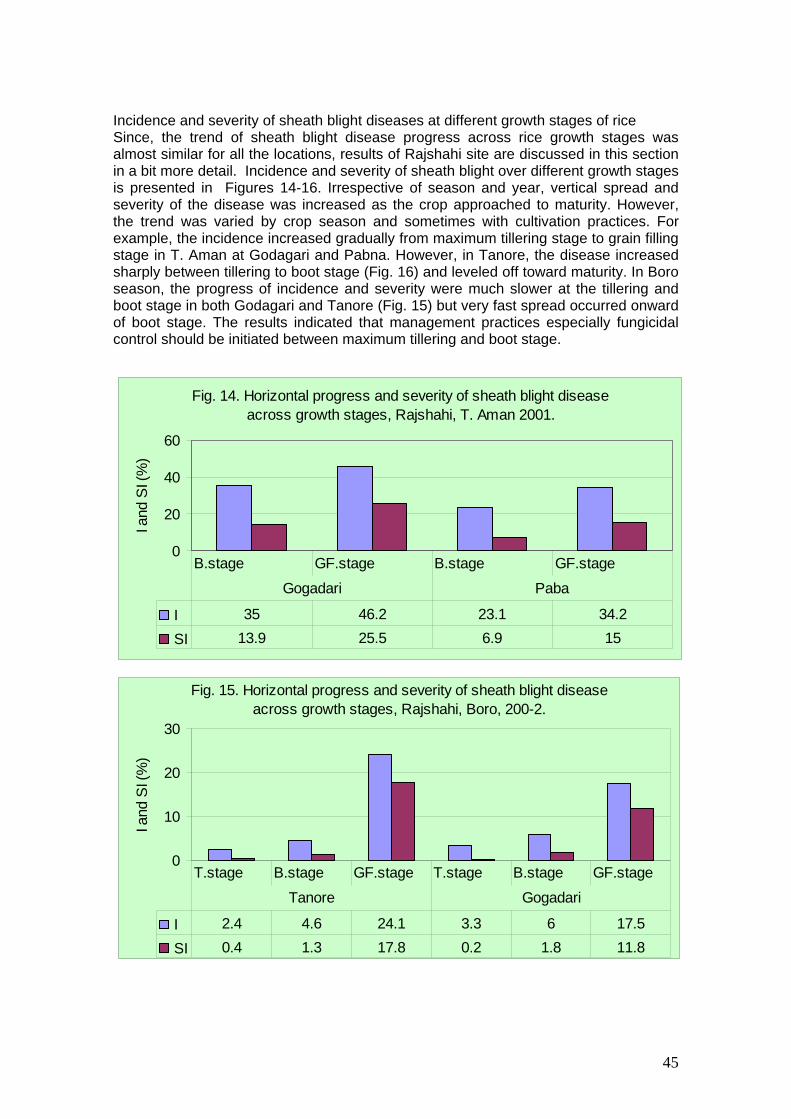
45
Incidence and severity of sheath blight diseases at different growth stages of rice Since, the trend of sheath blight disease progress across rice growth stages was almost similar for all the locations, results of Rajshahi site are discussed in this section in a bit more detail. Incidence and severity of sheath blight over different growth stages is presented in Figures 14-16. Irrespective of season and year, vertical spread and severity of the disease was increased as the crop approached to maturity. However, the trend was varied by crop season and sometimes with cultivation practices. For example, the incidence increased gradually from maximum tillering stage to grain filling stage in T. Aman at Godagari and Pabna. However, in Tanore, the disease increased sharply between tillering to boot stage (Fig. 16) and leveled off toward maturity. In Boro season, the progress of incidence and severity were much slower at the tillering and boot stage in both Godagari and Tanore (Fig. 15) but very fast spread occurred onward of boot stage. The results indicated that management practices especially fungicidal control should be initiated between maximum tillering and boot stage.
Fig. 14. Horizontal progress and severity of sheath blight disease across growth stages, Rajshahi, T. Aman 2001.
0
20
40
60
I and
SI (
%)
I 35 46.2 23.1 34.2
SI 13.9 25.5 6.9 15
B.stage GF.stage B.stage GF.stage
Gogadari Paba
Fig. 15. Horizontal progress and severity of sheath blight disease across growth stages, Rajshahi, Boro, 200-2.
0
10
20
30
I and
SI (
%)
I 2.4 4.6 24.1 3.3 6 17.5
SI 0.4 1.3 17.8 0.2 1.8 11.8
T.stage B.stage GF.stage T.stage B.stage GF.stage
Tanore Gogadari

46
Fig. 16. Horizontal progress and severity of sheath blight disease across growth stages, Rajshahi, T. Aman 2002.
0
10
20
30
I and
SI (
%)
I 6.0 20.5 27.0 2.7 20.1 21.7
SI 1.6 10.6 19.4 0.6 11.6 15.8
T.stage B.stage GF.stage T.stage B.stage GF.stage
Gogadari Tanore
Yield loss caused by Sheath blight disease
During T. Aman 2002, grain yield of 1.0-m X 1.0- m area was taken from the spots where disease data was recorded. No correlation was recorded with disease incidence or severity with yield from any of the four locations. Exact yield loss by the disease could not be obtained because it was not possible to make a comparoson to healthy control and a lot of factors such as nutritional, cultivar, plant population, management, soil fertility etc were varied from one spot to another and field to field. However, with the available grain yield data correlation analysis was performed in order to see the slope and hence to gather some idea of yield loss. No relationship was obtained between severity index and yield severity when was plotted against spot yield (Fig. 17), but when severity was classified into groups 0-20, 21-40, 41-60 and 61+; and corresponding mean yield used, a correlation model, y = -0.0073x + 3.1894 (R2 = 0.3072) showed considerable relationship to high severity level (Fig 18). This indicates that sheath blight disease caused yield loss when severity index exceeds 20%.
In addition to correlation analysis for yield loss, estimated yield loss was calculated for all the locations and seasons and; the results are shown in Fig. 19. Irrespective of seasons, the highest estimated yield loss was obtained for Rajshahi followed by
Fig. 13. Grain yield (t/ha) Vs Sheath blight disease severity
2.8
3.4
2.4
3.0
y = -0.0073x + 3.1894R2 = 0.3072
2
3
4
0 20 40 60 80 100
Severity Index
Yie
ld (t
/ha)
Yield (t/ha) Linear (Yield (t/ha))
Fig. 12. Correlation between rice grain yield and disease severity
y = 0.0012x + 2.857R2 = 0.0014
122334455
0 20 40 60 80 100
Severity Index
Yie
ld (t
/ha)
Y (t/ha) Linear (Y (t/ha))
17 18

47
Comilla and Gazipur while the least for Bogra. Irrespective of location, the lowest yield loss was estimated in Boro season followed by T. Aman.
Sheath blight (R.solani) and aggregate sheath spot (R. oryzae sativae) diseases occur in Bangladesh. Sheath spot pathogen R.oryzae was isolated from limited number of plant amples, the disease incidence appears low. Impact aggregate sheath spot (R. oryzae sativae) and sheath spot pathogen R.oryzae needs to be further investigated particularly where the rice growing conditions are likely to be more variable. Among the three Rhizoctonia diseases, sheath blight was the major disease that occurred in almost all the fields although the disease is supposed to be distributed in aggregated manner. Out break of this disease was sporadic and occurred irrespective of location and that was mainly associated with virulence of the pathogen, host susceptibility and cultural environment. Evidence of disease intensification with mono crop is strong for sheath blight disease. Lower disease in the rice-potato/wheat system needs further investigation and could be a potential management option. Associations of high incidence of AShS and ShS with corresponding lower incidence of ShB and vice versa needs to be investigated further. Association and impact of AShS with/on particular cropping system e.g. rice-wheat system needs to be monitored closely along with an understanding of the biology of Rhizoctonia oryzae sativae. Development and promotion of a package for integrated sheath blight disease management incorporating options like, diversification of crop, use of partial resistance variety, appropriate fertilizer and cultural management, biological and chemical control options etc is likely to have huge inmpcact and up take and this needs to be targeted. Since there are no effective resistance sources against ShB pathogen varietal improvement and promotion of better varieties with at least partial resistance.
Fig. 19. Estimated yield loss (kg/ha) across location and their grand mean
0
200
400
600
800
1000Y
ield
loss
(Kg/
ha)
TA01 185.2 395.6 246.1 455.2
TA02 238.6 135.9 387.1 455.0
Boro01-2 181.8 274.2 146.7 369.9
Aus03 762.2
Mean 201.9 268.6 260.0 510.6
Bogra Comilla Gazipur Rajshahi

48
3. Occurrence and distribution of Rhizoctonia species in rice production systems
Rhizoctonia solani (sheath blight pathogen) was successfully isolated from 84.7, 88.9, 68.5 and 88.9 % of ShB infected plant samples collected from Bogra, Comilla, Gazipur and Rajshahi, respectively during the T. Aman 2001 season. Occurrence of R. solani varied from 38.1 to 79% and 54.2 to 78 % among ShB samples collected from these sites during Boro 2001-02 and T. Aman 2002, respectively (Table 19). Rhizoctonia oryzae-sativae (aggregate sheath spot pathogen) was successfully isolated from 26.4, 19.7, 72.4 and 53.8 % AShS samples collected from Bogra, Comilla, Gazipur and Rajshahi, respectively during T. Aman 01. R. oryzae-sativae occurrence in Boro 2001-02 and T. Aman 2002 AShS samples ranged from 5.3 to 25% and 7.5 to 21.4% at Bogra, Comilla and Gazipur. However, sheath spot pathogen R. oryzae was isolated only from a very limited number of samples, for example 4.2 and 8% from Bogra and Rajshahirespectively in T. Aman 2001 and 7.7% from Bogra samples in Boro (Table 19). Among the three species R. solani clearly is the dominant pathogen with a mean occurrence of 69.79% followed by R. oryzae-sativae at 27.95% (Table 19). Although the importance of ShB in general is well documented, identification of wide occurrence of R. oryzae-sativae across different sites and in different seasons is a key output from current work and the impact of this pathogen in wider rice based cropping systems needs to be investigated. Table 19. Occurrence of Rhizoctonia solani (ShB), R. oryzae-sativae (AShS) and R. oryzae (ShS) in infected rice sheath samples
Samples yielding Rhizoctonia spp. (%) Site Disease
T Aman 01 Boro 01-02 T Aman 02 Mean
ShB 84.07 70.80 59.60 71.70
ShS 4.20 7.70 0 3.97
Bogra
AShS 26.40 5.30 7.50 13.07
ShB 88.90 38.10 68.20 65.07
ShS 0.00 0 6.80 2.27
Comilla
AShS 19.7 9.50 64.30 31.17
ShB 68.50 58.30 78.00 68.27
ShS 0 0 11.80 3.93
Gazipur
AShS 72.40 25.00 21.40 39.60
ShB 88.90 79.20 54.20 74.10
ShS 8.00 - -
Rajshahi
AShS 53.80 - -
ShB 82.75 61.60 65.00 69.79
ShS 3.05 2.60* 6.20* 3.39*
Average
AShS 43.00 13.27* 31.17* 27.95*
*Mean of Bogra, Comilla and Gazipur; - Not tested
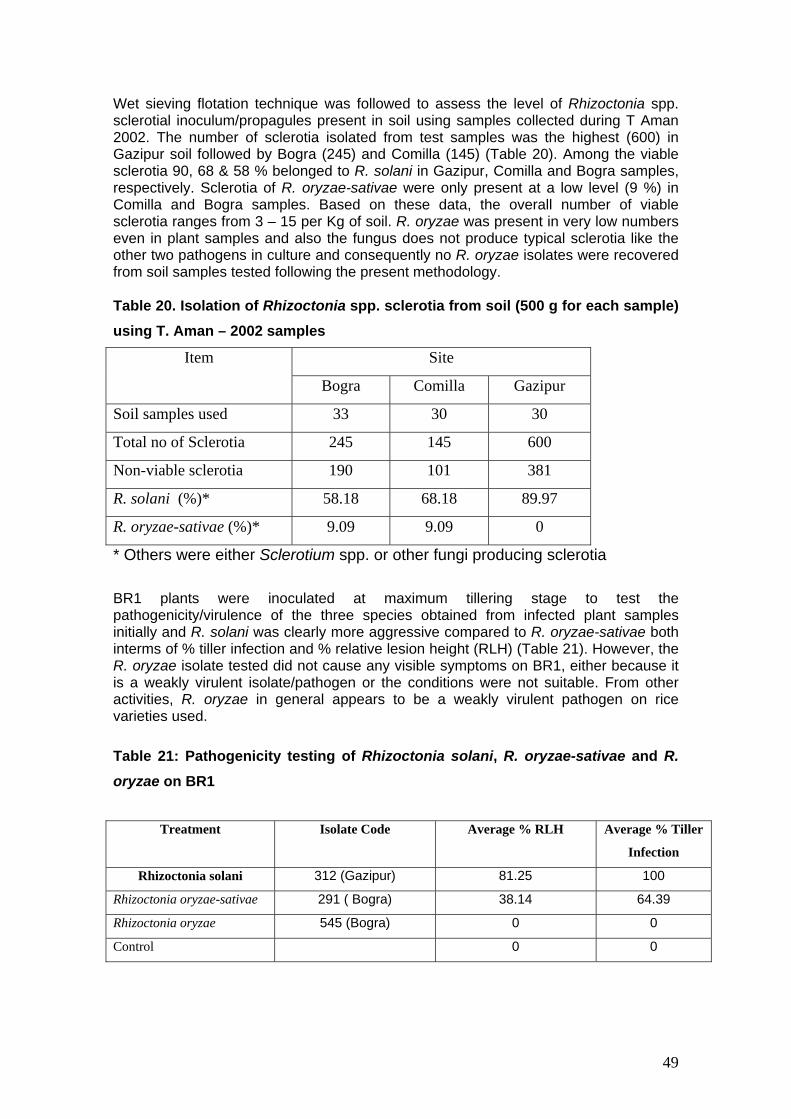
49
Wet sieving flotation technique was followed to assess the level of Rhizoctonia spp. sclerotial inoculum/propagules present in soil using samples collected during T Aman 2002. The number of sclerotia isolated from test samples was the highest (600) in Gazipur soil followed by Bogra (245) and Comilla (145) (Table 20). Among the viable sclerotia 90, 68 & 58 % belonged to R. solani in Gazipur, Comilla and Bogra samples, respectively. Sclerotia of R. oryzae-sativae were only present at a low level (9 %) in Comilla and Bogra samples. Based on these data, the overall number of viable sclerotia ranges from 3 – 15 per Kg of soil. R. oryzae was present in very low numbers even in plant samples and also the fungus does not produce typical sclerotia like the other two pathogens in culture and consequently no R. oryzae isolates were recovered from soil samples tested following the present methodology. Table 20. Isolation of Rhizoctonia spp. sclerotia from soil (500 g for each sample) using T. Aman – 2002 samples
Site Item
Bogra Comilla Gazipur
Soil samples used 33 30 30
Total no of Sclerotia 245 145 600
Non-viable sclerotia 190 101 381
R. solani (%)* 58.18 68.18 89.97
R. oryzae-sativae (%)* 9.09 9.09 0
* Others were either Sclerotium spp. or other fungi producing sclerotia BR1 plants were inoculated at maximum tillering stage to test the pathogenicity/virulence of the three species obtained from infected plant samples initially and R. solani was clearly more aggressive compared to R. oryzae-sativae both interms of % tiller infection and % relative lesion height (RLH) (Table 21). However, the R. oryzae isolate tested did not cause any visible symptoms on BR1, either because it is a weakly virulent isolate/pathogen or the conditions were not suitable. From other activities, R. oryzae in general appears to be a weakly virulent pathogen on rice varieties used.
Table 21: Pathogenicity testing of Rhizoctonia solani, R. oryzae-sativae and R.
oryzae on BR1
Treatment Isolate Code Average % RLH Average % Tiller
Infection
Rhizoctonia solani 312 (Gazipur) 81.25 100
Rhizoctonia oryzae-sativae 291 ( Bogra) 38.14 64.39
Rhizoctonia oryzae 545 (Bogra) 0 0
Control 0 0
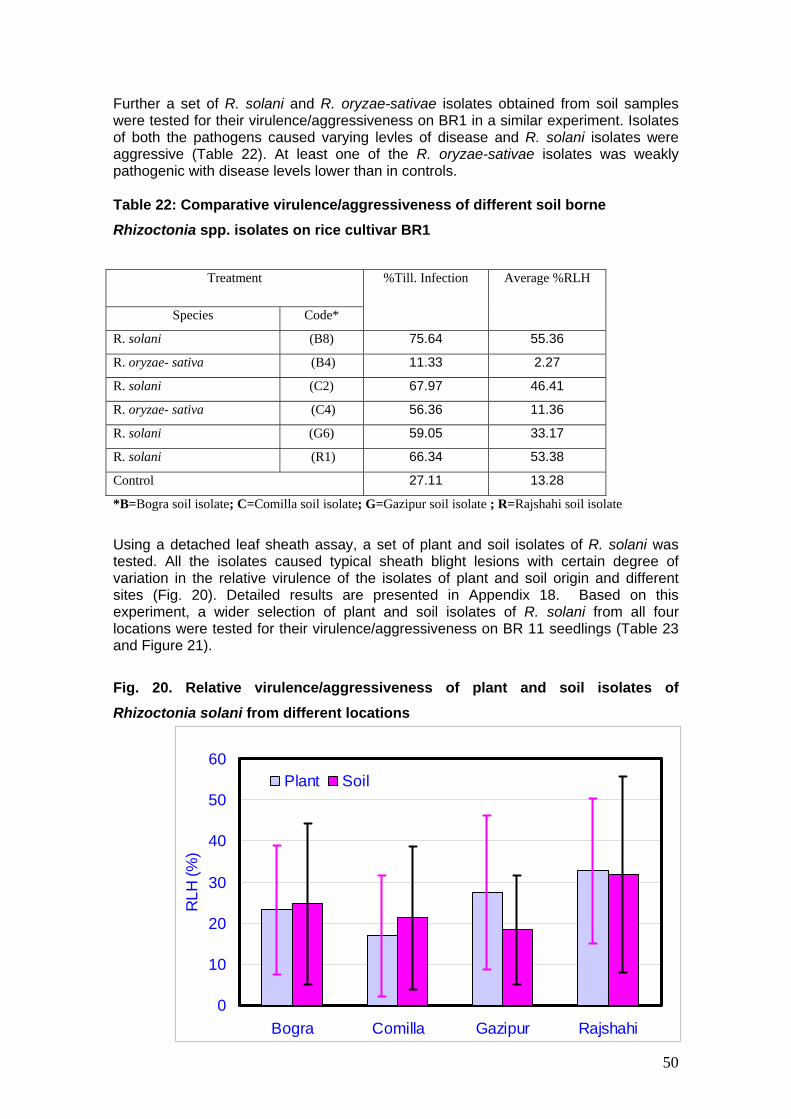
50
Further a set of R. solani and R. oryzae-sativae isolates obtained from soil samples were tested for their virulence/aggressiveness on BR1 in a similar experiment. Isolates of both the pathogens caused varying levles of disease and R. solani isolates were aggressive (Table 22). At least one of the R. oryzae-sativae isolates was weakly pathogenic with disease levels lower than in controls. Table 22: Comparative virulence/aggressiveness of different soil borne Rhizoctonia spp. isolates on rice cultivar BR1
Treatment
Species Code*
%Till. Infection Average %RLH
R. solani (B8) 75.64 55.36
R. oryzae- sativa (B4) 11.33 2.27
R. solani (C2) 67.97 46.41
R. oryzae- sativa (C4) 56.36 11.36
R. solani (G6) 59.05 33.17
R. solani (R1) 66.34 53.38
Control 27.11 13.28
*B=Bogra soil isolate; C=Comilla soil isolate; G=Gazipur soil isolate ; R=Rajshahi soil isolate
Using a detached leaf sheath assay, a set of plant and soil isolates of R. solani was tested. All the isolates caused typical sheath blight lesions with certain degree of variation in the relative virulence of the isolates of plant and soil origin and different sites (Fig. 20). Detailed results are presented in Appendix 18. Based on this experiment, a wider selection of plant and soil isolates of R. solani from all four locations were tested for their virulence/aggressiveness on BR 11 seedlings (Table 23 and Figure 21).
Fig. 20. Relative virulence/aggressiveness of plant and soil isolates of Rhizoctonia solani from different locations
0
10
20
30
40
50
60
Bogra Comilla Gazipur Rajshahi
RLH
(%)
Plant Soil

51
Disease severity on rice seedlings varied significantly among the isolates tested irrespective of their origin. Among the 32 isolates, 15 were highly virulent. These isolates were both from soil and plant sources (Figure 21). Very high and low virulent isolates were recognised from all four locations. The results indicated that in resistance screening care must be taken in selecting isolates for the test and/or the likely variability in the aggressiveness of the natural pathogen population in screening plots. Interaction between location and source was significant (Table 23). Irrespective of sources, the highest severity was recorded for Gazipur isolates (59.0%) followed by Rajshahi isolates (52.7%). On the other hand isolates of Comilla region were less virulent except CP709. Irrespective of location, plant borne isolates in general were more virulent than soil borne isolates.
Table 23. Interaction between Location and Source of isolates for sheath blight
disease severity (%) on artificially inoculated rice seedlings (CV. BR 11)
Isolate sources Location
Rice plant Soil Source-Mean
Gazipur 56.9 a 61.3 a 59.0
Bogra 55.4 a 45.0 b 50.2
Comilla 51.5 a 28.9 c 40.2
Rajshahi 57.6 a 47.8 b 52.7
Location-Mean 55.3 45.8 50.6
Means followed by a common letter are not significantly different at the 5% level by
DMRT
Fig. 21. Virulence/aggressiveness of plant and soil borne R. solani isolates from the four sites
GP, Gazipur plant isolates; GS, Gazipur soil isolates; BP, Bogra plant isolates; BS, Bogra soil isolates; CP, Comilla plant isolates; CS, Comilla soil isolates; RP, Rajshahi plant isolates; RS, Rajshahi soil isolates.
Fig. 16.Virulence of R. solani isolates of plant and soil borne from four locations of Bangladesh
32.5
efg
20.7
fg
93.3
a
81 a
bc
90 a
b
80 a
bc
50 d
e
25 fg 32
.7 e
fg
20 fg
94 a
75 a
bc
20 fg
15 fg
71.7
bc
73.3
abc
29 fg
25.3
fg
88.3
ab
63.3
cd
21.7
fg
13.3
g
14 fg
66.7
cd
15.3
fg 35 e
f
90 a
b
90 a
b
20 fg
11.3
g
90 a
b
70 b
c
0
20
40
60
80
100
GP6
27
GP6
29
GP5
78
GP5
96
GS6
25
GS5
85
GS5
84
GS5
98
BP82
1
BP83
7
BP81
2
BP81
3
BS80
3
BS84
1
BS80
1
BS81
1
CP68
5
CP71
8
CP70
9
CP69
8
CS71
5
CS71
8
CS68
5(14
)
CS71
0
RPRS
09
RPRS
07
RPRS
02
RPRS
05
RSRS
01
RSRS
07
RSRS
02
RSRS
09
Sev
erity
Inde
x (%
)

52
Pathogenicity of Rhizoctonia oryzae-sativae isolates of plant and soil origin from various locations was tested on a detached leaf sheath assay as described under activities. Test isolates produced typical aggregate sheath spot symptoms, but upward progress of the lesions was very slow. The % RLH is presented in Table 24 and almost all isolates were equally moderately virulent. No relationship was observed among the isolates with respect to either plant and soil origin or location. Table 24. Virulence/aggressiveness of Rhizoctonia oryzae-sativae isolates of
spp. on detached leaf-sheath (CV BR 11)
Isolate Code Source RLH (%)*
AShS 663 Plant 42.8±21.1
AShS 703 Soil (C-14) 32.3±19.2
AShS 715 Plant 37.0 ±18.2
AShS 718 Soil (C-7) 38.3±10.2
AShS 800 Soil (B-4) 39.6±11.9
AShS 813 Plant 39.4±17.7
AShS 813 Soil (B-15) 37.3±17.7
AShS 821 Plant 33.8±21.8
AShS 861 Plant 25.5±10.3
* ± standard deviation from the mean % RLH
Interactions among the three pathogens (symptoms and cultural morphology are shown in Appendix 19) in disease development were tested under field conditions on BR11. Upon inoculation of the test plants with each pathogen separately (T1, T2 and T3), R. solani showed very high disease severity (93 % tiller infection and 64 % RLH) followed by R. oryzae-sativae (49 % tiller infection and 24 % RLH) and R. oryzae caused very little infection as observed in previous experiments. However, some interesting interactions were observed when the pathogens were inoculated in various combinations. For example, when all three pathogens were inoculated simultaneously (T4), R. solani still caused very high levels of disease but R. oryzae-sativae showed only very limited infection (Table 25), indicating that the latter is much less competitive compared to the former species. On the other hand, R. oryzae-sativae was able to cause moderate levels of infection when introduced five days after R. solani inoculation (T8). Interestingly, prior inoculation with R. oryzae led to significant reduction in disease severity caused by R. solani (T5) as well as R. oryzae-sativae (T10), although by itself R. oryzae is least pathogenic (Table 25). Very similar and overlapping symptoms caused by the three pathogens make it difficult to score the exact levels of disease severity very accurately, however, some of the interactions showed considerable differences and influence in disease development and this aspect needs to be investigated further.

53
Table 25: Interactions among Rhizoctonia solani, Rhizoctonia oryzae-sativae and Rhizoctonia oryzae in disease development under field conditions
Mean for % RLH Mean for % till. infection Treatment
ShB AShS ShS ShB AShS ShS
T1 (Rs) 64.067 a 1.553 d 0.123 92.877 a 0.443 e 0.276
T2 (Ros) 7.750 bc 23.587 a 0 10.553 c 49.220a 0
T3 (Ro) 10.637 bc 0.087 d 0.193 16.137 bc 0.220 e 0.276
T4 (Rs+Ros+Ro) 61.443a 1.510 d 0 80.787 a 4.053 de 0
T5 (Rs, 5 days
after Ro) 26.973 b 0.060 d
0.153 37.127 b 0.207 e
0.22
T6 (Ro, 5 days
after Rs) 67.053 a 0
0 80.397 a 0
0
T7 (Rs, 5 days
after Ros) 52.877 a 10.810 bc
0.16 75.453 a 26.710 bc
0.486
T8 (Ros, 5 days
after Rs) 58.857 a 12.683 bc
0 81.263 a 27.510 bc
0
T9 (Ro, 5 days
after Ros) 0.343 c 16.133 b
1.33 0.497 c 38.543 ab
3.153
T10 (Ros, 5 days
after Ro) 5.543 c 6.807 cd
3.066 8.383 c 16.300 cd
8.793
T11(Control) 3.253 c 1.640 d 0.116 6.413 c 5.253 de 0.336
Means followed by a common letter are not significantly different at the 5% level by DMRT
Isolates used: ShB - 312; AShS - 291; ShS - 545

54
4. Molecular diagnostics of Rhizoctonia species and sheath disease samples Development of diagnostic PCR for three Rhizoctonia species Based on sequence data of the ribosomal RNA gene block (rDNA) internal transcribed spacer sequences, primers specific for each of target species namely R. solani, R. oryzae-sativae and R. oryzae. These primers and PCR conditions were optimised to achieve enhanced specificity as the primers and the protocols previously available were not working optimally with problems of cross reaction (Johanson et al., 1998). The new sets of primers, DNA extraction methodologies and PCR protocols worked efficiently both with fungal cultures as well as infected tissue (e.g. Fig. 22 A and B ). This enabled rapid analysis of a large number of samples collected from the four sites. Fig. 22. A, Gel panel showing amplification of R. solani – specific product with target species isolates only as part of the development of diagnostic PCR tests. B, Gel panels showing the application of diagnostic PCR to detect pathogen specific fragments directly in infected tissue Note sample 16 gave positive amplification for ShB as well as AShS pathogens. A B
1 2 3 4 5 6 7 8 9 10 11 12
1, 2 & 9 -12: R. solani (RS) 3, 4, 7 & 8: R. oryzae-sativae (ROS) 5 & 6: R. oryzae (RO)
13 14 15 16 17 18 19 20
ShB/RS-specific test
AShS/ROS-specific test
ShB AShS H. Rice

55
Occurrence and distribution of the Rhizoctonia species applying diagnostic PCR Bogra district in the northern region and Comilla district in the central region of Bangladesh are generally known as hot spots for rice sheath blight. Around 120 infected rice sheath samples collected from these sites 20 ShB, 21 AShS and 21 ShS samples from Bogra and similarly 20 ShB, 20 AShS and 20 ShS samples from Comilla identified based on symptoms were analysed using the species-specific PCR as a diagnostic tool. Rhizoctonia spp. could be detected in 60 out of 62 samples from Bogra and in all 60 samples from Comilla. The pathogen(s) detected in infected samples by PCR diagnosis did not always correlate with the visual diagnosis of the disease symptoms. This was particularly true of sheath spot samples in which R. oryzae was detected only twice out of 41 sheath spot samples. In a number of cases from both Bogra and Comilla more than one Rhizoctonia spp. was detected in individual samples that were identified as a particular type of sheath disease based on symptoms. R. solani was the predominant pathogen (86%) followed by R. oryzae sativae (48%) detected in sheath disease samples from both Bogra and Comilla. In Bogra, R. solani was detected in 19 out of 20 ShB samples while in Comilla R. solani was detected in all 20 ShB samples. In addition, R. oryzae sativae was detected in a number of ShB samples. For example, in Bogra R. oryzae sativae was detected in six ShB samples that were also infected with R. solani and on one ShB sample individually. Similarly, in Comilla R. oryzae sativae was found in three ShB samples that were also infected with R. solani. In most cases where both pathogens were detected in the same ShB sample, the band intensities on agarose gel for R. solani were usually stronger than that of R. oryzae sativae suggesting that the former species is the major component. However, in two samples from Comilla intensity of R. solani - and R. oryzae sativae - specific bands was similar indicating comparable levels of the two pathogens. In a large number of cases (35 – 40%) more than one pathogen was detected from each infected sample (e.g. Fig. 23) indicating that symptoms alone do not accurately reflect the presence of the pathogen. This also suggests that multiple infections by Rhizoctonia species are not uncommon in disease hot spots in Bangladesh. In addition, the success of PCR reactions in all but two cases indicated that the rapid and inexpensive method employed to extract DNA was suitable and can therefore be used effectively even in developing country laboratories. PCR diagnostic tests can therefore provide a reliable and accurate alternative to detecting pathogen presence even in the absence of distinct rice sheath symptoms. This is the first global report of wide prevlence of R. oryzae sativae by itself or in combination with R. solani in rice production systems and it is important to assess the level of genetic and pathogenic diversity in R. oryzae sativae.
Fig. 23. Venn diagram showing the level of occurrence of the three pathogens following diagnostic PCR analysis of sheath infected samples originally identified based on symptoms

56
120 Sheath disease specimens, 40 each ShB, AShS and ShS analysed Genetic variation in R. solani isolates from Bangladesh using AFLPs In this study both SSR- PCR and AFLP analysis were used to assess the genetic diversity of R. solani populations across Bangladesh (Fig. 24 A and B). AFLP markers provided clearly higher level of variation consequently these have been used mainly for all characterisation work and SSR-PCR was mainly used comparative analysis of R. solani isolates of plant and soil origin.Multiple AFLP bands/markers were amplified from most R.solani isolates and in our experimental conditions products between 100 and 600bp were most clearly distinguishable on Spreadex EL1200 gels, as these gels discriminate between very similar sized fragments and were available ready made saving considerable time and effort. The number of molecular markers produced by each primer combination varied from 19 to 29. On average 25 different molecular markers were amplified with each of the 6 primer combinations. The number of polymorphisms varied from 2 to 10 depending on the primer combination. AFLP profiles revealed considerable variation amongst the R. solani isolates. On average almost 1 in 3 fragments was a polymorphic marker. The high level of variation is reflective of the phenotypic variation generally associated with R. solani. AFLP profiles of R. solani isolates were used to develop dendograms for each primer combination using a DNA profile analysis software (Phoretix/BioGene). As expected the dendrograms confirmed the high degree of variability observed as most isolates failed to be clustered together into distinct genetic groups. Nonetheless there was a loose cluster of R. solani isolates that were more than 50% similar. For example, with the B1 primer combination, two clusters formed with similarities of over 60% within each though the similarity between the two clusters was only 35%. These clusters generally neither included R. solani isolates from hosts other than rice, nor the reference R. oryzae sativae and R. oryzae isolates. Two R. oryzae isolates (isolate 54 and 55) clustered together with most primer combinations and routinely showed similarities of over 70%. R. solani isolates from soya and R. solani AG 8 always fell out of the main cluster and generally shared less than 30% similarity with the test R. solani isolates. Using PCR-RFLPs of the rRNA gene block, it has been shown that Rhizoctonia spp. on rice in Japan are genetically distinct (Matsumoto and Matsuyama, 2001). Isolates that fell into clusters regardless of primer combinations were from all regions of Bangladesh. Banniza and Holderness (2001) observed that mt DNA RFLPs and VNTR-PCR profiles could not be correlated with the geographical origin of rice
RS ROS
RO
59 12
44

57
sheath blight pathogen in West Africa. R. solani isolates 26 and 27 from Kustia were over 80% similar except with primer combinations G2 and B1; isolates 38 and 39 from Rajshahi were over 60% similar with all primer combinations. This suggests that these isolates are genetically closely related. Isolates obtained from Hokkaido University, Japan routinely fell in the main cluster of R. solani isolates with the exception of isolate 45, which generated a low number of markers following selective amplification. Hence it appears R. solani isolates from rice can be broadly grouped into two categories, those that generally fall within the 60% similarity cluster and those that fall outside of it. AFLP fingerprints using six primer combinations revealed a high level of variability amongst R. solani isolates from rice from 20 districts in Bangladesh. No geographic correlation was found. Generally R. solani isolates from Bangladesh could be differentiated into two groups; those that shared above 50% similarity on UPMGA dendograms regardless of primer combination and those that consistently fell out side of this group. Alternative molecular methods to assess variability include RFLPs and RAPDs. These techniques have been documented to show less variation than AFLPs. Present results indicate that the variation observed in the Rhizoctonia isolates is probably directly attributable to considerable genetic diversity in the fungal populations and not an inflated estimate due to the techniques used. There could be a number of reasons, agro-ecological as well as genetic, why such a high level of variation is present in R. solani and the mechanisms generating genetic diversity in R. solani are not fully understood yet. Most researchers observe that sclerotia and vegetative mycelium are the primary sources of inoculum with Rhizoctonia spp. Unlike wind dispersed spores, vegetative mycelium and sclerotia are not able to travel vast distances unaided. Hence it may be possible that pockets of R. solani isolates have evolved in isolation from other isolates based on local selection pressures such as host cultivars, cropping practices and climatic conditions. However in this study no clear geographic correlation was found suggesting that isolates from the same district are usually quite genetically distinct. A detailed investigation may be carried out to determine the level of variation in Rhizoctonia spp. populations from the same field particularly comparing isolates of plant and soil origin, as this has produced interesting observations on the inoculum sources in the present study as desribed below. The degree of variation may also be assessed in the context of local cropping practices. It is likely that rotation crops and traditional varieties differ amongst regions and even amongst farmers and this may play a role in selecting for certain isolates. Though MVs currently contribute 65% of total rice production in Bangladesh, local varieties are still used widely. These local varieties that are not as susceptible to ShB as the MVs may be exerting different selection pressures on the pathogen population in different fields and districts. It is difficult to predict what sort of selection pressure the widespread adoption of susceptible MVs has exerted on the R. solani population structure. However, it appears that there has been no bottleneck selection pressure on the pathogen that favours the emergence of a limited number of virulent/aggressive isolates. It could be speculated that this might have encouraged the development of numerous isolates of R. solani that are all capable of causing the disease. Rice has been cultivated on the Indian subcontinent and other Asian nations for 1000’s of years. It is possible that during that period the pathogen has co-evolved with the host and the numerous rice varieties in use throughout the region thus leading to excessive variation within its’ own population. Comparing the level of variation among R. solani isolates infecting rice in regions that have begun rice cultivation relatively recently such as Europe, North America and South America would further substantiate the developemnt of population structures.

58
The great degree of variation observed in R.solani populations poses a critical challenge to resistance breeding as well as in developing effective chemical and biocontrol alternatives. The high level of variation in R. solani reflects results obtained in previous studies in other geographic locations as well as on other hosts. It would be worthwhile to assess the importance of a number of other factors such as rice cultivars and cropping practices that may play a role in influencing pathogen populations. Wider level of pathogenicity testing using sets of characterised isolates would provide knowledge of relationships between the pathogen genotypes and pathogenic diversity/aggressiveness variation which could be used as a framework for resistance development and deployment. Major gene mediated partial resistance in rice is being explored by other researchers to counter R. solani and pyramiding the R genes and/or combining various control measures so as to effectively counter the widest spectrum of the pathogen populations. A wide range of control measures may need to be tested and appropriately adopted to counter the widest spectrum of the pathogen population. Indeed most of the currently used rice cultivars in Bangladesh are susceptible to ShB. Work carried out on disease management in this project has identified varieites that show considerable level of partial resistance, amendments that reduce the disease and also antagonistic bacteria with the potential for biocontrol. Fig. 24. Gel pictures showing the extent of genetic diversity observed among R. solani populations in Bangladesh using a collection from across the country, along with some reference cultures Isolates details are given in Appendix 20. A, SSR-PCR profiles. Upper panel: 1, RS BD77; 2, RS BD93; 3, ROS BD37; 4, ROS BD65; 5, RO W1; 6, RO W3; 7, ROS C1; 8, ROS C3; 9, RS 68/2000; 10, RS 3/2000; 11, RS 41/2000; 12, RS 17/2000; 13, RS 18B/2000; 14, RS 42/2000; 15, RS 6/2000; 16, RS 14/2000 and 17, RS 5/2000. Lower Panel: 1, RS BD77; 18, RS 2/2000; 19, RS 16/2000; 20, RS 1/2000; 21, RS 28/2001; 22, RS 55/2000; 23, RS 50/2000; 24, RS 54/2000; 25, RS 46/1999; 26, RS 60/2000; 27, RS 19/2000; 28, RS 23/2000 and 29, RS 62/2000 B. AFLP profiles. 1, RS 23/2000; 2, RS BD82; 3, RS BD61; 4, RS BD62; 5, RS 2/2000; 6, RS 16/2000; 7, RS BD77; 8, RS BD69; 9, RS 60/2000; 10, RS BD09; 11, RS BD10; 12, RS BD11; 13, RS BD02; 14, RS BD03; 15, RS AG8 2-11; 16, ROS BD65; 17, ROS C1; 18, RO W1; 19, RO W3; 20, RO 801387 2-11; 21, RO 801344 Pea-H

59
A B
1 2 3 4 5 6 7 8 9 10 11 12 13 M 14 15 M 16 17 18 19 20 21
M 1 2 3 4 5 6 7 8 9 10 1112 13 141516 17 161117
M 1 18 19 20 21 22 23 24 25 26 27 28 29 A B

60
Comparative analysis of R. solani isolates from plant and soil sources As described earlier, R. solani isolates from plant and soil sources were established utilising the samples collected during disease surveys. A set of around 40 isolates of plant and soil origin, representing the four sites, were selected and these were confimed as R. solani by carrying out species - specific diagnostic PCR test (e.g. Fig. 25). PCR profiles of these isolates were then generated using at least four SSR primers and the banding patterns were visualised on agarose gels. Interestingly, in most cases the trend observed was that the R. solani isolates of plant and soil origin from the same fields showed more differences than similarities. This observation is contrary to the expectation that the inoculum propagules present across the field in soil are critical in serving as souces of infection. Similar observations have recently been reported in other geographic locations e.g. in Philippines (Manalo et al., 2001), suggesting that contact among plants in the close canopy of high tillering rice is more important is spread of the infection and disease from a point of infection, where the inoculum could have originated from soil rather than the number of infection units in soil (Banniza et al., 1999; Manalo et al., 2001). Although it is likely that the infected crop residues would have carried the pathogen and also introduced the propagules into the soil, it is likely that the pathogen propagules have lower fitmness to survive in soil and remain virulent. A large proportion of sclerotia isolated from soil samples were foudnt to be non-viable. Thus the plant isolates may be only a transient part of the soil population wtihout establishing themselves (Banniza et al., 1999; Banniza and Holderness, 2001). The number of sclerotia in soil under tropical conditions are thought to be mush lower compared to temperate and subtropical climates. Interestingly, in a number of cases R. solani isolates of plant sources from different points in the field or fields in the same location seem more closer to each other. This observation is critical in determining the importance of the origin of inoculum sources as well as the spread of infection in the field so that appropriate pathogen propagule reduction and disease intervention strategies can be used. Fig. 25. Comparative analysis of Rhizoctonia solani isolates from plant and soil origin. A, diagnostic PCR with R. solani-specific primers. B, SSR-PCR profiles A Plant and soil isolates of R. solani from Gazipur, Rajshahi, Bogra and Comilla, as listed in Appendix 21. P, Pea and S, Soybean isolates of R. solani
M 1 2 3 4 5 6 7 8 9 10 11 12 13 14 15 16 17 18 P S
M 1 2 3 4 5 6 7 8 9 10 11 12 13 14 15 16 17 18 19 20

61
B S, soil and P, plant isolates of R. solani; Isolate details are provided in Appendix 21.
1 2 3 4 5 6 7 8 9 10 M 111213 14151617 18M
1 2 3 4 5 6 7 8 9 10 M111213 1415161718 M
S P S P S P S P S P M S P S P S P S P M
S P S P S P S P S P M S P S P S P S P M

62
5. Disease management Efficacy of organic amendments for the control of sheath blight disease In T. Aman 2002, among the organic amendments tested (Appendix 24), compost, rice bran and pulse bran showed reduced level of % tiller infection as well as % RLH in comparison to control treatment in Comilla. Among these, the highest yield was observed with rice bran (6.21 t/ha) followed by compost (6.13t/ha) and pulse bran (5.91 t/ha) (Table 26). In Gazipur, among the organic amendments, compost and mustard oilcake showed reduced levles of tiller infection and RLH and rice bran, pulse bran and urmoi also showed moderate effect compared to control (Table 26). In Boro 02-03, pulse bran, rice bran and neem showed reduction in the levels of sheath blight in comparison to control treatment at Comilla. Among the these amendments, the highest yield was observed with pulse bran (6.99 t/ha) followed by rice bran (6.83 t/ha) and neem (6.48 t/ha), though the differences were not statistically significant (Table 27). In Gazipur, with respect to the overall level of the disease, sawdust and biskatali performed better compared to the other treatments (Table 27). During T. Aus 02, incidence of sheath blight disease was reduced considerably in poultry litter, pressmud and saw dust compared to control (disease) in Rajshahi. However, the mean RLH of the infected population was the highest in poultry litter. Except healthy control, the least disease severity was recorded in pressmud (0.7) followed by sawdust. Grain yield although not varied significantly, highest yield was recorded in poultry litter with disease severity (1.1). Disease pressure was very low due to severe drought in the crop growth period which might have masked any effect on yield (Table 28). In Comilla and Gazipur, the experiments were conducted in naturally infested field. These fields might differ in the level and diveristy of ShB pathogen sclerotia harboured that could have led to differences in disease development and grain yield in different treatment plots. These results need to be validated under more uniform disease/inoculum pressure situations. Screening rice varieties/lines with isolates of sheath blight (ShB), aggregate sheath spot (AShS) and sheath spot (SS) pathogens In the nursery at Rajshahi, sheath blight disease pressure was very high. None of the entries showed resistance reaction however, eleven entries such as BRRIdhan34, BRRIdhan32, BR23, BINA 4, BR 10, BRRIdhan38, BRRIdhan29, BR6194-27-2-2-1, BR6241-62-2-1, BR 25, BR6004-75-4-HR1 were moderately tolerant. Exotic lines such as swarna, sada swarna, anamika, BG 1-2 and IR30175 were highly susceptible along with native cultivars/lines (BR 11, BRRIdhan30, BINA 5, BR6110-10-1-2, BR6004-75-4-HR3 and BRRIdhan39. In Gazipur, BR10, BRRIdhan38, BR6194-27-2-2-1, BR6241-62-2-1 and Kumragoir showed moderately tolerant reaction against sheath blight but aggregate sheath spot and sheath spot showed very little disease severity in general with all the vaireities tested (Table 29). Most studies so far suggest lack of complete resistance in rice to ShB. For example, Biswas (1999) evaluated 160 rice entries for their reaction to sheath blight disease under artificially inoculated conditions at Chinsurah, India and found none of them resistant; 10 were moderately resistant while the other 150 gave a susceptible reaction. There has also been considerable interest in exploiting QTLs (Zou et al., 2000) and R gene mediated partial resistance in rice against ShB (Pan et al., 1999) and to pyramid these genes to achieve broad spectrum resistance against aggressive pathogen isolates.
63
Isolation of antagonistic bacteria from Sheath blight infected plant samples Out of 119 infected plant samples tested 36 yielded florescent bacteria (FB) from which 139 colonies of FB were isolated. These were tested for their antagonistic potential in bioassays against R. solani (Appendix 24). Among them 38 colonies retained the inhibition zone for more than 72 h while 20 colonies showed moredate level of inhibition (Table 30). Samples from Comilla yielded the highest recovery of FB, but none showed high level of inhibition. Most of the FB showing good level of inhibition came from Gazipur and Rajshahi samples. These 38 colonies of antagonistic bacteria that showed good level of antagonism in vitro could be tested for their potential to control sheath blight disease. Rice ShB associated bacteria inhibitory to ShB have previously been identifed by Tan and Mew (2001) and scientists at Tamil Nadu Agricultural Univeristy in India have developed a Pseudomonas based formulation ofr ShB control (Rabindran and Vidyasekaran, 1996). Thus the indigenous bacterial antagonists identifed offer the scope to develop ShB biocontol strategies in Bangladesh.

64
Table 26. Effect of organic amendments on the incidence and severity of sheath blight disease and their impact on yield, T. Aman, 2002 at Comilla and Gazipur.
In a column, means followed by a common letter(s) are not significantly different at 5% level by LSD
Treatments Doses (t/ha)
% RLH % Tiller infection
Severity index Grain yield (t/ha)
% RLH % Tiller infection Severity index Grain yield (t/ha)
Comilla Site
Gazipur site
Compost 5.56 43.29 e 11.94 h 4.50 f 6.13 a 5.75 b 39.48 h 1.81 e 2.77 ab Mustard oil cake
3.33 43.57 e 17.19 f 6.56 e 4.62 a 4.14 b 47.83 h 1.87 e 3.10 a
Wheat bran 3.33 44.47 d 22.71 d 9.00 c 5.83 a 25.00 ab 75.48 b 22.47 b 2.02 c Pulse bran 3.33 38.01 g 14.1 g 4.11 f 5.91 a 13.28 ab 54.67 f 7.46 d 2.70 b Rice bran 3.33 40.26 f 10.68 c 3.50 f 6.21 a 9.46 ab 56.97 e 5.67 d 2.59 b Saw dust 3.33 44.12 d 20.17 e 7.88 e 5.94 a 16.97 ab 72.19c 14.35 c 2.83 ab Poultry manure
3.33 45.63 c 22.46 d 9.32 c 5.81 a 32.15 a 71.23 c 26.68 a 2.88 ab
Biskhatali leaf 2.22 45.45 c 29.50 a 12.16 a 5.41 a 22.93 ab 77.45 a 21.34 b 2.87 ab Royna leaf 2.22 46.26 b 25.05 c 10.65 b 5.46 a - - - - Sonalu leaf 2.22 48.04 a 27.08 b 12.30 a 4.88 a - - - - Urmoi 2.22 - - - - 11.35 ab 67.22 d 8.68 d 2.56 b Control (disease)
- 45.20 c 16.68 f 6.8 e 5.69 a 24.68 ab 76.86 ab 22.74 b 2.71 b

65
Table 27. Effect of organic amendments on the incidence and severity of sheath blight disease and their impact on yield, Boro,
2002-2003 at Comilla and Gazipur.
% RLH % Tiller infection
Severity index
Grain yield (t/ha)
% RLH % Tiller infection
Severity index
Grain yield (t/ha)
Treatments Doses (t/ha)
Comilla site Gazipur site Compost 5.56 76.50 a 1.66 abc 1.54 abc 6.25 a 46.87 f 15.34 ab 6.68 de 3.06 a Mustard oil cake 3.33 54.66 e 2.36 ab 1.3 abcd 7.07 a 59.97 b 18.06 ab 11.69 ab 3.05 a Wheat bran 3.33 - - - - 54.01 cd 13.48 ab 7.4 cde 2.56 a Pulse bran 3.33 58.33 c 0.12 c 0.1 d 6.99 a 69.24 a 16.97 ab 13.54 a 2.55 a Rice bran 3.33 58.87 c 1.24 bc 0.8 bcd 6.83 a 57.76 bc 22.94 ab 14.03 a 2.67 a Saw dust 3.33 - - - - 35.70 g 10.14 b 2.57 f 2.59 a Poultry manure 3.33 - - - - 48.48 ef 24.71 a 11.14 abc 2.57 a Biskhatali 2.22 - - - - 28.55 h 12.12 ab 1.68 f 2.98 a Dholkalmi 2.22 57.99 d 2.69 ab 1.7 ab 6.01 a - - - - Neem 2.22 51.56 f 0.64 c 0.3 cd 6.48 a - - - - Urmoi 2.22 - - - - 51.89 de 17.69 ab 9.14 bcd 3.18 a Control (disease) - 69.54 b 3.02 a 2.4 a 5.78 a 36.59 g 16.70 ab 4.48 ef 2.57 a
In a column, means followed by a common letter(s) are not significantly different at 5% level by LSD
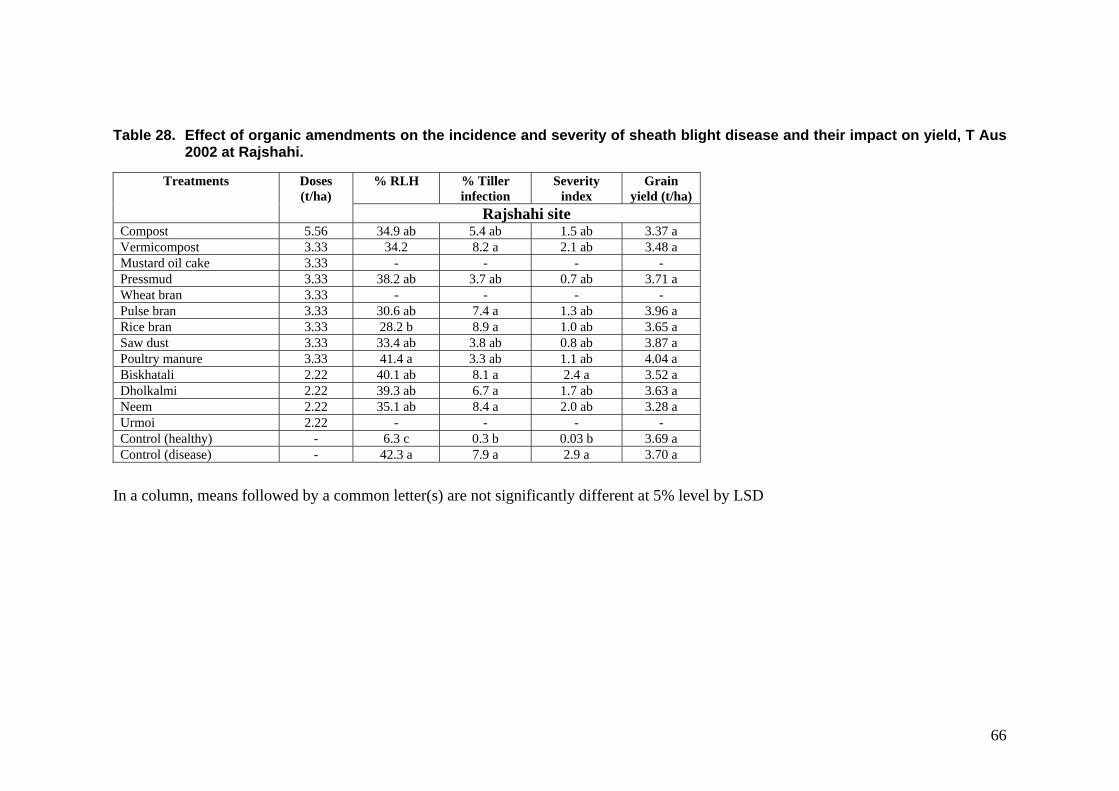
66
Table 28. Effect of organic amendments on the incidence and severity of sheath blight disease and their impact on yield, T Aus
2002 at Rajshahi.
% RLH % Tiller infection
Severity index
Grain yield (t/ha)
Treatments Doses (t/ha)
Rajshahi site Compost 5.56 34.9 ab 5.4 ab 1.5 ab 3.37 a Vermicompost 3.33 34.2 8.2 a 2.1 ab 3.48 a Mustard oil cake 3.33 - - - - Pressmud 3.33 38.2 ab 3.7 ab 0.7 ab 3.71 a Wheat bran 3.33 - - - - Pulse bran 3.33 30.6 ab 7.4 a 1.3 ab 3.96 a Rice bran 3.33 28.2 b 8.9 a 1.0 ab 3.65 a Saw dust 3.33 33.4 ab 3.8 ab 0.8 ab 3.87 a Poultry manure 3.33 41.4 a 3.3 ab 1.1 ab 4.04 a Biskhatali 2.22 40.1 ab 8.1 a 2.4 a 3.52 a Dholkalmi 2.22 39.3 ab 6.7 a 1.7 ab 3.63 a Neem 2.22 35.1 ab 8.4 a 2.0 ab 3.28 a Urmoi 2.22 - - - - Control (healthy) - 6.3 c 0.3 b 0.03 b 3.69 a Control (disease) - 42.3 a 7.9 a 2.9 a 3.70 a
In a column, means followed by a common letter(s) are not significantly different at 5% level by LSD

67
Table 29. Disease reaction of Sheath blight (ShB), Aggregate Sheath Spot (AShS) and Sheath spot (ShS) in nursery.
Disease index (DI)
Rajshahi Gazipur Sl No Designation
(ShB) (ShB) (AShS) (ShS) 1 BR3 4.5 - - - 2 BR4 9 9 0 1 3 BR10 3.9 5 1 3 4 BR11 7 7 1 0 5 BR22 4.4 7 1 1 6 BR23 3.8 7 0 0 7 BR25 4.2 7 1 0 8 BRRI dhan29 4 - - - 9 BRRI dhan30 6.4 7 0 1 10 BRRI dhan31 4.6 9 1 0 11 BRRI dhan32 3.7 7.5 1 1 12 BRRI dhan33 9 3 0 13 BRRI dhan34 3.7 - - - 14 BRRI dhan37 5.3 7 1 1 15 BRRI dhan38 4 5 0 3 16 BRRIdhan39 6 9 3 1 17 BRRI dhan40 5.3 - - - 18 BRRI dhan41 4.3 - - - 19 BR6110-10-1-2 6.7 7.5 1 0 20 BR6194-27-2-2-1 4.8 5 0 0 21 BR6241-62-2-1 4.1 5 0 3 22 BR6187-38-2-4 - 7 1 0 23 BR5777-11-2-4-1 - 7 1 1 24 Kumragoir - 3.5 1 0 25 BR6004-75-4-HR4 6.5 - - - 26 BR6004-75-4-HR1 4.3 - - - 27 BINA dhan4 3.9 - - - 28 BINA dhan5 7.1 - - - 29 BINA dhan6 4.9 - - - 30 BAU2 5.4 - - - 31 IR30175 6.2 - - - 32 Anamika 6.4 - - - 33 BG-1-2 7 - - - 34 Sada swarna 5.9 - - - 35 Swarna 7.8 9 1 1
Based on SES scale of 0 - 9 - not tested.

68
Table: 30. Status of antagonistic bacteria isolated from Sheath blight (ShB)
infected plant samples from selected sites
Status of Antagonism*
Sites No. of plant samples tested
No. of samples showing FB
No of colony of FB isolated
Good Medium Poor
Bogra 18 3 10 6 1 3 Comilla 18 12 15 0 4 11
Gazipur 47 10 62 18 7 37 Rajshahi 36 11 52 14 8 30 Total 119 36 139 38 20 81
*Good = Inhibition zone retained after 72 h; Medium = Inhibition zone merged within 72 h; Poor = Inhibition zone merged within 48 h; FB = Fluorescent Bacteria

69
Capacity strengthening and linkages/dissemination Throughout the project duration a number of activities were undertaken contributing to capability strengthening at the partner organisations and also dissemination of project outputs. Ms. Shamima Akter, BRRI pathology staff was provided a three-month research training attachment at HRI in fungal pathology and molecular diagnostics with particular emphasis on rice sheath disease pathogens. In country, review meetings were organised annually at BRRI with participation from other R & D agencies. Both for socio-economic and disease surveys, enumerators were trained centrally at BRRI leading to a skill base that could be utilised by these organisations in future research activities (Appendix 22). A leaflet on project activities and some of the key findings has been produced for local dissemination. At the end of the project period, a stakeholder workshop was organised on 3rd Dec. 2003 at BRRI-Gazipur with 25 participants from BRRI-HQ and outstations including pathologists, breeding, socio-economics, biometrics and agronomy scientists and scientists from BARD, RDA, Uni. of Rajshahi, BINA and BSMR Agric Univ (IPSA) and project co-ordinator from HRI, UK participated. The Project PIs and Staff from BRRI, BARD, RDA, Univ. of Rajshahi and HRI made 11 Powerpoint/OHP presentations of 15 – 30 mins covering the outputs generated. During the review meetings/ workshop pre- and post-meeting technical sessions were organised to discuss data collation, uniform analysis and presentation of results and preparation of FTR and workshop proceedings as well as to identify key areas for validation and promotion. These provided opportunities for wider capability strengthening of staff of the partner organisations at various levels in a number of areas. Strong partnership has also been established between BRRI, RDA, BARD and University of Rajshahi and local Agricultural offices leading to close working links (Appendix 22) between organisation dealing with rice R & D and extension work. Close linkages were established with a range of organisations involved in rice sheath disease research, leading to exchange of knowledge and material. For example, with BSMRAU (formerly IPSA), Bangladesh and Imperial College, UK where BRRI pathologists were carrying out PhD programmes on related topics. As part of the link up with Imperial, a Masters student joined the project staff at HRI to characterise Rhizoctonia isolates. Also reference cultures were obtained linking up with previous DFID-CPP funded work led by NRI and CABI, UK and CRRI, India. Project leader visited CRRI and University of Madras, India and IRD, France to discuss ShB research and also to present seminars on outputs of the project. Project staff also presented the project outputs at key national and international conferences (e.g. Global Food Security, London and International congress of Plant pathology, New Zealand). Contribution of Outputs to developmental impact Outputs of the project have been achieved by establishing the knowledge of the Rhizoctonia sheath diseases and the pathogens as well as developing disease management strategies based on host resistance, cultural and biological control and disseminating to target beneficiaries and at a wider level. Baseline data has been established on the prevalence of the dominant sheath disease and diversity, distribution and epidemiology of pathogen populations (R. solani) across four key sites in Bangladesh. Importantly wide occurrence of a second sheath disease pathogen (R. oryzae sativae) in the rice production systems in Bangladesh has been identified. Although R. oryzae sativae may not pose an immediate threat to local rice production, its impact on other crops in rice based cropping systems and future impact on new rice varieties need to be monitored carefully. Molecular biotechnological tools have been developed for rapid and reliable identification of rice Rhizoctonia sheath diseases and pathogens and the knowledge has been presented to the stakeholders. A number of varieties that show moderate resistance to sheath blight have been identified that could either be promoted to farmers and/or utilised in BRRI breeding programmes, as many of the current popular varieties are highly susceptible to sheath blight. Organic amendments

70
and antagonistic bacteria tested offer potential for biological disease control and for integration with host resistance. These outputs will provide a wider framework significantly contributing towards achieving the goal of improved and sustainable management of rice sheath diseases there by leading to poverty reduction. A range of activities has been undertaken contributing to capability strengthening at partner organisations and to disseminate the project outputs. Follow-up planned The completed phase was mainly strategic research which has generated a range of knowledge based outputs and identified component technologies that could be followed through into an adaptive phase validating and promoting key outputs linking pathology and socio-economic aspects and feeding to longer term BRRI breeding programmes. Key activities for follow-up work: 1. Transfer of molecular biotechnological tools and knowledge for diagnosis and characterisation of Rhizoctonia species populations and rice sheath diseases in rice-based cropping systems in Bangladesh utilising the DFID-PETRRA funded molecular lab by conducting a training workshop at BRRI and producing a technical manual. 2. Rhizoctonia oryzae-sativae populations prevalent (a collection of more than 100 isolates has been established, largest collection globally) in Bangladesh rice production systems need to be characterised and their present and future impact assessed with reference to single (T. Aman-Mustard/chickpea/Barley/Fallow under rain fed or T. Aman-Potato/Veg/Wheat-Jute/Fallow under irrigated condition, double (T. Aman-Mustard/Fallow-Boro) and triple (T. Aman-Boro-T. Aus) rice cropping sequences. This fits well with investigations being initiated into the biology and control of Rhizoctonia oryzae-sativae by rice scientists in Australia, Japan and USA. 3. Testing the efficacy of the antagonists identified as well as scale up and uniform/high inoculum pressure tests with promosing organic amendments for disease control and/or biomass enhancement. 4. Validation of rice varieties/entries identified against wider pathogen populations and promotion and incorporation of some of the varieties showing effective partial resistance into BRRI breeding programmes, as pace is gathering internationally on exploiting major genes encoding partial resistance in rice to ShB. 5. Socio-economic work done suggests considerable scope and consequent impact for working with farmers validating and demonstrating components technologies tested so far as well as others such as spacing and fertiliser application building on the strong links established with socio-economic partners from BARD, RDA and Univ of Rajshahi as well as socio-economic scientists from BRRI, Gazipur. PIs from BARD and RDA are keen to produce a booklet of the survey results, possibly with their departmental resources, in local language for dissemination to farmer groups and farmers. In discussions during the Project Co-ordinator’s visit in Dec. 2004, BRRI senior management led by Director General Dr. N.I. Bhuiyan were very supportive of these activities given the limited ShB resistant varieties currently available to farmers and also transfer of molecular biotechnological tools developed and wider capacity strengthening. Dr. Hamid Miah, IRRI liaison scientist mentioned the scope for indirect links to the on-going SRI (System of Rice Intensification) project co-ordinated by IRRI investigating the efficient use and integration of a range of technologies and resources. Dr. Ansar Ali, BRRI-Rajshahi mentioned discussions with USDA on developing a proposal for ShB management, which if successful would compliment this work and also provide wider linkages/up-take pathways.
71
Project Output Dissemination List Publications SREENIVASAPRASAD, S. (2000) Isolation of fungal nucleic acids. In: Nucleic Acids Protocols Handbook. Eds. R. Rapley and J.M. Walker. Humana Press, USA, pp. 37-45.
SREENIVASAPRASAD, S., CHIPILI, J. and MUTHUMEENAKSHI, S. (2001) Diversity and dynamics of Phytopathogenic Fungi: Application of Molecular Tools. Proceedings of the 11th Congress of MPU and 3rd Congress of PPS, 17-20 Sep. 2001, Evora, Portugal, pp. 21-22.
SREENIVASAPRASAD, S., MUTHUMEENAKSHI, S. and CHIPILI, J. (2002) Understanding diversity of fungal pathogens of rice to improve disease control: Molecular approaches. EU Rice Conference, Biotechnology Foundation, Turin, Italy, 6 – 8 June 2002. MUTHUMEENAKSHI, S., SREENIVASAPRASAD, S., SHARMA, N. R., AKTER, S., RAHMAN, M., TAHER MIA, M.A., NAHAR, M. and BROWN, A. E. (2002) Towards understanding the diversity and epidemiology of Rhizoctonia species involved in rice sheath blight complex in Bangladesh: Molecular approaches. Plant Pathology: Global Food Security, BSPP Conference, Imperial College, London, 8 – 10 July 2002. DAS, B. (2002) Use of PCR diagnostic tests for detection of Rhizoctonia species involved in the rice sheath disease complex and a study of genetic variation of R. solani, the causal agent of rice sheath blight, using AFLP. Project work dome at HRI linked to R7778. M. Sc. Dissertation submitted to Imperial College, University of London. MUTHMEENAKSHI, S., SREENIVASAPRASAD, S., DAS, B., ARCHER, S., SHARMA, N.R., AKTER, S., RAHMAN, M.M., TAHER MIA, M., and BROWN, A.E. (2003) Molecular approaches to identify Rhizoctonia species involved in rice sheath blight complex, 8th International Congress of Plant Pathology, Christchurch, New Zealand, 2 -7 February 2003, p 345. MUTHMEENAKSHI, S., SREENIVASAPRASAD, S., ALI, M.A., SHARMA, N.R., AKTER, S., TAHER MIA, M., RAHMAN, M.M. and BROWN, A.E. (2004) Genetic and pathogenic characterisation of Rhizoctonia species isolates associated with rice sheath diseases in Bangladesh. Plant Pathology (in preparation). Internal reports Quarterly/PP and Annaul reports submitted to DFID deadlines during June 2000 – November 2003. SREENIVASAPRASAD, S. (2001) Report on a visit to Bangladesh (BRRI and IRRI- Bangladesh) and India (CRRI and University of Madras) to co-ordinate CPP Project activities and develop linkages, 2 – 15 February 2001. 4 pp. SREENIVASAPRASAD, S., MUTHUMEENAKSHI, S. and NAHAR, M.A. (2001) Rice sheath blight complex caused by Rhizoctonia species: Pathogen epidemiology and management strategies. Annual Project Brief, IRRI-Bangladesh Project Database 2001.

72
SREENIVASAPRASAD, S. (2002) Report on a visit to Bangladesh (BRRI and IRRI- Bangladesh) to co-ordinate DFID-CPP ShB Project R7778 activities. 14 – 20th Dec 2002. 4 pp. SREENIVASAPRASAD, S. (2003) Rice sheath blight in Bangladesh: Outputs and follow-up activities. Rice projects cluster meeting. DFID-CPP, NR International, Kent, 18 July 2003. SREENIVASAPRASAD, S. (2003). Rice Sheath blight Project R7778 Stakeholder Workshop, 3 Dec. 2003, BRRI, Gazipur. Other disseminations SREENIVASAPRASAD, S. (2000) DFID-CPP funded Rice sheath blight complex project – activities and anticipated outputs. Research Strategy Meeting at IRD/CIRAD, Montpellier, France, 21 – 23 June 2000. SREENIVASAPRASAD, S. (2001) Application of molecular tools for characterisation of the rice blast and sheath blight pathogens, understanding their epidemiology and developing disease management strategies. CRRI, Cuttack, India, 13 February 2001. SREENIVASAPRASAD, S. (2001) Understanding diversity, distribution and epidemiology of blast, sheath blight and other pathogens to develop disease management strategies: Application of molecular tools. SARI, Ghana. 6th June. 2001. SREENIVASAPRASAD, S. (2001) Molecular characterisation of blast, sheath blight and other pathogens to develop disease management strategies. CRI, Ghana. 7th June. 2001. SREENIVASAPRASAD, S. (2003) Fungal diversity and development: Molecular biotechnological approaches. Invited lecture. Association of Microbiologists India-Chennai Chapter, 9th Dec. 2003, University of Madras, Chennai, India. RAHMAN, M.M. (2003) Survey of rice sheath diseases caused by Rhizoctonia species at Bogra during 2001- 2002. DFID-CPP Rice Sheath blight Project R7778 Stakeholder Workshop, 3rd Dec. 2003, Bangladesh Rice Research Institute, Gazipur, Bangladesh. LATIF, M.A. (2003) Surveillance of rice sheath blight disease complex and efficacy of organic amendments in controlloing the disease in Comilla region. DFID-CPP Rice Sheath blight Project R7778 Stakeholder Workshop, 3rd Dec. 2003, Bangladesh Rice Research Institute, Gazipur, Bangladesh. SHARMA, N.R. (2003) Survey of rice sheath diseases caused by Rhizoctonia species at Gazipur during 2001- 2002. DFID-CPP Rice Sheath blight Project R7778 Stakeholder Workshop, 3rd Dec. 2003, Bangladesh Rice Research Institute, Gazipur, Bangladesh. AKTER, S., RAHMAN, M.M., SHARMA, N.R. and MIA, M.A.T. (2003) Occurrence of Rhizcotonia species, their pathogenicity and interactions and isolation of bacterial antagonists. DFID-CPP Rice Sheath blight Project R7778 Stakeholder Workshop, 3rd Dec. 2003, Bangladesh Rice Research Institute, Gazipur, Bangladesh. HOSSAIN, M. (2003) Effect of organic amendments on rice sheath blight disease and varietal screening. DFID-CPP Rice Sheath blight Project R7778 Stakeholder Workshop, 3rd Dec. 2003, Bangladesh Rice Research Institute, Gazipur, Bangladesh.

73
ALI, M.A. and NAHAR, M.A. (2003) Survey of rice production and Rhizoctonia sheath diseases, pathogenicity and disease management through organic amendments. DFID-CPP Rice Sheath blight Project R7778 Stakeholder Workshop, 3rd Dec. 2003, Bangladesh Rice Research Institute, Gazipur, Bangladesh. SREENIVASAPRASAD, S., MUTHUMEENAKSHI, S. and Brown, A.E. (2003) Molecular diagnostics of Rhizoctonia species associated with rice sheath diseases. DFID-CPP Rice Sheath blight Project R7778 Stakeholder Workshop, 3rd Dec. 2003, Bangladesh Rice Research Institute, Gazipur, Bangladesh. NURUL ISLAM, F.A.M. (2003) Farmers’ perceptions of rice sheath disease complex: A socio-economic survey in the Comilla region. DFID-CPP Rice Sheath blight Project R7778 Stakeholder Workshop, 3rd Dec. 2003, Bangladesh Rice Research Institute, Gazipur, Bangladesh. ADHIKARY, R.C. (2003) Farmers’ perceptions of rice sheath disease complex: A socio-economic survey in the Bogra region. DFID-CPP Rice Sheath blight Project R7778 Stakeholder Workshop, 3rd Dec. 2003, Bangladesh Rice Research Institute, Gazipur, Bangladesh. Sharma, N,R. (2003) Farmers’ perceptions of rice sheath disease complex: A socio-economic survey in the Gazipur region. DFID-CPP Rice Sheath blight Project R7778 Stakeholder Workshop, 3rd Dec. 2003, Bangladesh Rice Research Institute, Gazipur, Bangladesh. ALI, M. (2003) Farmers’ perceptions of rice sheath disease complex: A socio-economic survey in the Rajshahi region. DFID-CPP Rice Sheath blight Project R7778 Stakeholder Workshop, 3rd Dec. 2003, Bangladesh Rice Research Institute, Gazipur, Bangladesh. SHARMA, N.R., RAHMAN, M.M. and HOSSAIN, M. (2003) Rhizoctonia sheath disease complex of rice. Dissemination Leaflet. Stakeholder Workshop, 3rd Dec. 2003, Bangladesh Rice Research Institute, Gazipur. List of key datasets generated SREENIVASAPRASAD, S. (2003) Dataset: List of characterised Rhizcotonia species isolates associated with rice sheath disease complex, collected from Rajshahi, Bogra, Comilla and Gazipur districts in Bangladesh. Excel spreadsheet. Horticulture Research International, UK. SREENIVASAPRASAD, S. (2003) Dataset: Genetic profiles of key Rhizoctonia species isolates associated with rice sheath disease complex, collected from Rajshahi, Bogra, Comilla and Gazipur districts in Bangladesh. Hardcopies and Photoeditor readable images. Horticulture Research International, UK. RAHMAN, M. M., ALI, M.A. and PAUL, D. N. R. (2003) Dataset: Incidence and severity of Rhizoctonia sheath diseases based on surveys during the T-Aman and Boro seasons of 2001-2002 in Rajshahi, Bogra, Comilla and Gazipur districts in Bangladesh. Excel spreadsheet and Office 2000 Graphics files. Bangladesh Rice Research Institute. RAHMAN, M. M., ADHIKARY, R.C., AZAD, M.A.S. and PAUL, D. N. R. (2003) Dataset: Socio-economic survey to understand farmers’ perceptions of rice sheath disease complex in Rajshahi, Bogra, Comilla and Gazipur districts in Bangladesh. Excel spreadsheet and and Office 2000 Graphics files. Bangladesh Rice Research Institute.

74
RAHMAN, M. M., AKTER, S. and SHARMA, N R. (2003) Dataset: Occurrence of Rhizcotonia species, their pathogenicity and interactions and isolation of bacterial antagonists with samples collected from Rajshahi, Bogra, Comilla and Gazipur districts in Bangladesh. Excel spreadsheet and Office 2000 Graphics files. Bangladesh Rice Research Institute. RAHMAN, M. M, LATIF, M.A., HOSSAIN, M. and M.A. (2003) Dataset: Effect of organic amendments on rice sheath blight disease and varietal screening, experiments conducted at Gazipur, Comilla and Rajshahi. Excel spreadsheetand and Office 2000 Graphics files. Bangladesh Rice Research Institute.

76
Appendix 1. Diseases reported by the farmers in the study areas
Percent farmers responded*
Bogra Comilla Gazipur Rajshahi All locations
(Mean) Name of diseases
Aman Boro Aman Boro Aman Boro Aman Boro Aman Boro
Kholpora (Sheath blight) (Rhizoctonia solani)
59 16 40 5 5 12 84 67 47 25
Gorapocha (Foot rot) (Fusarium moniliforme)
- 3 5 17 - 37 - - 5 19
Kholpocha (Sheath rot) (Acrocylindrium oryzae)
- 27 9 36 7 27 - - 8 30
Thorpora (Neck blast) (Pyricularia oryzae)
- 3 - - 48 - - 1 48 2
Patafuta (Brown spot) (Drechslera oryzae)
- 1 11 7 - 37 - - 11 15
Stem rot (Sclerotium oryzae)
- - - - 13 12 - - 13 12
Root knot (Meloidogyne graminicola
- - - 13 5 - - - 13 5
Tungro (Rice Tungro Virus)
- - - 27 14 5 - - 14 16
Bakane (Fusarium moniliform)
- - - - 15 1 - - 15 1
BLB (Xanthomonas campestris)
- - 2 - 1 6 - - 6 2
Others 1 - 13 21 - 12 - - 7 16
*In some locations some farmers did not provide a positive response

77
Appendix 2. Different pests resported by farmers in the study areas
Percent farmers responded*
Bogra Comilla Gazipur Rajshahi All locations
(Mean) Name of insects
Aman Boro Aman Boro Aman Boro Aman Boro Aman Boro Mazra (Stem borer) (Scirpophaga incertulas)
74 59 71 77 44 100 100 82 72 80
Pamri (Rice hispa) (Dicladispa armigera)
14 10 48 56 25 31 5 11 23 27
Ledapoka (Rice swarming caterpillar) (Spodoptera mauritia)
17 12 19 11 - - 52 23 29 15
Gandi (Rice bug) (Leptocorisa acuta)
22 11 28 24 10 41 - 3 20 20
Foring (Small Grass hopper) (Oxya spp.)
21 14 2 1 2 4 4 - 7 6
Chotka (Large grasshopper) (Hieroglyphus banian)
- 2 - - - - - - - 2
Sobujpoka (Green leaf hopper) (Nephotettix nigropictus)
- 4 31 40 - 2 2 - 17 15
Brown plant hopper (Nilaparvata lugens)
- - - - - - 10 8 10 8
Patamorano poka (Leaf roller) (Cnaphalocrocis medinalis)
2 2 2 1 - - - - 2 2
Makorsa (Spider) (Lycosa spp.)
- 1 1 4 - - - - 1 3
Ghorapoka (Rice stinkbug) (Oebalus pugnax)
- 1 - - - - 2 - 2 1
Chungipoka (Case worm) (Nymphula depunctalis)
1 3 5 7 - - - - 3 5
Lady bird beetle (Micraspis spp.)
2 - 14 19 9 2 - - 8 11
Green rice caterpillar (Naranga aenesceus)
- 1 10 23 3 - - - 7 12
Ear cutting calerpillar (Mythimna separata)
- - - - - - 13 4 13 4
* In some locations some farmers did not provide a positive response

78
Appendix 3. Different species of weeds reported by farmers in the study areas
Percent farmers responded*
Bogra Comilla Gazipur Rajshahi All locations
(Mean) Name of weeds
Aman Boro Aman Boro Aman Boro Aman Boro Aman Boro Amrul (small floating weeds) (Lemma polyrhiza)
- 31 22 27 - - - - 22 29
Chachra (Scirpus erectus)
26 20 - - 23 - - 1 25 20
Durbaghas (Bermuda grass) (Cynodon dactylon)
31 12 23 22 9 3 6 10 17 12
Gobra (Goose grass) (Eleusine indica)
- 5 - - - - - - 0 5
Mutha (Umbrella sedge) (Cyperus spp.)
94 70 29 37 32 83 15 2 43 48
Kochuripana (water hyacinth) (Eichhornia crassipes)
10 7 12 - - - - - 11 7
Fimbristylis (Fimbristylis littoralis)
- - 54 61 3 18 - - 29 40
Panikochu (Monochoria) (Monochoria vaginalis)
- 1 26 21 2 7 1 4 10 8
Chapra (Sprangletop) (Leptochloa chinensis)
- 1 - - - - - - 0 1
Shama (Barnyard grass) (Echinochloa crusgalli)
48 78 32 37 18 59 67 47 41 55
Knot grass (Paspalum spp.)
- 1 - - - - - - 0 1
Roughseed bulrush (Scirpus mucronatus)
- 20 28 24 - 43 24 1 26 22
(Marsilea crenata) - - 14 17 6 12 18 16 13 15
Others - - - - 7 4 80 58 44 31
*In some locations some farmers did not provide a positive response

79
Appendix 4. Sheath blight disease incidence and severity shown by field and corresponding host variety in T. Aman 2001 at Bogra.
Thana Union Block * Field wise sheath blight disease (%)
F1 F2 F3 F4 F5 F6 Variety Pajam Pajam BR11 BR11 Paja
m Pajam
I 24.8 4.2 15.8 17.0 5.2 9.8
1
SI 4.6 1.4 3.5 6.0 1.9 3.3 Variety BR11 BR11 BR11 BAU
2 Pajam
BR11
I 15.9 19.7 10.2 11.4 20.6 1.4
2
SI 5.7 7.9 3.1 3.3 6.0 0.1 Variety BR30 Nsail BR11 BR11 BR11 BR11
I 5.2 0.1 7.5 29.7 14.3 9.6
1
3
SI 1.4 0.1 2.9 12.3 5.0 3.0
Variety - - - - - - I - - - - - -
1
SI - - - - - - Variety
I - - - - - - 2
SI - - - - - - Variety BR11 BR11 Pajam BR11 BR11 Nsail
I 33.8 10.4 15.1 - 19.8 5.9
Gabtoli
2
3
SI 15.5 10.6 15.2 - 7.7 6.0
Variety BR11 Pajam BR11 BR30 Swarna Hybrid
I 21.3 21.1 14.8 - 50.4 20.4
1
SI 6.4 8.4 5.3 - 30.3 8.7 Variety BR11 Pajam BR11 Paja
m Swarna Bbona
I 18.1 12.1 10.8 8.4 15.4 8.4
2
SI 8.5 3.0 3.9 2.8 6.4 3.6 Variety K.bada Swrna BR11 Bbon Paja
m Bbona
I 0.0 15.7 12.7 16.4 13.1 12.1
1
3
SI 0.0 6.8 6.2 6.2 6.3 7.4
Variety Bbona Pajam Shalla BR11 Kbada
BR11
I 24.4 55.6 43.8 12.2 45.1 7.2
1
SI 9 33.3 20.8 7.5 22.8 33.6 Variety Shalla Shalla Bbona BR32 BR11 BR32
I 19.7 7.7 8.1 9.6 12.2 7.2 2
SI 3.9 3.9 5.4 6.4 3.1 - Variety Shalla Shalla BR23 BR23 BR23 BR23
I 6.7 10.0 5.0 4.3 5.3 6.7
Kahaloo
2
3
SI 2.5 4.3 2.7 2.2 2.6 3.3
- = Data were not taken * = Mean of the disease data obtained from the plant population of 5 spots
(each spot size was 1.0 M X 1.0 M)

80
Appendix 5. Sheath blight disease incidence and severity shown by field and corresponding host variety in T. Aman 2002 at Bogra. Thana Union Block * Field wise sheath blight disease (%)
F1 F2 F3 F4 F5 F6 Variety BR11 BR11 BR11 Pajam BR11 K.zira
I 25.3 7.0 33.0 6.1 13.1 6.9
1
SI 14.0 3.4 17.0 3.2 5.9 3.9 Variety BR11 BR11 BR11 BR11 Jdhepa Pajam
I 7.0 43.4 60.5 33.0 37.4 17.1 2
SI 3.6 25.8 42.9 18.8 19.8 7.9 Variety BR30 Pajam Pajam BR30 BR11 BR11
I 9.2 - 26.2 17.4 7.5 4.9
1
3
SI 4.6 - 20.3 8.8 4.0 2.2 Variety Pajam Jdhepa BR11 Nsail Kdeb BR11
I 0.4 1.1 10.1 1.2 - 0.3
1
SI 0.2 0.6 5.8 0.8 - 0.1 Variety BR11 BR11 BR11 BR11 BR11 BR11
I - 1.6 27.8 0.8 20.7 26.0 2
SI - 0.6 15.5 0.3 11.4 10.5 Variety BR11 BR11 BR11 BR11 BR11 BR11
I 50.5 25.7 7.1 26.0 4.0 3.0
Gabtoli
2
3
SI 26.2 14.2 3.8 14.0 1.2 0.8 Variety Swrna Pajam BR11 BR30 Swrna BR1
1 I 37.4 34.1 8.1 12.1 16.0 9.0
1
SI 23.2 20.5 3.3 8.5 8.9 5.4 Variety BR11 Pajam Kdepha BR11 Kdepha BR11
I 13.8 5.9 1.4 0.6 43.9 22.4 2
SI 6.4 1.6 0.5 0.2 30.8 - Variety Pajam Pajam Swrna BR11 BR11 BR1
1 I 18.5 13.2 11.0 7.0 65.1 15.1
1
3
SI 8.6 6.3 6.3 4.0 30.1 10.6 Variety Swrna Pajam Pajam BR11 Pajam BR11
I 23.0 10.3 13.7 15.2 5.2 9.1
1
SI 13.5 6.0 6.8 8.2 2.2 3.5 Variety BR11 Pajam BR11 Pajam Swrna BR11
I 36.3 7.5 21.2 13.7 12.6 36.7 2
SI 22.2 3.0 9.7 8.0 8.3 22.5 Variety Pajam BR11 Pajam BR11 Pajam BR1
1 I 22.1 10.3 10.6 13.6 5.2 14.4
Kahaloo
2
3
SI 11.7 4.2 4.7 6.4 2.4 6.2
- = Data were not taken * = Mean of the disease data obtained from the plant population of 5 spots
(each spot size was 1.0 M X 1.0 M)

81
Appendix 6. Sheath blight disease incidence and severity shown by field and corresponding host variety in Boro 2001-2 at Bogra Thana Union Block * Field wise sheath blight disease (%)
F1 F2 F3 F4 F5 F6 Variety BR29 BR14 BR15 BR14 BR14 BR28
I 8.0 1.0 12.6 6.5 13.0 20.8
1
SI 3.1 0.3 5.7 2.5 5.2 11.6 Variety BR14 BR14 BR28 BR14 BR14 BR1
I 14.3 29.1 19.3 36.9 26.5 2.3 2
SI 6.0 9.9 10.9 16.7 8.4 0.8 Variety BR14 BR28 BR14 BR29 BR1 BR1
I 10.8 2.1 18.0 4.0 5.4 0.5
1
3
SI 4.5 1.0 12.8 1.2 2.1 0.2 Variety BR28 BR14 China BR26 BR26 BR26
I 4.5 35.4 22.6 7.8 - 7.5
1
SI 1.5 46.4 9.4 3.3 - 2.6 Variety BR28 BR28 BR14 BR6 BR14 BR15
I - 1.3 56.6 8.8 67.9 11.2 2
SI - 0.6 25.4 4.0 19.6 3.9 Variety BR28 BR29 BR28 BR28 BR14 BR14
I 40.7 21.3 2.4 4.5 1.4 8.0
Gabtoli
2
3
SI 32.6 9.0 1.4 2.2 0.4 3.7 Variety Jhupri BR1 BR36 Pari Pari Pari
I 6.7 6.2 12.1 17.1 38.7 15.8
1
SI 2.8 2.3 6.7 8.5 17.8 7.7 Variety Pari China China BR1 BR28 Ihupri
I 7.1 2.0 12.0 7.5 13.5 2.2 2
SI 2.3 0.8 6.7 3.8 7.0 1.0 Variety BR1 BR1 BR1 BR1 BR1 BR1
I 11.5 16.1 6.1 7.0 1.0 -
1
3
SI 5.4 8.8 3.5 3.9 0.3 - Variety Pari BR1 BR1 BR1 Pari Pari
I 17.1 0.8 7.4 1.2 4.6 20.2
1
SI 10.7 0.2 4.7 0.6 3.1 16.6 Variety BR1 BR1 BR1 BR1 BR1 BR1
I 7.8 3.0 5.6 45.3 4.3 24.3 2
SI 5.0 2.3 3.2 33.6 3.0 16.4 Variety Juphri Juphri BR1 BR1 BR1 BR1
I 23.7 5.2 5.3 7.1 6.7 9.5
Kahaloo
2
3
SI 20.1 4.3 3.9 5.7 5.6 7.4
- = Data were not taken * = Mean of the disease data obtained from the plant population of 5 spots
(each spot size was 1.0 M X 1.0 M)

82
Appendix 7. Sheath blight disease incidence and severity shown by field and corresponding host variety in T. Aman 2001 of Comilla Thana Union Block * Field wise sheath blight disease (%)
F1 F2 F3 F4 F5 F6 Variety BR22 BR11 BR11 BR22 BR22 BR11
I 18.3 15.9 10.5 17.5 25.6 16.9
1
SI 12.9 9.5 5.5 10.5 16.3 11.2 Variety BR32 BR22 BR22 BR32 BR11 BR22
I 11.5 16.2 14.0 16.4 17.6 14.4 2
SI 7.2 11.4 12.4 12.7 12.7 8.9 Variety BR11 BR11 BR11 BR11 BR22 BR22
I 16.1 11.5 11.8 20.9 17.3 15.9
1
3
SI 11.5 8.4 8.5 4.4 12.6 10.5 Variety BR11 BR11 BR22 BR32 BR11 BR22
I 19.2 17.1 21.0 17.2 13.6 9.0
1
SI 13.4 12.7 12.6 11.4 7.8 4.8 Variety BR11 BR32 BR11 BR32 BR11 BR11
I 16.7 14.5 16.0 8.0 23.2 22.4 2
SI 6.9 4.9 8.3 6.3 12.2 10.2 Variety BR32 BR22 BR11 BR11 BR11 BR32
I 14.5 4.3 8.4 6.4 11.2 11.2
Chandina
2
3
SI 7.7 2.2 4.0 5.9 7.7 6.4 Variety BR22 BR22 BR32 BR11 BR11 BR22
I 13.4 15.4 28.0 10.2 14.5 23.1
1
SI 8.7 6.0 22.2 5.0 6.1 14.0 Variety BR32 BR11 BR11 BR22 BR32 BR11
I 35.4 12.4 21.3 33.3 32.7 35.8 2
SI 22.4 4.5 15.5 24.9 24.6 24.7 Variety BR32 BR22 BR11 BR11 BR11 BR11
I 10.3 15.3 13.7 16.2 26.6 18.5
1
3
SI 6.1 10.1 8.8 8.2 15.2 12.1 Variety BR22 BR22 BR11 BR22 BR22 BR32
I 18.9 30.3 19.8 19.1 16.5 17.0
1
SI 5.4 22.0 17.2 12.1 9.7 11.5 Variety BR11 BR11 BR11 BR11 BR11 BR22
I 10.8 20.6 23.8 4.9 6.0 5.0 2
SI 5.3 12.8 12.8 6.6 7.4 9.2 Variety BR11 BR11 BR11 BR22 BR11 BR11
I 15.5 13.5 9.4 10.7 11.3 10.2
Burichong
2
3
SI 7.0 8.3 5.0 6.0 6.2 4.8
- = Data were not taken * = Mean of the disease data obtained from the plant population of 5 spots
(each spot size was 1.0 M X 1.0 M)

83
Appendix 8. Sheath blight disease incidence and severity shown by field and corresponding host variety in T. Aman 2002 of Comilla Thana Union Block * Field wise sheath blight disease (%)
F1 F2 F3 F4 F5 F6 Variety BR32 Gijhaz BR22 BR22 Gijhaz BR32
I 10.1 4.5 15.5 17.3 4.2 12.3
1
SI 4.5 1.7 6.9 6.9 1.4 5.2 Variety Gijhaz BR22 BR22 BR29 BR29 BR29
I 4.7 6.5 2.7 3.8 5.9 3.1 2
SI 1.8 1.8 2.3 0.9 1.6 3.0 Variety BR22 BR22 BR22 BR22 BR22 BR32
I 1.9 2.3 2.9 3.1 3.7 2.4
1
3
SI 1.0 0.8 1.0 1.2 1.4 1.6 Variety Hawai Pajam Hawai BR22 BR32 BR22
I 4.3 5.4 9.5 5.0 2.5 4.8
1
SI 1.8 1.8 4.6 1.7 0.8 1.8 Variety Hawai Pajam Hawai BR22 BR32 BR22
I 3.0 1.8 4.5 13.9 9.0 16.5 2
SI 1.0 0.8 1.8 6.1 3.5 7.5 Variety Gihaz Pajam BR22 Gihaz Hawai Gihaz
I 1.5 2.4 5.2 1.2 3.6 3.3
2
3
SI 0.5 1.0 1.7 0.4 1.8 1.6 Variety BR22 BR22 BR22 BR22 BR22 BR22
I 4.9 6.4 2.8 2.1 3.3 4.2
1
SI 1.0 1.3 0.6 0.4 0.7 1.0 Variety BR22 BR22 BR22 BR22 BR22 BR22
I 3.3 4.2 4.0 3.6 3.6 3.7 2
SI 0.9 1.3 1.2 1.0 1.0 1.1 Variety BR22 BR22 BR22 BR22 BR22 BR32
I 15.3 16.0 18.8 17.0 16.5 12.8
1
3
SI 4.4 4.4 4.3 3.6 5.0 3.3 Variety BR22 BR32 BR22 BR22 BR22 BR22
I 8.1 8.1 11.0 7.4 9.0 8.5
1
SI 8.5 9.7 10.4 7.3 8.4 8.6 Variety BR22 BR22 BR22 BR22 BR22 BR32
I 12.0 11.1 7.7 8.9 24.1 14.5 2
SI 6.5 6.6 3.5 3.8 12.5 7.1 Variety BR16 BR11 BR16 BR16 BR29 BR29
I 2.5 0.9 1.3 1.5 1.0 0.9
2
3
SI 0.5 0.2 0.3 0.3 0.2 0.2
- = Data were not taken * = Mean of the disease data obtained from the plant population of 5 spots
(each spot size was 1.0 M X 1.0 M)

84
Appendix 9. Sheath blight disease incidence and severity shown by field and corresponding host variety in Boro 2001-2 of Comilla Thana Union Block * Field wise sheath blight disease (%)
F1 F2 F3 F4 F5 F6 Variety BR20 Iratom BR28 Iratom BR28 BR28
I 56.0 55.1 52.2 70.7 75.8 63.8
1
SI 0.03 0.03 0.02 0.02 0.02 0.02 Variety Iratom BR29 Iratom Iratom Iratom BR28
I 65.0 25.8 38.4 40.3 51.8 59.4 2
SI 0.02 0.1 0.01 0.1 0.1 0.1 Variety Iratom Iratom BR28 BR28 BR29 BR29
I 54.0 75.2 54.8 88.6 55.2 35.7
1
3
SI 0.02 0.03 0.03 0.2 0.1 0.1 Variety BR16 BR28 BR16 BR28 BR28 BR14
I 70.5 50.7 64.0 65.2 68.1 69.3
1
SI 0.2 0.2 0.2 0.2 0.2 0.2 Variety BR16 Iratom BR28 BR29 BR16 BR28
I 60.6 67.8 51.2 45.3 68.0 42.8 2
SI 0.1 0.2 0.1 0.1 0.2 0.1 Variety Iratom IR50 BR16 BR20 BR16 BR29
I 62.3 46.8 64.6 49.8 60.6 55.9
Chandina
2
3
SI 0.2 0.1 0.2 0.1 0.2 0.1 Variety BR16 BR16 BR16 BR16 BR29 BR29
I 7.9 4.9 4.8 2.3 2.1 2.5
1
SI 3.5 2.2 2.2 1.1 1.0 1.2 Variety BR29 BR16 BR16 BR16 BR19 BR14
I 3.7 4.5 3.8 4.5 4.4 4.0 2
SI 1.6 1.9 1.6 1.9 1.9 1.8 Variety BR29 Joya Joya BR29 Joya Joya
I 3.9 4.5 3.5 6.7 6.4 6.5
1
3
SI 1.8 2.0 1.5 3.2 3.0 3.1 Variety BR3 BR14 BR3 BR14 BR14 BR28
I 3.9 4.3 4.2 4.7 4.9 5.9
1
SI 1.9 2.1 1.9 2.4 2.2 2.5 Variety BR16 BR16 BR16 BR16 BR16 BR16
I 5.2 3.6 4.0 4.9 4.4 4.7 2
SI 2.5 1.7 2.1 2.3 2.0 2.1 Variety BR14 BR14 BR14 BR14 BR14 BR14
I 3.1 4.1 3.5 3.2 3.6 4.3
Debidar
2
3
SI 1.2 1.7 1.4 1.3 1.5 1.7
- = Data were not taken * = Mean of the disease data obtained from the plant population of 5 spots
(each spot size was 1.0 M X 1.0 M)

85
Appendix 10. Sheath blight disease incidence and severity shown by field and corresponding host variety in T. Aman 2001 of Gazipur. Thana Union Block * Field wise sheath blight disease (%)
F1 F2 F3 F4 F5 F6 Variety BR11 BR11 BR11 BR11 BR11 BR11
I 13.3 2.0 4.4 32.0 76.8 10.2
Vaoride
SI 6.5 0.9 1.4 15.8 40.0 3.4 Variety BR14 BR30 Pajam BR11 BR11 BR11
I 52.8 11.5 20.0 58.2 21.9 - Porabari
SI 24.5 3.5 9.3 30.5 8.3 - Variety BR11 BR11 BR14 BR11 BR11 BR30
I 5.3 16.6 12.6 4.5 5.9 4.6
Kawaltia
Zolarpar
SI 2.4 6.7 5.7 2.2 1.9 1.9 Variety BR11 BR11 BR11 BR11 BR11 BR11
I 40.3 31.0 35.9 53.7 55.9 52.8
Kashimpur
SI 20.7 16.0 18.6 28.5 29.3 26.8 Variety Nsail Nsail Nsail BR11 BR11 BR11
I 19.3 34.5 38.7 36.5 30.5 31.0 Porabari
SI 8.3 18.6 19.5 17.1 15.2 20.2 Variety BR11 BR11 BR11 BR11 BR32 BR11
I 34.4 36.4 14.3 14.3 15.8 17.8
Gazipur
Kashimpur
Vobanipur
SI 14.3 14.1 7.5 7.4 6.3 7.6 Variety BR11 BR11 BR11 BR11 BR11 BR11
I 2.9 0.07 6.3 0.2 3.3 1.9
Tengra
SI 1.1 0.01 3.0 0.07 1.4 3.7 Variety BR23 BR2 BR11 BR11 BR11 BR11
I 10.7 0.2 6.5 3.6 34.7 5.9 Shytalia
SI 5.6 0.07 2.7 1.4 12.7 2.7 Variety Ifccha Ifccha Icemor Ashkor BR11 BR11
I 8.0 1.0 2.5 100 4.5 8.5
Telihati
Tapirbari
SI 3.2 0.9 0.9 1.3 1.1 3.3 Variety - - - - - -
I - - - - - -
Chockpara
SI - - - - - - Variety
I - - - - - - Patharpara
SI - - - - - - Variety
I - - - - - -
Sreepur
Maouna
Barodapa
SI - - - - - -
- = Data were not taken * = Mean of the disease data obtained from the plant population of 5 spots
(each spot size was 1.0 M X 1.0 M)
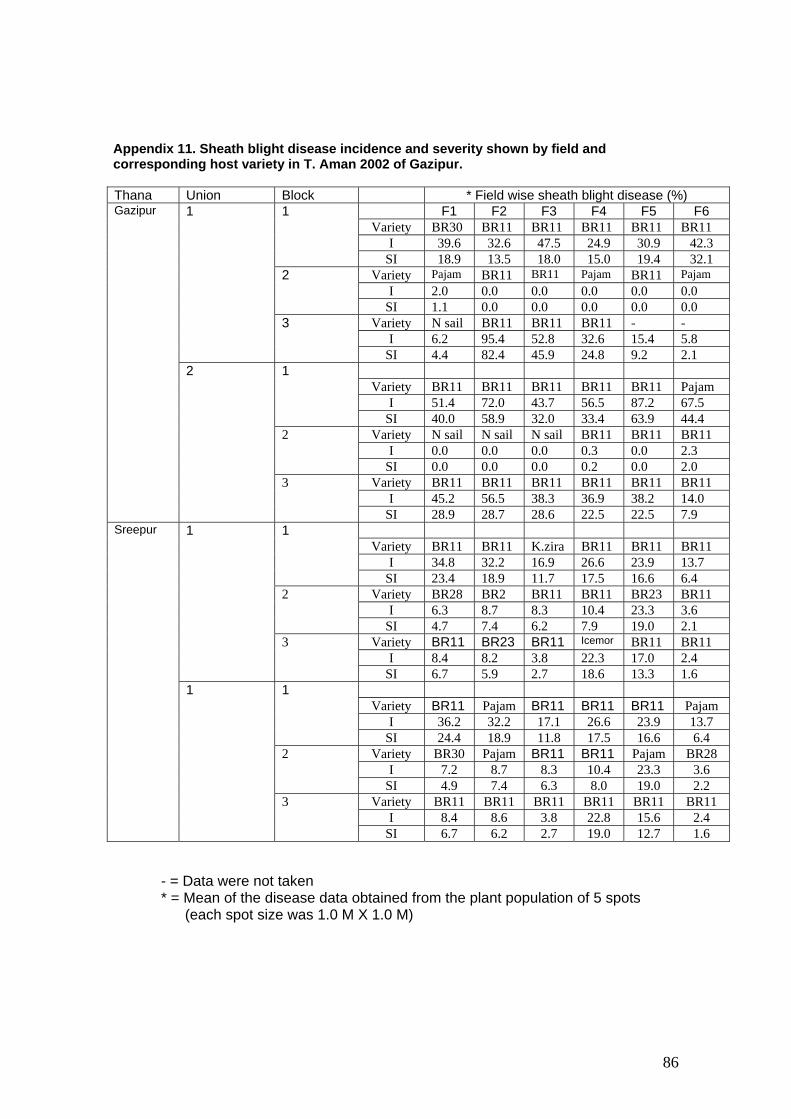
86
Appendix 11. Sheath blight disease incidence and severity shown by field and corresponding host variety in T. Aman 2002 of Gazipur. Thana Union Block * Field wise sheath blight disease (%)
F1 F2 F3 F4 F5 F6 Variety BR30 BR11 BR11 BR11 BR11 BR11
I 39.6 32.6 47.5 24.9 30.9 42.3
1
SI 18.9 13.5 18.0 15.0 19.4 32.1 Variety Pajam BR11 BR11 Pajam BR11 Pajam
I 2.0 0.0 0.0 0.0 0.0 0.0 2
SI 1.1 0.0 0.0 0.0 0.0 0.0 Variety N sail BR11 BR11 BR11 - -
I 6.2 95.4 52.8 32.6 15.4 5.8
1
3
SI 4.4 82.4 45.9 24.8 9.2 2.1 Variety BR11 BR11 BR11 BR11 BR11 Pajam
I 51.4 72.0 43.7 56.5 87.2 67.5
1
SI 40.0 58.9 32.0 33.4 63.9 44.4 Variety N sail N sail N sail BR11 BR11 BR11
I 0.0 0.0 0.0 0.3 0.0 2.3 2
SI 0.0 0.0 0.0 0.2 0.0 2.0 Variety BR11 BR11 BR11 BR11 BR11 BR11
I 45.2 56.5 38.3 36.9 38.2 14.0
Gazipur
2
3
SI 28.9 28.7 28.6 22.5 22.5 7.9 Variety BR11 BR11 K.zira BR11 BR11 BR11
I 34.8 32.2 16.9 26.6 23.9 13.7
1
SI 23.4 18.9 11.7 17.5 16.6 6.4 Variety BR28 BR2 BR11 BR11 BR23 BR11
I 6.3 8.7 8.3 10.4 23.3 3.6 2
SI 4.7 7.4 6.2 7.9 19.0 2.1 Variety BR11 BR23 BR11 Icemor BR11 BR11
I 8.4 8.2 3.8 22.3 17.0 2.4
1
3
SI 6.7 5.9 2.7 18.6 13.3 1.6 Variety BR11 Pajam BR11 BR11 BR11 Pajam
I 36.2 32.2 17.1 26.6 23.9 13.7
1
SI 24.4 18.9 11.8 17.5 16.6 6.4 Variety BR30 Pajam BR11 BR11 Pajam BR28
I 7.2 8.7 8.3 10.4 23.3 3.6 2
SI 4.9 7.4 6.3 8.0 19.0 2.2 Variety BR11 BR11 BR11 BR11 BR11 BR11
I 8.4 8.6 3.8 22.8 15.6 2.4
Sreepur
1
3
SI 6.7 6.2 2.7 19.0 12.7 1.6
- = Data were not taken * = Mean of the disease data obtained from the plant population of 5 spots
(each spot size was 1.0 M X 1.0 M)

87
Appendix 12. Sheath blight disease incidence and severity shown by field and corresponding host variety in Boro2001-2 of Gazipur. Thana Union Block Field wise sheath blight disease (%)
F1 F2 F3 F4 F5 F6 Variety BR28 BR28 BR28 S.mala S.mala S.mala
I 3.3 2.8 3.9 3.1 4.7 0.9
1
SI 1.9 1.7 2.4 1.8 2.3 0.5 Variety S.mala S.mala S.mala S.mala S.mala S.mala
I 1.8 5.2 6.7 2.6 1.9 2.5 2
SI 0.8 2.8 3.9 1.2 0.8 1.7 Variety BR29 BR29 BR29 BR29 BR29 BR29
I 2.8 1.9 3.1 2.0 1.3 2.2
1
3
SI 2.0 1.1 1.8 1.1 0.7 1.6 Variety BR29 BR11 BR29 BR29 BR11 BR29
I 4.5 0.9 5.6 3.6 1.6 4.9
1
SI 2.9 0.5 3.9 2.4 0.9 2.8 Variety BR29 China China BR29 BR29 BR19
I 4.5 1.6 0.6 2.7 2.7 4.6 2
SI 2.6 1.0 0.3 1.5 1.7 2.8 Variety BR28 BR14 BR28 BR28 BR29 BR28
I 3.2 4.0 3.1 0.8 2.6 5.0
Gazipur
2
3
SI 2.0 2.5 1.8 0.5 1.6 3.2 Variety BR29 China China China BR14 China
I 6.7 12.2 12.4 15.4 13.4 17.6
1
SI 3.8 7.8 7.6 9.2 7.6 10.1 Variety China China China China China China
I 7.2 9.3 8.1 17.8 19.9 16.0 2
SI 3.5 5.5 4.4 11.1 12.4 10.1 Variety China China China China China China
I 19.5 7.3 23.1 17.2 22.4 24.7
1
3
SI 12.3 3.5 14.2 10.3 13.4 15.0 Variety China China China China China China
I 14.9 13.8 16.6 12.9 13.2 10.2
1
SI 9.0 8.3 10.4 8.3 11.4 6.3 Variety China China China China China China
I 14.7 17.9 8.1 16.4 21.0 23.0 2
SI 8.6 10.7 4.1 9.5 12.9 14.9 Variety Mukti Mukti Mukti China Iratom Iratom
I 18.0 19.5 16.9 21.3 23.5 15.7
Sreepur
2
3
SI 11.3 14.8 10.4 12.8 14.8 9.6
- = Data were not taken * = Mean of the disease data obtained from the plant population of 5 spots
(each spot size was 1.0 M X 1.0 M)

88
Appendix 13. Sheath blight disease incidence and severity shown by field and corresponding host variety in Rajshahi, T. Aman 2001 Thana Union Block * Field wise sheath blight disease (%)
F1 F2 F3 F4 F5 F6 Variety Swrn
a Swrna Swrna Swrna Swrna Swrna
I 51.3 49.9 48.7 57.0 52.1 54.4
1
SI 32.8 34.9 30.3 28.3 29.3 30.3 Variety Swrn
a BR11 Swrna BR11 Swrna BR11
I 41.7 27.4 37.4 18.6 31.9 20.8
2
SI 23.8 12.8 21.4 9.8 17.0 11.1 Variety BR31 Swrna Swrna Swrna Swrna BR11
I 13.1 40.4 29.3 57.7 52.0 11.6
1
3
SI 2.7 20.3 6.4 28.9 27.6 2.5 Variety Swrn
a Swrna Swrna Swrna Swrna Swrna
I 53.5 51.8 54.9 53.0 58.2 51.9
1
SI 31.3 32.1 28.1 30.5 25.2 34.0 Variety Swrn
a Swrna Swrna Swrna Swrna Swrna
I 44.4 46.9 38.5 45.7 43.0 56.6
2
SI 23.7 21.1 22.1 18.0 17.5 28.2 Variety BR11 Atop BR11 BR11 BR31 Swrna
I 17.3 17.8 15.9 19.5 18.1 57.3
Godagari
2
3
SI 3.4 2.3 5.4 7.0 8.4 22.3 Variety Atop BR31 BR11 BR11 Swrna Swrna
I 24.2 27.4 30.0 32.9 46.9 41.8
1
SI 11.0 14.8 11.1 11.4 30.2 15.8 Variety BR11 BR31 BR11 BR31 Swrna Swrna
I 24.0 31.7 18.1 18.4 43.5 57.6 2
SI 9.0 7.0 2.8 2.6 19.9 19.6 Variety BR11 BR11 Swrna BR11 Swrna BR11
I 33.5 27.2 48.5 39.8 50.5 29.7
1
3
SI 17.7 13.4 37.0 16.2 16.9 12.0 Variety BR11 Swrna Swrna Swrna BR11 Swrna
I 37.5 27.5 37.9 40.8 39.8 41.8
1
SI 12.7 12.2 9.5 21.1 13.5 16.8 Variety BR11 BR11 Swrna BR11 Swrna Swrna
I 43.8 20.7 24.5 39.7 41.4 40.6 2
SI 14.0 8.4 17.4 14.5 14.8 19.5 Variety BR11 BR11 Atop BR11 Swrna Swrna
I 24.0 32.4 17.0 18.3 43.3 53.8
Paba
2
3
SI 10.8 10.7 4.9 5.3 20.9 25.5
- = Data were not taken * = Mean of the disease data obtained from the plant population of 5 spots
(each spot size was 1.0 M X 1.0 M)

89
Appendix 14. Sheath blight disease incidence and severity shown by field and corresponding host variety in Rajshahi, T. Aman 2002 Thana Union Block * Field wise sheath blight disease (%)
F1 F2 F3 F4 F5 F6 Variety Swarna Atop BR32 BR32 Swarna Swarna
I 6.6 4.5 2.9 3.2 12.1 8.2
1
SI 4.1 1.7 0.9 0.9 6.2 5.2 Variety BR32 BR32 BR32 Swarna Swarna Swarna
I 5.2 5.9 2.1 19.1 77.2 11.0 2
SI 1.9 1.8 1.1 19.1 78.5 7.7 Variety Swarna BR32 Swarna Swarna Swarna Swarna
I 7.9 2.0 8.7 10.3 28.4 68.2
1
3
SI 6.8 0.8 4.7 8.9 20.9 71.9 Variety Swarna Swarna Swarna Swarna Swarna Swarna
I 26.6 6.2 7.8 67.3 67.3 14.3
1
SI 16.1 2.2 1.9 51.5 46.2 10.1 Variety Swarna Swarna Swarna Swarna Swarna Swarna
I 60.2 30.2 19.5 12.9 10.8 36.4 2
SI 26.5 26.3 17.2 6.8 5.8 26.5 Variety BR30 Swarna Swarna Swarna Swarna Swarna
I 20.9 73.1 41.8 84.3 65.8 11.5
Godagari
2
3
SI 6.5 42.2 34.6 64.1 46.6 6.3 Variety Swarna BR32 Swarna BR32 BR32 BR32
I 36.6 6.9 39.0 3.9 5.1 5.1
1
SI 39.1 4.6 30.8 3.5 4.7 5.1 Variety BR32 Swarna BR32 BR11 BR32 Swarna
I 8.5 24.4 2.4 18.8 8.1 67.0 2
SI 8.3 15.5 2.4 13.5 8.3 57.7 Variety Swarna Swarna Swarna BR32 BR32 BR32
I 23.0 15.2 3.9 3.7 5.6 14.9
1
3
SI 21.9 10.2 2.0 2.3 3.9 10.1 Variety Swarna Swarna Swarna Swarna Swarna Swarna
I 18.1 25.0 58.4 16.6 50.8 29.2
1
SI 15.9 24.4 24.2 8.4 29.7 13.8 Variety Swarna BR32 Swarna Swarna Swarna Atop
I 29.8 10.2 14.7 37.7 35.0 13.4 2
SI 22.3 5.4 10.3 40.7 39.1 8.9 Variety BR32 Swarna Atop BR32 BR32 BR32
I 11.4 23.3 10.0 26.2 19.9 19.3
Tanore
2
3
SI 8.0 23.2 10.7 17.5 12.9 5.6
- = Data were not taken * = Mean of the disease data obtained from the plant population of 5 spots
(each spot size was 1.0 M X 1.0 M)

90
Appendix 15. Sheath blight disease incidence and severity shown by field and corresponding host variety in Rajshahi, Boro 2001-2. Thana Union Block * Field wise sheath blight disease (%)
F1 F2 F3 F4 F5 F6 Variety Parijat BR28 BR29 BR28 BR36 BR29
I 10 13.9 11.8 11.3 7.4 11.7
1
SI 6.3 9.7 7.9 6.7 6.1 8.3 Variety Parijat IR20 BR28 IR20 Parijat IR20
I 10.1 8.8 11.0 6.6 9.5 7.0 2
SI 7.0 6.3 7.5 4.7 7.1 4.5 Variety BR29 BR28 IR20 IR20 IR20 Parijat
I 7.3 9.6 8.8 8.9 12.1 9.8
1
3
SI 4.6 6.9 5.2 4.8 6.5 4.9 Variety IR50 IR50 IR50 IR50 IR50 IR50
I 22.9 21.8 26.6 22.0 27.2 28.8
1
SI 16.7 16.7 19.8 15.2 20.8 20.4 Variety BR28 IR20 Parijat IR20 IR20 BR28
I 13.4 18.9 17.7 27.5 23.8 28.4 2
SI 7.4 11.9 10.7 15.9 16.5 16.3 Variety Parijat Parijat Parijat Parijat Parijat Parijat
I 23.0 27.0 41.3 28.1 26.8 30.2
Godagari
2
3
SI 15.2 18.1 28.7 19.9 17.9 20.6 Variety IR20 IR20 Parijat IR20 IR20 IR20
I 23.3 23.7 20.5 20.9 23.2 25.8
1
SI 19.0 19.5 16.2 16.5 17.1 21.1 Variety IR20 IR20 BR28 IR20 Parijat IR20
I 20.2 20.7 13.4 19.7 16.3 15.5 2
SI 14.5 13.5 9.9 13.5 11.8 12.4 Variety IR50 IR50 IR50 - IR50 IR50
I 25.2 26.6 27.7 - 25.7 22.0
1
3
SI 18.1 18.9 20.0 - 16.5 13.7 Variety IR20 Parijat IR20 IR20 BR28 IR20
I 17.6 19.8 19.3 19.6 18.3 18.2
1
SI 14.0 14.6 14.4 13.4 14.4 14.4 Variety Parijat Parijat Parijat BR28 BR28 IR20
I 35.5 39.1 27.1 18.3 29.6 38.9 2
SI 25.5 26.0 21.0 11.2 21.0 29.7 Variety Parijat IR20 BR28 IR20 IR20 IR20
I 41.5 30.5 28.3 23.5 25.3 22.6
Tanore
2
3
SI 31.6 15.9 18.2 19.6 16.2 17.9
- = Data were not taken * = Mean of the disease data obtained from the plant population of 5 spots
(each spot size was 1.0 M X 1.0 M)

91
Appendix 16. Sheath blight disease incidence and severity shown by field and corresponding host variety in Rajshahi, T. Aus 2003 Thana Union Block * Field wise sheath blight disease (%)
Variety Nmoni Nmoni Nmoni Nmoni Parijat Nmoni
I 65.2 54.9 52.5 39.3 65.5 46.8
1
SI 56.5 41.4 32.9 21.4 28.8 33.0 Variety Parijat Nmoni Nmoni Parijat Nmoni Parijat
I 59.0 65.3 45.8 51.8 47.2 34.5 2
SI 42.2 29.1 24.4 37.4 30.5 18.0 Variety BR28 Nmoni Nmoni BR28 BR28 BR28
I 86.3 21.0 55.7 83.1 61.3 98.8
1
3
SI 73.7 8.2 38.5 42.1 11.4 87.9 Variety Nmoni Nmoni Nmoni Parijat Parijat Parijat
I 53.8 55.8 75.7 9.6 32.4 13.8
1
SI 37.6 37.7 61.0 6.1 21.3 8.1 Variety Parijat Nmoni Parijat Nmoni Nmoni Nmoni
I 41.3 67.1 35.7 33.5 52.2 46.3 2
SI 27.2 49.9 28.7 15.4 43.9 32.1 Variety Nmoni Parijat Nmoni Nmoni Nmoni Nmoni
I 4.5 21.8 12.6 86.1 46.8 32.3
Tanore
2
3
SI 0.6 2.9 2.5 73.4 35.7 23.3
Data were not taken in Godagari Thana * = Mean of the disease data obtained from the plant population of 5 spots
(each spot size was 1.0 M X 1.0 M)

92
Appendix 17. Isolation status of Rhizoctonia solani, Rhizoctonia oryzae-sativae and Rhizoctonia oryzae from infected sheath samples
T. Aman 2001 Boro 2001-2002 T. Aman 2002 Tested (No.)
Responded Tested (No.)
Responded Tested (No.)
Responded Sites Disease
(No.) % (No.) % (No.) % ShB 72 61 84.7 24 17 70..8 47 28 59.6 ShS 72 3 4.2 13 1 7.7 45 0 0
Bogra
AShS 72 19 26.4 19 1 5.3 40 3 7.5 ShB 72 64 88.9 42 16 38.1 44 30 68.2 ShS 71 0 0 42 0 0 44 3 6.8
Comilla
AShS 71 14 19.7 42 4 9.5 42 27 64.3 ShB 54 37 68.5 72 42 58.3 41 32 78 ShS 41 0 0 2 0 0 17 2 11.8
Gazipur
AShS 29 12 72.4 4 1 25 14 3 21.4 ShB 72 64 88.9 24 19 79.2 24 13 54.2 ShS 25 2 8 0 0 0 0 0 0
Rajshahi
AShS 26 14 53.8 0 0 0 0 0 0 ShB, sheath blight; AShS, aggregate sheath spot; ShS, sheath spot

93
Appendix 18. Virulence of Rhizoctonia solani isolates of plant and soil origin across four locations
Relative lesion height* Geographical
source Isolate designation Source
Plant soil Mean
Bogra 800 20.2 25.4 22.8
801 - 38.8 38.8
803 20.0 10.2 15.1
811 13.2 36.9 25.0
812 52.5 20.9 36.7
819 23.3 27.1 25.2
821 12.5 21.3 16.9
823 - 27.1 27.1
837 12.7 29.6 21.2
841 - 17.7 17.7
844 16.3 13.8 15.1
852 - 16.4 16.4
861 - 35.6 35.6
Mean 23.2 24.7
Comilla 653 16.0 18.6 17.3
657 13.7 22.5 18.1
663 15.5 20.1 17.8
685 7.7 28.4 18.1
687 7.5 22.2 14.9
698 23.0 19.5 21.3
703 18.6 - 18.6
709 40.6 23.5 32.1
710 - 25.5 25.5
715 - 14.0 14.0
718 10.5 12.3 11.4
685 (C14) 27.7 27.7
Mean 17.0 21.3 19.2
Gazipur 577 16.9 16.9
578 42.8 11.8 27.3
581 34.6 23.7 29.1
583 - 30.1 30.1
584 - 12.7 12.7

94
Relative lesion height* Geographical
source Isolate designation Source
Plant soil Mean
585 - 31.8 31.8
586 - 19.0 19.0
587 - 16.5 16.5
588 16.2 19.1 17.7
595 15.9 15.9
596 30.8 10.3 20.6
597 15.1 30.6 22.8
598 34.3 20.5 27.4
599 29.3 14.9 22.1
625 25.4 6.9 16.2
627 10.1 24.9 17.5
629 16.1 21.4 18.8
Mean 27.5 18.4
Rajshahi 01 12.1 23.7 17.9
02 (C-1) 46.5 51.0 48.8
02 (C-2) 28.3 - 28.3
03(C-1) 28.4 29.6 29.0
03(C-2) 32.0 - 32.0
04 33.3 35.5 34.4
05 31.8 57.0 44.4
06 24.5 - 24.5
07 21.5 20.9 21.2
08 33.7 - 33.7
09 43.0 1.1 22.1
10(C-1) 40.5 43.1 41.8
10(C-2) 38.4 - 38.4
Mean 32.7 31.8 -
* = Mean of 6-9 replications
- = Not tested
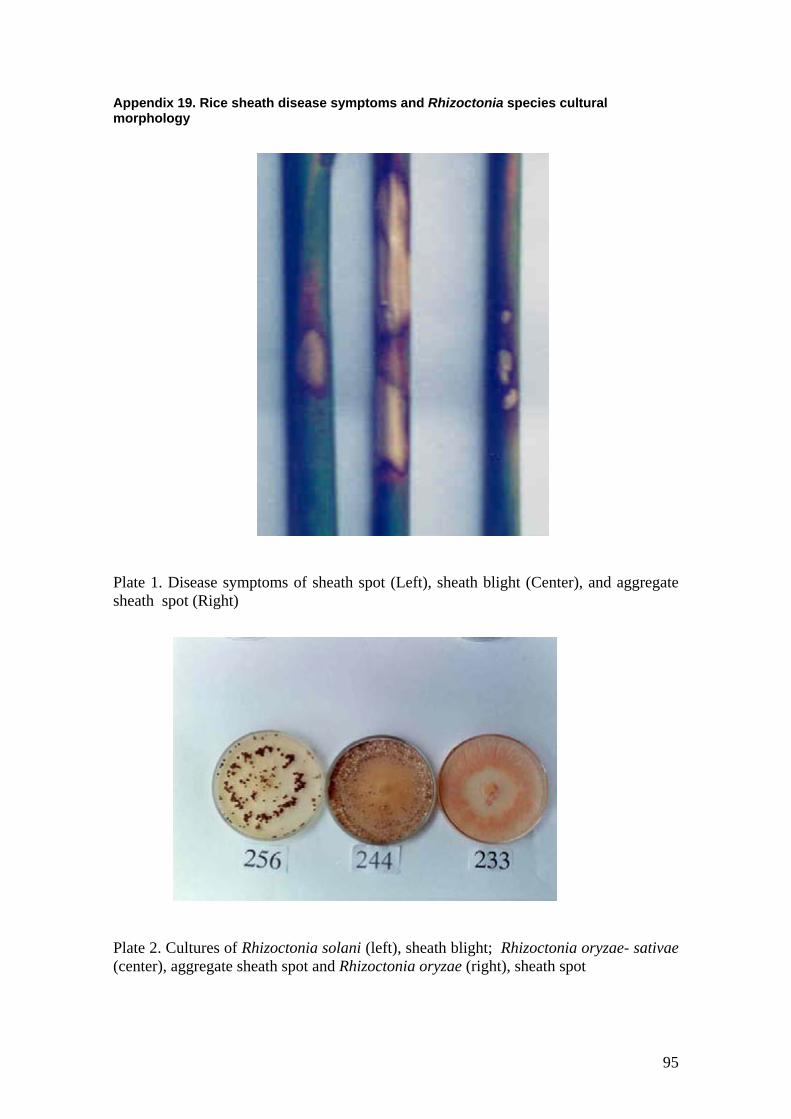
95
Appendix 19. Rice sheath disease symptoms and Rhizoctonia species cultural morphology
Plate 1. Disease symptoms of sheath spot (Left), sheath blight (Center), and aggregate sheath spot (Right)
Plate 2. Cultures of Rhizoctonia solani (left), sheath blight; Rhizoctonia oryzae- sativae (center), aggregate sheath spot and Rhizoctonia oryzae (right), sheath spot

96
Appendix 20. Rhizoctonia spp. isolates used for molecular characterisation CODE NUMBER ISOLATE SOURCE DISTRICT 1 2 3
68/2000 BD41 BD42
Bogra
4 5 6
46/1999 BD93 BD87
Brahmanbaria
7 62/2000 Chandpur 8 9
17/2000 18b/2000
Chuadanga
10 11 12
19/2000 23/2000 BD82
Comilla
13 14
BD61 BD62
Dinajpur
15 16 17 18
2/2000 16/2000 BD77 BD69
Gazipur
19 60/2000 Habiganj 20 21 22
BD09 BD10 BD11
Jessore
23 24
BD02 BD03
Khulna
25 1/2000 Kishorganj 26 27
BD20 BD21
Kustia
28 29 30
50/2000 54/2000 59/2000
Maulvi Bazar
31 32 33
6/2000 14/2000 BD78
Mymensingh
34 28/2001 Narsinghdi 35 42/2000 Pabna 36 37 38 39
3/2000 41/2000 BD59 BD35
Rajshahi
40 41
BD48 BD49
Rangpur
42 55/2000 Sylhet 43 5/2000 Tangail
Isolates 1 – 46 are R. solani ROS, R. oryzae sativae RO, R. oryzae Isolates in blue were provided by A. Ali and S.Archer. - Unknown
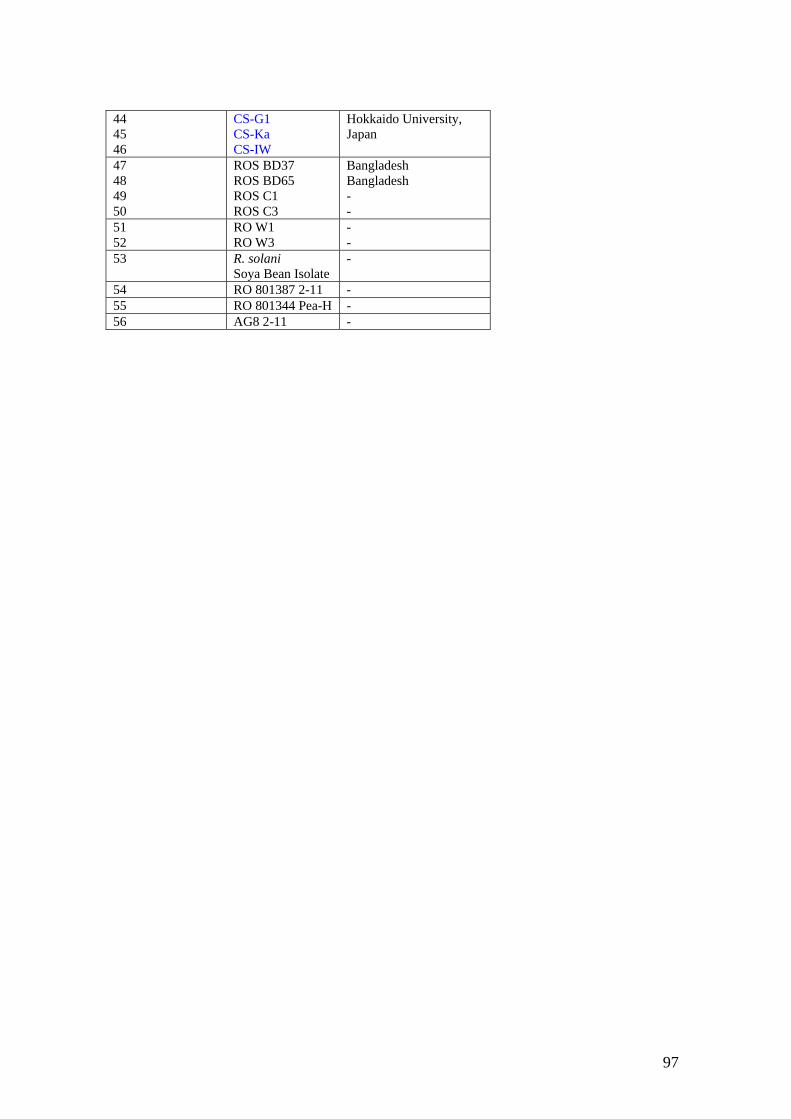
97
44 45 46
CS-G1 CS-Ka CS-IW
Hokkaido University, Japan
47 48 49 50
ROS BD37 ROS BD65 ROS C1 ROS C3
Bangladesh Bangladesh - -
51 52
RO W1 RO W3
- -
53 R. solani Soya Bean Isolate
-
54 RO 801387 2-11 - 55 RO 801344 Pea-H - 56 AG8 2-11 -
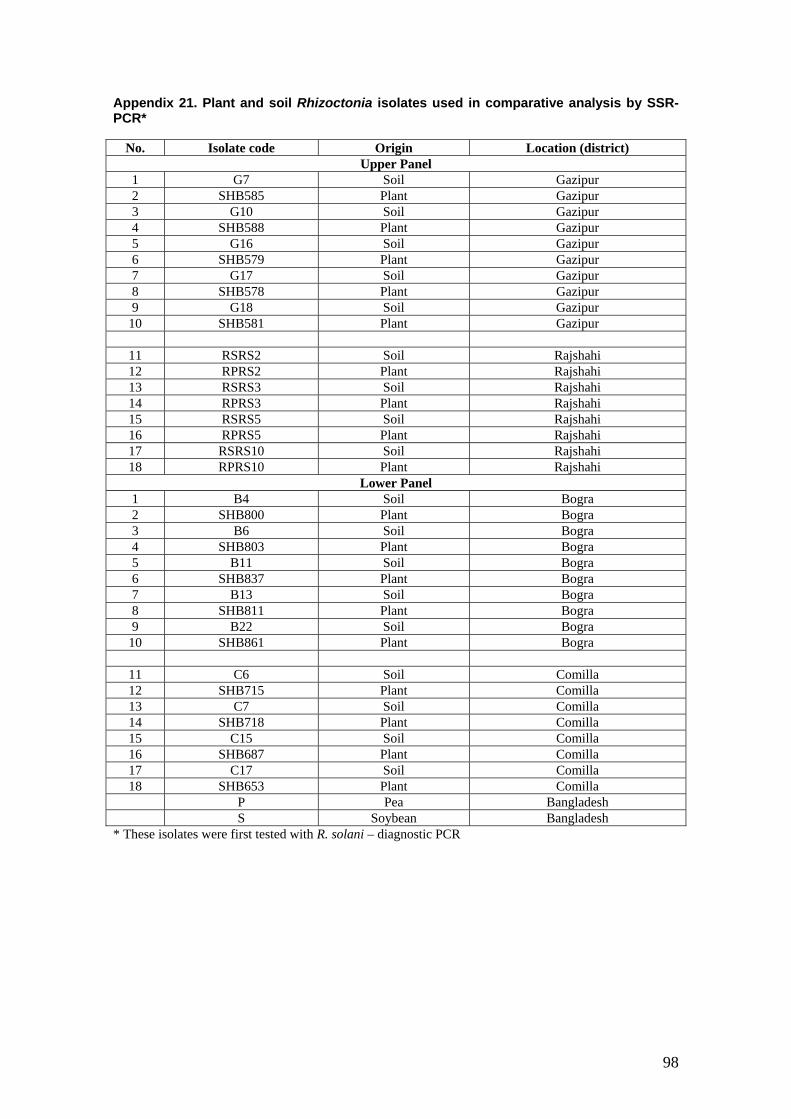
98
Appendix 21. Plant and soil Rhizoctonia isolates used in comparative analysis by SSR-PCR*
No. Isolate code Origin Location (district) Upper Panel
1 G7 Soil Gazipur 2 SHB585 Plant Gazipur 3 G10 Soil Gazipur 4 SHB588 Plant Gazipur 5 G16 Soil Gazipur 6 SHB579 Plant Gazipur 7 G17 Soil Gazipur 8 SHB578 Plant Gazipur 9 G18 Soil Gazipur
10 SHB581 Plant Gazipur
11 RSRS2 Soil Rajshahi 12 RPRS2 Plant Rajshahi 13 RSRS3 Soil Rajshahi 14 RPRS3 Plant Rajshahi 15 RSRS5 Soil Rajshahi 16 RPRS5 Plant Rajshahi 17 RSRS10 Soil Rajshahi 18 RPRS10 Plant Rajshahi
Lower Panel 1 B4 Soil Bogra 2 SHB800 Plant Bogra 3 B6 Soil Bogra 4 SHB803 Plant Bogra 5 B11 Soil Bogra 6 SHB837 Plant Bogra 7 B13 Soil Bogra 8 SHB811 Plant Bogra 9 B22 Soil Bogra
10 SHB861 Plant Bogra
11 C6 Soil Comilla 12 SHB715 Plant Comilla 13 C7 Soil Comilla 14 SHB718 Plant Comilla 15 C15 Soil Comilla 16 SHB687 Plant Comilla 17 C17 Soil Comilla 18 SHB653 Plant Comilla
P Pea Bangladesh S Soybean Bangladesh
* These isolates were first tested with R. solani – diagnostic PCR

99
Appendix 22. Enumerators for survey work at various sites being centrally trained at BRRI, Gazipur by project PIs (A) and pathology and socio-economic partners meeting at BRRI, Gazipur to discuss project activities (B)
A
B

100
Appendix 23. Enumerators and project staff carrying out socio-economic (A) and disease surveys (B)
A
B
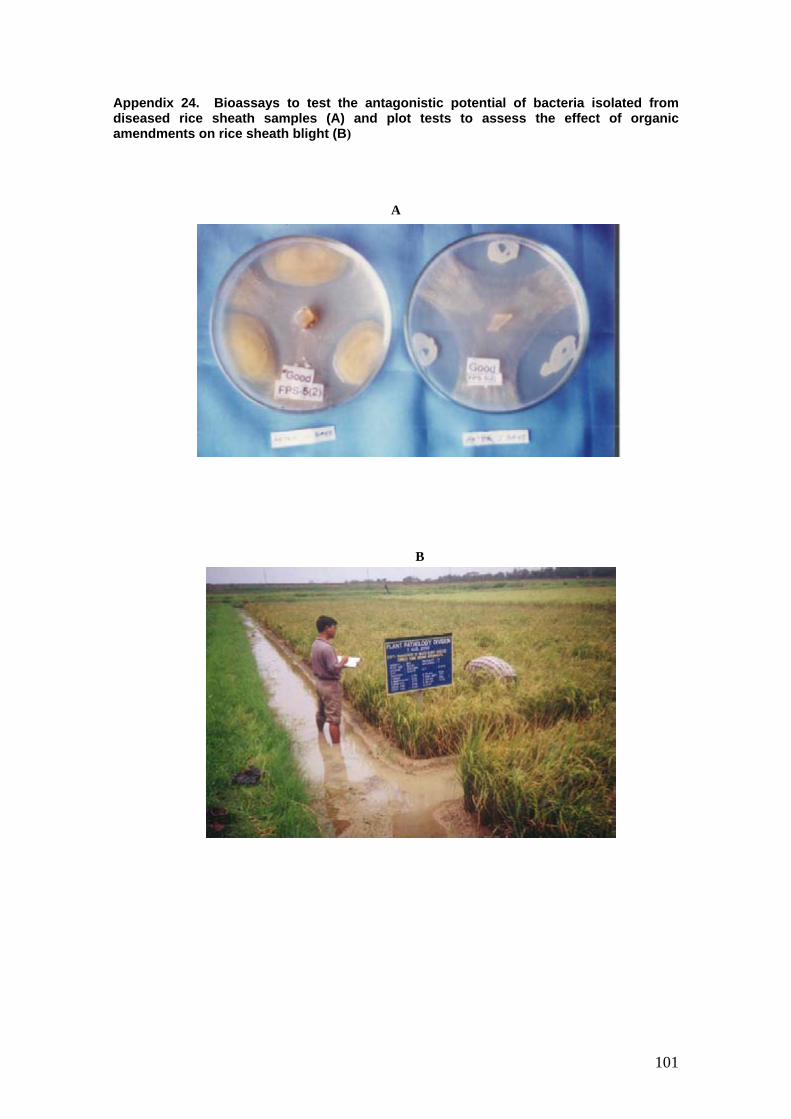
101
Appendix 24. Bioassays to test the antagonistic potential of bacteria isolated from diseased rice sheath samples (A) and plot tests to assess the effect of organic amendments on rice sheath blight (B)
A
B