Crop Outlook - Skymet Weather Services · PDF file• Crop Outlook Kharif ... paddy and...
31
Crop Outlook “Kharif 2017/18”
Transcript of Crop Outlook - Skymet Weather Services · PDF file• Crop Outlook Kharif ... paddy and...

Crop Outlook “Kharif 2017/18”
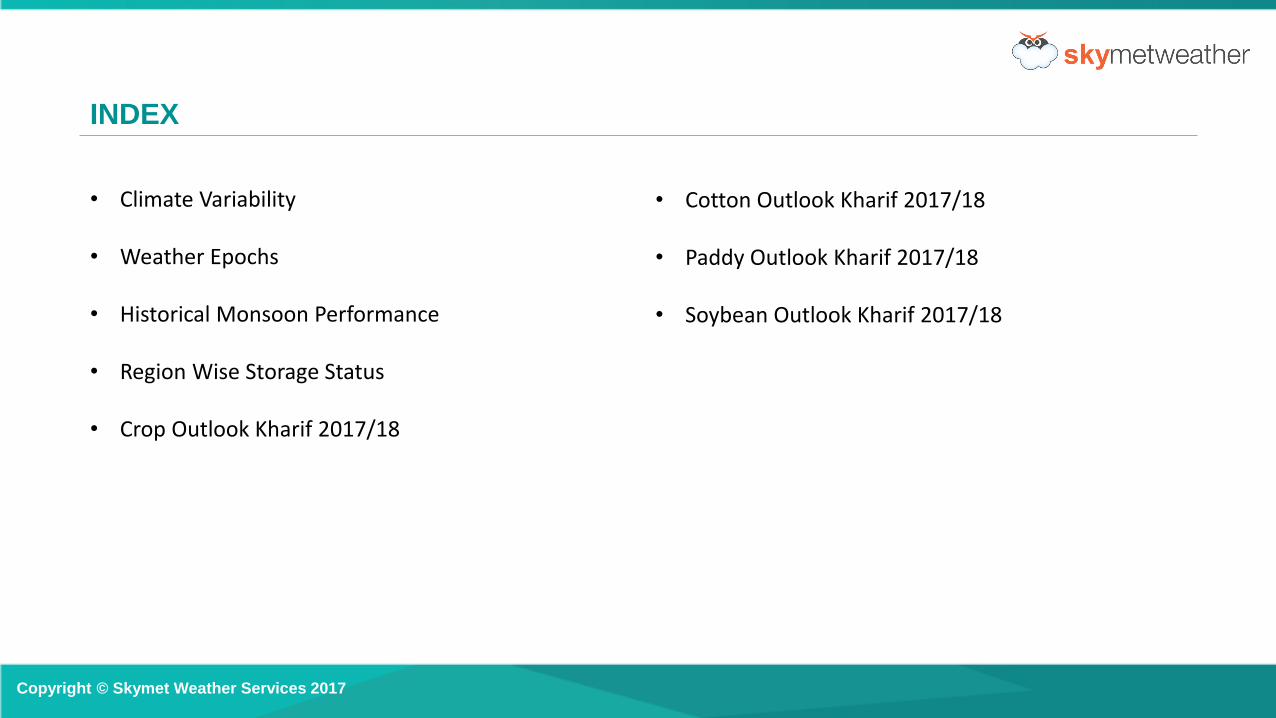
• Climate Variability
• Weather Epochs
• Historical Monsoon Performance
• Region Wise Storage Status
• Crop Outlook Kharif 2017/18
INDEX
• Cotton Outlook Kharif 2017/18
• Paddy Outlook Kharif 2017/18
• Soybean Outlook Kharif 2017/18
Copyright © Skymet Weather Services 2017

Climate Variability
There have been alternate periods extending to 3-4 decades with less and more frequent weak monsoons over India.
✓ In last 146 years (1871 – 2016)
✓ 19 were major flood years
✓ Drought occurred in 26 years
Image courtesy: tropmet.res.in
Copyright © Skymet Weather Services 2017

Weather EPOCHS in India
We are in drought epoch
Copyright © Skymet Weather Services 2017
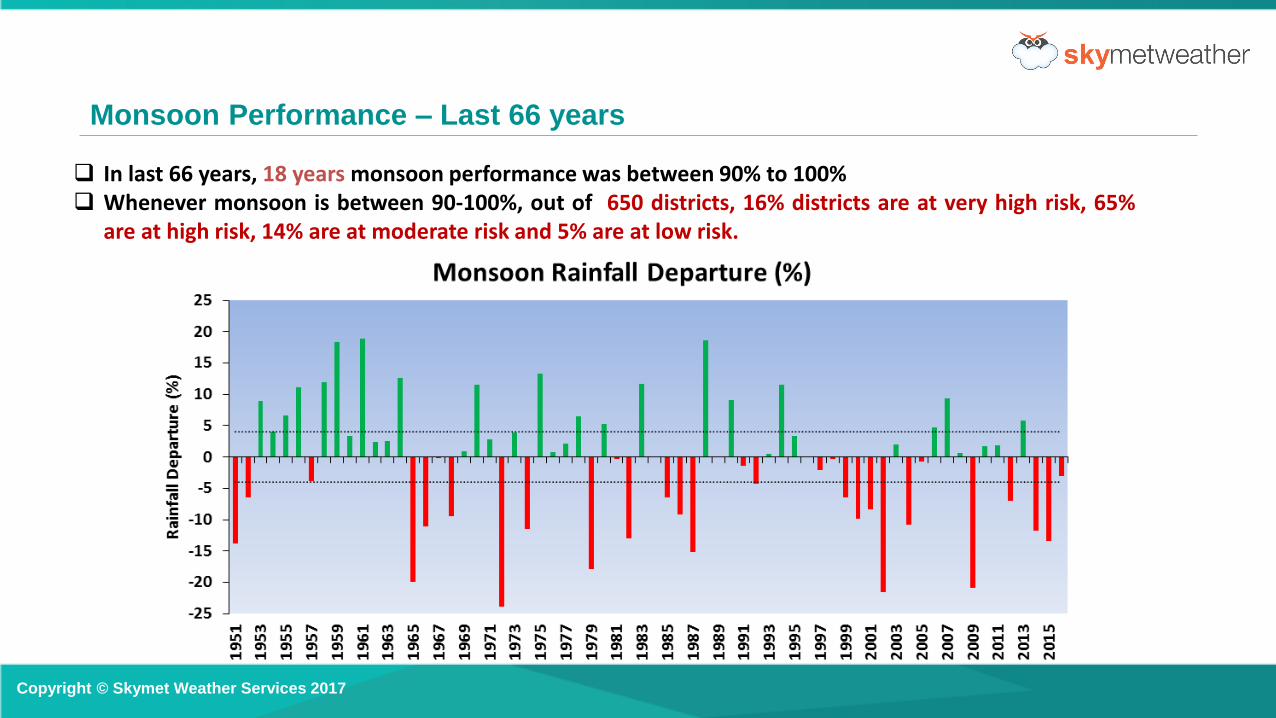
Monsoon Performance – Last 66 years
Copyright © Skymet Weather Services 2017
In last 66 years, 18 years monsoon performance was between 90% to 100% Whenever monsoon is between 90-100%, out of 650 districts, 16% districts are at very high risk, 65%
are at high risk, 14% are at moderate risk and 5% are at low risk.

Drought Possibility When Monsoon is between 90-100%
Possibility of drought in key states is around 50% (for Kharif).
61% districts of Gujarat has more than 50% possibility of drought.
Copyright © Skymet Weather Services 2017

Key Findings
Gujarat: Ahmedabad, Anand, Banaskantha, Bharuch, Bhavnagar, Botad, Gandhinagar, Jamnagar, Junagarh, Kachchh, Kheda,
Mahesana, Marvi, Narmada, Porbandar, Rajkot, Surat, Surendra nagar, Tapi and Vadodara has more than 60% chances of deficient
rainfall.
Haryana: Fatehabad, Hisar, Jind and Kaithal has more than 50% chances of being deficient
Karnataka: Chikballapur, Gadag and Tumkur has 50% chances of being deficient
Madhya Pradesh: Barwani and Khargaone has 50% chances of being deficient
Punjab: Barnala, Bhatinda and Mansa has more than 50% chances of being deficient
Rajasthan: Bikaner, Churu, Ganganagar, Jalore and Sirohi has 50% chances of being deficient
Copyright © Skymet Weather Services 2017

Dam Water Level Status
This year, currently Dam Waterstatus is better than the last yearas well as from the normalstorage.
Copyright © Skymet Weather Services 2017
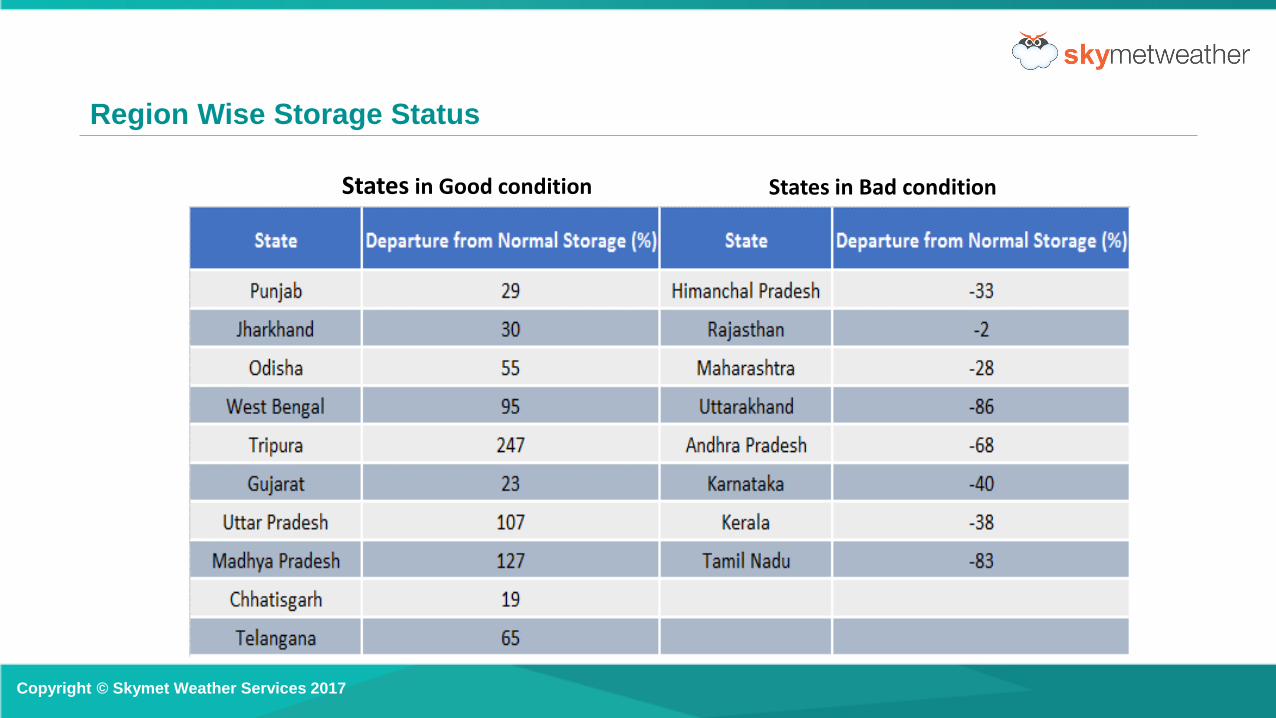
Region Wise Storage Status
States in Good condition States in Bad condition
Copyright © Skymet Weather Services 2017

Standardized Precipitation Index (SPI)
• Common index used to know severity of drought is Standardized Precipitation Index (SPI).
• Generally, SPI varies between +3 to -3. Positive values of SPI suggests flood and negative drought.
• 3-6 month SPI is used to asses agricultural drought while 9 and 12 monthly SPI is used to asses
hydrological (ground water/dam water) drought.
In both sub-divisions for 9-monthly
and 12-monthly SPI, if normal or 5%
more than normal or 10% more
than normal rainfall occurred from
May-2017 to Dec-2017 than also
hydrological drought won’t be fulfil.
Copyright © Skymet Weather Services 2017
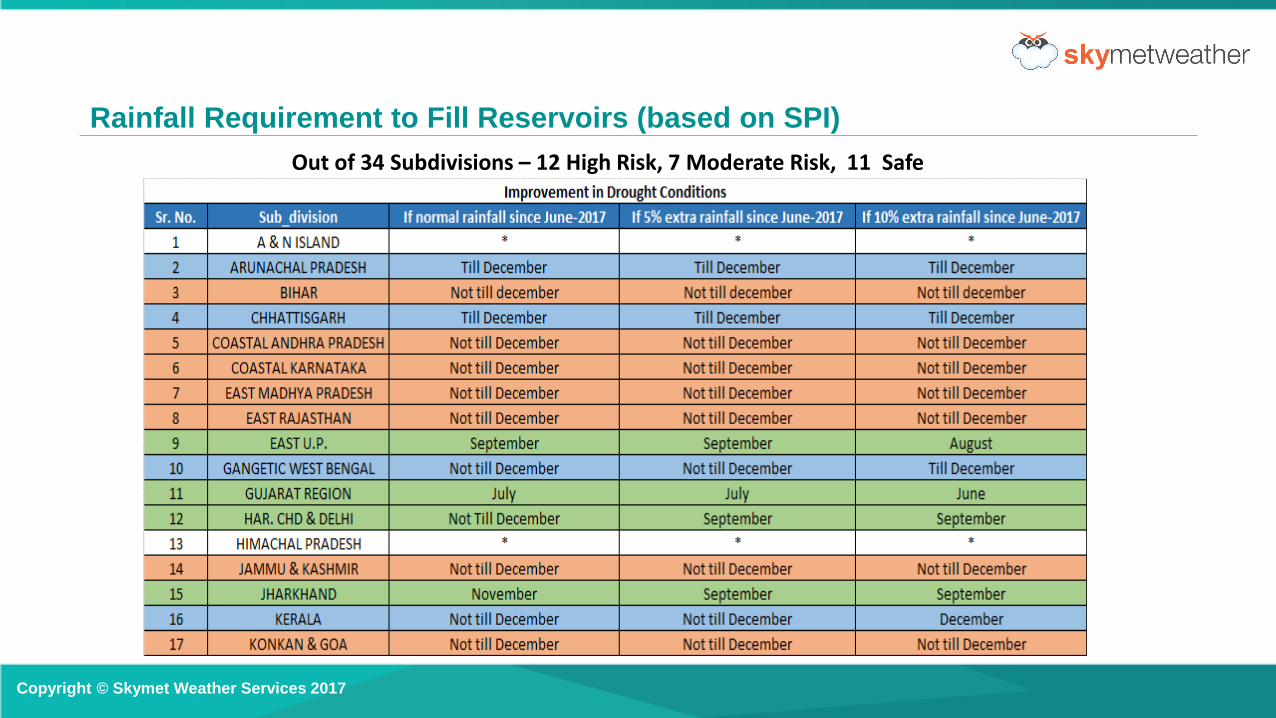
Rainfall Requirement to Fill Reservoirs (based on SPI)
Out of 34 Subdivisions – 12 High Risk, 7 Moderate Risk, 11 Safe
Copyright © Skymet Weather Services 2017

Rainfall Requirement to fill Reservoirs (based on SPI)
Out of 34 Subdivisions – 12 High Risk, 7 Moderate Risk, 11 Safe
▪ “*” denotes that backlog hasbeen already filled.
▪ Month name shows thatrequired normal precipitationhas been started from thatmonth i.e. value of SPI is morethan 0.5.
▪ Not till December shows thatbacklog will not be filled tillDecember 2017.
Copyright © Skymet Weather Services 2017

Crop Outlook
“Kharif 2017/18”
Copyright © Skymet Weather Services 2017

Monsoon Spatial Distribution – June through September
Rainfall Departure: -5%
• Below normal rainfall is
expected over peninsular
India, Maharashtra,
Gujarat, parts of Madhya
Pradesh and Haryana.
• Odisha, Jharkhand and
West Bengal might get
good rainfall
Copyright © Skymet Weather Services 2017

Monsoon Spatial Distribution – June
Rainfall Departure: 2%
• Normal rainfall is expected
Prediction of 70% normalmonsoon in June will improvethe sowing activity. Hence nomajor reduction in area couldbe expected. Overalldifference in acreage underany crop would be in thelimits of 5-10%.
Copyright © Skymet Weather Services 2017
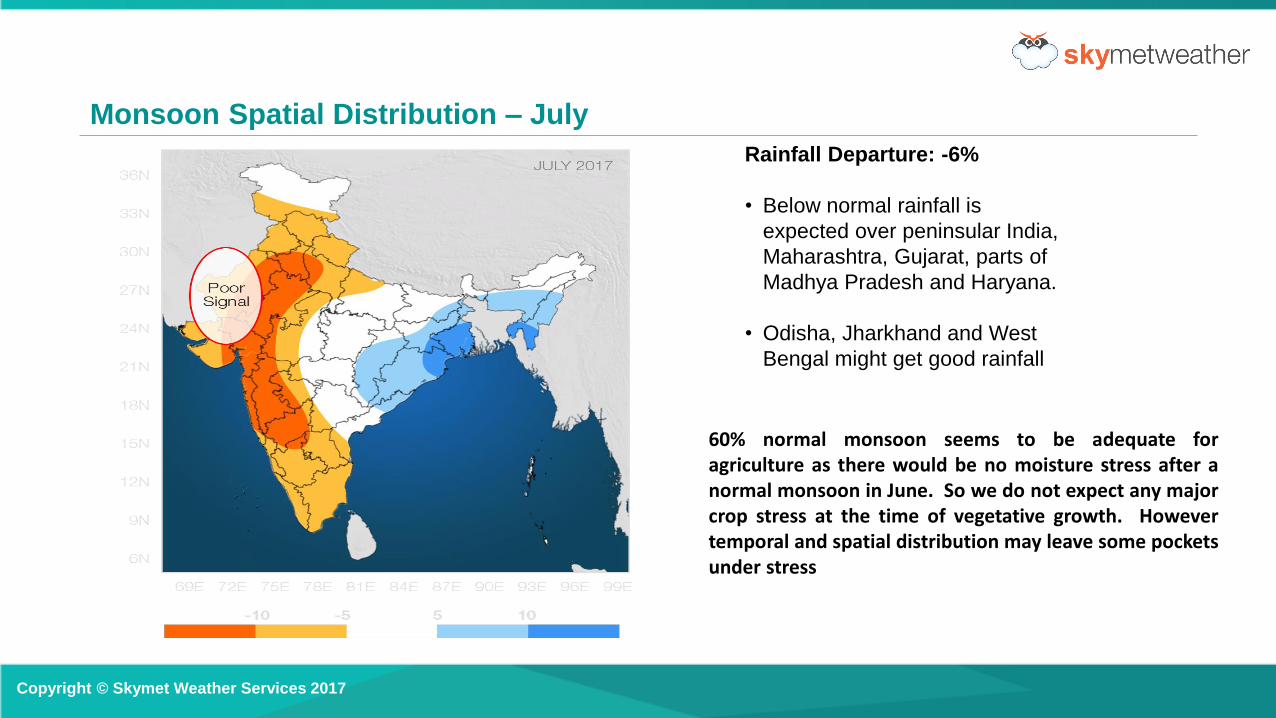
Monsoon Spatial Distribution – July
Rainfall Departure: -6%
• Below normal rainfall is
expected over peninsular India,
Maharashtra, Gujarat, parts of
Madhya Pradesh and Haryana.
• Odisha, Jharkhand and West
Bengal might get good rainfall
60% normal monsoon seems to be adequate foragriculture as there would be no moisture stress after anormal monsoon in June. So we do not expect any majorcrop stress at the time of vegetative growth. Howevertemporal and spatial distribution may leave some pocketsunder stress
Copyright © Skymet Weather Services 2017
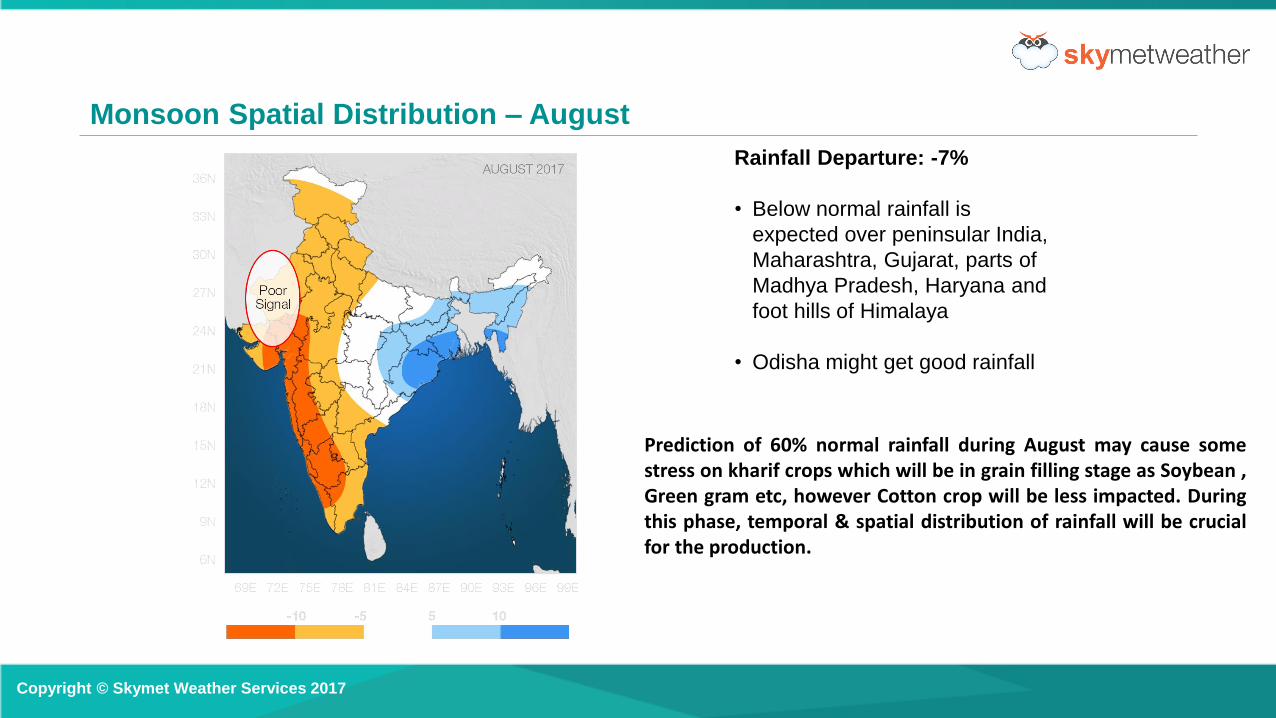
Monsoon Spatial Distribution – August
Rainfall Departure: -7%
• Below normal rainfall is
expected over peninsular India,
Maharashtra, Gujarat, parts of
Madhya Pradesh, Haryana and
foot hills of Himalaya
• Odisha might get good rainfall
Prediction of 60% normal rainfall during August may cause somestress on kharif crops which will be in grain filling stage as Soybean ,Green gram etc, however Cotton crop will be less impacted. Duringthis phase, temporal & spatial distribution of rainfall will be crucialfor the production.
Copyright © Skymet Weather Services 2017
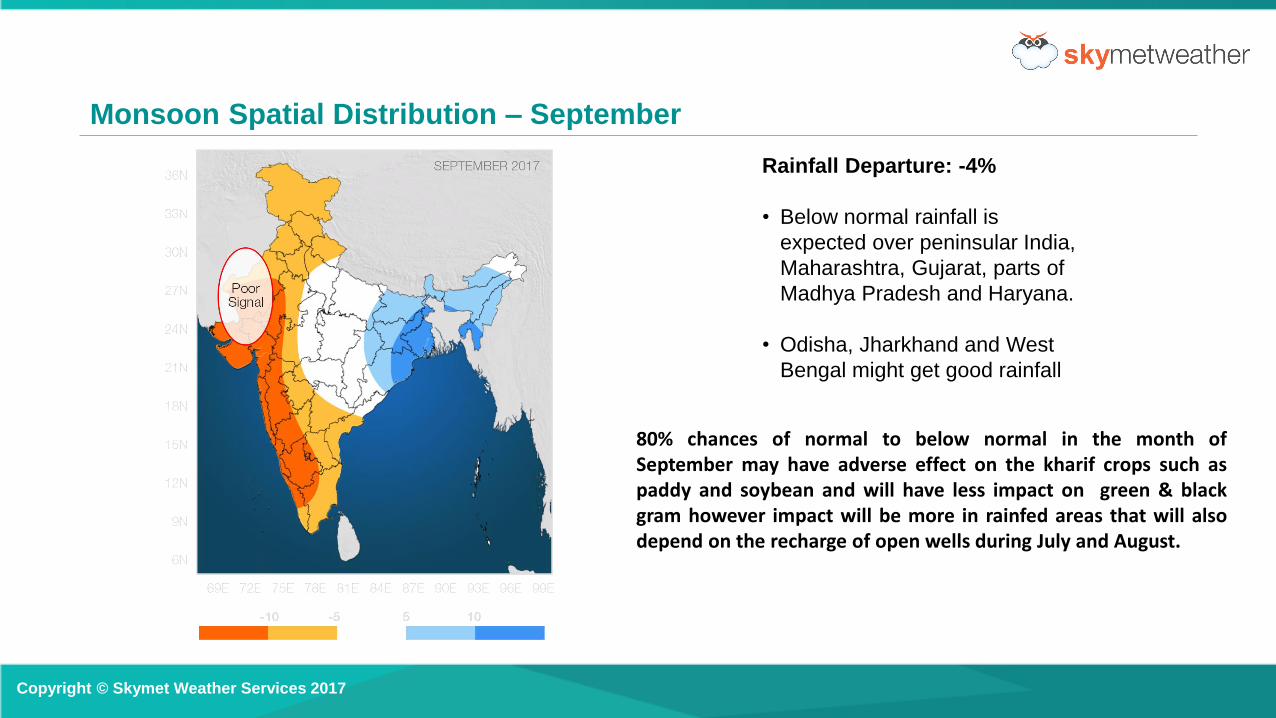
Monsoon Spatial Distribution – September
Rainfall Departure: -4%
• Below normal rainfall is
expected over peninsular India,
Maharashtra, Gujarat, parts of
Madhya Pradesh and Haryana.
• Odisha, Jharkhand and West
Bengal might get good rainfall
80% chances of normal to below normal in the month ofSeptember may have adverse effect on the kharif crops such aspaddy and soybean and will have less impact on green & blackgram however impact will be more in rainfed areas that will alsodepend on the recharge of open wells during July and August.
Copyright © Skymet Weather Services 2017

Cotton Outlook
“Kharif 2017/18”
Copyright © Skymet Weather Services 2017
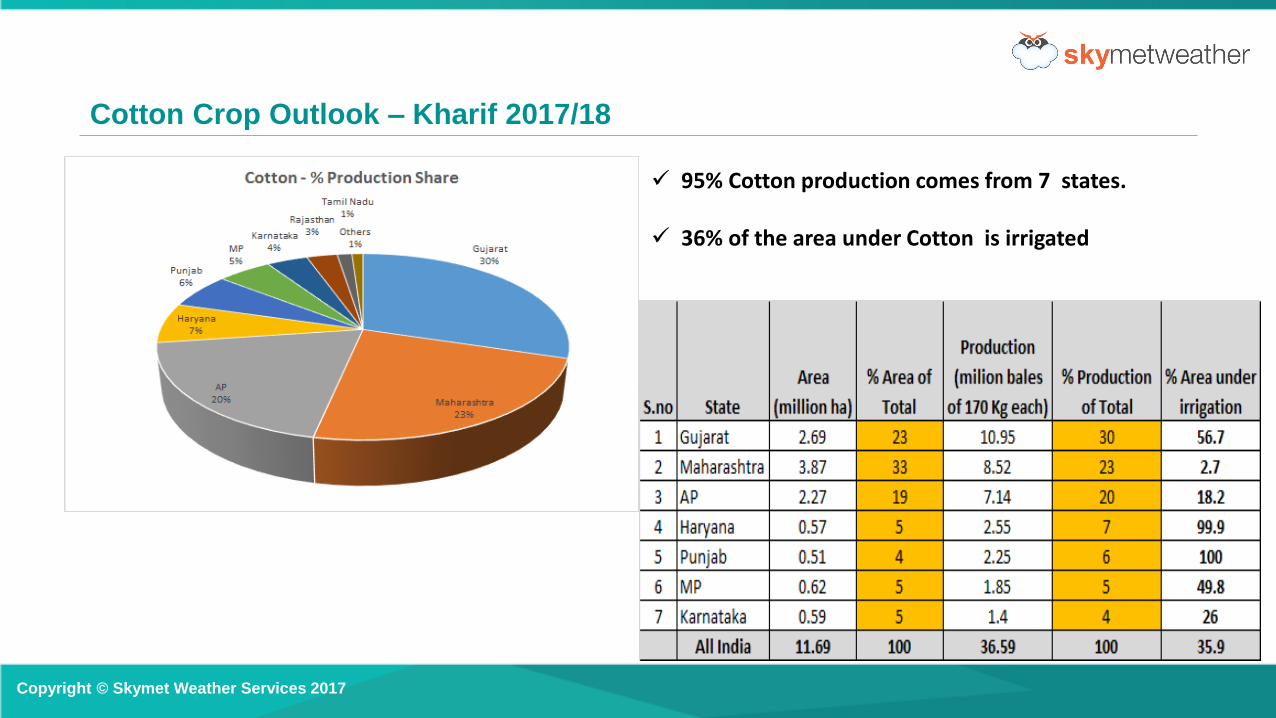
Cotton Crop Outlook – Kharif 2017/18
✓ 95% Cotton production comes from 7 states.
✓ 36% of the area under Cotton is irrigated
Copyright © Skymet Weather Services 2017
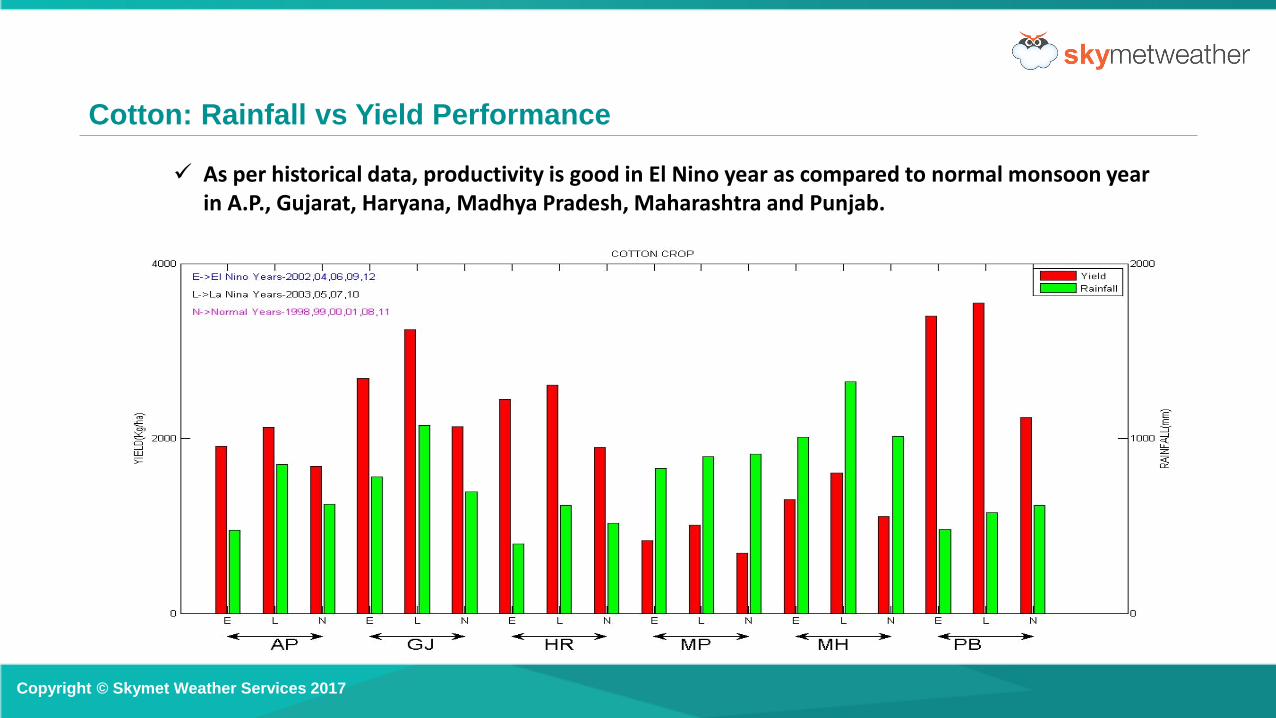
Cotton: Rainfall vs Yield Performance
✓ As per historical data, productivity is good in El Nino year as compared to normal monsoon year in A.P., Gujarat, Haryana, Madhya Pradesh, Maharashtra and Punjab.
Copyright © Skymet Weather Services 2017

Outlook for Kharif 2017/18 – Cotton Production
✓ 36% of the total area under Cotton cultivation is irrigated and this year reservoirs status are slightly better than the last year except
Andhra Pradesh and Karnataka.
✓ Looking at the monsoon conditions and domestic cotton prices, it is expected that acreage will recover by 8-10% over last year.
✓ Last year acreage of 102.79 lakh hectares is expected to increase by 10-12 lakh hectares in 2017.
✓ Looking at the historical correlation between rainfall and yield, it is expected that this year, yield will be slightly less in Punjab and Madhya
Pradesh.
✓ Yields are expected to be normal to slightly better in Gujarat and Maharashtra.
✓ As per our estimates and looking at present conditions, cotton production is estimated to be around 35 to 36.50 lakh bales.
Note –These estimates are based on current monsoon conditions and estimates may change based on temporal and spatial distribution ofrains.
Copyright © Skymet Weather Services 2017

Paddy Outlook
“Kharif 2017/18”
Copyright © Skymet Weather Services 2017
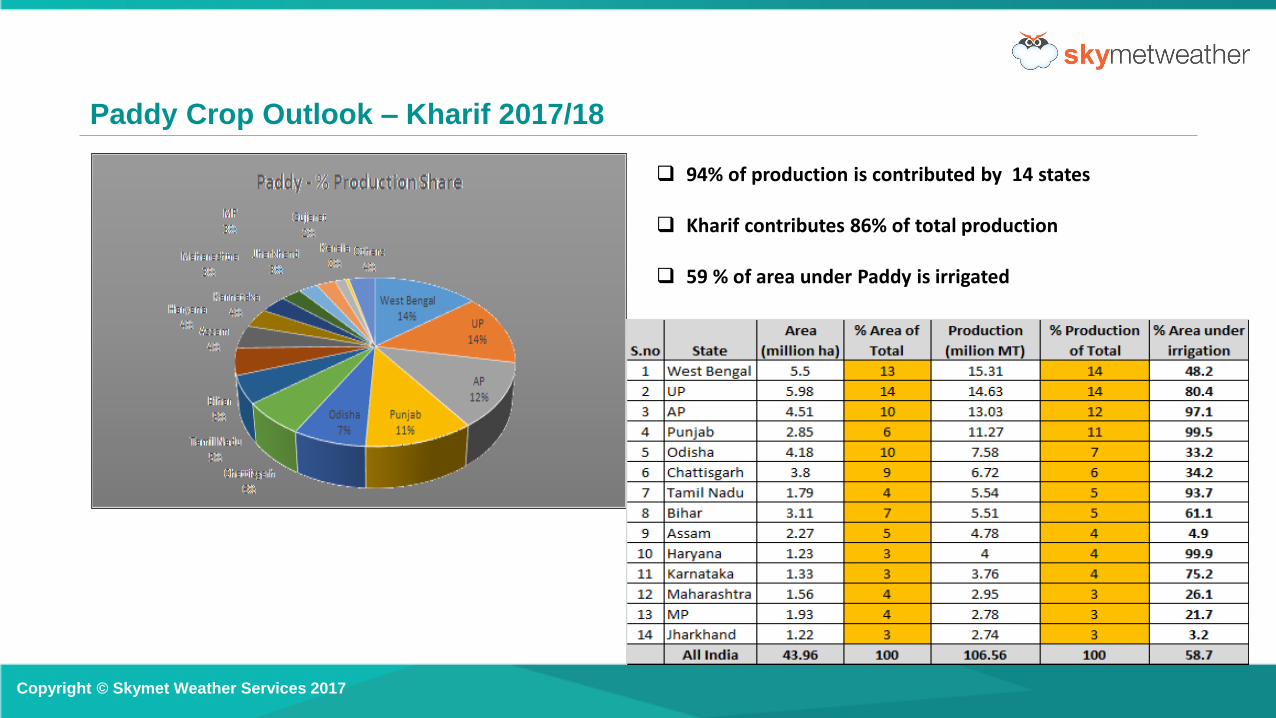
Paddy Crop Outlook – Kharif 2017/18
94% of production is contributed by 14 states
Kharif contributes 86% of total production
59 % of area under Paddy is irrigated
Copyright © Skymet Weather Services 2017
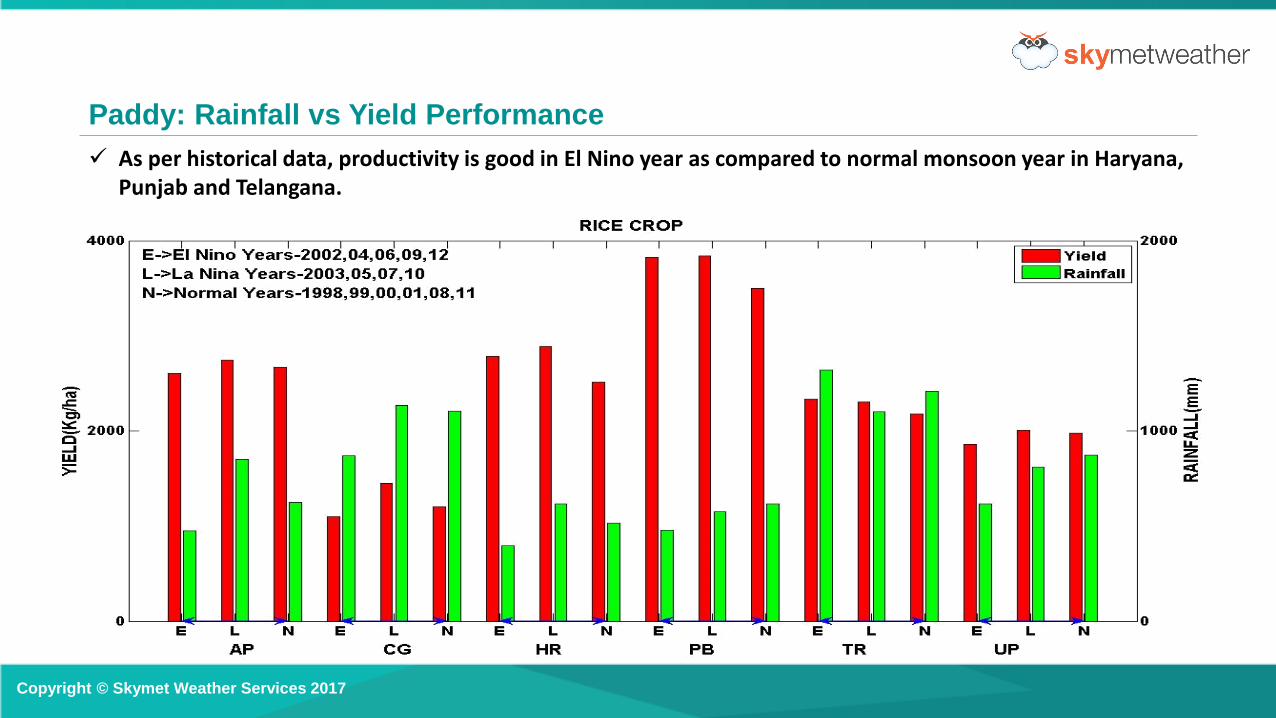
Paddy: Rainfall vs Yield Performance
✓ As per historical data, productivity is good in El Nino year as compared to normal monsoon year in Haryana, Punjab and Telangana.
Copyright © Skymet Weather Services 2017
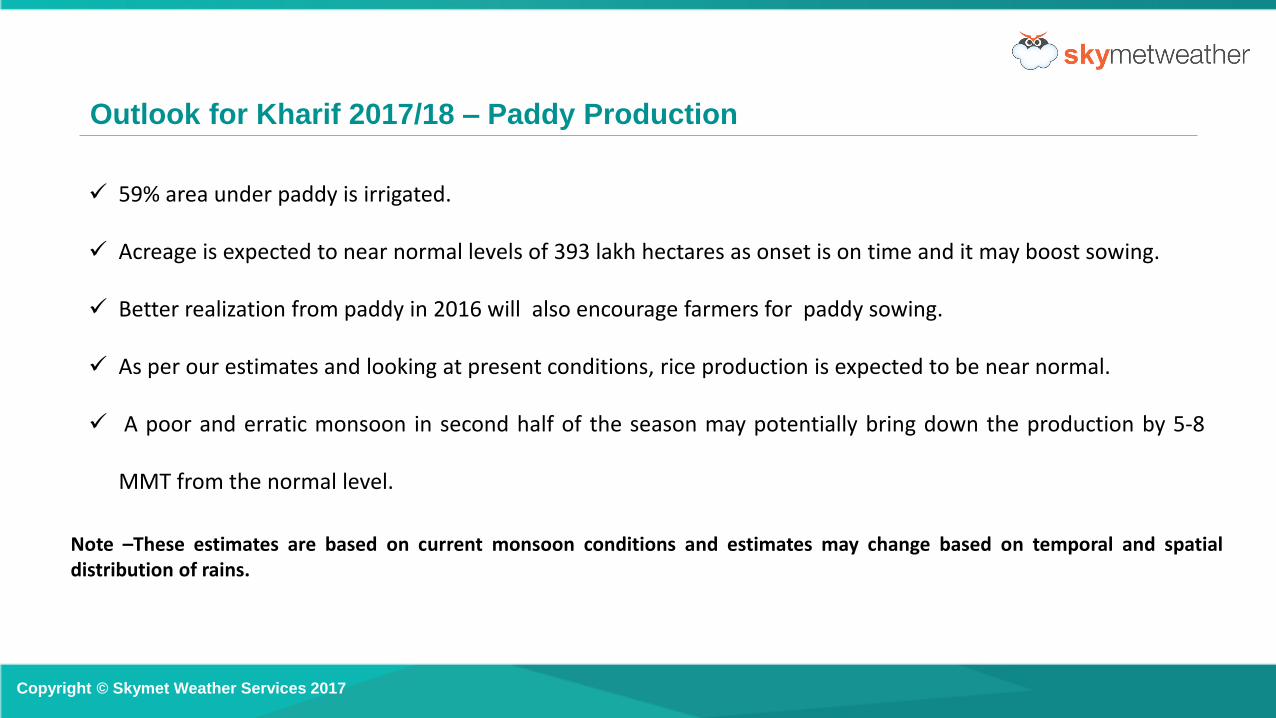
Outlook for Kharif 2017/18 – Paddy Production
✓ 59% area under paddy is irrigated.
✓ Acreage is expected to near normal levels of 393 lakh hectares as onset is on time and it may boost sowing.
✓ Better realization from paddy in 2016 will also encourage farmers for paddy sowing.
✓ As per our estimates and looking at present conditions, rice production is expected to be near normal.
✓ A poor and erratic monsoon in second half of the season may potentially bring down the production by 5-8
MMT from the normal level.
Note –These estimates are based on current monsoon conditions and estimates may change based on temporal and spatialdistribution of rains.
Copyright © Skymet Weather Services 2017

Soybean Outlook
“Kharif 2017/18”
Copyright © Skymet Weather Services 2017
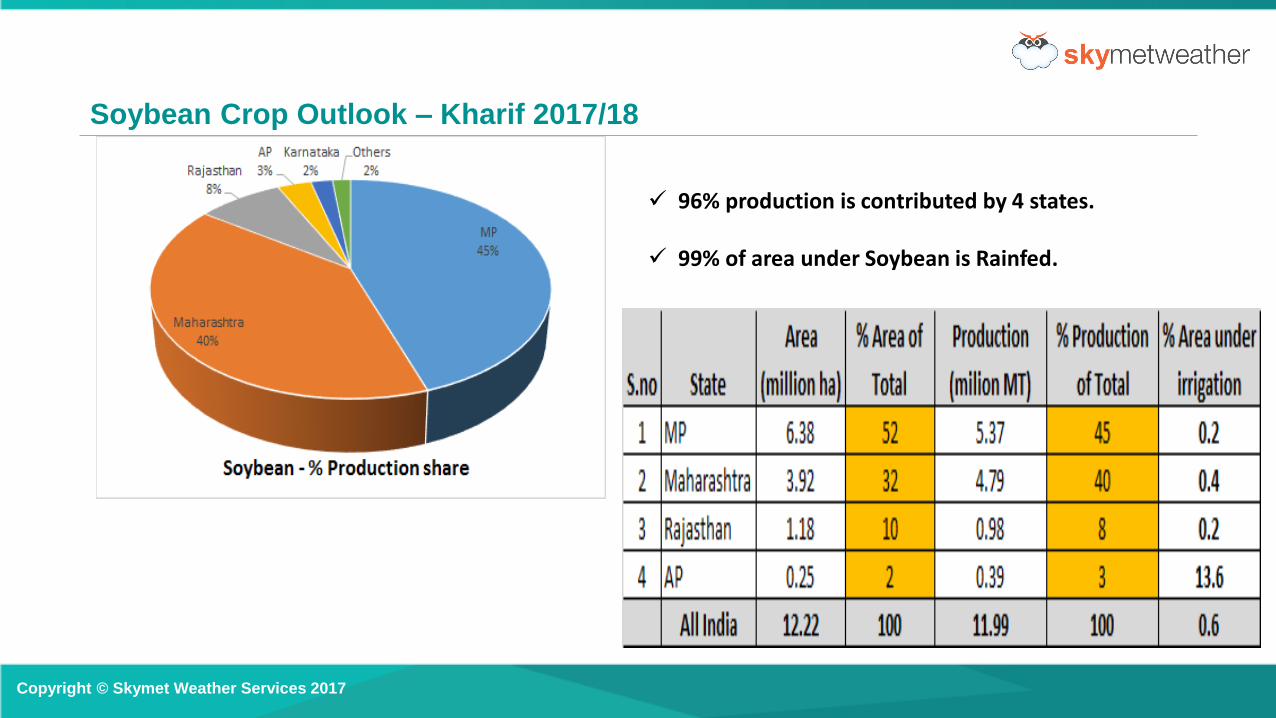
Soybean Crop Outlook – Kharif 2017/18
✓ 96% production is contributed by 4 states.
✓ 99% of area under Soybean is Rainfed.
Copyright © Skymet Weather Services 2017
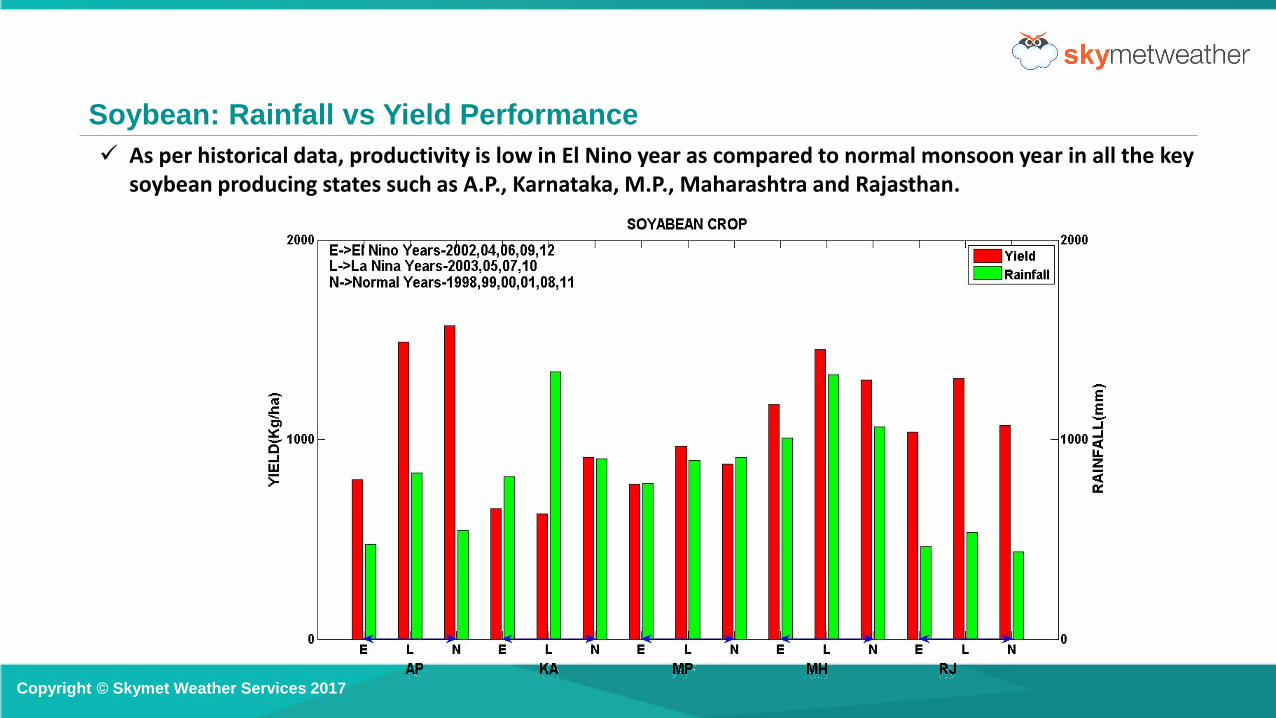
Soybean: Rainfall vs Yield Performance
✓ As per historical data, productivity is low in El Nino year as compared to normal monsoon year in all the key soybean producing states such as A.P., Karnataka, M.P., Maharashtra and Rajasthan.
Copyright © Skymet Weather Services 2017

Outlook for Kharif 2017/18 – Soybean Production
✓ 99% area under Soybean is rainfed.
✓ Sowing is expected to be on time due to timely onset of Monsoon.
✓ Some dip in acreage by 3-4% over last year may be seen as farmers are opting cotton and pulses over soybean
total acreage may stand somewhere round 110 to 112 lakh hectares.
✓ Soybean yield is linearly related to the distribution of rainfall, with prediction of low rains during second half of
monsoon (during grain filling stage) may have adverse impact on soybean crop.
✓ As per our estimates and looking at current weather conditions, Production is expected to be around 106 to 107
lakh tonnes.
Copyright © Skymet Weather Services 2017

THANKS
For further info pl contact
Copyright © Skymet Weather Services 2017
Disclaimer: The information contained in the report has been compiled from sources believed to be reliable. Company does not
w arrant it accuracy, completeness and correctness. This report is not, and should not be construed as, an offer to sell or a
solicitation to buy any commodities. This document may not be reproduced, distributed or published, in w hole or in part, by any
recipient hereof for any purpose without prior permission from the Company. Skymet Weather Services Pvt. Ltd., its directors,
employees and associates may or may not have trading or investment position in the commodities mentioned herein