Crop losses due to diseases and their implications for...
22
See discussions, stats, and author profiles for this publication at: https://www.researchgate.net/publication/257788783 Crop losses due to diseases and their implications for global food production losses and food security Article in Food Security · December 2012 DOI: 10.1007/s12571-012-0200-5 CITATIONS 34 READS 6,979 4 authors, including: Andrea Ficke Bioforsk 19 PUBLICATIONS 877 CITATIONS SEE PROFILE Jean-Noël Aubertot French National Institute for Agricultural Res… 51 PUBLICATIONS 689 CITATIONS SEE PROFILE Clayton Hollier Louisiana State University 15 PUBLICATIONS 310 CITATIONS SEE PROFILE All content following this page was uploaded by Clayton Hollier on 04 March 2015. The user has requested enhancement of the downloaded file. All in-text references underlined in blue are added to the original document and are linked to publications on ResearchGate, letting you access and read them immediately.
-
Upload
trinhkhanh -
Category
Documents
-
view
223 -
download
3
Transcript of Crop losses due to diseases and their implications for...
Seediscussions,stats,andauthorprofilesforthispublicationat:https://www.researchgate.net/publication/257788783
Croplossesduetodiseasesandtheirimplicationsforglobalfoodproductionlossesandfoodsecurity
ArticleinFoodSecurity·December2012
DOI:10.1007/s12571-012-0200-5
CITATIONS
34
READS
6,979
4authors,including:
AndreaFicke
Bioforsk
19PUBLICATIONS877CITATIONS
SEEPROFILE
Jean-NoëlAubertot
FrenchNationalInstituteforAgriculturalRes…
51PUBLICATIONS689CITATIONS
SEEPROFILE
ClaytonHollier
LouisianaStateUniversity
15PUBLICATIONS310CITATIONS
SEEPROFILE
AllcontentfollowingthispagewasuploadedbyClaytonHollieron04March2015.
Theuserhasrequestedenhancementofthedownloadedfile.Allin-textreferencesunderlinedinblueareaddedtotheoriginaldocumentandarelinkedtopublicationsonResearchGate,lettingyouaccessandreadthemimmediately.

1 23
Food SecurityThe Science, Sociology and Economicsof Food Production and Access to Food ISSN 1876-4517 Food Sec.DOI 10.1007/s12571-012-0200-5
Crop losses due to diseases and theirimplications for global food productionlosses and food security
Serge Savary, Andrea Ficke, Jean-NoëlAubertot & Clayton Hollier

1 23
Your article is protected by copyright and
all rights are held exclusively by Springer
Science + Business Media B.V. & International
Society for Plant Pathology. This e-offprint is
for personal use only and shall not be self-
archived in electronic repositories. If you
wish to self-archive your work, please use the
accepted author’s version for posting to your
own website or your institution’s repository.
You may further deposit the accepted author’s
version on a funder’s repository at a funder’s
request, provided it is not made publicly
available until 12 months after publication.

EDITORIAL
Crop losses due to diseases and their implications for globalfood production losses and food security
Serge Savary & Andrea Ficke & Jean-Noël Aubertot &Clayton Hollier
Received: 29 January 2012 /Accepted: 1 June 2012# Springer Science+Business Media B.V. & International Society for Plant Pathology 2012
Introduction
The status of global food security, i.e., the balance be-tween the growing food demand of the world populationand global agricultural output, combined with discrepan-cies between supply and demand at the regional, nation-al, and local scales (Smil 2000; UN Department ofEconomic and Social Affairs 2011; Ingram 2011), isalarming. This imbalance is not new (Dyson 1999) buthas dramatically worsened during the recent decades,culminating recently in the 2008 food crisis. It is impor-tant to note that in mid-2011, food prices were back totheir heights of the middle of the 2008 crisis (FAO2011).
Plant protection in general and the protection of cropsagainst plant diseases in particular, have an obvious role toplay in meeting the growing demand for food quality andquantity (Strange and Scott 2005). Roughly, direct yield lossescaused by pathogens, animals, and weeds, are altogether
responsible for losses ranging between 20 and 40 % of globalagricultural productivity (Teng and Krupa 1980; Teng 1987;Oerke et al. 1994; Oerke 2006). Crop losses due to pests andpathogens are direct, as well as indirect; they have a number offacets, some with short-, and others with long-term conse-quences (Zadoks 1967). The phrase “losses between 20 and40 %” therefore inadequately reflects the true costs of croplosses to consumers, public health, societies, environments,economic fabrics and farmers.
The components of food security include food avail-ability (production, import, reserves), physical and eco-nomic access to food, and food utilisation (e.g., nutritivevalue, safety), as has been recently reviewed by Ingram(2011). Although crop losses caused by plant diseasedirectly affect the first of these components, they alsoaffect others (e.g., the food utilisation component) direct-ly or indirectly through the fabrics of trade, policies andsocieties (Zadoks 2008).
Most of the agricultural research conducted in the 20thcentury focused on increasing crop productivity as the worldpopulation and its food needs grew (Evans 1998; Smil 2000;Nellemann et al. 2009). Plant protection then primarilyfocused on protecting crops from yield losses due to biolog-ical and non-biological causes. The problem remains aschallenging today as in the 20th century, with additionalcomplexity generated by the reduced room for manoeuvreavailable environmentally, economically, and socially (FAO2011; Brown 2011). This results from shrinking naturalresources that are available to agriculture: these includewater, agricultural land, arable soil, biodiversity, the avail-ability of non-renewable energy, human labour, fertilizers(Smil 2000), and the deployment of some key inputs, suchas high quality seeds and planting material (Evans 1998). Inaddition to yield losses caused by diseases, these new ele-ments of complexity also include post harvest quality lossesand the possible accumulation of toxins during and after the
S. Savary (*) : J.-N. AubertotINRA, UMR1248 AGIR,24 Chemin de Borde Rouge, Auzeville, CS52627,31326 Castanet-Tolosan Cedex, Francee-mail: [email protected]
S. Savary : J.-N. AubertotUniversité Toulouse, INPT, UMR AGIR,31029 Toulouse, France
A. FickeBioforsk – Norwegian Institute for Agriculturaland Environmental Research,Høgskoleveien 7, 1432 Ås, Norway
C. HollierDepartment of Plant Pathology and Crop Physiology,Louisiana State University AgCenter,302 Life Sciences Building,Baton Rouge, LA 70803, USA
Food Sec.DOI 10.1007/s12571-012-0200-5
Author's personal copy

cropping season. While food security is a critical issue in thedeveloping world, food safety has become a dominant con-cern in the developed world; however, the critical impor-tance of food safety is now at last recognized in thedeveloping world as well (e.g., Wild and Gong 2010).
In a pattern similar to the assumption of continued growingcrop productivity (Alston et al. 2009), sustained and reliableassessment of crop losses has been taken for granted fordecades, without novel, specific effort devoted to it.Decision-makers, policy-makers, scientists and farmers alike,have forgotten key concepts of crop loss assessment, leadingto confusion. Confusion leads to fear, fear leads to wrongdecisions, and wrong decisions lead to mis-management, bothin terms of setting priorities (for research, especially), in de-velopment, and in actions at the field level (e.g., Savary 1994;Snapp and Heong 2003). The need to revive the field of croploss assessment through renewed investigation and significantfunding is acute. This would enable the use of new conceptsand methods (e.g., McRoberts et al. 2011) for research prior-itization, as well as identifying the most urgently needed plantprotection efforts in times of economic crises. Crop loss as-sessment is a necessary first step towards the delivery ofmanagement tools that will benefit societies, environments,consumers and farmers most effectively. This review succes-sively addresses a series of concepts pertaining to crop lossassessment, itemizes some methodological components forimplementing these concepts and incorporates them in a sys-tems perspective, which expands far beyond the conventionalobservation - experiment - modelling pathway. We then illus-trate some of these principles with a few examples drawn fromkey world crops, their diseases, as well as other yield-reducingand harvest quality-reducing factors, including pathogen-produced toxins (Wild and Gong 2010). One main purposeof this review is to show that, in order to remain relevant, croploss research, as a full branch of plant science, needs toconsider the farm, political, and social levels. It therefore mustlink with other disciplinary fields that are often foreign to plantpathologists.
Reviews on crop losses caused by diseases commonlystart with examples showing the dramatic and disastrouseffects that plant disease epidemics have had historically.Zadoks (2008) conveys a more complex picture from His-tory. Disastrous epidemics did occur. However, History alsosuggests that epidemics that were downplayed actually hadlong term and massive effects, while the effects of otherplant disease epidemics, sometimes claimed to illustrate theimportance of plant pathology, were confounded with other,quite different and often man-made, causes. Plant protectiontakes place in the complex fabric of societies and theiragricultures (e.g., Ingram 2011). It is thus not surprising thatepidemics, whether long or short, whether seemingly weakor massive, and whether localised or covering wide areas,would translate into quite different outcomes with different
dimensions. History suggests that disease management,aimed at reducing crop losses, must operate within the fabricof human societies if it is to be efficient. It also suggests that,in order to understand, predict and reduce crop losses fromplant diseases, plant pathologists have to learn from othersciences, which address this fabric.
General framework: problem definitionand some methodological aspects
The framework we propose to develop includes three partsover several sections. In the first part, we wish to summarizesome basic concepts pertaining to crop losses and theirmeasurement. The second part deals with the multifacetednature of crop losses, emphasizing hidden consequences, thenature of risks involved and avenues to address them. Thethird part introduces a geographic and crop-based structure,from which a few selected examples are drawn to illustratethe consequences of crop losses caused by diseases globally.
Injuries, crop loss, economic loss and uncertainty
Epidemics may lead to disease injuries, which may lead tocrop loss (damage) which, in turn, may lead to economicloss (Fig. 1; Zadoks and Schein 1979; Zadoks 1985). Theserelationships are neither linear (Large 1966; James 1974;Madden 1983; Teng 1987; Campbell and Madden 1990;Madden et al. 2000; Savary et al. 2006a; Madden et al.2007) nor are they automatic: epidemics do not always leadto measurable injuries, neither do injuries necessarily lead tomeasurable crop losses, nor do crop losses necessarily leadto measurable economic losses (Zadoks 1985; Rabbinge etal. 1989). In particular, one may refer to damage (or croploss) functions when speaking of relationship between inju-ry and crop losses, and to loss (or economic loss) functionswhen referring to the link between crop losses and economicloss (Zadoks 1985; Teng 1987). While damage functions areprimarily dependent on damage mechanisms caused by dis-eases (and more generally harmful agents), (economic) lossfunctions (Zadoks 1985) are primarily dependent (Savary etal. 2006a) on production situations, including the attainablecrop yield, the objectives of agricultural production, marketvariation and, more generally, the socio-economic contextwhere production is taking place (Rabbinge 1982). The non-linearity of injury-damage (yield loss) relationships was forinstance examined in detail by Madden et al. (2000) in thecase of systemic (e.g., viral) diseases, with the compoundingcomplexity elements of heterogeneous injury distribution ina crop stand and variable timing of epidemic onset. It is thevery non-linearity of these relationships that renders decision-making in plant protection so difficult, because producers arefaced with a “grey area”where uncertainty lies (Zadoks 1989).
S. Savary et al.
Author's personal copy

General principles, derived from injury-damage and crop loss-economic loss relationships however exist. The very purposeof sustainable disease management (and of plant protection ingeneral) lies in reducing the size of this grey area using theseprinciples.
Types of plant protection decisions
Strategic decisions (Fig. 1) are made before crop establish-ment (Zadoks 1985). Such decisions include short-termones (e.g., the choice of a resistant cultivar against a disease)but also decisions that do not directly pertain to diseasemanagement and yet have numerous crop health consequen-ces (e.g., choices of the type of crop establishment, croprotation, or cropping system; Palti 1981). Strategic decisionsalso include whether or not to engage in a breeding programto introduce, enhance or improve resistance to disease,including the judicious deployment of plants with differentresistances over time and space at local, national, or inter-national scales. This last example represents a long-termstrategic decision with consequences that may be seen, atbest, 10 years later in annual crops (e.g., Savary et al. 2006a;Alston et al. 2009). Because of the R & D costs they entail,such decisions must be borne from hard evidence, whichonly careful assessment of crop loss analyses can provide.
Tactical decisions (Fig. 1) are made in the course of agiven cropping season. Because they reflect prior decisionsmade upstream in a crop production system, tactical deci-sions entail many fewer degrees of freedom than strategicones. A typical tactical decision at the field scale in plantprotections is to spray or not to spray with a biocide.EPIPRE (Zadoks 1989), a decision system for multipledisease and pest management in winter wheat for WesternEurope, partitioned such a decision into three options: spray,do not spray, or wait and see, generating one additional,useful, yet implied, degree of freedom, which farmers coulduse. Many other tactical decisions dealing with crop man-agement, (e.g., fertilizer topdressing or irrigation) also havemajor consequences on crop health (Palti 1981).
Yield levels and the FAO definition of yield loss
The concepts of potential (theoretical), attainable (uninjured)and actual yields provide yardsticks to measure yield gaps andassess potential progress (Zadoks 1967; 1985; Rabbinge et al.1989; Chiarappa 1971; 1981). The potential yield (Yp) of acrop is determined by the genetic make-up of cultivatedplants, current temperature regimes, and radiation; Yp isachieved without any limitation of nutrients and water at anydevelopment stage, and without any injury caused by patho-gens, animals, or weeds. The attainable yield (Ya) depends onthe former factors, overlaid by an array of yield-limitingfactors that are inherent in a given production situation: e.g.shortage of water and nutrients at some development stages,as well as excesses of water and mineral compounds, whichmay cause toxicities. The actual yield (Y) is the yield actuallyharvested: it encompasses the yield-defining factors, the yield-limiting factors, and incorporates the yield-reducing effects ofinjuries caused by harmful organisms.
Such a categorization implies simplifications. Some dis-eases strongly depend on the levels of some yield-limitingfactors (or their alleviation). For instance, brown spot of rice,caused by the fungus Cochliobolus myabeanus, is dependenton the occurrence of drought (Chakrabarti 2001), or yieldlosses caused by Septoria diseases of wheat depend on crop-ping practices, especially fertilizer inputs (Leath et al. 1993).The underlying mechanisms of such relationships are com-plex (Zadoks and Schein 1979; Rabbinge et al. 1989) andinvolve, for instance, the predisposition of plants to infection(Schoeneweiss 1975), reflecting their physiological status(and thus, yield-limiting factors), or the indirect effects ofyield-limiting factors on pathogen cycles (e.g., via microcli-matic conditions). Yet, if used with due understanding of theirunderlying hypotheses, the typology of potential, attainable,and actual yields has provided a solid framework for an arrayof scientific advances and applications (e.g., Parlevliet 1981;Rabbinge et al. 1989; Rossing 1991a; b; Savary and Zadoks1992; Teng and Savary 1992; Teng et al. 1993). The FAOdefinition of yield loss is the difference between the attainable
Epidemic
Injuries
Crop loss
Economic loss
Strategic decisions
Tactical decisions
KnowledgeAttitude
KnowledgeAttitudePerceptions
Fig. 1 A simplified diagram ofthe relationships betweenepidemics, injuries, crop lossesand economic losses, and theirlinkages with strategicdecisions and knowledge,attitudes, and perceptions
Crop losses due to diseases
Author's personal copy

and actual yield levels: Ya-Y (Chiarappa 1981). A fraction ofthis gap may be filled using available methods, up to the pointof reaching an economic optimum, the ‘economic’ yield level(Ye), lying between Y and Ya. Ye represents the target ofoptimized disease (pest) management, from a yield point ofview. The remainder of the gap, Ya-Ye corresponds to plantprotection efforts that would today be uneconomical. From acrop yield perspective, Ya-Ye represents the progress thatremains to be made in improving pest control (Chiarappa1981). The definition of what should be an ‘economic’ yield,however, is a critical question that lies beyond the scope ofthis article, but represents an area of important multidisciplin-ary research with social and environmental dimensions (e.g.,UNEP 2007, Chap. 9).
Damage mechanisms
Numerous studies have addressed the physiology of the dis-eased plant and canopy, (e.g., Livne and Daly 1966; Van derWal 1975; Magyarosy et al. 1976; Mitchell 1979; Ayres 1981;Mendgen 1981; Rabbinge et al. 1985; Rossing 1991a;Wu andHanlin 1992; Silva et al. 1998; Bassanezi et al. 2001a; b; deJesus Junior et al. 2001; Lopes and Berger 2001), enabling thedefinition of a series of damage mechanisms (Rabbinge andVereyken 1980; Rabbinge and Rijsdijk 1981; Boote et al.1983): (1) stand reducers; (2) photosynthetic rate reducers;(3) leaf senescence accelerators; (4) light stealers; (5) assimi-late sappers; (6) tissue consumers; and (7) turgor reducers.This array of damage mechanisms may be seen as universaland applicable to any harmful organism as shown by a seriesof studies (e.g., Gomes Carneiro et al. 2000; Johnson et al.1986; Johnson et al. 1987; Savary and Zadoks 1992). Collec-tively, these mechanisms amount to a reduction of radiationinterception or to a reduction of radiation use efficiency bygrowing crop canopies (Waggoner and Berger 1987; Johnson1987). As a result these mechanisms represent a basis for croploss simulation modelling concepts (e.g., Teng and Gaunt1980; Loomis and Adams 1983; Pace and Mackenzie 1987;Rouse 1988) and studies (e.g., Teng et al. 1977; Johnson andTeng 1990; Rossing 1991a; b; Johnson 1992; Pinnschmidt etal. 1995; Willocquet et al. 2000; 2002; 2004).
These models elucidate a number of factors, including theranking of harmful organisms in their yield-reducing effectsover a range of production situations, the effects of new cropcharacteristics on vulnerability to damage, and the linkageof multiple pest models to injury profile predictors (based,e.g., on cropping practices), The elucidation of these factorsallow the design of crop management systems that are lessvulnerable to pests. Simulation models, being based onexperimental data quantifying processes at a given scale(e.g., damage mechanisms at the plant level), enable projec-tions into scenarios at higher levels of a hierarchy (e.g.,yield loss at the crop stand scale), where a range of factors
are modified. Simulation models therefore are unique toolsallowing the use of experimental data to explore possiblefuture scenarios.
One should note that the above series of damage mech-anism are intended to address yield, not crop, losses. An-other group of damage mechanisms should thus be added tothe seven described previously in this section, which wouldmore fully allow addressing crop losses i.e. (8) Food qualityreducers (e.g., mycotoxin producers, such as Aspergillusspp. or Fusarium spp).
Dimensions of crop losses, hidden and indirect losses andcosts, and public health
The above sections strongly emphasize the yield componentof crop losses. Crop losses should be considered within astructured typology (Zadoks 1967; Zadoks and Schein1979):
& Direct losses
(1) Primary losses: (a) yield, (b) quality, (c) cost ofcontrol, (d) extra cost of harvesting, (e) extra cost ofgrading, (f) costs of replanting, (g) loss of income byless profitable replacement crop;(2) Secondary losses: (a) contamination of sowing andplanting material, (b) soil-borne diseases, (c) weakeningby premature defoliation of trees / perennials, (d) cost ofcontrol
& Indirect losses(a) farm, (b) rural community, (c) exporters, (d) trade:
wholesale; retail, (e) consumers, (f) government, (g)environment.
We are not aware of any report having addressed theentire set of facets of crop losses for a given disease in agiven crop, let alone in a multiple pest-crop system. Suchstudies, with an emphasis on the multidimensional conse-quences of crop losses, are necessary today, as naturalresources available to agriculture are shrinking, and becauseof the feedback of environment, societies, and economics onindividual farm operations. Such studies would enable a trueprioritization for plant protection, and would pave the wayto integrated plant protection programs where advances incrop loss research would better serve the diversity ofstakeholders.
The above list of crop loss dimensions does not directlyinclude the public health aspects associated with plant pro-tection and plant diseases. The former is the classic costs ofpesticide use, which is only one component of tacticaldecisions (Pimentel et al. 1992): $ 9 billion were spent in1992 in the USA, including chemical costs and humanhealth impacts. The latter is the largely unknown cost ofmycotoxins (Munkvold 2003; Wild and Gong 2010).
S. Savary et al.
Author's personal copy

Massive efforts are underway to address the problem offusarium head blight in wheat in Northern America andWestern Europe (e.g., Paul et al. 2005a; b; 2010), butaflatoxins and fumonisins (Gelderblom et al. 1988) arecontaminating a large fraction of the world’s food, includ-ing maize, cereals, groundnuts, and tree nuts (Wild andGong 2010). Aflatoxins are hepatocarcinogenic in humans,particularly in conjunction with chronic infection by hep-atitis B virus. Fumonisins are associated with liver andkidney tumours in rodents, with studies implying a possi-ble link with increased oesophageal cancer and neural tubedefects in humans (Wild and Gong 2010). Mycotoxincontamination has become one of the most pressing andchallenging problems facing plant pathologists today.
Risk and a categorization of crop loss problems
A typology of epidemics was recently proposed (Savary etal. 2011a), with: (1) chronic epidemics corresponding togenerally mild epidemics that regularly occur over largeareas; (2) acute epidemics occurring infrequently, some-times at very high level of intensity over small, or compar-atively restricted areas; and (3) emerging epidemicsoccurring under exceptional conditions, affecting potentiallyvery large areas, with sometimes very high intensities. Thistypology allows for transition, i.e., for a disease shiftingfrom one category to another, or belonging to two catego-ries. Similarly, one could consider: (1) epidemics causingchronic crop losses, that occur regularly over large areaswhere they cause comparatively low crop losses (Ec); (2)epidemics causing acute crop losses, that occur infrequently,over small, or comparatively restricted areas, sometimescausing very high crop losses (Ea); and (3) emerging epi-demics (Ee), affecting potentially very large areas, poten-tially causing heavy crop losses.
One definition of riskmay be borrowed fromRowe (1980):R 0 P * M, where P is risk probability, and M is risk magni-tude. In plant pathology, P may be translated into the proba-bility of an epidemic occurring, and M, into the crop lossconsequences of such an epidemic. For instance, infrequentepidemics with minor consequences, frequent epidemics withminor consequences, infrequent epidemics with large conse-quences, and frequent epidemics with large consequenceswould be associated with progressively increasing risks. Us-ing the above definition, the risks associated with the threecategories of epidemics would thus be:
– Ec: R 0 high P * low-moderate M;– Ea: R 0 low P * moderate-high M; and– Ee: R 0 very low P * moderate-high M.
As a result, the R-values associated with chronic, acute,and emerging epidemics would be: low to moderate, low tohigh, and very low to moderate, respectively.
The above requires development. Briefly, P would firstneed an operational definition (i.e., a quantitative threshold)enabling the distinguishing of epidemics from non-epidemics (Yuen and Hughes 2002). Second, M would needfurther specification too. LimitingM to yield loss might be afirst step. There, however, would be a need to incorporatethe multiple dimensionalities of M in order to truly addresscrop losses, and not yield losses only. In a recent review(Savary et al. 2011c), a case was made to stress the envi-ronmental, agro-ecological, and socio-economic attritioncaused by chronic epidemics, which is often down-played,as these diseases are perceived as ‘minor’, i.e., as ‘businessas usual’. The public health dimension has to be considered,too. For instance aspergillus wilt is a minor disease ofgroundnut in West Africa, causing very low yield losses,while the disease is endemic (high P). Limiting M to yieldloss would thus translate into a low R. However, the accu-mulation of aflatoxins in the diet causes acute intoxicationand is associated with grave complications (Wild and Gong2010). Incorporating the public health dimension of croploss inM would change the risk value from low-moderate tohigh.
Research on plant protection as part of a systems approach
A wide array of elements other than accurate knowledge ofcrop losses is at play in decision-making for crop healthmanagement (Rossing et al. 1994a; b; c; Hughes et al.1999). One is the search of an economic balance betweenthe cost of disease management options and the benefit oftheir implementation within a context of uncertainty (where,in particular, the notions of “epidemic” and “non-epidemic”are operationalized). Critical progress has been made on thetopic (Breukers et al. 2007; McRoberts et al. 2011), whichlargely makes use of Bayesian approaches (e.g., Yuen et al.1996; Yuen and Hughes 2002), and is now expanding to Q-methodology used in social sciences (McRoberts et al.2011). The human component is directly linked with thelatter point but much is still needed to analyze the pathway:knowledge ➔ attitude ➔ perception ➔ decision (Savary1994). Note that the paths of relationships in Fig. 1 differwhether one considers tactical or strategic decisions. Per-ception is not included in the drivers of strategic decisions,whereas it is for the tactical ones. This is because one mayusefully distinguish Attitudes (i.e., the conceptual frame-work under which a decision is made) from Perceptions(in which Attitudes, fed by Knowledge, are overlaid withthe constant flow of new information and needs, be theyrelated to plant protection or not). While, therefore, Atti-tudes are relatively stable over time, because they buildupon Knowledge (and accumulated experience, especiallyof the producers), Perceptions are much more volatile, sincethey are directly influenced by real-time observation and
Crop losses due to diseases
Author's personal copy
information (Savary 1994; Heong and Escalada 1997). Afocal point for plant protection research, and a reason whycrop loss magnitude, M, may not always be a key driver of adecision, is that farmers are dealing with many issues otherthan a particular disease, a particular crop, and even a givencropping season (e.g., Zadoks and Schein 1979). This, partly,explains why farmers may make seemingly counter-intuitivetactical decisions (Savary 1994), or why the transition fromone disease management strategy to a new, better one may notsucceed (McRoberts et al. 2011).
Quantitative and qualitative losses in relation to agriculturalobjectives and intensification
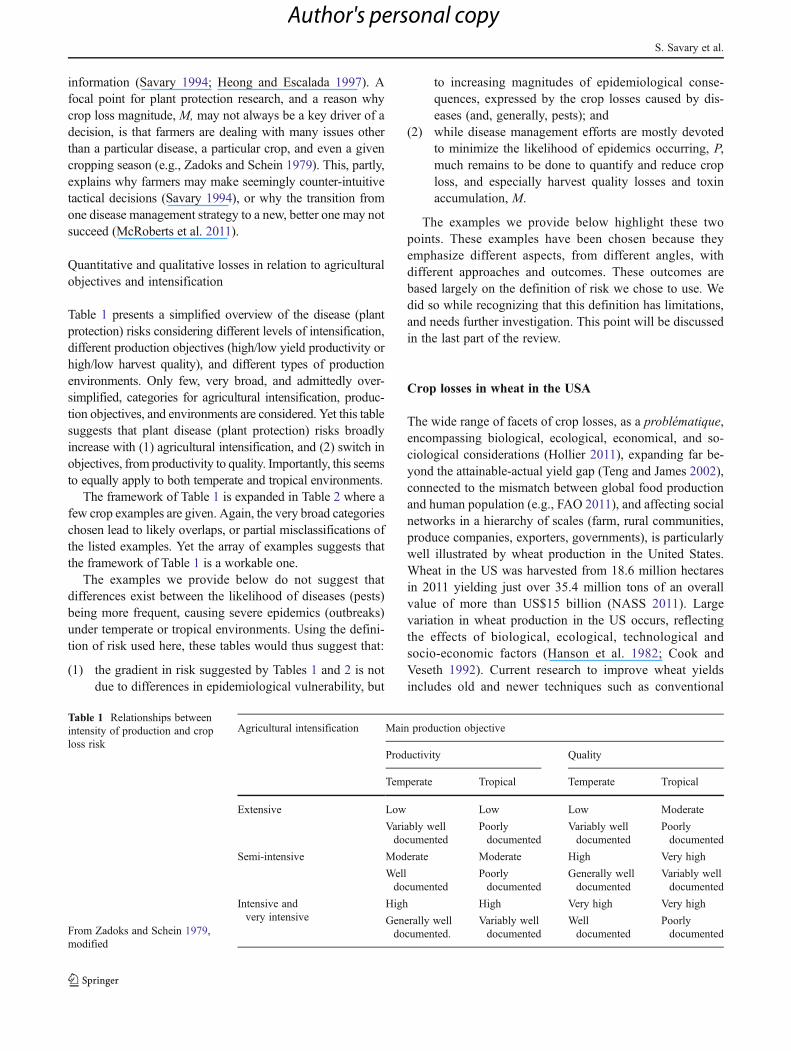
Table 1 presents a simplified overview of the disease (plantprotection) risks considering different levels of intensification,different production objectives (high/low yield productivity orhigh/low harvest quality), and different types of productionenvironments. Only few, very broad, and admittedly over-simplified, categories for agricultural intensification, produc-tion objectives, and environments are considered. Yet this tablesuggests that plant disease (plant protection) risks broadlyincrease with (1) agricultural intensification, and (2) switch inobjectives, from productivity to quality. Importantly, this seemsto equally apply to both temperate and tropical environments.
The framework of Table 1 is expanded in Table 2 where afew crop examples are given. Again, the very broad categorieschosen lead to likely overlaps, or partial misclassifications ofthe listed examples. Yet the array of examples suggests thatthe framework of Table 1 is a workable one.
The examples we provide below do not suggest thatdifferences exist between the likelihood of diseases (pests)being more frequent, causing severe epidemics (outbreaks)under temperate or tropical environments. Using the defini-tion of risk used here, these tables would thus suggest that:
(1) the gradient in risk suggested by Tables 1 and 2 is notdue to differences in epidemiological vulnerability, but
to increasing magnitudes of epidemiological conse-quences, expressed by the crop losses caused by dis-eases (and, generally, pests); and
(2) while disease management efforts are mostly devotedto minimize the likelihood of epidemics occurring, P,much remains to be done to quantify and reduce croploss, and especially harvest quality losses and toxinaccumulation, M.
The examples we provide below highlight these twopoints. These examples have been chosen because theyemphasize different aspects, from different angles, withdifferent approaches and outcomes. These outcomes arebased largely on the definition of risk we chose to use. Wedid so while recognizing that this definition has limitations,and needs further investigation. This point will be discussedin the last part of the review.
Crop losses in wheat in the USA
The wide range of facets of crop losses, as a problématique,encompassing biological, ecological, economical, and so-ciological considerations (Hollier 2011), expanding far be-yond the attainable-actual yield gap (Teng and James 2002),connected to the mismatch between global food productionand human population (e.g., FAO 2011), and affecting socialnetworks in a hierarchy of scales (farm, rural communities,produce companies, exporters, governments), is particularlywell illustrated by wheat production in the United States.Wheat in the US was harvested from 18.6 million hectaresin 2011 yielding just over 35.4 million tons of an overallvalue of more than US$15 billion (NASS 2011). Largevariation in wheat production in the US occurs, reflectingthe effects of biological, ecological, technological andsocio-economic factors (Hanson et al. 1982; Cook andVeseth 1992). Current research to improve wheat yieldsincludes old and newer techniques such as conventional
Table 1 Relationships betweenintensity of production and croploss risk
From Zadoks and Schein 1979,modified
Agricultural intensification Main production objective
Productivity Quality
Temperate Tropical Temperate Tropical
Extensive Low Low Low Moderate
Variably welldocumented
Poorlydocumented
Variably welldocumented
Poorlydocumented
Semi-intensive Moderate Moderate High Very high
Welldocumented
Poorlydocumented
Generally welldocumented
Variably welldocumented
Intensive andvery intensive
High High Very high Very high
Generally welldocumented.
Variably welldocumented
Welldocumented
Poorlydocumented
S. Savary et al.
Author's personal copy

breeding, biotechnology, interspecific and intergeneric hy-bridization, and basic studies of the physiology of the host-pathogen/pest interactions (Curtis et al. 2002). We concen-trate here only on wheat diseases in the US.
Over 100 diseases of biological or non-biological causesaffect wheat in the US. Some diseases are of local, yetsometimes acute, importance, whereas others have nation-wide impact (Bockus et al. 2010). However, only a fewwheat diseases have been addressed with respect to the croplosses they may cause. This is in particular the case of thethree wheat rusts (leaf, stem, and stripe), and Fusarium headblight, which have received the most attention (Calpouzos etal. 1976; Murray et al. 1994; Johnson et al. 1998).
Determining crop losses in wheat due to disease in the UShas taken many forms (Calpouzos et al. 1976; Johnson et al.1998). These range from the “best guess” expert opinions tomore scientific approaches based on yield comparisons
performed over years through formal crop loss assessmentexperimentation. Expert opinions are carefully considered,as they are based on years of experience of professionals inthe field. For example, based on interviews with crop lossestimators from wheat states, one commonly used approach isa survey technique, in which the estimator obtains a “feel” forthe level of disease in the area or state. The level of disease isthen compared to crop losses the wheat crop experienced inprevious years. Such estimates are sometimes criticized be-cause of their lack of scientific basis. However, when com-pared to “ground proof” data, expert opinion-derivedestimates have commonly been found to be reasonably accu-rate. Another approach involving surveys in commercial fieldsis to compare wheat disease injuries from commercial fieldswith reactions on wheat variety collections grown in closeproximity by University scientists. At harvest, disease reac-tions and harvested yields are compared to the same type of
Table 2 Relationships between intensity of production and crop loss risk: examples
Agriculturalintensification
Main production objective
Productivity Quality
Temperate Tropical Temperate Tropical
Extensive • Wildrice: Minnesota • Tropical hardwood:Asia, Africa, S. America
• Cork collection: Portugal,Algeria
• Various tropical fruits
• Redwood: western US • Cacao: some West Africaareas
• Wild blueberries:Northeast US
• Softwoods: Scandinavia,Russia
• Copra, coconut fibers:Polynesia
• Cranberries: US
Semi-intensive • Wheat: US • Wheat: S. Asia • Wheat: Western Europe,Russia, Ukraine, USA,S. America
• Cacao: West Africa
• Cider apple orchards:UK
• Dry cereals: W. andCentral Asia
• Potato: E. Europe • Coffee: South and CentralAmerica, Africa, S.E. Asia
• Some vineyards: Europe • Plantains: Africa • Basmati rice: India,Pakistan• Pine plantations:
northern Europe,S.E. Asia, USA
• Cassava: Africa
• Oil palms: W. Africa,S.E. Asia
• Rubber tree: W. Africa
Intensive • Cereals: N.W. Europe • Rubber tree: S.E. Asia • Barley, Oats: W. Europe • Tea: India, China, Japan,Indonesia
• Potato: China, W.Europe, US
• Bananas: CentralAmerica
• Grand vin vineyards: France,California, Australia
• Greenhouse flowers:Central America
• Maize, Soybean: US, S.America
• Potato: N.W. Europe
• Citrus: Israel, Florida,California
Very intensive • Dwarf orchards: W.Europe
• Rice: S. and S.E. Asia • Vegetables: Europe, USA,Canada
• Vegetables: Asia, C. andS. America, Africa
• Flower production: CentralAmerica, S.E. Asia
• Greenhouse flowers:Southern Europe, US, TheNetherlands
See Table 1 for risk classification
From Zadoks and Schein 1979, modified
Crop losses due to diseases
Author's personal copy
data observed in commercial fields. This approach is consid-ered more accurate.
A third type of crop loss assessment takes into consider-ation the growth stage of wheat at the time of initial diseaseoccurrence as a measurement of risk and then a measure-ment of disease severity during the early stages of graindevelopment. For instance, Calpouzos et al. (1976) deter-mined that the yield loss risk caused by stem rust was influ-enced by disease severity and the timing of disease onsetrelative to crop development. They determined that when stemrust onset occurred earlier than heading, there was a 99 % riskof yield loss, which dropped to 75 % if onset of the epidemicoccurred at heading/flowering, and to only 12 % if it occurredat early grain development. Using another approach, knownas the single-point or critical stage approach (Romig andCalpouzos 1970), yield loss estimates were based on stemrust assessment at the ¾ berry stage (Feeke’s growth stage10.54; DeWolf et al. 2011). Vanderplank (1963) howeversuggested that yield loss of small grains should considerthe entire crop development for polycyclic diseases,being either proportional to the area under the diseaseprogress curve or proportional to disease severity at acritical development stage (Doling and Doodson 1968).The critical stage approach was more accurate for mea-suring wheat stem rust loss (Romig and Calpouzos1970).
Sharma-Poudyal and Chen (2011) showed that thenumber of days with rainfall in the US Pacific North-west is correlated with yield loss due to stripe rust ofwheat. They further showed that winter temperaturevariables were more correlated to yield loss than tem-perature during other seasons. Thus, accumulated nega-tive degree days summed with daily (summer) thermictime were correlated to winter wheat yield loss. Bycontrast, Fusarium head blight losses can be calculatedusing an economic model as the difference in producerrevenue due to the disease in affected districts. Produc-tion losses are estimated by comparing actual yields toregression forecasts. Regression models are used toquantify the impact of Fusarium head blight-relatedsupply reductions (Johnson et al. 1998).
Yield losses due to wheat rusts alone are estimated at US$5 billion per year, whereas yield losses due to Fusariumhead blight have been estimated at US $3 billion since theearly 1990s (Schumann and D’Arcy 2009). These figuresonly consider the financial losses due to yield reductions.Additional losses caused by diseases are incurred in otheraspects of the wheat crop environment, as part of a systemconsisting of the farm, rural community, grain buyer, shipper,exporter, and society as a whole. Wheat is not only a staplefood crop in many parts of the world; it also is a majorcommodity on the international market (FAO 2008). Exam-ples of impact follow.
In parts of the US wheat hay is used for animal consump-tion. In the farm sector, when rusted wheat plants are har-vested for forage or silage, quality is compromised due toextensive desiccation and wilting of injured leaves. Foragelosses and nutritive value reductions are to be expectedwhen severely infected crop stands are harvested for forage(Marsalis and Goldberg 2011).
Crop loss effects on the producer and the community canbe devastating. The number of farms is dwindling in theUSA (EPA 2011; USDA 2011). Many producers borrowmoney in order to ensure their annual crop production.When the yields are lower than expected, loans may notbe paid in full, and farms can be lost to the lending agency.Livelihoods are lost, and many farm families are forced toleave communities with which they have been associated formuch of their lives. This contributes to an erosion of know-how in these communities. Further, credit ratings for farmersare reduced, and it is difficult to start over even in anothercommunity. Such an erosion of the agricultural fabric fromcrop losses is documented in more detail in Zadoks andSchein (1979), and is part of the list of indirect losses causedby disease listed above.
Heavy yield loss to diseases implies reduced market vol-ume for grain buyers. They also translate into reduced activityfor transport companies. Overall, an entire sector of the econ-omy may be affected. Further, trade with other nations iscompromised due to a reduction of product. Also, the USgrain carry-over stocks are reduced. US grain exports to therest of the world during 2010–11 was over 21 million tons,which is approximately 60 % of the US annual production(NASS 2011). With an estimated US$5 billion loss annuallyto grain rust diseases, the US wheat producers experienceapproximately 20 % economic loss annually.
Other components of crop loss include the constant fund-ing inputs necessary for research by industry and universitiesto find, or renew, host-plant resistances to reduce losses fromrust (Marasasa et al. 2003; Dixon et al. 2006; Solh et al. 2011),Fusarium head blight, and other diseases. Additionally, man-agement inputs, especially fungicides which only protect(attainable) yields and do not enhance them, add tremendouslyto the overall cost of production. The consequences of croplosses in wheat in the US therefore cascade over a number ofcomponents of agricultural systems, and society at large. Croploss in a key crop such as wheat in the USA ― the largestwheat exporter worldwide (FAO 2011) ― ultimately affectthe need to feed a food-deprived world and maintain a glob-ally safe and secure food supply.
Quality losses in cereals in Europe’s Northern countries
In Northernmost Europe (Norway, Finland, and Sweden),cereal crops are grown at higher latitudes than anywhere else
S. Savary et al.
Author's personal copy
in the world (Peltonen-Sainio et al. 2009), with cool maritimeclimates and short growing seasons. However, predicted cli-mate change scenarios of global temperature increase(Pachauri and Reisinger 2004) could significantly increasethe food production potential in these areas (Peltonen-Sainioet al. 2009; Olesen and Bindi 2002).
Cereal diseases in the Nordic countries and theirmanagement
The major pests in Norwegian cereals, besides weeds, arefungal diseases, such as Fusarium head blight on wheat, oat,and barley (consisting of a diverse complex of mycotoxinproducing and non-mycotoxin producing Fusarium species),leaf blotch diseases on wheat (Stagonospora nodorum, Sep-toria tritici, Drechslera tritici-repentis), barley (D. teres,Rynchosporium secalis, Cochliobolous sativus, Ramulariacollo-cygni), and oat (D. avenae, Stagonospora avenae) andpowdery mildew on all three crops (Blumeria graminis;Brodal et al. 2009; Ficke et al. 2011). Fungicide trials over2 years (2008 and 2009) in barley showed an average yieldresponse of 9 % to the most effective fungicide treatment,with D. teres and Ramularia collo-cygni being the mainpathogens found in the trials (Abrahamsen et al. 2011).Powdery mildews are considered of lower importance inbarley due to wide employment of mlo-resistance genes inthe Norwegian barley germplasm. The average yield in-crease due to the most effective pesticide treatment in dif-ferent spring wheat trials over 5 years (2006–2010), variedbetween 7 % and 15 % (Abrahamsen et al. 2011) dependingon the varieties. S. nodorum was the dominating pathogen inthese field trials (Abrahamsen et al. 2011). Leaf blotchdiseases continue to be the main focus in Norwegian breed-ing efforts because of their yield-reducing effects, the diffi-culty in phenotyping resistance(s), and because of the lackof appropriate molecular markers for resistance to this dis-ease complex. Fusarium head blight (FHB) in oats andwheat has also become a major research and breeding focusin Norway due to its increased occurrence and to the risk of itscontaminating feed and food products with highly toxicmyco-toxins H2/HT2 and/or Deoxynivalenol (DON) (Bergsjø et al.1993; Langseth et al. 1999; Brodal et al. 2011). In 2008, 80 %of the winter wheat, 65 % of the spring wheat and 50 % of thebarley area were sprayed with fungicides in Norway. Oatswere not protected with fungicides until 2009, when thepresence of FHB demanded chemical disease managementoptions. Frequent rains in autumn can delay cereal harvests,leading to reduced grain quality due to sprouting and in-creased mycotoxin contamination. On September, 8th, 2011,80 % of the Norwegian wheat crop was still standing in thefields due to wet weather. Grain quality was thus reduced fromfood to fodder grade with consequential price reductions forthe farmer. The freely available decision support system VIPS
(Varsling Innen Plante Skadegjørere, ‘Warning against plantpests and diseases’; Brodal et al. 2007) was designed topredict high risk of disease and pests in Norwegian cereals,fruits, and vegetables. This system also provides advice toextension personnel and farmers on measures and timing fordisease and pest management to increase the cost efficiencyand sustainability of cereal production (Brodal et al. 2007).Even though governmental research institutes have focusedon yield increase and disease reduction for many years, soundand reliable data on overall Norwegian yield losses in cerealsdue to diseases are few and fluctuate considerably amongyears, locations, and varieties, limiting crop loss data to veryrough estimates of yield loss, without considering indirecteffects of diseases.
Leaf blotch diseases (LBD) on winter wheat are also con-sidered the most important diseases in Swedish cereals. Otherdiseases such as powdery mildew, brown rust (Puccinia triti-cina) and yellow rust (P. striiformis) contribute to yield lossesas well (Wiik et al. 1995). In fungicide trials, Wiik (2009)reported increased winter wheat yields from 6 to 12 t.ha−1
between 1983 and 2005. Control of LBD accounted for thelargest fraction of yield increase, followed by powdery mil-dew, brown rust, and yellow rust (Wiik 2009). The averageyield increase in oats due to fungicide treatment in 2010reached 0.26 t.ha−1, based on actual yields ranging from4.39 t.ha−1 to 8.82 t.ha−1 (Roland 2011). Recent reports fromthe Swedish grain industry indicate an increase in mycotoxincontamination in oats in 2011, which would further increasethe indirect crop losses due to FHB.
A field survey in 2009 identified the most importantdiseases in Finland to be fungal leaf spot diseases (D. teres,C. sativus and R. secalis) on barley, leaf blotch diseases inspring wheat, and oat leaf spot (D. chaetomioides) and otherleaf blotch diseases (S. avenae and C. sativus) on oat (Jalli2011). Powdery mildew and yellow rust were consideredminor diseases. However, Fusarium langsethiae on barleyand oats and R. collo-cygni on barley were only recentlyidentified, in 2004 and 2001, respectively, and are consid-ered to be emerging pathogens also in the rest of Europe(Walters et al. 2008; Jalli 2011). The average yield increasefrom fungicide use in four-year field trials was 11 % inbarley and 13 % in spring wheat (Laine et al. 2009). Cur-rently, 73 % of Finnish farmers treat cereal fields withfungicides (Mäenpää 2010).
Crop losses in cereals in the Nordic countries
The relationship between fungal diseases and crop losses aregenerally based on yield losses in t.ha−1, comparing grainyield in fungicide treated, nearly disease-free, field plots withgrain yield from non-fungicide treated field plots, and thuswith variable levels of disease injuries (Bhatal et al. 2003).While these estimates might be useful in determining the
Crop losses due to diseases
Author's personal copy

quantitative yield loss due to diseases, they are mostly irrele-vant for gaining insight into the qualitative crop losses causedby plant diseases. Fusarium head blight is broadly consideredto be less yield reducing than leaf blotch diseases in all theNordic countries. However, the economic impact of the for-mer disease on the cereal industry might be many times themagnitude of the latter disease, due to mycotoxin contamina-tion of food products, fodder and feed.
In the 2005 and 2006 field seasons, the mycotoxin (mainlyT2/HT2 and DON) contents in some Norwegian oat samplesexceeded the recommended threshold for DON in oats andwheat for human consumption of 1,750 μg.kg−1 and1,250 μg.kg−1, respectively, as well as the recommendedthreshold for animal feed in Norway (8,000μg.kg−1; Norgesfôr2010). De-hulling of oats reduced the mycotoxin concentra-tion, but also added processing costs. In 2009 and 2010, themycotoxin concentration in many oat samples again exceededrecommended thresholds for human and animal consumption,leading to extensive testing of harvested oat samples by theNorwegian agricultural purchasing and marketing Co-op‘Norsk Fellekjøp’ in 2010 and 2011. By 2010, Fellekjøp had55,000 tonnes of mycotoxin-contaminated oats from the pre-vious year blended with mycotoxin-free grains from the run-ning year, in order to reach an overall concentration below theacceptable threshold, and so allow the grains to be processed asanimal feed, (Vermes 2010). The administrative director ofNorske Felleskjøp claimed the costs for the grain producersto mix the highly contaminated grains with healthy grainswould be 22×106 NOK (2.75×10⁶ Euros), compared to 100–110×106 NOK (12.5–13.75×10⁶ Euros), if the contaminatedgrain had been burned (Vermes 2010). Increased costs fortesting, sorting, de-hulling and mixing of the oat samples ledFellekjøp to demand a penalty price reduction for grain lotsexceeding a certain mycotoxin threshold and a reduction in oatgrain quantity delivered. Consequently, the area cropped withoats in Norway had to be reduced by one-third (Mellemstrand2010). Meanwhile, animal farmers, especially pig farmers,claimed 0.5–1×10⁶ losses NOK per year (0.0625–0.125×10⁶
Euros per year) and per farm, due to feeding their animals withmycotoxin-contaminated products and experiencing associatedreduction in animal health (Aadnesen 2011).
Grain imports into Norway are usually controlled by taxesand amounts of imported carbohydrates are determined basedon the actual need and demand each year. While oats forhuman consumption were almost entirely grown in Norwayuntil 2008, reaching a maximum of 16,000 tonnes in 2007, oatimports increased exponentially in 2009 and 2010, whileNorwegian grown oats for human consumption dropped backto 6,000 tonnes in 2010 (Solbakken 2010). After adjustingtheir prognosis for oat yield and mycotoxin contamination for2011, the Statens Landbruksforvaltning in Norway acceptedan import quota of 30,000 t of carbohydrates for feed andfodder to meet the demands of the animal industry, accepting
the added import taxes to their product prices (206–207 NOKor 25.75–25.86 Euro extra per ton of feed oats in 2010;Pettersborg 2010). In September 2011, Norway had to importan additional 260,000 t of human-food quality wheat for itsown home market, due to the low quality of wheat harvestedthat year (Torhild Nilsen 2011).
The cereal health situation in the Nordic countries pro-vides a fresh illustration of the importance of the qualitativeand quantitative losses that plant diseases are causing. Theoverall indirect economic costs for individual farmers, thegrain industry, and society in general, are difficult to esti-mate, but they do relate back, even if not entirely, to fungalpathogens and need to be considered to complete the com-plex picture of current and future crop losses and the roleplant diseases play in meeting the growing demand for foodand fibre world wide.
Crop losses to diseases in rice in tropical Asia
The causes, contexts, and importance of crop losses in ricehave been discussed in several articles and reviews (Savaryet al. 2006a; Savary et al. 2000a; b). Rice is of strategicimportance in Asia, where roughly 60 % of the worldpopulation lives (United Nations, Department of Economicand Social Affairs 2011), and where it represents the firstsource of caloric intake. Rice is also an important staplefood in many parts of the world, including Central andSouth America, Africa, and some European countries.
A combination of three complementary approaches wasused to assess yield losses at the regional (Tropical Asia)scale in lowland (irrigated and rain-fed) rice. The first ap-proach involves surveys conducted with a standardized pro-tocol in several hundred farmers’ fields in China, India, thePhilippines, Thailand, and Vietnam. This led to (1) charac-terizing a limited set of injury profiles (IP), (2) characteriz-ing a limited set of production situations (PS, i.e., theagronomic and environmental contexts of rice production,including, e.g., fertilizer use, water supply, fraction of arableland under rice), (3) linking IP and PS and showing thatinjury profiles are strongly associated with production sit-uations (Savary et al. 2000a). This also led to measuring thelevels of individual injuries, and the actual yield harvestedin each field (grand mean: 4.12 t.ha−1). The second ap-proach involved a series of linked experiments, where theattainable yield, Ya, was varied through different crop es-tablishment dates and fertilizer inputs, and where a range ofpest injuries were artificially generated in micro-fields. Thisled to the development of a statistical yield loss model usingprincipal component regression, which enabled the deriva-tion of damage (crop loss) functions at variable attainableyields for the main injuries found in the survey (Savary et al.2000b). The resulting model thus allows generation of yield
S. Savary et al.
Author's personal copy

loss estimates given a specified attainable yield (reflect-ing a given production situation) either for a given levelof a particular injury, or for a given combination ofinjuries (IP). The third approach was to develop a sim-ple, production-situation-specific, mechanistic simulationmodel, RICEPEST. The model was a derivation of thestructure developed by Johnson for potato (Johnson andTeng 1990; Johnson 1992) with additional elements fromthe universal crop growth model SUCROS (Van Keulenet al. 1982). The model was developed and tested insuccessive stages, the last evaluation phase involvingsimultaneous experiments in India, China, and the Philippines(Willocquet et al. 2002). RICEPEST allows generation ofyield loss estimates at specified attainable yields for giveninjury profiles. The model also enables one to project whatthe yield gains generated from plant protection could be inthese contexts (Willocquet et al. 2004).
Table 3 represents a synthesis of the above approaches.Large differences are observed in absolute (i.e., in t.ha−1) yieldloss value, reaching 2.3 t.ha−1, or over 40 % of the harvestedyield. The strongest yield reducer among diseases are sheath
blight (SHB), brown spot (BS), and sheath rot (SHR), whereasbacterial blight (BLB), leaf blast (LB), and neck blast (NB) areresponsible for much lower yield losses. Overall, insect inju-ries (brown plant hoppers, BPH; defoliators, DEF, dead heartscaused by stem borers, DH; and white heads caused by stemborers, WH) are responsible for much lower yield losses.Weeds are by far the strongest yield-reducers, causing 0.7 to1.2 t.ha−1, or 10 to 20 % yield losses.
Yield gains from management may vary widely, in partbecause of the ranges of management efficiencies, in partbecause of the differences in harmful effects, and in partbecause of differences in the inherent efficiency of manage-ment of individual yield reducers. Overall, however, oneshould expect an approximate 15 % increase in yield, or a1.2 t.ha−1 flat increase, if these available management toolswere implemented.
The combination of the above survey, experimental, andmodeling approaches have shown that 120 to 200×106 t ofgrain yield are lost yearly to pests over the 87×106 ha oflowland rice in Asia. Yet, only 25 million tons of rice istraded each year globally, i.e., only 4 % of the world rice
Table 3 Chronic yield losses to harmful organisms in rice in tropical Asia, yield gains from current management, and efficiency of crop healthmanagement
Yield loss Yield gain Managementefficiency
absolute(t.ha−1)
% absolute(t.ha−1)
%
IP(1) 1.4–2.3 25–43 1.2–5.7 16–69 0.4–0.7
BLB 0–0.03 0–0.6 0–0.9 0–17 0.9–1
SHB 0.3–0.7 5–10 0–2.4 0–29 0–0.8
BS 0–0.5 0–10 0 0 0
LB 0–0.1 0–1.7 0–3.5 0–65 0.9–1
NB 0–0.1 0–2.1 0–2.1 0–40 0.9–1
SHR 0.1–0.4 1.3–7.3 0 0 0
BPH 0–0.01 0–0.3 0.1–0.3 0.8–5.3 0.9–1
DEF 0.01–0.05 0.2–0.9 0–0.1 0.1–0.9 0.3–0.6
DH 0.02–0.05 0.3–1.0 0.02–0.12 0.3–2.3 0.5–0.8
WH 0.1–0.3 1.9–5.8 0.1–0.7 1.9–13.2 0.5–0.7
WEED 0.7–1.2 12–22 0.5–3.1 9–51 0.4–0.8snails trace (2)
rats trace (2)
birds trace (2)
(1) IP: combined injury profile; BLB: bacterial blight; SHB: sheath blight; BS: brown spot; LB: leaf blast; NB: neck blast; SHR: sheath rot; BPH:brown plant hoppers; DEF: defoliating insects; DH: dead hearts caused by stem borers; WH: white heads caused by stem borers; WEED: weedinfestation
(2) trace: less than 1 % relative yield loss in the PS×IP combination where the mode of corresponding injury is the highest
IP: injury profile: combination of injuries at their median levels across a survey in several hundreds of farmers’ fields in China, India, thePhilippines, Thailand, and Vietnam. Please refer to text for other symbols
In each column, the first figure corresponds to the minimum value for a given IP, and the second figure, to the highest value for a given IP
From Savary et al. 2000a; b; Willocquet et al. 2004; Savary et al. 2006a
Crop losses due to diseases
Author's personal copy

production (FAO 2011). These numbers provide a measure ofthe constraint exerted by pests on rice productivity and trade inAsia ― where the largest importing country actually onlyneeds about 1–2 million tons per annum. These numbersmay also be comparedwith those for maize (100×106 t traded,i.e., 12 % of world production), and wheat (145×106 t traded,i.e., 21 % of world production). As a result, crop lossesaffecting rice, one of the three most important staple cropsfor the world population, are of global significance. Becausethe global rice market is very thin, minor changes in availabil-ity have large impacts on prices (Willocquet et al. 2011).
Simulation modeling also allows shifting from yield loss toyield gains, and enables simulation of the implementation ofcrop health management tools. Management efficiencies, i.e.,the gains, relative to current yield levels, that could be accruedfrom better crop health management can thus be computed.Table 3 therefore also illustrates where priorities for researchin plant protection in lowland rice lie in Tropical Asia, wheremanagement has been efficient and should be sustained (seethe figures for bacterial blight and the two injuries caused byblast), and the tremendous gains that could be achieved, wereavailable management tools implemented.
As the consequences of global change unfold (Savary etal. 2011a), the spectrum of rice pests, and especially ricediseases, is changing with respect to their relative impor-tance. Diseases which used to be considered secondary, suchas false smut (teleomorph: Claviceps oryzae-sativae, ana-morph: Ustilaginoidea virens), sheath rot (Sarocladium ory-zae), along with a number of viral diseases, are gainingimportance in South and South-East Asia. These not onlyraise concerns on food security for a major food crop world-wide, but on global food safety as well.
Yield losses in wheat in France
Wheat represents the main field crop in France, with nearly4.8 million hectares grown in 2006 (FAO 2011). France isalso one of the largest pesticide consumers worldwide(Aubertot et al. 2006), despite growing concerns associatedwith the negative externalities associated with conventionalmeans of intensifying agriculture (including, e.g. intensiveuse of pesticides, of fertilizers, of growth regulators, andclassical tillage) (Médiène et al. 2011). The following sec-tion provides an overview of approaches aiming at provid-ing crop loss data in wheat in France and its use.
Monitoring of injuries
Diseases (and pests in general) in wheat are regularly mon-itored in France, with the aim of providing near to real-timeinformation on crop health risks (e.g., Aubertot et al. 2006).One important element of wheat production in France is the
large diversity of production situations (agronomic, socio-economic, and environmental), leading to widely variablepatterns of multiple injuries (Savary et al. 2006b; Médièneet al. 2011).
Experiments
Experiments have been set up to establish injury-damagerelationships on wheat (e.g., Schoeny et al. 2001) for somemajor wheat diseases in experimental stations. These resultsdo not, however, provide information on actual losses incommercial fields, where crop management (including plantprotection) differ, and where a number of diseases (andpests) occur. At the crop - multiple disease (pest) systemlevel, Soudais et al. (2010) used several experiments whereyield losses of wheat caused by various injury profilesassociated with an array of production situations in Europewere measured. These experiments involved the charac-terization of agronomic, environmental, and economicperformances of contrasting cropping systems. In orderto rank the various wheat pests in terms of the yieldlosses they cause, each experimental plot had a treatedand an untreated area against any occurring pest, en-abling the measurement of both the actual and the attainableyield. Such experimental results enabled the quantifying ofyield losses, and the relationships between production situa-tions, injury profiles, and yield losses. Additional field work isnecessary:
(1) to outscale experimental yield loss results to a range ofproduction situations,
(2) to outscale these results to variable arrays of injurycombinations, and
(3) to rank wheat pests according to the crop losses theycause in varying production situations.
Simulation modelling
Simulation modelling enables the exploitation of (1) fieldexperimental data, (2) biological understanding of damagefunctions, (3) economic reasoning, and (4) knowledge incrop health management tools, towards a number of objec-tives, including:
(1) quantifying the benefits of current and yet-to-be-deployed plant protection tools - including, e.g., hostplant resistance, and agronomic practices,
(2) development of maps of the distribution of yield lossesin France using Geographic Information Systems.
WHEATPEST (Willocquet et al. 2008; Soudais et al.2010) is a simulation model aimed at modelling yield lossescaused on wheat by injury profiles in varying productionsituations. The model’s structure is directly transposed from
S. Savary et al.
Author's personal copy

RICEPEST (Willocquet et al. 2002, 2004) and addresses arange of key pests of wheat in Western Europe. As inRICEPEST, WHEATPEST enables the modelling of (1)yield losses to individual pests, (2) yield losses to a combi-nation of pests, i.e., an injury profile, and (3) yield gainsaccrued by pest management options, whether existing, or tobe developed. The last point highlights the outscaling powerof simulation modelling based on mechanistic processes,i.e., experimental knowledge of damage mechanisms. Themodel structure is simple enough to enable a number ofapplications.
First, measurements of injuries by the different pest com-ponents of injury profiles in commercial fields at the nation-al scale can be used as input variables of WHEATPEST,along with other variables describing varying productionsituations. This would lead to the first objective mentionedabove. Maps representing actual or attainable (i.e., un-injured) yields and yield losses at the national scale couldbe generated, leading to the second of the above objectives.These combined results could enable research prioritisationat the national scale and the design of less vulnerable crop-ping systems.
Expert panels
Expert panels have played an important role in guiding andsynthesising research, as exemplified by expert panel-baseddata reported by the European network ENDURE on wheat(Jørgensen et al. 2008). Results from such panel consultancyinclude ranges of estimated yield losses by selected diseasesat the national scale: Septoria leaf blotch (0.3–5.0 t.ha−1),brown rust (0–4.0 t.ha−1), yellow rust (0–6.0 t.ha−1), eyespot(0–2.5 t.ha−1), Fusarium head blight (0–2.0 t.ha−1), powderymildew (0–1.5 t.ha−1), tan spot (0–2.0 t.ha−1), take-all (0–2.0 t.ha−1), Rhizoctonia sharp eyespot (0–0.5 t.ha−1), andStagonospora nodorum leaf blotch (0–0.5 t.ha−1). The sec-ond figure within each parenthesis of this list representsextremes that very seldom occur, and which never occursimultaneously. For instance, assuming an attainable yieldof Ya08 t.ha−1 (800 g.m−2), and using the formula ofPadwick (1956) as a simple way to avoid double ac-counting, the relative yield losses (RYL) associated withthese extreme values would be:
RYL ¼ 1�Yi¼n
i¼1
1� YLiYa
� �
whereQi¼n
i¼1denotes the product of the ratio of n individual
yield losses to specific pests, YLi, resulting in RYL00.9777. Such extreme values, if combined, would thusresult in 97.77 % yield losses, which is extremely un-likely, especially when one considers that only a few key
wheat diseases, and no other pests (weeds and animals)are taken into account. Despite such shortcomings, theabove ranges provide a preliminary ranking against whichfuture results from research may be compared.
Expert knowledge further allows producing preliminary,average-scenario, maps of yield losses attributable to a set ofwheat diseases (Jørgensen et al. 2008). Such maps, broadly,indicate a gradient of decreasing yield losses from 2.5 t.ha−1
to 1 t.ha−1 along a North-West to South-East transect. Thistransect largely reflects the different climatic zones ofFrance, which in turn determine both weather patterns dur-ing cropping seasons and crop establishment dates. Again, itwill be interesting to see how this expert-based outputcompares with formal approaches incorporating, e.g., varie-ty types (and the pest resistances they may carry) and thewidely diverse crop management practices used in thecountry.
Wheat yield losses in France: current knowledge and futureneeds
Far too little is known about yield losses in wheat in France,despite the fact that crop management decisions should begrounded in information on yield losses as a prime compo-nent among several other factors. While a number of na-tional and international networks addressing crop protectionexist, there is a lack of specific efforts dedicated to theintegration of (1) quantification of injuries caused by pests(plant pathogens, animals, weeds), (2) characterization ofproduction situations, and (3) measurement of actual yieldsin commercial fields. Despite past efforts, a number ofquestions remain on yield losses due to diseases and otherpests of wheat in France. These questions especially pertainto:
– the interaction amongst pests in their yield-reducingeffects;
– the effects of production situations (along with produc-tion objectives) on injury profiles;
– the true level of interactions between attainable yieldsand yield losses; and
– shifts in pest importance as a result of changes in cropmanagement.
These questions are challenging and inter-connected.Addressing them obviously calls for a systems approach.
Conclusion
The above sections highlight why plant protection ispart of the management of complex systems (Teng andSavary 1992), where a holistic view involving a com-bination of angles and approaches is required. These
Crop losses due to diseases
Author's personal copy

include ecology, epidemiology, biology, agronomy, pub-lic health medicine, psychology, economics, and thetools of their trade: statistical models, simulation models,Bayesian statistical and information theory approaches,economic modelling, as well as psychometric analysis.Crop loss research thus lies at the crossroads of diversedisciplinary areas. As a result, while a long standing andcritical field of investigation of its own, crop loss researchdoes not have a clear academic home. One may considerthat the topic is entering a complete transition, and this maybe one cause of the seemingly slow progress the field hasseen over the past decade.
The definition of risk we used in this review, R 0 P × M,implicitly assumes that P andM are independent events. Thisis often not the case. On the one hand, epidemics may occur,which may not reach levels high enough to cause crop losses.On the other hand, important crop losses may occur evenwhen P is small. This occurs in particular when one considersharvest quality, long-term attrition of the performances of asystem, or rapid accumulation of toxins at negligible diseaselevels. A threshold needs to be defined for risk magnitude,which is not independent of the level of epidemics or theirdynamics. Thus, a probabilistic view of R emerges, where thecrop loss risk incurred by epidemics is made conditional to theprobability distributions of P (the likelihood of an epidemicoccurring above a pre-set threshold), or ofM (the likelihood ofcrop loss occurring above a given threshold). Thus, one couldfor instance write: R 0 P × p(M | P), where p(M | P) isthe probability of the value of M, conditional to theprior knowledge of P.
The use of Bayesian statistics has indeed been recentlyapplied, e.g. Yuen et al. (1996) and Yuen and Hughes(2002) to improve decisions in disease management, al-though the approach has concentrated on tactical deci-sions and has seldom addressed strategic ones (e.g. Eskeret al. 2006). The more complex cases of injury profiles,which can be expressed as health syndromes (Savary, etal. 2011b), where each disease occupies an ecologicalniche within a syndrome of diseases, and more generally,of organisms harmful to the crop and its harvest (McRoberts etal. 2003), largely remains a field for future analyseswith very useful applications. Farmers are usually notinterested in a single disease (or pest) during the courseof a cropping season. Rather they are more interested inthe overall combination of risks their production systemis exposed to.
This review suggests three main conclusions:
1- There is a wide, and expanding, array of methods tomeasure, analyse, predict, and minimise crop losses, asexemplified by e.g., the combination of simulationmodelswith GIS. Much of the body of new methods belongs tothe field of Ecology and applied Mathematics; however, a
wide range of them is also to be borrowed from otherdisciplinary areas, especially the Social Sciences and Pub-lic Health Medicine. Combined together, these methodol-ogies should attract young scientists with diversebackgrounds providing a critical opportunity for this fieldof investigation to develop.
2- However, new methodology will never supersede actualdata. We still know too little of the physiology of thediseased plant, especially when non-biological, yield-limiting factors occur. We know much too little of whatis happening in farmers’ fields with respect to diseasesand pests, and to crop management. Importantly, spe-cifically designed crop loss experiments are needed toquantify risks, or to parameterise and test models.
3- The consequences of harmful effects go far deeper thanjust direct reduction in yields. Consequences includecritical indirect effects along economic fabrics and foodchains. Plant diseases, in particular, are often not themain yield reducers, but their impacts on harvest quality(food processing) and safety (toxins) are very serious inmany crops and environments worldwide. These indi-rect effects, of diseases especially, are so poorly docu-mented that one may assume that they are grosslyunderestimated, as several recent studies suggest.
These conclusions should represent an incentive to ad-dress the challenge, the scientific value, and the practicalapplications of disease assessments, their timing and quan-tification, as well as their relationships and their predictivevalue for crop losses. This review should also lead to areconsideration of oversimplified crop loss estimates, ac-count for the multidimensional costs of crop losses, andstart to evaluate the indirect cost of reduced product qualityto add to the disease-yield loss relationship. These consid-erations are necessary for the prioritization of research in anextremely tight race between food production and growingfood demand, at a time when environmental resourcesare shrinking, funding is becoming scarce, public exten-sion services are vanishing, and public expectations areincreasing.
Acknowledgments This review is dedicated to the memory of ourcolleague R. D. Berger.
We wish to thank L. Willocquet for her assistance in reviewing thismanuscript.
References
Aadnesen, Å. (2011). Lei av dårlig kvalitet på kornet, Bondebladed,03/25/2011. http://www.bondebladet.no/gaardsdrift/2011/03/25/lei-av-daarlig-kvalitet-paa-kornet.aspx.
Abrahamsen, U., Elen, O., & Åssveen, M. (2011). Vårhvetesorter ofsoppbekjempelse. Fokus Bioforsk, 6, 87–90.
S. Savary et al.
Author's personal copy

Alston, J. A., Beddow, J. M., & Pardey, P. G. (2009). Agriculturalresearch, productivity, and food prices in the long run. Science,325, 2009–2010.
Aubertot, J. N., Barbier, J. M., Carpentier, A., Gril, J. J., Guichard, L.,Lucas, P., Savary, S., & Voltz, J. M. (2006). Pesticides,agriculture et Environnement: réduire l’Utilisation des pesti-cides et en limiter les impacts environnementaux. Versailles:Editions Quae.
Ayres, P. G. (1981). Effects of disease on the physiology of the growingplant. Cambridge: Cambridge University Press.
Bassanezi, R. B., Amorim, L., Bergamin Filho, A., & Berger, R. D.(2001). Gas exchange and emission of chlorophyll fluorescenceduring the monocycle of rust, angular leaf spot and anthracnoseon bean leaves as a function of their trophic characteristics.Journal of Phytopathology, 150, 37–47.
Bassanezi, R. B., Amorim, L., Bergamin Filho, A., Hau, B., & Berger,R. D. (2001). Accounting for photosynthetic efficiency of beanleaves with rust, angular leaf spot and anthracnose to assess cropdamage. Plant Pathology, 50, 443–452.
Bergsjø, B., Langseth, W., Nafstad, I., Høgset Jansen, J., & Larsen, H.J. S. (1993). The effect of naturally deoxynivalenol-contaminatedoats on the clinical condition, blood parameters, performance andcarcass composition of growing pigs. Veterinarian Research, 17,283–294.
Bhatal, J. S., Loughman, R., & Speijers, J. (2003). Yield reduction inwheat in relation to leaf disease from yellow (tan) spot andseptoria nodorum blotch. European Journal of Plant Pathology,109, 435–443.
Bockus, W. W., Bowden, R. L., Hunger, R. M., Morrill, W. L., Murray,T. D., & Smiley, R. W. (2010). Compendium of wheat disease andpests. St Paul: APS Press.
Boote, K. J., Jones, J. W., Mishoe, J. W., & Berger, R. D. (1983).Coupling pests to crop growth simulators to predict yield reduc-tions. Phytopathology, 73, 1581–1587.
Breukers, A., Van der Werf, W., Kleijnen, J. P. C., Mourits, M., &Oude Lansink, A. (2007). Options for cost-effective control of aquarantine disease: a quantitative exploration using design ofexperiments methodology and bio-economic modeling. Phytopa-thology, 97, 945–957.
Brodal, G., Folkedal, A., Hole, H., Brevig, C., & Rafoss, T. (2007).VIPS – Warning and prognoses of pests and diseases in Norway.Proceedings of NJF 23rd Congress 2007, Trends and Perspectivesin Agriculture, June 26–29, 2007. Copenhagen, Denmark.
Brodal, G., Henriksen, B., & Sundheim, L. (2009). SkjukdommerI korn, oljevekster og kernebelgvekster. Fokus Bioforsk, 4,107–143.
Brodal, G., Rafoss, T., Elen, O., & Tangerås, H. (2011). Trends andvariations in the occurrence of Fusarium in cereal seeds in Norway1970–2010. Seed Science and Technology, submitted.
Brown, L. R. (2011).World on the edge. How to prevent environmentaland economic collapse. New York, London: W. W. Norton &Company.
Calpouzos, L., Roelfs, A. P., Madson, M. E., Martin, F. B., Welsh, J. R. &Wilcoxson, R. D. (1976). A New Model to Measure Yield LossesCaused by Stem Rust in Spring Wheat. Minnesota AgriculturalExperiment Station Technical Bulletin, No. 307.
Campbell, L. C., & Madden, L. V. (1990). Introduction to plant diseaseepidemiology. New York: Wiley.
Chakrabarti, N. K. (2001). Epidemiology and disease management ofbrown spot of rice in India. In S. Sreenivasaprasad & R. Johnson(Eds.), Major diseases of rice - recent advances (pp. 293–306).Dordrecht: Kluwer Academic Publishers.
Chiarappa, L. (1971). Crop loss assessment methods: FAO manual onthe evaluation and prevention of losses by pests, diseases andweeds. Farnham Royal: FAO - Commonwealth AgriculturalBureau.
Chiarappa, L. (Ed.). (1981). Crop loss assessment methods. Supple-ment N°3. Farnham Royal: FAO / Commonwealth AgriculturalBureau.
Cook, R. J., & Veseth, R. J. (1992). Wheat health management. StPaul: APS Press.
Curtis, B. C., Rajaram, S., & Macpherson, H. G. (2002). FAO PlantProduction and Protection Series, No. 30. Bread Wheat: Improve-ment and Production.
de Jesus Junior, W. C., Vale, F. X. R., Coelho, R. R., Zambolim, L.,Costa, L. C., & Bergamin Filho, A. (2001). Effects of angular leafspot and rust on yield loss of phaseolus vulgaris. Phytopathology,91, 1045–1053.
DeWolf, E., Murray, T., Paul, P., Osborne, L., & Tenuta, A. (2011).Identification and management of stem rust on wheat and barley.USA: Kansas State University.
Dixon, J., Nalley, L., Kosina, P., LaRovere, R., Hellin, J., & Aquino, P.(2006). Adoption and economic impact of improved wheat vari-eties in the developing world. Journal of Agricultural Science,144, 489–502.
Doling, D. A., & Doodson, J. K. (1968). The effect of yellow rust onthe yield of spring and winter wheat. Transansactions of theBritish Mycobiological Society, 51, 427–434.
Dyson, T. (1999). World food trend and prospects to 2025. Proceed-ings of the National Academy of Sciences of the USA, 96, 5929–5936.
EPA (Environmental Protection Agency). (2011). http://www.epa.gov/oecaagct/ag101/demographics.html, accessed 17 October.
Esker, P., Harri, J., Dixon, P., & Nutter, F. W., Jr. (2006). Comparisonof models for forecasting of Stewart’s disease of corn in Iowa.Plant Disease, 90, 1353–1357.
Evans, L. T. (1998). Feeding the Ten billion. Plants and populationgrowth. Cambridge: Cambridge University Press.
FAO. (2008). Wheat rust disease global program. Rome: FAO.FAO. (2011). http://faostat.fao.org. Accessed 17 October 2011.Ficke, A., Abrahamsen, U., & Elen, O. (2011). Betydning av blad-
flekksjukdomskomplekset i norsk hvetedyrking. Fokus Bioforsk,6, 64–67.
Gelderblom, W. C. A., Jaskiewicz, K., Marasas, W. F. O., Thiel, P. G.,Vleggaar, R., & Kriek, N. P. J. (1988). Fumonisins—novel myco-toxins with cancer promoting activity produced by fusarium mon-iliforme. Applied and Environmental Microbiology, 54, 1806–1811.
Gomes Carneiro, S. M. T. P., Amorim, L., Bergamin Filho, A., Hau, B.,& Bianchini, A. (2000). Dinâmica de area foliar, desfolha evariaveis de area foliar sadia em feijoeiros com infecçoes isoladase conjuntas de phaeoisariopsis griseola e colletotrichum linde-muthianum. Summa Phytopathologica, 26, 406–412.
Hanson, H., Borlaug, N. E., & Anderson, R. G. (1982). Wheat in thethird world. Boulder: Westview Press.
Heong, K. L., & Escalada, M. M. (1997). Perception change in ricepest management: a case study of farmers’ evaluation of conflictinformation. Journal of Applied Communications, 81, 3–17.
Hollier, C. A. (2011). Impact of crop loss in the United States, sym-posium at the annual meeting of the American PhytopathologicalSociety: Why do we care about crop losses? Honolulu. Phytopa-thology, 101, S223.
Hughes, G., McRoberts, N., &Burnett, F. J. (1999). Decision-making anddiagnosis in disease management. Plant Pathology, 48, 147–153.
Ingram, J. (2011). A food systems approach to researching food secu-rity and its interactions with global environmental change. FoodSecurity, 3, 417–431.
Jalli, M. (2011). The emergence of cereal fungal diseases and theincidence of leaf spot diseases in Finland. Agricultural and FoodScience, 20, 62–73.
James, W. C. (1974). Assessment of plant diseases and losses. AnnualReview of Phytopathology, 12, 27–48.
Crop losses due to diseases
Author's personal copy

Johnson, K. B. (1987). Defoliation, disease, and growth: a reply.Phytopathology, 77, 1495–1497.
Johnson, K. B. (1992). Evaluation of a mechanistic model thatdescribes potato crop losses caused by multiple pests. Phytopa-thology, 82, 363–369.
Johnson, D. D., Flaskerud, G. K., Taylor, R. D., & Satyanarayana, V.(1998). Economic impacts of fusarium head blight in wheat.North Dakota: North Dakota State University.
Johnson, K. B., Radcliffe, E. B., & Teng, P. S. (1986). Effects ofinteracting populations of alternaria solani, verticillium dahliae,and the potato leafhopper (empoasca fabae) on potato yield.Phytopathology, 76, 1046–1052.
Johnson, K. B., & Teng, P. S. (1990). Coupling a disease progressmodel for early blight to a model of potato growth. Phytopathol-ogy, 80, 416–425.
Johnson, K. B., Teng, P. S., & Radcliffe, E. B. (1987). Analysis ofpotato foliage losses caused by interacting infestations of earlyblight, verticillium wilt, and potato leafhopper; and the relation-ship to yield. Zeitschrift für Pflanzenkrankheiten und Pflanzen-schutz, 94, 22–33.
Jørgensen, L. N., Jahn, M., Clark, B., Antichi, D., Góral, T., Schepers,H., Lucas, P., Rolland, B., Gouache, D., & Hornok, L. (2008).Best control practices of diseases in winter wheat. Endure deliv-erable D1.2. Available online at: www.eurowheat.org.
Laine, P., Jalli, M., & Koski, P. (2009). Viljojen tautitorjuntaai-neiden vertailutuloksia MTT: n kenttäkokeista 2005–2008.(https://portal.mtt.fi/portal/page/portal/mtt_en/mtt/facilities/testing_PPs/trialresults/Fungisidivertailu.pdf).
Langseth, W., Bernhoft, A., Rundberget, T., Kosiak, B., & Gareis, M.(1999). Mycotoxin production and cytotoxicity of fusariumstrains isolated from Norwegian cereals. Mycopathologia, 144,103–113.
Large, E. C. (1966). Measuring plant disease. Annual Review of Phy-topathology, 4, 9–28.
Leath, S., Scharen, A. L., Lund, R. E., & Dietz-Holmes, M. E. (1993).Factors associated with global occurrences of septoria nodorumblotch and septoria tritici blotch of wheat. Plant Disease, 77,1266–1270.
Livne, A., & Daly, J. M. (1966). Translocation in healthy and rust-affected beans. Phytopathology, 56, 170–175.
Loomis, R. S., & Adams, S. S. (1983). Integrative analysis ofhost-pathogen relations. Annual Review of Phytopathology,21, 341–362.
Lopes, D. B., & Berger, R. D. (2001). The effects of rust and anthrac-nose on the photosynthesis competence of diseased bean leaves.Phytopathology, 91, 212–220.
Madden, L. V. (1983). Measuring and modeling crop loss at the fieldlevel. Phytopathology, 73, 1591–1596.
Madden, L. V., Hughes, G., & Irwin, M. E. (2000). Coupling disease-progress-curve and time-of-infection functions for predictingyield loss of crops. Phytopathology, 90, 788–800.
Madden, L. V., Hughes, G., & Van den Bosch, F. (2007). The study ofplant disease epidemics. St Paul: APS Press.
Mäenpää, A. (2010) Plant Disease Forecasting Model, Needs andUsefulness. Bachelor’s thesis HAMK University of Applied Sci-ences, Tammela (in Finnish with English summary).
Magyarosy, A. C., Schürmann, P., & Buchanan, B. B. (1976). Effect ofpowdery mildew infection on photosynthesis by leaves and chlor-oplasts of sugarbeet. Plant Physiology, 57, 486–489.
Marasasa, C. N., Smaleb, M., & Singh, R. P. (2003). The economicimpact of productivity maintenance research: breeding for leafrust resistance in modern wheat. Agricultural Economics, 29,253–263.
Marsalis, M. A., & Goldberg, N. P. (2011). Leaf, stem and stripe rustdiseases of wheat. Guide A-415. USA: New Mexico StateUniversity.
McRoberts, N., Hall, C., Madden, L. V., & Hughes, G. (2011). Per-ceptions of disease risk: from social construction of subjectivejudgments to rational decision making. Phytopathology, 101,654–665.
McRoberts, N., Hughes, G., & Savary, S. (2003). Integratedapproaches to understanding and control of diseases and pests infield crops. Australasian Plant Pathology, 32, 167–180.
Médiène, S., Valantin-Morison, M., Sarthou, J. P., de Tourdonnet, S.,Gosme, M., Bertrand, M., Roger-Estrade, J., Aubertot, J. N.,Rusch, A., Motisi, N., Pelosi, C., & Doré, T. (2011). Agroecosys-tem management and biotic interactions: a review. Agronomy forSustainable Development, 31, 491–514.
Mellemstrand, C. (2010) Vi må dyrke mindre havre, Norsk Landbruk,12/15/2010. (http://www.norsklandbruk.no/mat-og-marked/2010/12/15/-vi-maa-dyrke-mindre-havre.aspx).
Mendgen, K. (1981). Nutrient uptake in rust fungi. Phytopathology,71, 883–889.
Mitchell, D. T. (1979). Carbon dioxide exchange by first leaf tissues ofsusceptible to wheat stem rust. Transactions of the British Myco-logical Society, 72, 63–68.
Munkvold, G. P. (2003). Cultural and genetic approaches to managingmycotoxins in maize. Annual Review of Phytopathology, 41, 99–116.
Murray, G. M., Ellison, P. J., Watson, A., & Cullis, B. R. (1994). Therelationship between wheat yield and stripe rust as affected bylength of epidemic and temperature at the grain developmentstage of crop growth. Plant Pathology, 43, 397–405.
NASS. (2011). NASS. http://usda.mannlib.cornell.edu/MannUsda/viewDocumentInfo.do?documentID01002.
Nellemann, C., MacDevett, M. Manders, T., Eickhout, B., Svilhus, B.Prins, A. G., & Kaltenborn, B. P. (Eds.). (2009). The environ-mental food crisis - the environment’s role in averting future foodcrises. A UNEP rapid response assessment. United Nations En-vironment Program, GRID-Arendal, www.grida.no.
Norgesfôr. (2010). Korn og oljefrø 2010–2011, Kvalitetskrav, Levering-betingelser, Oppgjør, Strandunikorn Information Booklet, p. 11.(www.norgesfor.no/PageFiles/9548/Kornogoljefro2010–2011.pdf).
Oerke, E. C. (2006). Crop losses to pests. Journal of AgriculturalScience, 144, 31–43.
Oerke, E. C., Dehne, H. W., Schönbeck, F., & Weber, A. (1994). Cropproduction and crop protection. Estimated losses in major foodand cash crops. Amsterdam: Elsevier.
Olesen, J. E., & Bindi, M. (2002). Consequences of climate change forEuropean agricultural productivity, land use and policy. EuropeanJournal of Agronomy, 16, 239–262.
Pace, M. E., & Mackenzie, D. R. (1987). Modeling crop growth andyield for loss assessment. In P. S. Teng (Ed.), Crop loss assess-ment and pest management (pp. 30–36). St Paul: APS Press.
Pachauri, R. K., & Reisinger, A. (Eds.). (2004). IPCC contribution ofworking groups I, II and III to the fourth assessment report of theintergovernmental panel on climate change core writing team.Geneva: IPCC.
Padwick, G. W. (1956). Losses caused by plant diseases in the tropics.Kew: Commonwealth Mycological Institute PhytopathologicalPapers N°1.
Palti, J. (1981). Cultural practices and infectious crop diseases. Berlin:Springer.
Parlevliet, J. E. (1981). Crop loss assessment as an aid in screening forresistance and tolerance. In L. Chiarappa (Ed.), Crop loss assess-ment methods. Supplement N°3 (pp. 111–114). Farnham: FAO /Commonwealth Agricultural Bureau.
Paul, P. A., El-Allaf, S. M., Lipps, P. E., & Madden, L. V. (2005).Relationships between incidence and severity of fusarium headblight on winter wheat in Ohio. Phytopathology, 95, 1049–1060.
Paul, P. A., Lipps, P. E., & Madden, L. V. (2005). Relationship of visualestimates of fusarium head blight intensity and deoxynivalenol
S. Savary et al.
Author's personal copy

accumulation in harvested whet grain: a meta-analysis. Phytopathol-ogy, 95, 1225–1236.
Paul, P. A., McMullen, M. P., Hershman, D. E., & Madden, L. V.(2010). Meta-analysis of the effects of triazole-based fungicideson wheat yield and test weight as influenced by fusarium headblight intensity. Phytopathology, 100, 160–171.
Peltonen-Sainio, P., Jauhiainen, L., Hakala, K., & Ojanen, H. (2009).Climate change and prolongation of growing season: changes inregional potential for field crop production in Finland. Agricultureand Food Science, 18, 171–190.
Pettersborg, S. (2010). Verdifulle kornkvoter fordelt, SLF, the Norwe-gian Agricultural Authority press release, 11/25/2010. (https://www.slf.dep.no/no/internasjonalhandel/import/tollkvoter/Verdi-fulle+kornkvoter+fordelt.12306.cms).
Pimentel, D., Acquay, H., Biltonen, M., Rice, P., Silva, M., Nelson, J.,Lipner, V., Giordano, S., Horowitz, A., & D’Amore, M. (1992).Environmental and economic costs of pesticide use. Bioscience,42, 750–760.
Pinnschmidt, H. O., Batchelor, W. D., & Teng, P. S. (1995). Simulationof multiple species pest damage in rice using CERES-rice. Agri-cultural Systems, 48, 193–222.
Rabbinge, R. (1982). Pests, diseases, and crop production. In F. W. T.Penning de Vries & H. H. Van Laar (Eds.), Simulation of plantgrowth and crop production (pp. 253–265). Wageningen: Pudoc.
Rabbinge, R., Jorritsma, I. T. M., & Schans, J. (1985). Damage com-ponents in powdery mildew in winter wheat. Netherlands Journalof Plant Pathology, 91, 235–247.
Rabbinge, R., & Rijsdijk, F. H. (1981). Disease and crop physiology: Amodeler’s point of view. In P. G. Ayres (Ed.), Effects of disease onthe physiology of the growing plant (pp. 201–220). Cambridge:Cambridge University Press.
Rabbinge, R., & Vereyken, P. H. (1980). The effect of diseases or pestsupon the host. Zeitschrift für Pflanzenkrankheiten und Pflanzen-schutz, 87, 409–422.
Rabbinge, R., Ward, S. A., & Van Laar, H. H. (Eds.). (1989). Simula-tion and systems management in crop protection. Wageningen:Pudoc.
Roland, J. (2011). Havre. i Sorter, SLU, Lanna försöksstation. http://www.slu.se/sv/fakulteter/nl/om-fakulteten/ovriga-enheter/falt-forsk/resultat/rapporter/.
Romig, R. W., & Calpouzos, L. (1970). The relationship between stemrust and loss in yield of spring wheat. Phytopathology, 60, 1801–1805.
Rossing, W. A. H. (1991a). Simulation of damage in winter wheatcaused by the grain aphid Sitobion avenae. 2. Construction andevaluation of a simulation model. Netherlands Journal of PlantPathology, 97, 25–54.
Rossing, W. A. H. (1991b). Simulation of damage in winter wheatcaused by the grain aphid Sitobion avenae. 3. Calculation ofdamage at various attainable yield levels. Netherlands. Journalof Plant Pathology, 97, 87–103.
Rossing, W. A. H., Daamen, R. A., & Hendrix, E. M. T. (1994).Framework to support decisions on chemical pest control underuncertainty, applied to aphids and brown rust in winter wheat.Crop Protection, 13, 25–34.
Rossing, W. A. H., Daamen, R. A., & Jansen, M. J. W. (1994a).Uncertainty analysis applied to supervised control of aphids andbrown rust in winter wheat. Part 2. Relative importance of differ-ent components of uncertainty. Agricultural Systems, 44, 449–460.
Rossing, W. A. H., Daamen, R. A., & Jansen, M. J. W. (1994b).Uncertainty analysis applied to supervised control of aphids andbrown rust in winter wheat. Part 1. Quantification of uncertaintyin cost-benefit calculations. Agricultural Systems, 44, 419–448.
Rouse, D. I. (1988). Use of crop-growth models to predict the effects ofdiseases. Annual Review of Phytopathology, 26, 183–201.
Rowe, W. D. (1980). Risk assessment approaches and methods. In G.Conran (Ed.), Society, technology, and risk assessment (pp. 3–29).New York: Academic.
Savary, S. (1994). Rice farmers’ background, perceptions of pests, andpest management actions: a case study in the Philippines. Nether-lands Journal of Plant Pathology, 3(99), 181–190.
Savary, S., Aubertot, J. N., & Duveiller, E. (2011). Why care aboutcrop loss? Symposium at the annual meeting of the AmericanPhytopathological Society: why do we care about crop losses?Honolulu, Hawai’i. Phytopathology, 101, S223.
Savary, S., Mila, A., Willocquet, L., Esker, P. D., Carisse, O., &McRoberts, N. (2011). Risk factors for crop health under globalchange and agricultural shifts: a framework of analyses using ricein tropical and subtropical Asia as a model. Phytopathology, 101,696–709.
Savary, S., Mille, B., Rolland, B., & Lucas, P. (2006b) Patterns andmanagement of crop multiple pathosystems. Special Issue: Plantdisease epidemiology: facing challenges of the 21st Century. S.Savary & B. M. Cooke (Eds.). European Journal of Plant Pa-thology, 115(1), 123–138.
Savary, S., Nelson, A., Sparks, A. H., Willocquet, L., Duveiller, E.,Mahuku, G., Forbes, G., Garrett, K. A., Hodson, D., Padgham, J.,Pande, S., Sharma, S., Yuen, J., & Djurle, A. (2011). Internationalagricultural research tackling the effects of global and climatechanges on plant diseases in the developing world. Plant Disease,95, 1204–1216.
Savary, S., Teng, P. S., Willocquet, L., & Nutter, F. W., Jr. (2006).Quantification and modeling of crop losses: a review of purposes.Annual Review of Phytopathology, 44, 89–112.
Savary, S., Willocquet, L., Elazegui, F. A., Castilla, N. P., & Teng, P. S.(2000). Rice pest constraints in tropical Asia: quantification ofyield losses due to rice pests in a range of production situations.Plant Disease, 84, 357–369.
Savary, S., Willocquet, L., Elazegui, F. A., Teng, P. S., Du, P. V., Zhu, D.,Tang, Q., Lin, X., Singh, H. M., & Srivastava, R. K. (2000). Ricepest constraints in tropical Asia: characterization of injury profiles inrelation to production situations. Plant Disease, 84, 341–356.
Savary, S., & Zadoks, J. C. (1992). Analysis of crop loss in the multiplepathosystem groundnut-rust-leaf spot. II. Study of the interactionbetween diseases and crop intensification in factorial designs.Crop Protection, 11, 110–120.
Schoeneweiss, D. F. (1975). Predisposition, stress and plant disease.Annual Review of Phytopathology, 13, 193–211.
Schoeny, A., Jeuffroy, M. H., & Lucas, P. (2001). Influence of take-allepidemics on winter wheat yield formation and yield loss. Phyto-pathology, 91, 694–701.
Schumann, G. L., & D’Arcy, C. J. (2009). Essential plant pathology(2nd ed.). St Paul: APS Press.
Sharma-Poudyal, D., & Chen, X. M. (2011). Models for predictingpotential yield loss of wheat caused by stripe rust in the U. S.Pacific Northwest. Phytopathology, 101, 544–554.
Silva, M. B., Vale, F. X. R., Zambolim, L., & Hau, B. (1998). Effects ofbean rust, anthracnosis and angular leaf spot on dry bean leaf area.Fitopatologia Brasileira, 23, 442–447.
Smil, V. (2000). Feeding the world: a challenge for the twenty-firstcentury. Cambridge: The Massachusetts Institute of TechnologyPress.
Snapp, S., & Heong, K. L. (2003). Scaling up and out. In B. Pound, S.Snapp, C. McDougall, & A. Brown (Eds.), Managing naturalresources for sustainable livelihoods - uniting science and par-ticipation (pp. 67–87). London: Earthscan Publications Ltd.
Solbakken, B. (2010) Norsk Mathavre. presentation to the Norskkornforum, 02/09/2010. (http://www.kornforum.no/media/ring/1043/ES/…/%20Solbakken.pdf).
Solh, M., Pandey, S., Lumpkin, T., & Coffman, R. (2011). Fight againstwheat rust needs sustained investment. http://medilinkz.org/africa/
Crop losses due to diseases
Author's personal copy
global/34246-fight-against-wheat-rust-needs-sustained-investment.html.
Soudais, J., Bonnemé, M. H., Buis, S., Czembor, J. H., Debaeke, P.,Domeradzka, O., Jørgensen, L. N., Mille, B., Raynal, H., Savary,S., Willocquet, L., & Aubertot, J. N. (2010). Evaluation ofWHEATPEST, a model predicting wheat yield losses caused byan injury profile in a given production situation. In Proceedings11th European Society of Agronomy Congress, Montpellier,France.
Strange, R. N., & Scott, P. R. (2005). Plant disease: a threat to globalfood security. Annual Review of Phytopathology, 43, 83–116.
Teng, P. S. (Ed.). (1987). Crop loss assessment and pest management.St Paul: APS Press.
Teng, P. S., Blackie, M. J., & Close, R. C. (1977). A simulationanalysis of crop yield loss due to rust disease. Agricultural Sys-tems, 2, 189–198.
Teng, P. S., & Gaunt, R. E. (1980). Modelling systems of disease andyield loss in cereals. Agricultural Systems, 6, 131–154.
Teng, P. S., & James, W. C. (2002). Disease and yield loss assessment.In J. M. Waller, J. M. Lenné, & S. J. Waller (Eds.), Plant Pathol-ogist’s pocketbook (3rd ed., pp. 25–38). Wallingford: CABIPublishing.
Teng, P. S., & Krupa, S. V. (Eds). (1980). Assessment of losses whichconstrain production and crop improvement in agriculture andforestry. Proceedings of the E. C. Stackman CommemorativeSymposium. St. Paul: University of Minnesota.
Teng, P. S., & Savary, S. (1992). Implementing the system approach inpest management. Agricultural Systems, 40, 237–264.
Teng, P. S., Savary, S., & Revilla, I. (1993). Systems of plant protec-tion. In D. J. Chadwick & J. Marsh (Eds.), Crop protection andsustainable agriculture (pp. 116–139). Chichester: Wiley.
Torhild Nilsen, A. (2011). Må importere 260 000 ton matkorn.NRK, Sørlandet, 19.09.2011. (http://www.nrk.no/nyheter/distrikt/sorlandet/1.7795982).
United Nations Environment Porgram (UNEP). (2007). Global Envi-ronment Outlook, GEO4. Environment for development. Valetta:Prgress Press Ltd.
United Nations, Department of Economic and Social Affairs. (2011).http://esa.un.org/unpd/wpp/index.htm. Accessed online October2011.
USDA. (2011). http://www.ers.usda.gov/Data/Wheat/YBtable21.asp.Van der Wal, A. F. (1975). An ecophysiological approach to crop
losses exemplified by the system wheat, leaf rust, and glumeblotch. PhD Thesis, Wageningen: Wageningen AgriculturalUniversity.
Van Keulen, H., Penning De Vries, F. W. T., & Drees, E. M. (1982). Asummary model for crop growth. In F. W. T. Penning de Vries &H. H. Van Laar (Eds.), Simulation of plant growth and cropproduction (pp. 87–97). Wageningen: Pudoc.
Vanderplank, J. E. (1963). Plant diseases: epidemics and control. NewYork: Academic.
Vermes, T. (2010). Må velge gift eller kornbål. In ABC Nyheter newspaper, 12/01/2010. http://www.abcnyheter.no/abc-penger/okonomi/101201/ma-velge-gift-eller-kornbal.
Waggoner, P. E., & Berger, R. D. (1987). Defoliation, disease, andgrowth. Phytopathology, 77, 383–398.
Walters, D. R., Havis, N. D., & Oxley, S. J. P. (2008). Ramularia collo-cygni: the biology of an emerging pathogen of barley. FEMSMicrobiology Letters, 279, 1–7.
Wiik, L. (2009). Yield and disease control in winter wheat in southernSweden during 1977–2008. Crop Protection, 28, 82–89.
Wiik, L., Olofsson, B., Johnsson, L., & Olvång, H. (1995). Sprutningmot skadesvampar i stråsäd med fungicider 1976–1992. Engl.Summary, SLU, Alnarp, Sweden, Rapport, 3, p. 115.
Wild, C. P., & Gong, Y. Y. (2010). Mycotoxins and human disease: alargely ignored global health issue. Carcinogenesis, 31, 71–82.
Willocquet, L., Aubertot, J.-N., Lebard, S., Robert, C., Lannou, C., &Savary, S. (2008). Simulating multiple pest damage in varying winterwheat production situations. Field Crops Research, 107, 12–28.
Willocquet, L., Elazegui, F. A., Castilla, N. P., Fernandez, L., Fischer,K. S., Peng, S. B., Teng, P. S., Srivastava, R. K., Singh, H. M.,Zhu, D. F., & Savary, S. (2004). Research priorities for rice pestmanagement in tropical Asia: a simulation analysis of yield lossesand management efficiencies. Phytopathology, 94, 672–682.
Willocquet, L., Nelson, A., Sparks, A. H., Laborte, A., & Savary, S.(2011). Crop losses in highly populated areas: a global perspec-tive with emphasis on rice in tropical Asia. American Phytopath-ological Society Annual Meeting, 6–10 August 2011, Honolulu,Hawai’i. Phytopathology, 101, S223.
Willocquet, L., Savary, S., Fernandez, L., Elazegui, F. A., Castilla, N.P., Zhu, D., Tang, Q., Huang, S., Lin, X., Singh, H. M., &Srivastava, R. K. (2002). Structure and validation of RICEPEST,a production situation-driven, crop growth model simulating riceyield response to multiple pest injuries for tropical Asia. Ecolog-ical Modelling, 153, 247–268.
Willocquet, L., Savary, S., Fernandez, L., Elazegui, F. A., & Teng, P. S.(2000). Development and evaluation of a multiple-pest, produc-tion situation specific model to simulate yield losses of rice intropical Asia. Ecological Modelling, 131, 133–159.
Wu, M. L., & Hanlin, R. T. (1992). Host-parasite relationships betweenthe fungus Leptosphaerulina crassisasca and peanut. CanadianJournal of Botany, 70, 1724–1733.
Yuen, J. E., & Hughes, G. (2002). Bayesian analysis of plant diseaseprediction. Plant Patholology, 51, 407–412.
Yuen, J. E., Twengström, E., & Sigvald, R. (1996). Calibration andverification of risk algorithms using logistic regression. EuropeanJournal of Plant Pathology, 102, 847–854.
Zadoks, J. C. (1967). Types of losses caused by plant diseases. In L.Chiarappa (Ed.), FAO papers presented at the symposium on croplosses (pp. 149–158). Rome: FAO.
Zadoks, J. C. (1985). On the conceptual basis of crop loss assessment: thethreshold theory. Annual Review of Phytopathology, 23, 455–473.
Zadoks, J. C. (1989). EPIPRE, a computer-based decision supportsystem for pest and disease control in wheat: Its developmentand implementation in Europe. In K. J. Leonard & W. E. Fry(Eds.), Plant disease epidemiology (Vol. II, pp. 3–29). New York:McGraw-Hill Publishing Company.
Zadoks, J. C. (2008). On the political economy of plant diseaseepidemics. Capita Selecta in historical epidemiology. Wagenin-gen: Wageningen Academic Publishers.
Zadoks, J. C., & Schein, R. D. (1979). Epidemiology and plant diseasemanagement. New York: Oxford University Press.
S. Savary et al.
Author's personal copy

Serge Savary Serge Savary re-cently returned to the French in-stitute for agricultural research,INRA, after several years spentat IRRI. His research focuses onbotanical epidemiology, risk as-sessment, crop health manage-ment, and research prioritization.His research involves simulationmodelling, epidemiological andcrop loss experiments, and multi-variate statistical analyses onlarge data bases. His interests fo-cus on the dynamic linkages be-tween crop health and production
situations, including the agronomic and the socio-economic contexts ofagricultural production, and their application for sustainable crop healthmanagement. He has conducted research at different locations on differ-ent topics, including diseases and pests on vegetables, legumes, andcassava in West Africa, coffee and bean diseases in Central America,and wheat and grapevine in France, aside from his work on rice health.
Andrea Ficke Andrea Ficke isa plant pathologist with Bio-forsk, Ås, Norway, where sheis involved in the DiseaseForecasting in Cereals projectof the Plant Health and PlantProtection Department. Theaim of the project is to developforecasting models to predictdevelopment of cereal diseasesin a specific field caused bycultivation practices and weath-er in collaboration with theNorwegian Extension Service,and to implement web-based
decision support system warning models for cereal diseases forfarmers’ and farm advisor’s use.
Jean-Noël Aubertot Jean-NoëlAubertot is an agronomist withINRA, where his focus mainly lieson the interface between changingand diverse cultural practices andplant disease epidemiology. He al-so is strongly involved in the mod-elling component of the InnovativeCrop Protection for SustainableAgriculture (PURE) Europeanproject http://www.pure-ipm.eu/project. He has also been one ofthe experts involved in the assess-ment of pesticide use in the Frenchagriculture.
Clayton Hollier Clayton Hollieris a Professor of Plant Pathologyat the Louisiana State UniversityAgricultural Center. He has a pri-mary role in extension, where heis in charge of plant pathologyeducational programs for rice,small grains, soybeans and feedgrains. His research concerns theassessment of crop losses to theCercospora complex in rice, toleaf rust in wheat, and to the foliarpathogens of maize. He alsoteaches a course in Plant DiseaseManagement.
Crop losses due to diseases
Author's personal copy