Crop Insurance for Adaptation to Climate Change in India · Crop Insurance for Adaptation to...
41
WORKING PAPERS Crop Insurance for Adaptation to Climate Change in India Mamata Swain ___________________________________________________________________ ASIA RESEARCH CENTRE WORKING PAPER 61
Transcript of Crop Insurance for Adaptation to Climate Change in India · Crop Insurance for Adaptation to...
WORKING PAPERS
Crop Insurance for Adaptation to Climate Change in India
Mamata Swain
___________________________________________________________________
ASIA RESEARCH CENTRE WORKING PAPER 61
1
Crop Insurance for Adaptation to Climate Change in India
July 2014
Dr Mamata Swain was a Commonwealth Fellow 2013 at the Asia Research Centre, LSE. All rights reserved. Apart from any fair dealing for the purpose of research or private study, or criticism or review, no part of this publication may be reproduced, stored in a retrieval system or transmitted in any form or by any means without the prior permission by the publisher or author (2014).
For further information, please contact: Asia Research Centre (ARC) London School of Economics & Political Science Houghton Street London WC2A 2AE United Kingdom E-mail: [email protected] www.lse.ac.uk/asiaResearchCentre
________________________________________________________________
ASIA RESEARCH CENTRE WORKING PAPER 61
*Professor of Economics, Ravenshaw University, Cuttack, Odisha, India-753003, E-mail: [email protected]
Crop Insurance for Adaptation to Climate Change in India
Mamata Swain*
Abstract
In India, agriculture is inherently a risky venture due to uncertainty in production and volatility in price, and more so in the context of increased climatic aberrations and globalisation. Therefore, there is a great need for crop insurance to provide economic support to farmers, stabilise farm income, induce farmers to invest in agriculture, reduce indebtedness and decrease the need for relief measures in the event of crop failure. This paper assesses the performance of the National Agricultural Insurance Scheme, NAIS (area based crop yield insurance) and the pilot Weather Based Crop Insurance Scheme, WBCIS (area based rainfall insurance) under implementation in the state of Odisha, the climate change hot spot of India. Analysing secondary time series data on performance of these two schemes and information gathered through focussed group discussion with insurance users, the paper concludes that WBCIS seems to perform better than NAIS because of higher coverage, larger percentage of farmers benefited, lower premium, faster and more frequent compensation payment and more transparency. But WBCIS covers only weather related risk and the sum assured and the compensation amount are lower. Therefore, instead of having two schemes, a hybrid product combining the advantages of both the schemes should be offered. To increase the penetration of insurance in rural areas, insurance companies may be asked to provide priority insurance services to farmers just like priority lending to agriculture sector. The public sector may address catastrophic risk and provide multi-peril insurance where subsidy requirement is high, but allow private sector to provide insurance products for less severe events and for individual independent idiosyncratic and localized risk. In the context of climate change with increasing agricultural risk, there is a need to redesign insurance products not merely as a risk transfer mechanism but as a potent device to reduce risk and crop loss by inducing desirable proactive and reactive responses in insurance users.
Key Words: Climate Change, Agricultural risk, Adaptation, Crop insurance, Odisha, India
3
1. Introduction
Climate change is a global environmental challenge that is threatening sustainable
development around the world. It is a continuing long-term process manifesting itself with
gradual increase in temperature, greater variability in rainfall, rise in sea level and increased
frequency, intensity and duration of extreme weather events, such as drought, flood, cyclone
and storm surge (IPCC, 2007). However, the impact of climate change is not uniform across
all sectors or all regions of the world. The low-latitude tropical countries in South Asia and
Africa are the worst sufferers because of their heavy dependence on agriculture, which is the
most climate sensitive sector. Agriculture dependent economies are invariably the low-
income countries and are thus most vulnerable to climate change due to their high exposure
with least adaptive capacity. Their high levels of susceptibility and low coping capacity have
been linked to a range of factors that include a high reliance on natural resources, low per
capita GDP and high poverty, limited ability to adapt financially and institutionally, and a
lack of safety nets (David and Twyman, 2005). Moreover, the poorest and most vulnerable
groups within the developing world will disproportionately experience the negative effects of
21st century climate change owing to their least coping capacity.
India being located in the low latitude region of South Asia is extremely vulnerable to
climate change because of its tropical climate, monsoon rain, long coast line, greater
dependence on agriculture, high incidence of poverty, low irrigation coverage and inadequate
resources and technology to combat climate change. Agriculture is the dominant sector in
Indian economy. Agriculture contributes 22 percent of GDP, provides 58 percent of
employment, sustains 69 percent of population, produces all the food and nutritional
requirements of the nation, important raw materials for some major industries, and accounts
for about 14 percent of exports. However, agricultural production is beset with various risk
factors due to occurrence of natural calamities like flood, drought, cyclone and storm surge,
infestation of plant diseases and pest attack, technology failure, irregularity in input supply
etc. Apart from production risk, there is also market/price risk owing to fluctuations in input
and output prices. Agriculture is inherently a risky venture due to its dependence on climatic
factors such as rainfall, humidity, sunshine and temperature which are difficult to predict and
beyond human control.
Risk in agriculture can thus be considered as an interaction of production risk and
price risk. Indian agriculture is now confronting two major threats: climate change and
economic globalization (O Brien et al, 2004). While climate change is accentuating the
4
production risk, globalisation has raised the price fluctuations. The combined effect of these
two stressors has created a crisis situation in Indian agriculture; as a result farmers’ suicides
are reported in most of the states indicating the failure of public action in handling the
aggravated risk situation. However, of all the risk factors in agriculture, weather variables are
considered to be the most important (Miranda and Vedenov, 2001).
Climate change has affected production risk in various ways such as: (i) increasing
the frequency of loss events, (ii) changing absolute and relative variability of losses, (iii)
shifting spatial distribution of losses, (iv) damage function increasing exponentially with
weather intensity, (v) abrupt and non-linear changes in losses, (vi) widespread geographical
simultaneity of losses, (vii) more single events with multiple correlated consequences, (viii)
more hybrid events with multiple consequences. Thus with climate change, the agricultural
risk will not only accentuate but also will become very complex and cumbersome process
necessitating devising new mechanisms and measures to address such risks.
Government takes many steps such as flood proofing, drought proofing, watershed
management, extension of irrigation facility, technology development, provision of
insurance, relief measures etc. to reduce production risk. At the same time farmers take a
wide variety of adaptive measures including ex-ante measures before the event of crop loss
and ex-post measures after the crop loss to cope with the production risk associated with
climatic aberrations. The ex-ante measures mostly aim at smoothing income, whereas the ex-
post measures are mostly consumption smoothing (Morduch, 1995). The income smoothing
measures include changes in cropping pattern, intercropping, mixed farming and sowing
drought/flood resistant seeds, increasing irrigation efficiency and income diversification. The
ex-post measures usually adopted by the farmers after the occurrence of the crop loss are
drawing down of savings, borrowing, sale of assets and migration. Crop insurance is a coping
mechanism and ex-ante adaptation measure by which risk is transferred from the insured to
the insurer. Crop insurance indemnifies the farmer if there is ultimate crop failure in spite of
all the precautionary measures taken by him. Insurance is a mechanism in which payment of
a certain small amount of premium ensures the receipt of a larger amount of compensation
contingent upon the occurrence of an uncertain loss event. Thus, insurance involves the
substitution of a small known cost (premium rate) for the possibility of a larger but uncertain
loss which will be compensated through indemnification. The basic principle underlying crop
insurance is that the loss incurred by a few is shared by many in an area. Also, losses incurred
in bad years are compensated from resources accumulated in good years (Dandekar, 1976).
5
Most of the Indian farmers are having small size of land holding and resource-poor.
Therefore, they are usually risk averse and in the face of production risk and absence of
insurance, they manage their farms so as to minimise loss rather than maximising profit.
Whereas specialisation may lead to efficiency in resource use due to economies of scale, the
Indian farmers diversify the cropping pattern and occupation to spread risk. This results in
inefficient allocation of resources and sub-optimal output. Once there is an extreme weather
event like drought and flood, which are catastrophic and covariate risk affecting all the
households in the region at same time, the informal risk sharing mechanisms mediated
through patron-client relationship become inoperative. On the other hand, in many
developing countries, formal credit and insurance markets are not adequately developed due
to asymmetric information, moral hazard, adverse selection problems which give rise to high
transaction and contract enforcement costs. In the absence of any dependable formal credit
and insurance facility, farmers borrow from informal moneylenders at exorbitant interest
rates; sell livestock, land and other durable assets and fall into the poverty trap (Barnett et al.
2008). In such a situation, there is a great need for crop insurance to provide economic
support to farmers, stabilise their farm income, induce them to invest in agriculture, reduce
indebtedness and decrease the need for relief measures. It is a better option for a farmer to
insure his crop and transfer the risk to the insurer rather than waiting for government relief
after the occurrence of the loss event, which is uncertain.
Realising the need for crop insurance as a safety net to farmers, Government of India
has implemented various crop insurance schemes from time to time (AICI, 2007). To
ameliorate the problems of information asymmetry, adverse selection and moral hazard
endemic in insurance markets (Goodwin, 2001), India has implemented area based index
insurance schemes. Since 1999, National Agricultural Insurance Scheme (NAIS) has been
implemented, which is an area based crop yield insurance scheme. However, the performance
of NAIS is not satisfactory due to its low coverage, poor financial performance and delay in
indemnity payment (Raju and Chand, 2008). Since 2007, the weather based crop insurance
scheme (WBCIS) has been launched on pilot basis in several states of India. If there is a
deficit or surplus in rainfall, the farmers insuring their crop in the defined area get
compensation. In comparison to crop yield, rainfall as an index is more objective, readily
available, easily verifiable and reliable. Thus, WBCIS is considered as an improvement over
NAIS due to its less administrative cost, more transparency and quicker payment of
compensation (Gine et al. 2008). The major drawback of WBCIS is the basis risk i.e. the
6
mismatch between the actual crop loss suffered by the insurance buyer and the indemnity
received on the basis of the weather index (Binswanger and Mkhize, 2012). Internationally
India covers the largest number of farmers under insurance which include more than 22
million farmers under NAIS and more than 3 million under pilot WBCIS during 2010.
However, the penetration of insurance is less than 20 per cent of total farming households,
which is a major concern for the government.
In the context of climate change, with increase in agricultural risk, the risk averse crop
producers will require more of insurance coverage at lower cost, while the insurers will have
a tendency to increase premium rate and reduce coverage. Innovative insurance products
need to be designed so as to balance the interests of both the insurer and the insured. The
insurer’s interest lies in the economic viability or profitability of the insurance product,
whereas the insured is concerned with his ability to pay the premium and the affordability of
the product. Therefore, both affordability and economic viability criterion need to be
synergised to offer new insurance products in the climate change scenario. Thus, there is a
need to redesign insurance products not only as a risk transfer mechanism but more
importantly as a risk reducing and mitigation measure by inducing desirable proactive and
reactive responses in the insurance users.
This paper attempts to compare the area based yield insurance scheme NAIS and the
rainfall insurance scheme WBCIS under implementation in Odisha, located in Eastern coast
of India and known as the climate change hot spot for its extreme vulnerability to climate
induced natural disasters. The paper examines the performance of these two schemes with
respect to their coverage, operational efficiency and financial performance and above all their
efficacy and effectiveness in managing risk in the climate change context. The paper uses
time series, district and region wise data on scheme performance collected from the office of
the regional office of the Agriculture Insurance Company of India, Bhubaneswar. Also,
information was collected from insurance users through focussed discussion in the field. The
objective of the paper is to suggest appropriate insurance policy and schemes for mitigating
and adapting to climate change risk. The paper is divided into six sections. Section 1 is the
introductory section emphasizing the increasing role of insurance in the context of climate
change in India and contains the objectives of the paper. Section 2 reviews existing literature
on implications of climate change for insurance industry. Section 3 delineates the climate
change scenario in Odisha and how does it affect agriculture. Section 4 explains the
operational mechanism of crop insurance schemes under implementation in Odisha. Section 5
7
compares the performance of NAIS with WBCIS. Section 6 contains some policy
recommendations for revamping the existing insurance schemes in the increasing risky
environment of changing climate.
2. Climate Change and Insurance: A Review
Many studies have been undertaken to examine the implications of climate change for
insurance industry. Climate change increases agricultural risk by increasing variability in
rainfall, causing water stress, enhancing susceptibility to plant diseases and pest attack and
more importantly raising frequency, intensity and duration of extreme weather events like
drought, flood, cyclone and storm surge. These risks are catastrophic and covariate in nature
and affect the whole population in the affected area at the same time. Therefore, these
correlated risks cannot be pooled and pose potential threats to insurance industry. Thus,
climate change may erode the insurability of many catastrophic risks. Climate change stands
as a stress test for insurance, the world’s largest industry with U.S. $4.6 trillion in revenues
(Mills, 2012). While climate change undermines the viability of the insurance industry, it also
offers enormous opportunities to innovate new insurance products to minimize the causes and
effects of climate change (Mills, 2007, 2012). Historically the insurance industry had played
a key role in the establishment of first fire department, enforcement of building construction
codes and vehicle safety testing.
With increase in exposure to risk, the insurance company may respond by increasing
premium, insisting greater deductibles, refusing to insure unless the insureds take risk
reducing measures, limiting maximum coverage, transferring risks to governments and global
reinsurers, withdrawing from certain exposures or abandoning the market altogether (Tucker,
1997; Mills, 2007). Duncan and Myres (2000) in their insurance model show that
catastrophic risk increases premium, reduces farmer coverage levels, and, under some
conditions, lead to a complete breakdown of the crop insurance market. Under such
circumstances, reinsurance can increase participation and it needs to be subsidized. The most
effective step is to forge public-private partnership and couple insurance schemes with
explicit measures to prevent disasters. The private sector can play a vital role in climate
insurance systems for developing countries.
The major objective of the insurance company is reducing risk to the insurance
company, i.e. the variability in its income from insurance business. The most effective way to
reduce risk would be to take action to limit the probability of global warming or reduce its
8
impact. Thus, where insurers tend to retreat in the face of climate change, insurance users will
encounter acute affordability issues restricting their access to this societal safety net. The
strategy should be to develop innovative products and systems for delivering insurance and
use of new technologies and practices that both reduce vulnerability to disaster-related losses
and support sustainable development (Mills, 2012).
With increase in the frequency and severity of natural disasters, the need for disaster
relief will increase manifold. The low-income countries find it difficult to finance economic
losses in the aftermath of natural disasters out of government budget revenues, due to the
limited tax base and considerable indebtedness of many of these nations. On the other hand,
international aid has not been able to keep pace with the growth in demand for natural
disaster relief. There is clear evidence that over-reliance on these traditional post-disaster
funding models may no longer be sustainable. There is a need for market based solution for
addressing such risks. Insurance has to play both adaptive and mitigative role. Mitigation i.e.
reduction in Green House Gas emission and reducing exposure to risk are more important
than adaptation. Insurance industry can do this by rewarding those who adopt risk-reducing
technologies and practices, using financial incentives in the form of lower premiums,
deductibles and higher sum assured etc. There are other methods as well, such as channelling
information to insurance customers and promoting improved building codes and land-use
planning (Mills, 2007). In the long term, insufficient adaptation in areas of rising risk could
threaten the concept of insurability itself, by limiting the availability and affordability of
private insurance coverage. Activities that incentivise and enable adaptation not only give
rise to commercial opportunities, but are increasingly necessary for the sustainability of the
insurance industry (Herweijer et al, 2009). The insurance industry is likely to face increased
regulatory scrutiny and action if it does not respond appropriately to the threat of rising
uninsurability. Forty leading international insurance companies have launched a Climate
Wise initiative to incorporate climate change in their investment strategy and they have
agreed to adopt the following activities (Kunreuther et al., 2013).
• Promote risk awareness and risk-reducing behaviour through risk-based pricing
• Develop insurance products and/or terms and conditions that incentivise risk
reduction
• Finance risk reduction/adaptation measures
• Risk education
• Fostering disaster resilience practices and technologies
9
• Establishing relationships with policy-makers, regulators, and the private sector.
However, many economists (Bayer and Mechler, 2006) are of the view that without
donor support, insurance is hardly affordable in highly exposed developing countries, which
helps to explain why only 1% of households and businesses in low-income countries, and
only 3% in middle-income countries, have catastrophe coverage, compared with 30% in high-
income countries. Climate change is a global phenomenon. The history of high carbon
growth and high emissions of developed countries has been major contributor to global
warming. Developing countries are most vulnerable to environmental hazards due to climate
change and have a low capacity to cope. Therefore, international support for climate risk
management, including proactive support for insurance instruments, is emerging on the
climate change adaptation agenda. Article 4.8 of the United Nations Framework Convention
on Climate Change (UNFCCC) calls upon Convention Parties to consider actions, including
insurance, to meet the specific needs and concerns of developing countries arising from the
adverse impacts of climate change (United Nations, 1992), and Article 3.14 of the Kyoto
Protocol explicitly calls for consideration of the establishment of insurance policies (United
Nations, 1997). These interventions include the provision of technical assistance, financial
subsidies and reinsurance. The Earth system, the global economy and the insurance systems
constitute a connected complex adaptive system (Phelan et al., 2011). Therefore, for using
insurance systems for adaptation to and mitigation of climate change risk which is a global
phenomenon, international collaboration and commitment are necessary.
Many vouch for increased government subsidy for agricultural insurance in the
context of increased agricultural risk due to climate change. However, Mcleman and Smit
(2006) show that government subsidization of insurance against risks associated with adverse
climatic conditions and extreme weather events such as flood damage, may lead to individual
decisions that actually increase the susceptibility of people, property and economic activities
to these risks. With examples from New Zealand they illustrate how the removal of subsidy
in crop insurance reduced the moral hazard and farmers took adaptive actions to reduce the
likelihood of crop losses. Also, removal of subsidy reduced physical hazard, as farmers
stopped cultivating marginal lands where production risk is more. However, in low-income
countries, where agriculture is the major source of livelihood of the small farming
community, subsidy is a requirement to increase the take up of insurance products. Many
studies on determinants of participation in insurance market reveal that mostly large, wealthy
and high income farmers buy insurance, whereas small and resource-poor farmers refrain
10
from buying due to their inability to pay the premium (Sherrick et al. 2003; Gine et al. 2008).
Therefore, in low-income countries, insurance premiums are usually subsidised for marginal
and small farmers to induce them to busy insurance, which they need most to stabilise their
income in the event of crop loss.
3. Climate Change Scenario and Agriculture in Odisha
Climate change is affecting the global commons adversely. During the past 100 years the
global mean temperature has increased by 0.74 0 C (IPCC, 2007) and is expected to rise
between 20 to 40 C during the twenty first century. There are also regional estimations. The
all-India annual mean surface temperature has increased by 0.510 C in the past 106 years
(Srinivasan, 2012). There is evidence that extreme rainfall events have increased. During the
past 100 years, global sea level has increased by around 170 mm. An increase of one metre in
sea level will inundate almost 6000 km2 land in India. Agricultural production in India will be
hampered by the rise in temperature, increase in heavy rainfall events, heat waves and coastal
inundation.
Kumar and Parikh (2001) have estimated the possible impacts of climate change by
using climate response function in the ‘best’ guess climate change scenario of a 20 C
temperature increase and a 7% increase in precipitation. They forecast that for the country as
a whole, the impacts due to the above scenario are adverse with a loss of about 8.4 per cent of
the total net-revenue from agriculture. Sanghi and Mendelsohn (2008) estimate that if
temperatures rise by 20 C with an 8% increase in precipitation, agricultural net revenue may
fall 12% in India. By using ORYZA1 and INFOCROP rice model, Krishnan et al. (2007)
predict that for every 1.8 0 C increase in temperature average yield decline will be 6.7% to
7.2% respectively, at the current level of CO2 (380 ppm) emission. There will be serious
consequences for food security in India (Fisher et al. 2001). IPCC predicts that crop yields
could increase up to 20 per cent in East and Southeast Asia while they could decrease up to
30 per cent in Central and South Asia by 2050. In tropical countries like India mainly kharif
rice, sugarcane and wheat yield could decrease due to decline in water availability and rise in
temperature.
Climate change is expected to negatively impact agriculture in warmer and lower
latitude regions including Africa and South Asia. Odisha spreads over geographical area of
1,55,707 km2, and extends from 17° 49` N to 22° 34`N latitude and from 81° 27` E to 87° 29`
longitude at the eastern coast of India in South Asia. The state has 480 km long coastline
along the Bay of Bengal. The state has tropical climate, characterized by high temperature,
11
high humidity, medium to high rainfall and short and mild winters. The temperature remains
high from March to May and rainfall is high from June to September. Major source of rainfall
is the south-west monsoon. Besides, the state also receives a small amount of rain from the
retreating monsoon in the month of October–November, when occasionally cyclone and
storms are experienced. The annual average rainfall of the state is 1482 mm. Nearly 80 per
cent of rainfall is received from June to September. There is wide variation in quantum of
rainfall temporally and spatially. Odisha state as a whole comes under the “Sub humid”
category, implying deficient winter rains.
The state is broadly divided into 4 physiographic zones namely Coastal Plains,
Central Table Land, Northern Plateau and Eastern Ghats. These are further sub-divided into
10 Agroclimatic Zones. Agricultural Development Indices computed for different districts of
Odisha indicate that the coastal plain districts are agriculturally more advanced followed by
the central table land area, eastern ghat and northern plateau in that order (Swain, 2002).
Agriculture is the backbone of the state contributing to 26 per cent of Net State
Domestic Product. Nearly 65 per cent of the total work force depends on agriculture to earn
their livelihood either as cultivators or agricultural labourers. Odisha is the poorest state in
India having 48 per cent of its population languishing below poverty line. In addition to this,
due to frequent occurrence of extreme weather events like flood, drought and cyclone the
incidence of transient poverty is also remarkably high.
A significant majority of farmers in Odisha mainly depend on rainfall for crop
cultivation. Irrigation facility has been provided to only 41 per cent of cultivable land. Thus
59 per cent of cultivable land is rainfed and exposed to the vagaries of monsoon, which cause
wide variations in crop output. On the whole, the state’s economy is extremely vulnerable to
climate change and catastrophic loss because of its tropical climate, monsoon rain, long coast
line, high dependence on agriculture, mass poverty and low irrigation coverage.
Going by the key parameters of climate like temperature and rainfall, the climate has
worsened in Odisha. The manifestations of climate change as observed in Odisha are drier
weather conditions, extended dry season, early end of rainy season, weak monsoon activity,
above normal air temperatures (Mujumdar and Ghosh, 2007). The mean maximum
temperature and the mean minimum temperature of Odisha show an increasing trend. It is
predicted that for the next two decades there will be warming of about 0.2° C. During dry
period i.e. September to February rainfall has been decreasing whereas during wet period i.e.
March to August rainfall has been increasing. As a result there has been an increase in
12
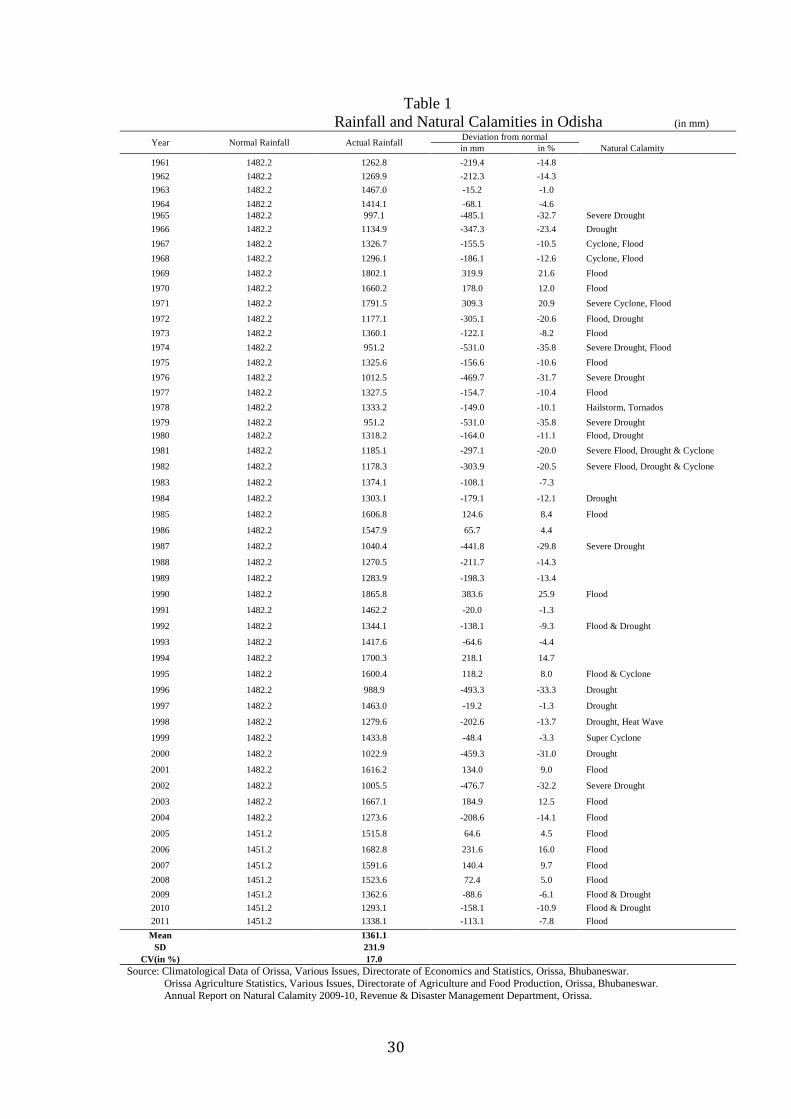
occurrence of drought and flood (Gulati et al., 2009). The average annual normal rainfall
shows a declining trend. This has decreased from 1502 mm during 1961-2000 to 1482 mm
after 2000. The variability of rainfall has increased (Table 1).
Natural calamities like drought, flood and cyclone occur in the state very frequently.
During the period 1961-2011, out of a total of 51 years only 11 years were normal years and
the rest 40 years were abnormal years with occurrence of natural disasters like drought, flood
and cyclone of varying intensity (Table 1). Coastal districts are prone to floods and cyclones,
while drought is particularly frequent and severe in the western districts of the state.
In recent years, an increase in the variability of precipitation, coupled with increase in
temperature due to global warming, has impacted the hydrological cycle in Odisha. This has
affected the timing and magnitude of floods, droughts, sediment discharge, and drainage of
river systems (Mujumdar and Ghosh, 2007); Patra et al., 2012). Global warming has
increased both coastal and inland flooding. Further it is predicted that lower rainfall and more
evaporation due to rise in temperature would cause less runoff, which would lead to
substantial decline in the availability of freshwater in the watersheds, decline of soil moisture
and increase in aridity level of hydrological zones. These will cause water stress and
accentuate drought conditions. The increased occurrence of these extreme weather events will
increase agricultural production risk making the sustenance of farming population quite
unstable.
According to Greenpeace (2008), the state’s fluctuating weather conditions observed
during the last two decades suggest that it is already grappling with climatic chaos. For more
than a decade now, it has experienced contrasting extreme weather conditions: from heat
waves to cyclones, from droughts to floods (CSE, 2008). Earlier Western Odisha was a
known calamity hotspot but now the coastal areas are also experiencing heat waves. A heat
wave in 1998 killed around 1500 people, mostly in coastal Odisha, a region otherwise known
for its moderate temperature. Bhubaneswar, the state capital of Odisha now has a mean
maximum temperature above 40˚ C which is comparable to Sambalpur located in the interior.
The 2001 flood was the worst ever flood recorded in Odisha in the past century, as 25 of the
30 districts were inundated affecting one-third of the state’s 30 million residents. Areas with
no history of floods such as districts in western Odisha were submerged. Ironically, Odisha
suffered one of its worst droughts in the same year. Due to climate change, the severity of
cyclone has also increased on the Odisha coast (Swain et al., 2006). In 1999, two cyclones hit
the state in quick succession. The second one was unparalleled in Indian history and named
13
as Super Cyclone because of amazingly high wind speed of 270-300 km per hour. The super
cyclone ravaged 12 coastal districts out of total 30 districts of Odisha. Recently, during 11
October 2013, a severe cyclonic storm named as Phailin created havoc in the state.
During the last two decades the natural calamities have not only become more
frequent and severe, but have hit areas that were never considered vulnerable. The state’s
economy has been ransacked by nature’s fury. The increased frequency, intensity and
duration of natural calamities have halted the development momentum of the state
government and the state has been pushed to reverse gear. Particularly the agriculture sector
has been the worst sufferer.
Foodgrain production trend in Odisha reveals that large variations in annual rainfall
and increased frequency of extreme weather events have caused significant instability in crop
yield and production. Table 2 shows the year wise data on area, yield and production of food
grains in Odisha for the period from 1970 to 2011. The co-efficient of variation for area, yield
and production is computed to be 6.9 per cent, 20.2 per cent and 23.9 per cent respectively.
Thus, the inter-temporal variations in yield and production are considerable. It may be seen
that in abnormal years the yield has been reduced substantially. During normal years, the
food grain production hovers around 8 million metric tonne. In the year 1999, when the super
cyclone had devastated twelve fertile coastal districts of the state, the food grain production
was only 5.6 million tonne. Likewise in the severe drought year 2002 the food grain
production declined to an alarmingly low level of 4 million tonne.
The impacts of climate change on agriculture are largely determined by the ability of
producers to access irrigation, alternate crop varieties, agronomic practices, explore
marketing opportunity, insurance and technology, or to discard agriculture for alternate
livelihoods. If farmers do not take adequate adaptive measures to combat climatic risk, there
may be substantial decline in crop production, farm income and greater production instability
and food insecurity.
4. Modality of Crop Insurance Schemes
Realising the importance of insurance as a risk management strategy, the Government of
Odisha has implemented different crop insurance schemes from time to time to stabilize farm
income and stimulate investment in agriculture (Swain, 2008). To start with Odisha
experimented by implementing some pilot crop insurance schemes during 1980-85. After the
launching of Comprehensive Crop Insurance Scheme (CCIS) by the Government of India in
14
1985, Odisha immediately implemented the scheme across the state in the same year kharif
season following guidelines of the Central Government. To reduce administrative costs the
scheme had a built-in crop insurance to cover farmers who have taken crop loans from
commercial banks, regional rural banks and the cooperatives. The basic objectives of the
scheme were (i) to provide a measure of financial support to farmers in the event of crop
failure as a result of drought, flood etc.; (ii) to restore the credit eligibility of farmers, after a
crop failure, for the next crop season; and (iii) to support and stimulate production of cereals,
pulses and oilseeds.
In this scheme the indemnification was on area basis and if there was a shortfall in
actual average yield per hectare of insured crop from the threshold yield, each of the insured
farmers growing that crop in the defined area was eligible for indemnity. This scheme was a
credit linked insurance scheme and is criticised as a loan insurance scheme as the scheme was
compulsory for loanee farmers and not available to non-loanee farmers, who self finance the
cultivation expenses. Also, the financial performance of the scheme was very poor, as
premium rates were highly subsidised and the claim-premium ratio was greater than one i.e.
unfavourable in most of the seasons (Swain, 2008). To improve the scheme performance, a
broad based National Agricultural Insurance Scheme (NAIS) has been implemented
since1999 rabi season. NAIS covered all food crops (cereals, millets and pulses), cotton,
sugarcane and potato in the 1st year and other annual commercial/horticultural crops in a
period of three years. All loanee farmers are compulsorily covered under the scheme. The
non-loanee farmers growing insurable crops can also opt for the scheme. The scheme
provides comprehensive risk insurance against yield losses due to natural fire, lightening,
storm, hailstorm, cyclone, typhoon, tempest, hurricane, tornado, flood, inundation and
landslide, drought, dry spells, pests, diseases etc. The sum insured extends to the value of the
threshold yield of the crop, with an option to cover up to 150 per cent of average yield of the
crop on payment of extra premium. The premium rate for kharif crops bajra and oilseeds is
3.5 per cent of sum insured and 2.0 per cent for other food crops. In the rabi season the
premium rate is 1.5 per cent for wheat and 2.0 per cent for other food crops and oilseeds.
Also, 50 per cent subsidy in premium is allowed to small and marginal farmers which will be
shared equally by the Government of India and State Government/Union Territory. The
subsidy shall be phased out in a period of 5 years. In Odisha during 2009, the subsidy has
been reduced to only 10 per cent. Like CCIS, NAIS operates on the basis of area approach.
However, there is provision that the scheme would operate on individual basis for localized
15
calamities such as hailstorm, landslides, cyclone and flood. NAIS is considered as an
improvement over CCIS for extending insurance facility to non-loanee farmers, setting higher
premium and including horticultural and commercial crops. However, NAIS failed to achieve
its objectives owing to its low coverage, poor financial performance and less effectiveness
(Sinha, 2004; Vyas and Singh, 2006; Kalavakonda and Mahul, 2005; Raju and Chand, 2008).
The major drawback of NAIS is delay in payment of compensation as the collection of crop
yield data through crop cutting experiment is a time consuming process. Moreover, as the
claims are equally shared by the central and state government on 50:50 basis, the insurance
company can disburse the compensation only after receiving from the central and state
government, which cause significant delay in settlement of claims (Mahul et al. 2012).
To reduce administrative cost of collecting data on yield and to make faster claim
payment in a transparent manner, during 2007 the Central Government launched Weather
Based Crop Insurance Scheme (WBCIS) on pilot basis. Following the guidelines of the
Central Government, since 2008 Odisha has been implementing WBCIS in few drought
prone blocks in western Odisha on pilot basis. Initially during 2008, WBCIS was available
only to non-loanee farmers. Since Kharif 2009, the scheme has been extended to both loanee
and non-loanee farmers for paddy crop. In the pilot areas, for the loanee farmers, WBCIS is
compulsory and NAIS is not available to them. But for the non-loanee farmers both NAIS
and WBCIS are available.
WBCIS as implemented in Odisha is nothing but rainfall insurance and under this
scheme the insured farmers shall be compensated against the likelihood of financial loss on
account of anticipated loss in crop yield resulting from adverse rainfall incidence such as
deficit rainfall and excess rainfall. In case of adverse weather incidence (AWI), all the
insured farmers in the reference unit area shall be deemed to have suffered the same level of
AWI and crop loss, and become eligible for the same level of pay-outs. Thus, in case of
WBCIS, if there is deficient or excess rainfall in the defined area, all the farmers cultivating
the notified crop within the defined area will be eligible for compensation at the same rate.
The premium rate for kharif paddy is 2.5 per cent of sum insured. WBCIS is considered an
improvement over NAIS because, in comparison to crop yield, rainfall as an index is easier to
measure objectively and process of data collection is more transparent and less time
consuming. As a result the administrative cost is low and this facilitates quicker payment of
indemnity to the buyers of insurance. WBCIS eradicates the problems of moral hazard and
adverse selection, as the insured farmer cannot influence the rainfall data to claim higher
16
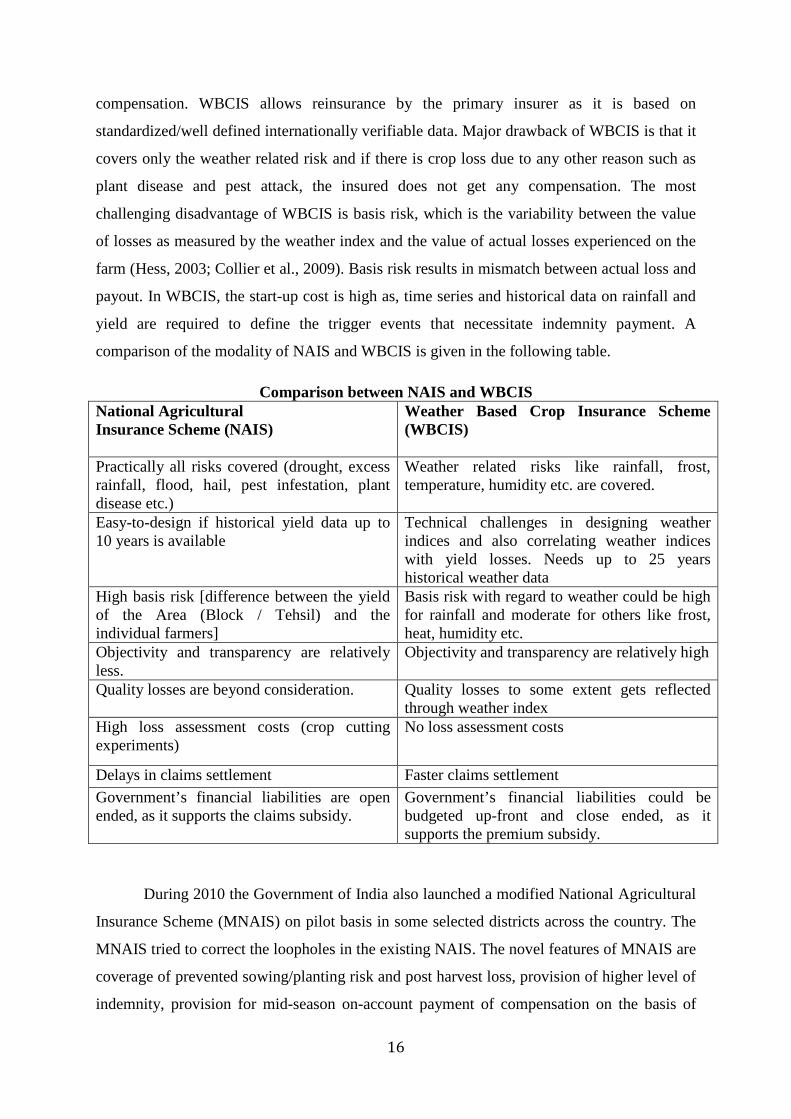
compensation. WBCIS allows reinsurance by the primary insurer as it is based on
standardized/well defined internationally verifiable data. Major drawback of WBCIS is that it
covers only the weather related risk and if there is crop loss due to any other reason such as
plant disease and pest attack, the insured does not get any compensation. The most
challenging disadvantage of WBCIS is basis risk, which is the variability between the value
of losses as measured by the weather index and the value of actual losses experienced on the
farm (Hess, 2003; Collier et al., 2009). Basis risk results in mismatch between actual loss and
payout. In WBCIS, the start-up cost is high as, time series and historical data on rainfall and
yield are required to define the trigger events that necessitate indemnity payment. A
comparison of the modality of NAIS and WBCIS is given in the following table.
Comparison between NAIS and WBCIS National Agricultural Insurance Scheme (NAIS)
Weather Based Crop Insurance Scheme (WBCIS)
Practically all risks covered (drought, excess rainfall, flood, hail, pest infestation, plant disease etc.)
Weather related risks like rainfall, frost, temperature, humidity etc. are covered.
Easy-to-design if historical yield data up to 10 years is available
Technical challenges in designing weather indices and also correlating weather indices with yield losses. Needs up to 25 years historical weather data
High basis risk [difference between the yield of the Area (Block / Tehsil) and the individual farmers]
Basis risk with regard to weather could be high for rainfall and moderate for others like frost, heat, humidity etc.
Objectivity and transparency are relatively less.
Objectivity and transparency are relatively high
Quality losses are beyond consideration. Quality losses to some extent gets reflected through weather index
High loss assessment costs (crop cutting experiments)
No loss assessment costs
Delays in claims settlement Faster claims settlement Government’s financial liabilities are open ended, as it supports the claims subsidy.
Government’s financial liabilities could be budgeted up-front and close ended, as it supports the premium subsidy.
During 2010 the Government of India also launched a modified National Agricultural
Insurance Scheme (MNAIS) on pilot basis in some selected districts across the country. The
MNAIS tried to correct the loopholes in the existing NAIS. The novel features of MNAIS are
coverage of prevented sowing/planting risk and post harvest loss, provision of higher level of
indemnity, provision for mid-season on-account payment of compensation on the basis of
17
expected crop loss, allowing private sector participation. In case of adverse seasonal
conditions during crop season, claim amount up to 25 percent of likely claims would be
released in advance subject to adjustment against the claims assessed on yield basis.
Recently during November 2013, in order to insulate farmers from farming risks, the
Ministry of Agriculture and Cooperation, Government of India has directed the state
governments to implement the new National Crop Insurance Programme (NCIP) with
immediate effect from the ongoing rabi season. This central scheme has been formulated by
merging the Pilot Weather Based Crop Insurance Scheme (WBCIS), Pilot Modified National
Agricultural Insurance Scheme (MNAIS) and Pilot Coconut Palm Insurance Scheme (CPIS)
to make it more farmer friendly.
Loanee farmers will be covered compulsorily under component scheme of NCIP
notified by the concerned state, while non-loanee farmers will choose either MNAIS or
WBCIS component. MNAIS and WBCIS will be extended to all the districts from rabi 2013-
14 and NAIS will be rolled back simultaneously. Private sector insurers with adequate
infrastructure and experience will be permitted to implement NCIP besides Agriculture
Insurance Company of India (AIC).
Unlike earlier, all farmers even including sharecroppers, tenant farmers, farmers
enrolled in contract farming, group of farmers serviced by fertilizer companies, pesticide
firms, crop growers, and self help groups are eligible for insurance cover. There will be three
indemnity levels instead of two- 70 per cent, 80 per cent and 90 per cent. The Threshold
yield (TY) or guaranteed yield for a crop in a Insurance Unit shall be the average yield of the
preceding 7 years excluding the year(s) in which a natural calamity such as drought, floods
etc. may have been declared by the concerned Government authority, multiplied by level of
indemnity. However, it may be ensured that at least 5 years' yield data is available for
calculating the threshold yield.
The insurance companies will be liable to make claim payment from their own
resources. Only the premium subsidy will be shared by state and central government on 50:50
basis. Besides, a catastrophic fund at the national level will be set up for providing
reinsurance cover to the insurance companies implementing the scheme. However this fund,
set up with equal contribution from the state and centre, can be used only in the event of
failure to procure reinsurance cover at competitive rates and if premium to claims ratio
exceeds 1:5. The novelty of the NCIS is that it incentivises risk reducing measures by
18
farmers by lowering the premium for the farmers who undertake soil and water conservation
measures. Premium structure would be worked out with a discount provision on the premium
in respect of a unit area where all farmers have adopted better water conservation and
sustainable farming practices for better risk mitigation.
In the National Action Plan on Climate Change (2008), under the national mission for
sustainable agriculture, emphasis has been laid on strengthening agricultural and weather
based insurance schemes to make agriculture resilient to climatic risk. Odisha is one of the
first states to formulate its Climate Change Action Plan for 2010-2015. However, in the
Action Plan, there is no mention about the role of insurance as a risk management strategy.
5. Performance of Crop Insurance Schemes
To evaluate the performance of NAIS and WBCIS under implementation in Odisha, I have
analysed district-wise and state time series data on area and number of farmers covered,
sum assured, premium collected, claims paid and farmers benefited, which have been
collected from the regional office of Agriculture Insurance Company of India Limited,
Bhubaneswar regional office. Also, I have used the information gathered through focussed
group discussion with insurance users, while undertaking a research project on crop
insurance with technical and financial support of South Asian Network for Development
and Environmental Economics (SANDEE).
Adoption of NAIS as risk management strategy
I have tried to examine to what extent the farmers in Odisha have adopted the crop
insurance schemes as a risk management tool. As NAIS is a universal scheme and under
implementation in all the districts of Odisha, to examine the extent of farmers’ participation,
I have considered the trend in area and number of farmers covered under this scheme. Over
the period 2000-2010, area under NAIS during both the kharif and rabi seasons show more
or less an increasing trend. This is shown in Table 3 and Figure 1. The total area under
NAIS has steadily increased from 0.86 million ha in 2000 to 1.06 million ha in 2010.
However, percentage of Gross Cropped Area under NAIS has marginally increased from
10.1 per cent in 2000 to 11.7 per cent during 2010 (Table 3). Thus, the penetration of NAIS
is abysmally low and slow, as nearly 90 per cent of gross cropped area in Odisha is not yet
covered under NAIS.
19
For loanee farmers, i.e. for the farmers taking loans from institutional sources such
as commercial banks, cooperatives and regional rural banks, NAIS is compulsory, but for
non-loanee farmers, it is voluntary. Therefore, a break-up analysis of area and farmers
covered according to loanee and non-loanee categories has been made to examine the
farmers’ adoption rate of NAIS voluntarily (Table 4). During 2010 kharif season, it is
observed that only one per cent of farmers are non-loanees and they account for 1.9 per cent
of total area under NAIS, which is really worrisome. On the top of it, the trend analysis
reveals that over the period 2000-2010 kharif seasons, the percentage of non-loanee farmers
availing NAIS has declined substantially from 11.9 per cent in 2000 to only one per cent in
2010 (Table 3). Likewise the percentage of area covered by non-loanee farmers has
declined from 10.5 per cent in 2000 to only 1.9 per cent in 2010. Thus the insurance scheme
has received scant acceptance by the non-loanee farmers, for whom insurance is voluntary. I
tried to explore the reasons for such non-adoption of NAIS through focussed group
discussion with the farmers and implementing agency personnel. It was discerned that the
cooperatives, regional rural banks and commercial banks extend insurance facility to loanee
farmers, for whom insurance is compulsory. But they are reluctant to provide insurance
service to non-loanee farmers due to additional work burden and shortage of manpower. In
spite of the provision for payment of service charges to the banks for providing crop
insurance (4% of the premium collected), the bankers complained that they do not get any
service charges from the Agriculture Insurance Company of India, and also the service
charge is quite nominal in comparison to the extra work burden of processing insurance
applications and providing insurance service..
Thus the insurance scheme has not received wide acceptance by the non-loanee
farmers, for whom insurance is voluntary. In the case of rabi season the participation of
non-loanee farmers is quite negligible and during 2010 it was nil (Table 5). Over the period
2000-2010 the percentage of non-loanee farmers and percentage of area show a decline
from 0.7 per cent in 2000 to zero per cent in 2010.
Thus the adoption rate of NAIS by non-loanee farmers is abysmally low and a
matter for great concern. A regionwise analysis reveals that the participation of non-loanee
farmers in NAIS is higher for agriculturally backward regions such as northern plateau and
central table land area, where agricultural risk is high. The percentage of area covered by
non-loanee farmers is only 0.3 in the most agriculturally advanced coastal region, whereas it
is as high as 12 per cent for the most agriculturally backward region of northern plateau.
20
This indicates that in risky areas, the non-loanee farmers are coming forward to insure their
crops (Table 6).
Categorywise analysis of adoption of NAIS scheme reveals that marginal and small
farmers owning land less than two hectares constitute 91% of total loanee farmers and 75 %
of non-loanee farmers (Table 7). Thus the percentage of other farmers that include the
medium and large farmers is higher for non-loanee farmers (25%) than that of loanee
farmers (9%), which indicate that more of big farmers voluntarily insure their crop.
NAIS covers various crops during both kharif and rabi season. In Odisha, during
2009-10 kharif season, out of total insured area of 0.98 million ha, paddy coverage was as
high as 0.95 million ha, accounting for nearly 97 percent of total cropped area. Other crops
covered were maize (15276 ha), cotton (8457 ha), ginger (1039 ha), turmeric (767ha) and
groundnut (140 ha). During rabi season also paddy is the most important insured crop
(1,12953 ha) followed by groundnut (13611 ha) and potato (8467ha). However, WBCIS
covers only paddy during kharif season and does not cover any crop during rabi season.
WBCIS has been designed only for paddy as paddy production crucially depends on
rainfall. NAIS covers all types of production risk including various natural calamities, pest
attack and plant diseases, WBCIS covers only crop loss due to rainfall deficit or excess.
Farmers Benefited under NAIS
During 2000-2010 kharif seasons, it is observed that the percentage of farmers benefited
from crop insurance in terms of receiving compensation varies substantially ranging from
1.7 per cent in 2001 to 69.7 per cent in 2002 (Table 8). During abnormal years of flood and
drought the number of farmers benefited is very large. During rabi seasons the percentage
of farmers benefited ranges from zero per cent in the year 2000 to 27.4 per cent in 2009.
A region wise analysis of percentage of farmers benefited from NAIS during 2009
kharif season in the case of loanee farmers reveals that it is the highest i.e. 31.3 per cent for
the agriculturally most backward region of Northern Plateau and the least i.e.0.07 per cent
for the agriculturally advanced coastal region (Table 9). Similar finding is obtained in the
case of non-loanee farmers. However, in the case of non-loanee farmers the percentage of
farmers benefited is higher than that of loanee farmers for the state as a whole and also in
northern plateau and central table land area. This shows that more of risky farmers
21
voluntarily come forward to insure their crops and thereby get compensation in the event of
crop failure.
Financial Performance of NAIS
To assess the financial performance of NAIS in Odisha, the claim-premium ratio was
computed by dividing the indemnity claim or compensation payment by insurance premium
collected. If the claim-premium ratio exceeds one, it indicates financial loss on the part of
the insurer in insurance business. During the 2000-2009 kharif seasons, it is observed that
the claim-premium ratio is unfavourable i.e. greater than one for 6 years and favourable for
only 4 years (Table 10). The claim-premium ratio ranges from 0.15 in 2005 kharif season to
9.4 in 2000 kharif season. But for 2000-2009 rabi seasons, claim premium is favourable for
9 years and unfavourable only for one year.
A region wise analysis of claim-premium ratio unfolds that it is higher in the case of
agriculturally backward region and for non-loanee farmers (Table 11). There is negative
association between extent of agricultural development of the region and claim-premium
ratio.
Comparison of NAIS and WBCIS Performance
WBCIS has been implemented in Odisha on pilot basis since 2008 and covers only kharif
paddy crop. A comparison of performance of NAIS and WBCIS reveals that percentage of
non-loanee farmers and area covered by non-loanee farmers are higher in case of WBCIS,
which implies that WBCIS is more popular than NAIS (Table 12). In the case of WBCIS,
during 2008 the scheme was available to only non-loanee farmers, therefore, all the farmers
buying insurance were non-loanees. During 2009 and 2010 kharif season, the percentage of
non-loanee farmers was 8.8 per cent and 2.9 per cent respectively (Table 12). Thus the
percentage of non-loanees is higher in both the years compared to NAIS, which was only 3
per cent and 1 per cent respectively. Likewise percentage area covered by non-loanees was
higher in both the years in comparison to NAIS. Thus the adoption rate is higher in WBCIS
than NAIS, because of its transparency and quicker payment of indemnity. The claim-
premium ratio is also higher in case of WBCIS indicating more compensation payment to
insurance users in comparison to their premium payment.
Percentage of farmers benefited was quite higher for WBCIS than that of NAIS. For
NAIS, it ranged from only 9.1 per cent in 2008 to 19.3 in 2010. In case of WBCIS it ranged
22
from 18.6 per cent in 2010 to cent per cent in 2008 (Table 13). The premium paid per
hectare was higher in case of NAIS in comparison to WBCIS. It is observed that insured
area per farmer was higher in case of WBCIS in comparison to NAIS for all the kharif
seasons. However, the sum assured per hectare was more in the case of NAIS.
Thus, WBCIS seems to perform better than NAIS because of more coverage, higher
percentage of non-loanee farmers, higher percentage of farmers benefited, less premium and
higher claim-premium ratio (Table 13). However, as we have analysed data only for three
years, the findings are not conclusive and may be considered as indicative. To further
investigate the matter; during field survey we have examined the farmers’ views on the
efficacy of both the schemes. While discussing with the insurance users, they articulated that
the frequency of getting compensation is more in the case of WBCIS but the compensation
amount is greater in the case of NAIS. The farmers expressed that since last 8 years, most of
the farmers in the region did not get any indemnity under NAIS, whereas most of the farmers
under WBCIS, received compensation twice since 2009.
6. Revamping Crop Insurance Schemes
On the basis of the foregoing discussion in the preceding sections, the followings suggestions
are made to revamp the existing crop insurance schemes in Odisha in Eastern India to
increase its operational efficiency and effectiveness as a risk management strategy in the
context of increasing agricultural risk due to climate change.
Promotion of Crop Insurance as a Merit Good
To increase the adoption rate of crop insurance the government has a major role to play.
Insurance may be considered as a merit good as it stabilises farm income and provides
economic support to farmers in the event of crop loss due to occurrence of unforeseen
contingencies such as natural calamities, pest attack and plant diseases, which are non-
preventable risks. Recently, widespread suicides by farmers in India speak of the disastrous
consequences of agricultural risks on farmers’ lives and well being. The government has to
rise to the occasion and find a market based solution to this socio-economic problem by
developing credit and insurance markets. Various insurance products catering to the need of
different crops, locations and varied risk factors may be provided. Government is required to
promote crop insurance by various methods such as creating awareness about the merits of
insurance, linking credit with insurance, tying up insurance with other input supply services
23
(seed, fertiliser, irrigation), subsidising insurance and providing reinsurance facility and
technical assistance. Also data system on rainfall and yield should be developed to help in
designing insurance products. Research on agro-meteorological issues such as correlation
between various weather parameters and crop yield in different agro-climatic regions should
be encouraged, which will help in designing appropriate weather based crop insurance
products. An enabling regulatory and legal environment should be created to promote crop
insurance.
Participatory design of Insurance Products
In case of WBCIS, the design of insurance product is a very difficult and cumbersome
process. For defining the trigger events for crop loss, local knowledge and experience are
very much necessary. The product will vary according to crop, seed variety, soil-climatic
condition and micro-environment. In such case the design of the product should be done in a
participatory manner by taking into account the views of the progressive or contact farmers in
the area. So that farmers will not resist the schemes, if the indemnity payment does not match
their crop loss.
The main drawback of NAIS is delay in compensation payment, because collection of
data on area yield rate on the basis of which compensation will be calculated is a time
consuming process. Government is required to streamline the procedure and make it
transparent to reduce the scope for manipulation. The farmers’ representatives should remain
present during the crop-cutting experiments and estimation of crop yield to win the trust of
the farmers in the yield data on the basis of which the indemnity will be paid to them in case
of crop failure.
Integration of NAIS and WBCIS
NAIS is a multi-peril area based crop yield insurance scheme and it covers not only weather
related risk such as drought, flood, storm etc. but also plant diseases and pest attack.
Compensation is paid on the basis of actual crop loss in the defined area. The major
drawback of this scheme is delay in claim settlement due to time consuming process of
collection of yield data.
On the other hand, WBCIS covers only rainfall related risk and the compensation is
paid on the basis of deficit or excess rainfall which is considered as a correlate or proxy of
crop loss. The indemnity is paid quickly after receiving the rainfall data from meteorological
stations. However, in the case of WBCIS, the basis risk is high if there are factors other than
24
rainfall that affect crop yield, faulty design of the product in defining the trigger event and
inaccurate measurement of local rainfall due to distant location of the weather measuring
device.
Therefore, both the schemes have advantages and disadvantages. The better option
may be to integrate both the schemes to take advantage of merits of both. To remove the basis
risk, the indemnity may be calculated on the basis of actual crop loss data. However, to save
delay in payment to wait for yield data after harvest, payout may be made on the basis of
indemnity calculated by using rainfall data and the remaining amount may be released on the
basis of actual crop loss data. Recently launched National Crop Insurance Programme
(NCIP) includes both the schemes as alternatives, but what I am suggesting is to blend both
the schemes and provide a hybrid insurance product to improve its operational efficiency.
This insight was gained during my field survey, when most of the NAIS users in the study
area showed their preference for WBCIS and the WBCIS users revealed their liking for
NAIS.
Public and Private Participation The new NCIP has allowed private insurance companies to participate in NAIS as well as
WBCIS. In the context of climate change with increased covariate catastrophic risk, the
private companies may not show their interest in offering crop insurance. Therefore, it is
necessary to make it mandatory for all private and public insurance companies to extend
certain percentage of their insurance business to cover crop insurance. Like priority lending
to agriculture sector, insurance companies may be asked to provide priority insurance
services to agriculture sector and this may be considered as social responsibility of the
insurance sector. The public sector may address catastrophic risk and provide multi-peril
insurance where subsidy requirement is high, but allow private sector to provide insurance
products for less severe events and for individual independent idiosyncratic and localized
risk. Government should provide technical guidance, subsidy, guarantee and reinsurance
facility to attract the private insurers to this important sector (Marcel et al. 2002). Regulation
and strict scrutiny of activities of private insurance companies may be done by the regulatory
authority. There should be proper mechanism for redressal of grievances of insurance
users/buyers/adopters.
25
Financing of Insurance and Reinsurance
Many argue that in the face of limited resources, government has to allocate resources to
productive and income raising activities like irrigation, rural infrastructure, instead of
pumping money to insurance which is so to say an income transfer mechanism. However,
insurance induces farmers to adopt modern method of production, apply fertiliser, cultivate
HYV seeds and more importantly makes agriculture dependable. To make agriculture viable
and a cherished occupation, actions on all fronts and an integrated approach is necessary.
Moreover, to make insurance business viable, reinsurance facility may be provided at state,
country and international level. In the NCIP, there is a provision for creation of Insurance
Fund at the centre with 50:50 contributions from centre and state. However, the international
reinsurance companies have a larger role to play. In the climate change scenario, they also
face resource constraint and insolvency. Therefore, there is a need for common commitment
at the international level to meet such eventualities. This has already been accepted by
UNFCCC and Kyoto protocol.
Role of Insurance in Climate Change Mitigation and Adaptation
The insurance industry can help both in mitigation and adaptation to climate change by
inducing proper proactive and reactive responses in insurance users. The mitigation responses
include incentivising use of clean technology, climate friendly cropping pattern, promoting
organic farming and less energy intensive agriculture. Proactive adaptation responses include
encouraging cultivation of drought resistant variety crops and seed variety, pest management,
seed treatment, using efficient irrigation method etc. Discount in premium may be given for
taking risk reducing action such as water conservation and sustainable farming practices. The
insurance industry can induce desirable reactive responses after the occurrence of crop loss
by making quick payment of indemnity, so that insurance buyers do not deplete their
productive assets and fall into poverty trap. Also mid-season payment may be made if there is
clear indication of ultimate crop loss due to severe drought condition or excess rainfall at
crucial growth stage of crop.
Integration of Microfinance and Microinsurance
When formal financial institutions like commercial banks, regional rural banks and
cooperatives did not come forward to meet the credit needs of the poor in rural areas due to
high transaction cost, the microfinance institutions (MFIs) through the formation of self-help
groups and group lending came forward to provide credit to the rural poor. Likewise, now
26
there is a need to create awareness about the benefits of insurance in rural areas and the MFIs
can play a major role in this due to their easy access to farmers through their grass-root level
developmental activities. The micro-enterprise activities financed through MFIs can be
insured, and will help in proactively managing enterprise loss. Integration of micro-finance,
micro-insurance and micro-enterprise will go a long way in solving the problem of
unemployment and poverty in rural areas.
ACKNOWLEDGEMENTS
I am extremely grateful to Ruth Kattumuri for her supervision and constant encouragement that helped me to improve the paper. I thank the Commonwealth Scholarship Commission, UK for awarding the Commonwealth Academic Fellowship that enabled me to pursue my research work in London. I duly acknowledge the technical and financial support provided by the South Asian Network for Development and Environmental Economics (SANDEE) for completing a research project on Crop Insurance. Some of the research findings of this project have been used in this paper. I thank Jean-Marie Baland, SANDEE advisor for his guidance and intellectual support.
REFERENCES
Agricultural Insurance Company of India Limited (AICI). (2007). Crop Insurance in India. Barnett, B.J., C.B. Barrett, and J.R. Skees. (2008). ‘Poverty Traps and Index-based Risk Transfer Products’, World Development 36:1766-1785. Bayer Joanne Linnerooth and Reinhard Mechler. (2006). ‘Insurance for assisting adaptation
to climate change in developing countries: a proposed strategy’, Climate Policy, Vol. 6, pp. 621–636.
Binswanger Hans P. –Mkhize. (2012).Is There Too Much Hype about Indexbased Agricultural Insurance?, The Journal of Development Studies, Vol.48, No.2, pp. 187-200.
Centre for Science and Environment (CSE). 2008. Climate Change and Orissa, Orissa Factsheet.
Collier Benjamin, Jerry Skees and Barry Barnett. (2009). ‘Weather Index Insurance and Climate Change: Opportunities and Challenges in Lower Income Countries’, Geneva Papers, No.34, pp. 401-424.
Dandekar, V.M. (1976). ‘Crop Insurance in India’, Economic and Political Weekly, Vol. 11,
No. 26. David S.G. Thomas and Chasca Twyman. (2005). ‘Equity and justice in climate change
adaptation amongst natural-resource-dependent societies’, Global Environmental Change, Vol. 15, pp. 115–124.
27
Duncan, John and Robert J.Myers (2000). ‘Crop Insurance under Catastrophic Risk’, American
Journal of Agricultural Economics, Vol.82, No.4, pp842-855. Fisher, Gunther, M. Shah, Harrij van Velthuizen and Freddy O Nachtergaele. (2001). Global
Agro-ecological Assessment for Agriculture in the 21st Century, International Institute for Applied Systems Analysis, Austria.
Gine Xavier, Roberts Townsend and James Vickery. (2008). Patterns of Rainfall Insurance Participation in Rural India, The World Bank Economic Review, pp.1-28, October 22.
Goodwin, Barry K. (2001). Problems with Market Insurance in Agriculture, American
Journal of Agricultural Economics, 83(3), 643-649. Greenpeace (2008). Climate change: A Case Study of Orissa.
Gulati Aastha, Palak Gupta, Meenakshi Jha, P. Parth Sarthi and Kumar Vishal. (2009).
‘Impact of Climate Change, Variability, and Extreme Rainfall Events on Agricultural Production and Food Insecurity in Odisha’, ISPRS Archives XXXVIII-8/W3 Workshop Proceedings: Impact of Climate Change on Agriculture, in Sushma Panigrahy, Shibendu Shankar Ray and Jai Singh Parihar (eds.), pp. 371-75.
Herweijer Celine, Nicola Ranger and Robert E.T. Ward. (2009). ‘Adaptation to Climate
Change: Threats and Opportunities for the Insurance Industry’, The Geneva Papers, 34, pp.360-380.
Hess, Ulrich. (2003). Innovative Financial Services for Rural India: Monsoon-Indexed
lending and Insurance for Smallholders, Agricultural & Rural Development Working Paper 9,World bank.
IPCC. (2007). Climate Change, Impacts, Adaptation and Vulnerability, Contribution of
Working Group III to the Fourth Assessment Report of the Intergovernmental Panel on Climate Change, Cambridge University Press.
Kalavakonda Vijay and Olivier Mahul (2005). Crop Insurance in Karnataka, World Bank
Policy Research Working Paper 3654. Krishnan P., D.K. Swain, Chandra Bhaskar, S.K. Nayak and R.N. Dash. (2007). ‘Impact of
elevated CO2 and temperature on rice yield and methods of adaptation as evaluated by crop simulation studies’, Agriculture, Ecosystems and Environment, Vol. 122, pp. 233–242
Kumar, K.S.Kavi and Jyoti Parikh. (2001). ‘Indian agriculture and climate sensitivity’, Global Environmental Change, Vol. 11, pp. 147–154. Kunreuther Howard, Erwann Michel-Kerjan and Nicola Ranger (2013). ‘Insuring future climate catastrophes’, Climatic Change, 118:339–354.
28
Marcel A.P.M., Van Asseldonk, Miranda P.M. Meuwissen, and Ruud B.M. Huirne (2002). ‘Belief in Disaster Relief and the Demand for a Public-Private Insurance Program’, Review of Agricultural Economics, Vol.24, No.1, pp.196-207.
Mcleman, Robert and Barry Smit. (2006). ‘Vulnerability to Climate Change Hazards and
Risks: Crop and Flood Insurance’, The Canadian Geographer, Vol. 50, No.2, pp.217-226.
Mills Evan. (2007). ‘Synergisms between climate change mitigation and adaptation: an
insurance perspective’, Mitigation and Adaptation Strategy for Gloal Change, Vol.12, pp. 809–842.
Mills Evan. (2012). ‘The Greening if Insurance’, Science: Policy Forum, Vol. 338, 14
December, pp. 1424-25. Morduch, J. (1995). ‘Income Smoothing and Consumption Smoothing’. Journal of Economic
Perspectives, 9 (summer), 103–14. Miranda, Mario and Dmitry V. Vedenov. (2001). ‘Innovations in Agricultural and Natural
Disaster Insurance’, American Journal of Agricultural Economics, 83(3), pp.650-655. Mujumdar, P. P. and S. Ghosh. (2007). ‘Assessment of Impact of Climate Change on
Precipitation at Regional Scale’, Jalvigyan Sameeksha, Vol.22, pp.21-36.
O’Brien Karen, Robin Leichenko, Ulka Kelkar, Henry Venema, Guro Aandahl, Heather Tompkins, Akram Javed, Suruchi Bhadwal,Stephan Barg, Lynn Nygaard, Jennifer West (2004). ‘Mapping vulnerability to multiple stressors: climate change and globalization in India’, Global Environmental Change, Vol.14, pp. 303–313.
Patra Jagadish P., A. Mishra, R. Singh and N. S. Raghuwanshi. (2012). ‘Detecting rainfall trends in twentieth century (1871–2006) over Odisha State, India’, Climatic Change, 111, pp. 801–17.
Phelan Liam, Ros Taplin, Ann Henderson Sellers and Glenn Albrecht. (2011). ‘Ecological
Viability or Liability? Insurance System Responses to Climate Risk’, Environmental Policy and Governance, Published online in Wiley Online Library.
Raju, S.S. and Ramesh Chand. (2008), Agricultural Insurance in India: Problems and
Prospects, National Centre for Agricultural Economics and Policy Research, Working Paper No.8.
Raju, S.S. and Ramesh Chand. (2008). ‘A Study on the Performance of National Agricultural
Insurance Scheme and Suggestions to Make it More Effective’, Agricultural Economics Research Review, Vol. 2, January-June, pp 11-19.
Sanghi Apurva and Robert Mendelsohn. (2008).‘The impacts of global warming on farmers
in Brazil and India’ Global Environmental Change, Vol. 18, pp. 655–665.
29
Sherrick, Bruce J., Peter J.Barry, Gary D.Schnitkey, Paul N.Ellinger and Brian Wansink (2003). ‘Farmers’ Preferences for Crop Insurance Attributes’, Review of Agricultural Economics, Vol.25, pp.415-429.
Sinha Sidharth. (2004). ‘Agriculture Insurance in India: Scope for Participation of Private Insurers’, Economic and Political Weekly, 39(25), 2605-11.
Srinivasan, J. (2012).‘Impact of Climate Change on India’, in Navroz K. Dubash (ed) (2012)
Handbook of Climate Change and India: Development, Politics and Governance, Earthscan: London and New York.
Swain Mamata. (2002). ‘Performance of Agriculture in Orissa: Intertemporal and Spatial
Variaton’, Chapter IV in Orissa State Development Report, Planning Commission, New Delhi.
Swain Mamata, M. Swain and R.H. Sahoo. (2006). Disaster and Gender: Impact of Super Cyclone on Life and Livelihood of Women, New Delhi: Serials Publisher.
Swain Mamata. (2008). Agricultural Risk and Crop Insurance in a Globalised Economy, Man & Development, Vol. 30, No.3, pp. 107-28.
Swain Mamata (2009). ‘Impact of Climate Change on Agriculture in Odisha: Adaptation and
Mitigation’, in R.K.Panda (ed.) Odisha’s Economic Development: Experiences and Expectations, New Delhi: Serials Publisher.
Tucker Michael. (1997). ‘Climate change and the insurance industry: the cost of
increased risk and the impetus for action’, Ecological Economics, Vol. 22, pp. 85–96 Vyas, V.S. and S. Singh. (2006). Crop Insurance in India: Scope for Improvement, Economic
and Political Weekly, Vol.41(43&44), 4585-94.
30
Table 1 Rainfall and Natural Calamities in Odisha (in mm)
Year Normal Rainfall Actual Rainfall Deviation from normal in mm in % Natural Calamity
1961 1482.2 1262.8 -219.4 -14.8 1962 1482.2 1269.9 -212.3 -14.3 1963 1482.2 1467.0 -15.2 -1.0 1964 1482.2 1414.1 -68.1 -4.6 1965 1482.2 997.1 -485.1 -32.7 Severe Drought 1966 1482.2 1134.9 -347.3 -23.4 Drought 1967 1482.2 1326.7 -155.5 -10.5 Cyclone, Flood 1968 1482.2 1296.1 -186.1 -12.6 Cyclone, Flood 1969 1482.2 1802.1 319.9 21.6 Flood 1970 1482.2 1660.2 178.0 12.0 Flood 1971 1482.2 1791.5 309.3 20.9 Severe Cyclone, Flood
1972 1482.2 1177.1 -305.1 -20.6 Flood, Drought 1973 1482.2 1360.1 -122.1 -8.2 Flood 1974 1482.2 951.2 -531.0 -35.8 Severe Drought, Flood 1975 1482.2 1325.6 -156.6 -10.6 Flood 1976 1482.2 1012.5 -469.7 -31.7 Severe Drought 1977 1482.2 1327.5 -154.7 -10.4 Flood 1978 1482.2 1333.2 -149.0 -10.1 Hailstorm, Tornados 1979 1482.2 951.2 -531.0 -35.8 Severe Drought 1980 1482.2 1318.2 -164.0 -11.1 Flood, Drought 1981 1482.2 1185.1 -297.1 -20.0 Severe Flood, Drought & Cyclone
1982 1482.2 1178.3 -303.9 -20.5 Severe Flood, Drought & Cyclone
1983 1482.2 1374.1 -108.1 -7.3 1984 1482.2 1303.1 -179.1 -12.1 Drought
1985 1482.2 1606.8 124.6 8.4 Flood
1986 1482.2 1547.9 65.7 4.4 1987 1482.2 1040.4 -441.8 -29.8 Severe Drought
1988 1482.2 1270.5 -211.7 -14.3 1989 1482.2 1283.9 -198.3 -13.4 1990 1482.2 1865.8 383.6 25.9 Flood
1991 1482.2 1462.2 -20.0 -1.3 1992 1482.2 1344.1 -138.1 -9.3 Flood & Drought
1993 1482.2 1417.6 -64.6 -4.4 1994 1482.2 1700.3 218.1 14.7 1995 1482.2 1600.4 118.2 8.0 Flood & Cyclone
1996 1482.2 988.9 -493.3 -33.3 Drought
1997 1482.2 1463.0 -19.2 -1.3 Drought
1998 1482.2 1279.6 -202.6 -13.7 Drought, Heat Wave
1999 1482.2 1433.8 -48.4 -3.3 Super Cyclone
2000 1482.2 1022.9 -459.3 -31.0 Drought
2001 1482.2 1616.2 134.0 9.0 Flood
2002 1482.2 1005.5 -476.7 -32.2 Severe Drought
2003 1482.2 1667.1 184.9 12.5 Flood
2004 1482.2 1273.6 -208.6 -14.1 Flood
2005 1451.2 1515.8 64.6 4.5 Flood
2006 1451.2 1682.8 231.6 16.0 Flood
2007 1451.2 1591.6 140.4 9.7 Flood 2008 1451.2 1523.6 72.4 5.0 Flood 2009 1451.2 1362.6 -88.6 -6.1 Flood & Drought 2010 1451.2 1293.1 -158.1 -10.9 Flood & Drought 2011 1451.2 1338.1 -113.1 -7.8 Flood Mean 1361.1
SD 231.9 CV(in %) 17.0
Source: Climatological Data of Orissa, Various Issues, Directorate of Economics and Statistics, Orissa, Bhubaneswar. Orissa Agriculture Statistics, Various Issues, Directorate of Agriculture and Food Production, Orissa, Bhubaneswar. Annual Report on Natural Calamity 2009-10, Revenue & Disaster Management Department, Orissa.
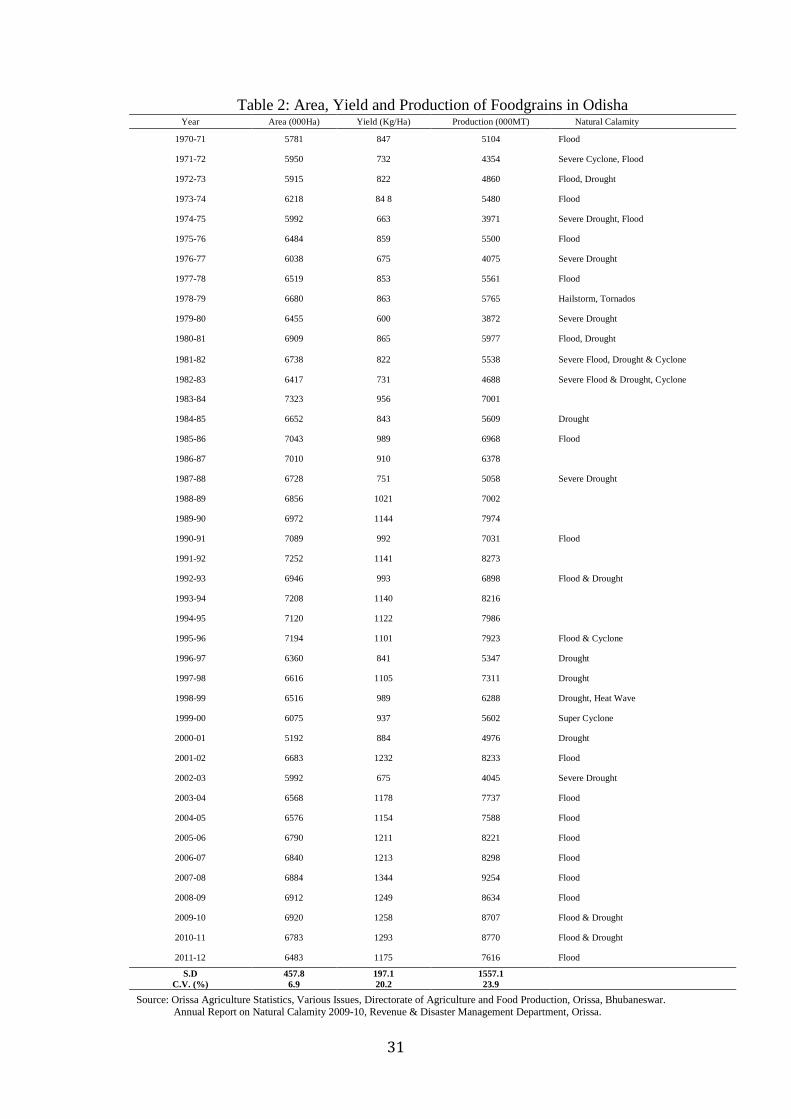
31
Table 2: Area, Yield and Production of Foodgrains in Odisha Year Area (000Ha) Yield (Kg/Ha) Production (000MT) Natural Calamity
1970-71 5781 847 5104 Flood
1971-72 5950 732 4354 Severe Cyclone, Flood
1972-73 5915 822 4860 Flood, Drought
1973-74 6218 84 8 5480 Flood
1974-75 5992 663 3971 Severe Drought, Flood
1975-76 6484 859 5500 Flood
1976-77 6038 675 4075 Severe Drought
1977-78 6519 853 5561 Flood
1978-79 6680 863 5765 Hailstorm, Tornados
1979-80 6455 600 3872 Severe Drought
1980-81 6909 865 5977 Flood, Drought
1981-82 6738 822 5538 Severe Flood, Drought & Cyclone
1982-83 6417 731 4688 Severe Flood & Drought, Cyclone
1983-84 7323 956 7001 1984-85 6652 843 5609 Drought
1985-86 7043 989 6968 Flood
1986-87 7010 910 6378 1987-88 6728 751 5058 Severe Drought
1988-89 6856 1021 7002 1989-90 6972 1144 7974 1990-91 7089 992 7031 Flood
1991-92 7252 1141 8273 1992-93 6946 993 6898 Flood & Drought
1993-94 7208 1140 8216 1994-95 7120 1122 7986 1995-96 7194 1101 7923 Flood & Cyclone
1996-97 6360 841 5347 Drought
1997-98 6616 1105 7311 Drought
1998-99 6516 989 6288 Drought, Heat Wave
1999-00 6075 937 5602 Super Cyclone
2000-01 5192 884 4976 Drought
2001-02 6683 1232 8233 Flood
2002-03 5992 675 4045 Severe Drought
2003-04 6568 1178 7737 Flood
2004-05 6576 1154 7588 Flood
2005-06 6790 1211 8221 Flood
2006-07 6840 1213 8298 Flood
2007-08 6884 1344 9254 Flood
2008-09 6912 1249 8634 Flood
2009-10 6920 1258 8707 Flood & Drought
2010-11 6783 1293 8770 Flood & Drought
2011-12 6483 1175 7616 Flood
S.D 457.8 197.1 1557.1 C.V. (%) 6.9 20.2 23.9
Source: Orissa Agriculture Statistics, Various Issues, Directorate of Agriculture and Food Production, Orissa, Bhubaneswar. Annual Report on Natural Calamity 2009-10, Revenue & Disaster Management Department, Orissa.
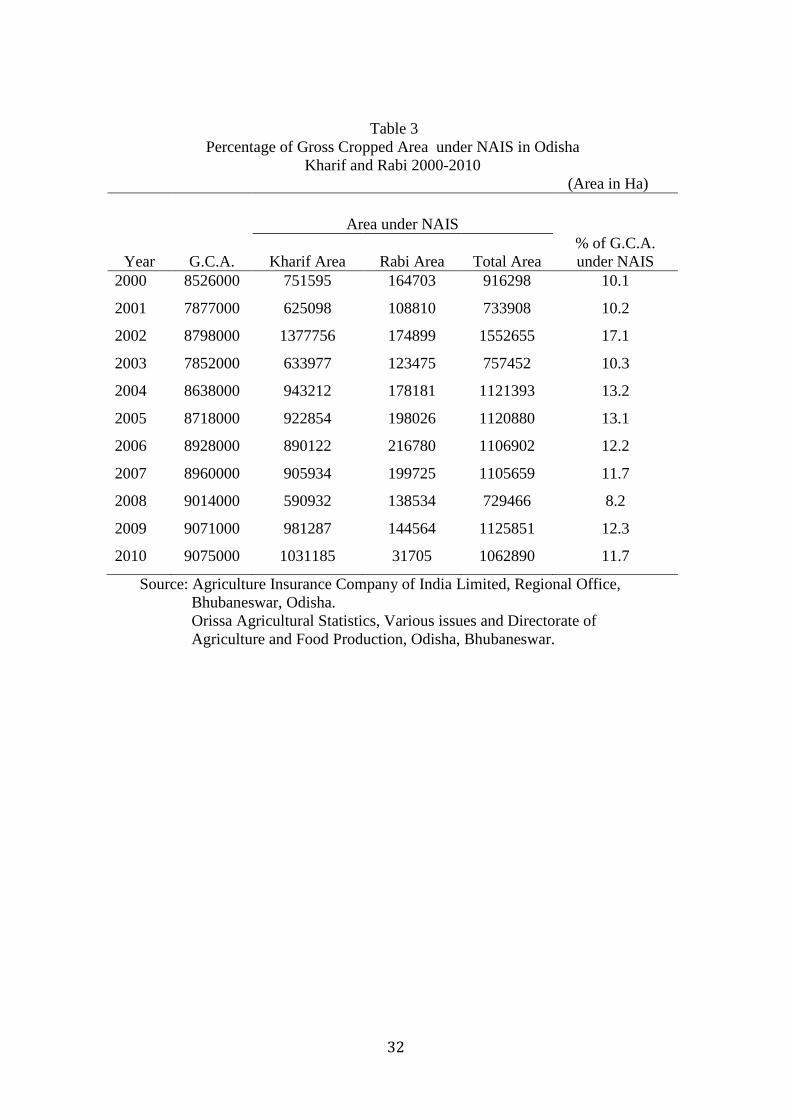
32
Source: Agriculture Insurance Company of India Limited, Regional Office, Bhubaneswar, Odisha.
Orissa Agricultural Statistics, Various issues and Directorate of Agriculture and Food Production, Odisha, Bhubaneswar.
Table 3 Percentage of Gross Cropped Area under NAIS in Odisha
Kharif and Rabi 2000-2010 (Area in Ha)
Area under NAIS
Year G.C.A. Kharif Area Rabi Area Total Area % of G.C.A. under NAIS
2000 8526000 751595 164703 916298 10.1
2001 7877000 625098 108810 733908 10.2
2002 8798000 1377756 174899 1552655 17.1
2003 7852000 633977 123475 757452 10.3
2004 8638000 943212 178181 1121393 13.2
2005 8718000 922854 198026 1120880 13.1
2006 8928000 890122 216780 1106902 12.2
2007 8960000 905934 199725 1105659 11.7
2008 9014000 590932 138534 729466 8.2
2009 9071000 981287 144564 1125851 12.3
2010 9075000 1031185 31705 1062890 11.7
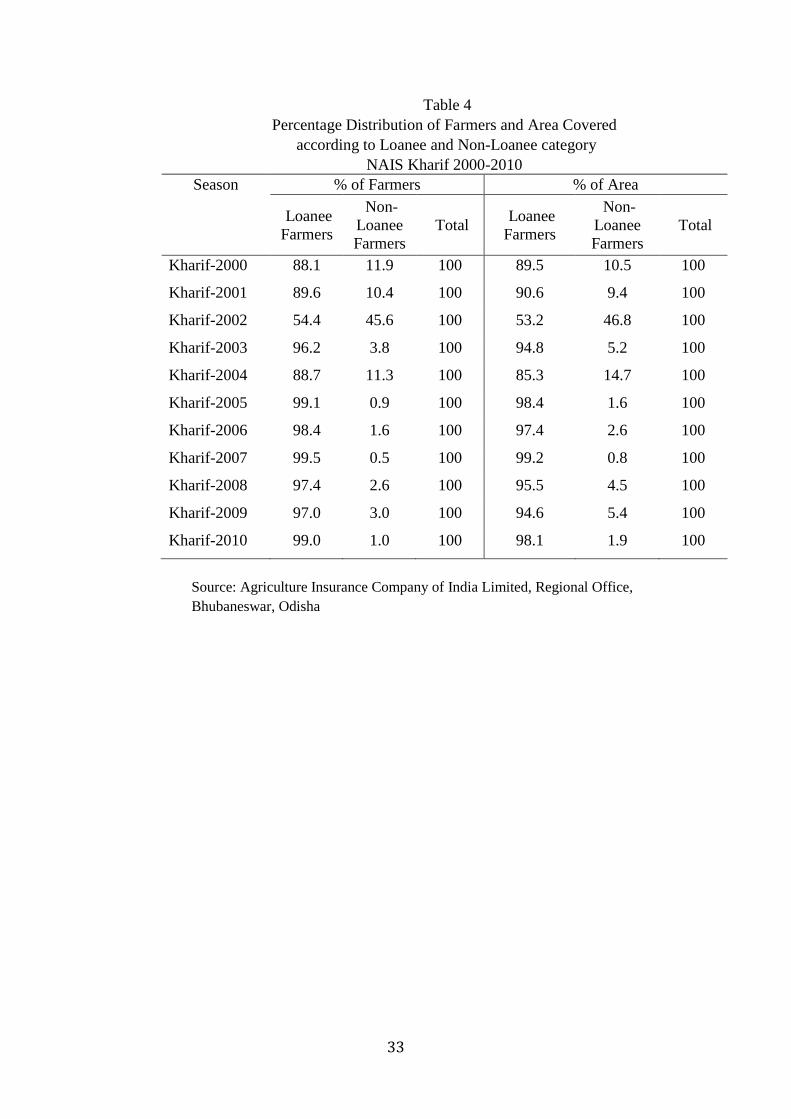
33
Table 4 Percentage Distribution of Farmers and Area Covered
according to Loanee and Non-Loanee category NAIS Kharif 2000-2010
Season % of Farmers % of Area
Loanee Farmers
Non-Loanee Farmers
Total Loanee Farmers
Non-Loanee Farmers
Total
Kharif-2000 88.1 11.9 100 89.5 10.5 100
Kharif-2001 89.6 10.4 100 90.6 9.4 100
Kharif-2002 54.4 45.6 100 53.2 46.8 100
Kharif-2003 96.2 3.8 100 94.8 5.2 100
Kharif-2004 88.7 11.3 100 85.3 14.7 100
Kharif-2005 99.1 0.9 100 98.4 1.6 100
Kharif-2006 98.4 1.6 100 97.4 2.6 100
Kharif-2007 99.5 0.5 100 99.2 0.8 100
Kharif-2008 97.4 2.6 100 95.5 4.5 100
Kharif-2009 97.0 3.0 100 94.6 5.4 100
Kharif-2010 99.0 1.0 100 98.1 1.9 100
Source: Agriculture Insurance Company of India Limited, Regional Office, Bhubaneswar, Odisha
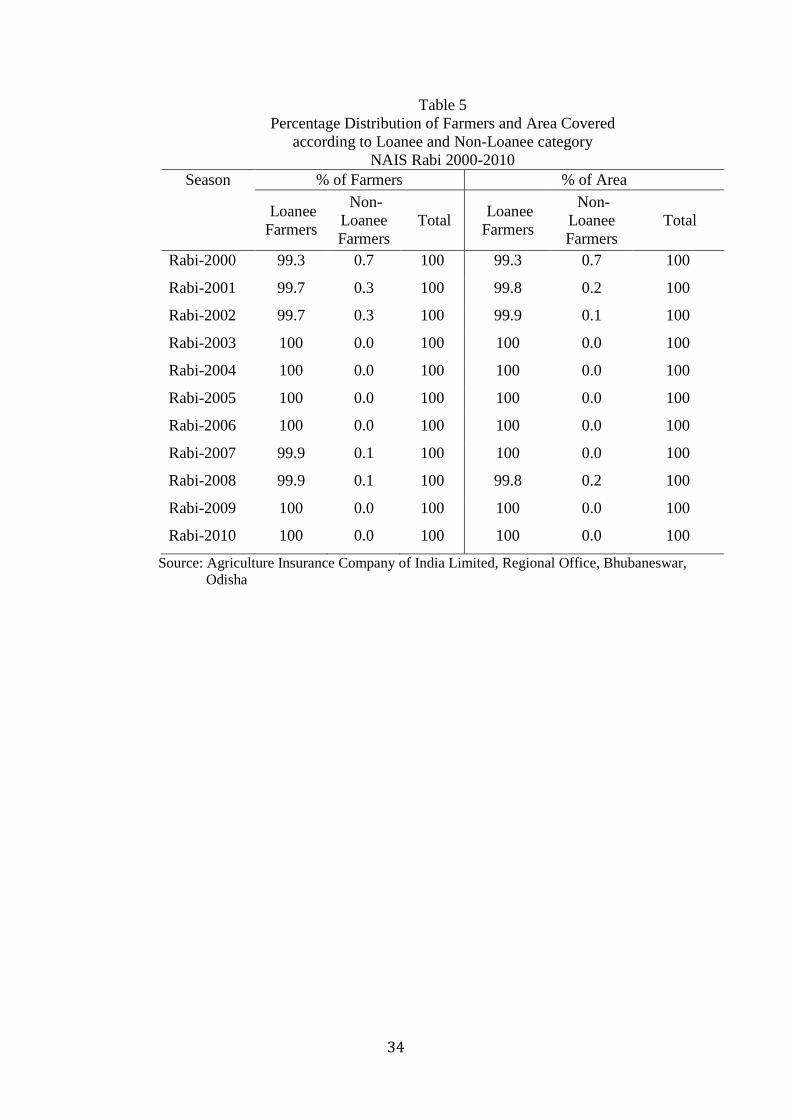
34
Table 5 Percentage Distribution of Farmers and Area Covered
according to Loanee and Non-Loanee category NAIS Rabi 2000-2010
Season % of Farmers % of Area
Loanee Farmers
Non-Loanee Farmers
Total Loanee Farmers
Non-Loanee Farmers
Total
Rabi-2000 99.3 0.7 100 99.3 0.7 100
Rabi-2001 99.7 0.3 100 99.8 0.2 100
Rabi-2002 99.7 0.3 100 99.9 0.1 100
Rabi-2003 100 0.0 100 100 0.0 100
Rabi-2004 100 0.0 100 100 0.0 100
Rabi-2005 100 0.0 100 100 0.0 100
Rabi-2006 100 0.0 100 100 0.0 100
Rabi-2007 99.9 0.1 100 100 0.0 100
Rabi-2008 99.9 0.1 100 99.8 0.2 100
Rabi-2009 100 0.0 100 100 0.0 100
Rabi-2010 100 0.0 100 100 0.0 100
Source: Agriculture Insurance Company of India Limited, Regional Office, Bhubaneswar, Odisha
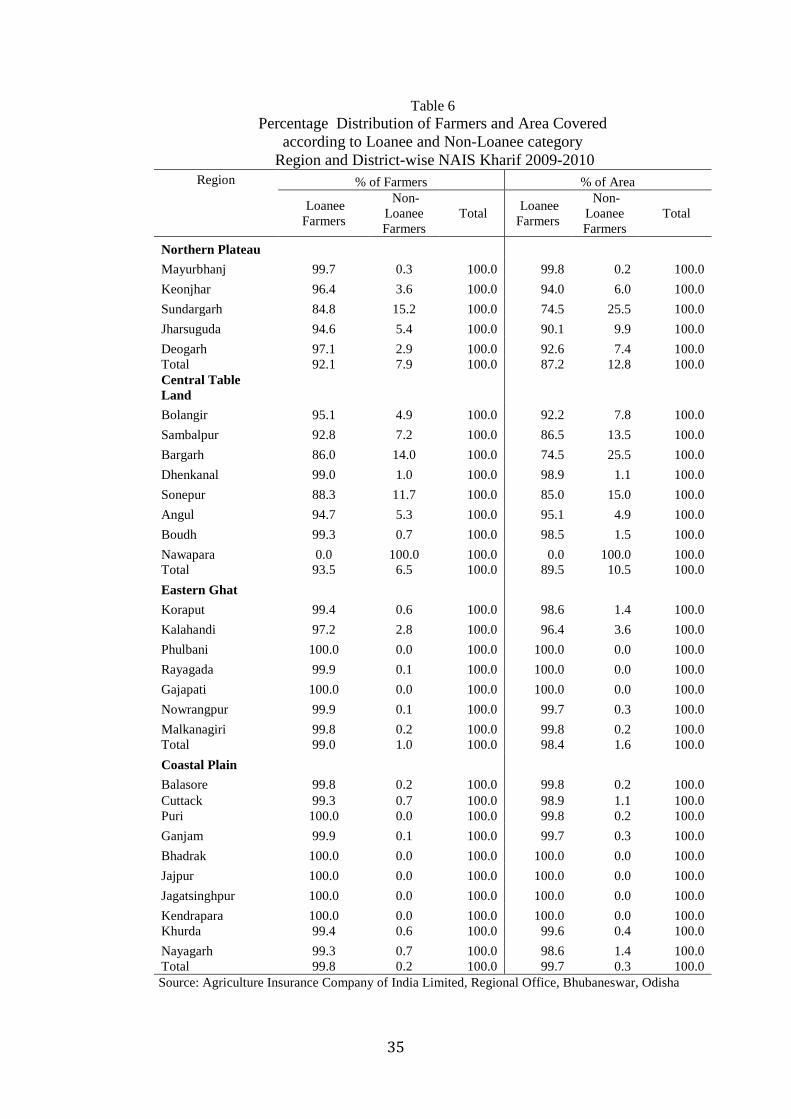
35
Table 6 Percentage Distribution of Farmers and Area Covered
according to Loanee and Non-Loanee category Region and District-wise NAIS Kharif 2009-2010
Region % of Farmers % of Area
Loanee Farmers
Non-Loanee Farmers
Total Loanee Farmers
Non-Loanee Farmers
Total
Northern Plateau Mayurbhanj 99.7 0.3 100.0 99.8 0.2 100.0 Keonjhar 96.4 3.6 100.0 94.0 6.0 100.0 Sundargarh 84.8 15.2 100.0 74.5 25.5 100.0 Jharsuguda 94.6 5.4 100.0 90.1 9.9 100.0 Deogarh 97.1 2.9 100.0 92.6 7.4 100.0 Total 92.1 7.9 100.0 87.2 12.8 100.0 Central Table Land Bolangir 95.1 4.9 100.0 92.2 7.8 100.0 Sambalpur 92.8 7.2 100.0 86.5 13.5 100.0 Bargarh 86.0 14.0 100.0 74.5 25.5 100.0 Dhenkanal 99.0 1.0 100.0 98.9 1.1 100.0 Sonepur 88.3 11.7 100.0 85.0 15.0 100.0 Angul 94.7 5.3 100.0 95.1 4.9 100.0 Boudh 99.3 0.7 100.0 98.5 1.5 100.0 Nawapara 0.0 100.0 100.0 0.0 100.0 100.0 Total 93.5 6.5 100.0 89.5 10.5 100.0 Eastern Ghat Koraput 99.4 0.6 100.0 98.6 1.4 100.0 Kalahandi 97.2 2.8 100.0 96.4 3.6 100.0 Phulbani 100.0 0.0 100.0 100.0 0.0 100.0 Rayagada 99.9 0.1 100.0 100.0 0.0 100.0 Gajapati 100.0 0.0 100.0 100.0 0.0 100.0 Nowrangpur 99.9 0.1 100.0 99.7 0.3 100.0 Malkanagiri 99.8 0.2 100.0 99.8 0.2 100.0 Total 99.0 1.0 100.0 98.4 1.6 100.0 Coastal Plain Balasore 99.8 0.2 100.0 99.8 0.2 100.0 Cuttack 99.3 0.7 100.0 98.9 1.1 100.0 Puri 100.0 0.0 100.0 99.8 0.2 100.0 Ganjam 99.9 0.1 100.0 99.7 0.3 100.0 Bhadrak 100.0 0.0 100.0 100.0 0.0 100.0 Jajpur 100.0 0.0 100.0 100.0 0.0 100.0 Jagatsinghpur 100.0 0.0 100.0 100.0 0.0 100.0 Kendrapara 100.0 0.0 100.0 100.0 0.0 100.0 Khurda 99.4 0.6 100.0 99.6 0.4 100.0 Nayagarh 99.3 0.7 100.0 98.6 1.4 100.0 Total 99.8 0.2 100.0 99.7 0.3 100.0
Source: Agriculture Insurance Company of India Limited, Regional Office, Bhubaneswar, Odisha
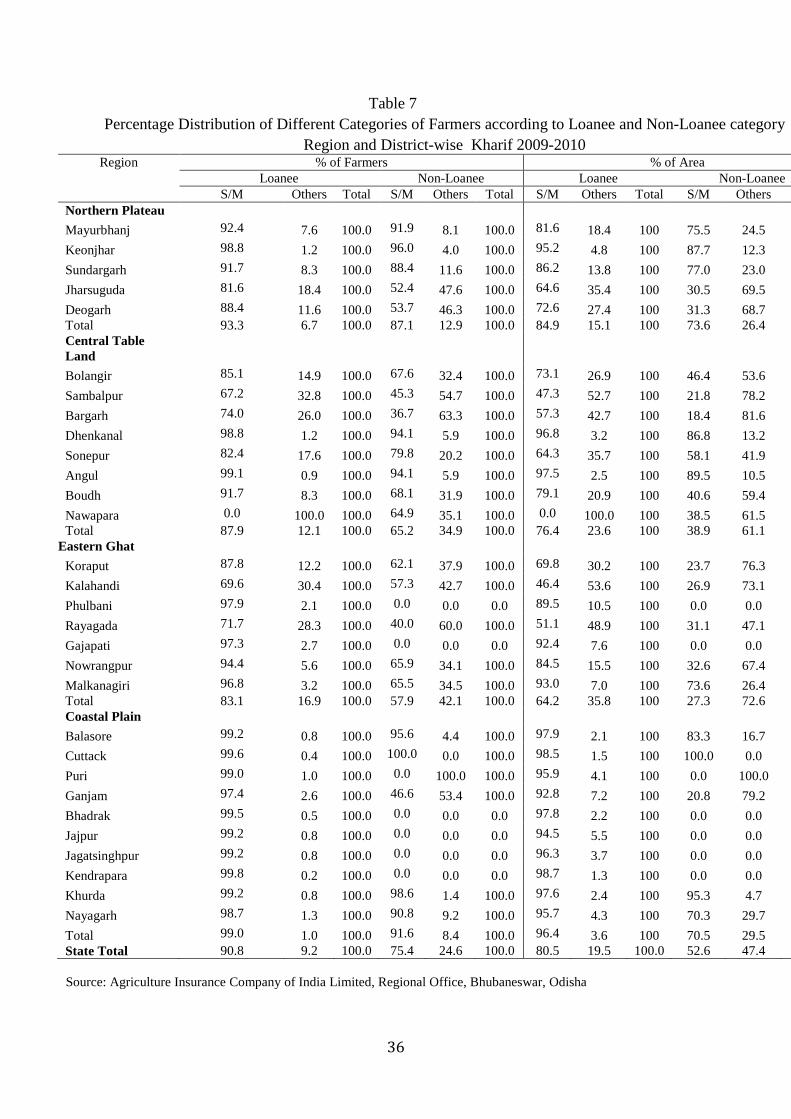
36
Table 7 Percentage Distribution of Different Categories of Farmers according to Loanee and Non-Loanee category
Region and District-wise Kharif 2009-2010 Region % of Farmers % of Area
Loanee Non-Loanee Loanee Non-Loanee S/M Others Total S/M Others Total S/M Others Total S/M Others Northern Plateau Mayurbhanj 92.4 7.6 100.0 91.9 8.1 100.0 81.6 18.4 100 75.5 24.5 Keonjhar 98.8 1.2 100.0 96.0 4.0 100.0 95.2 4.8 100 87.7 12.3 Sundargarh 91.7 8.3 100.0 88.4 11.6 100.0 86.2 13.8 100 77.0 23.0 Jharsuguda 81.6 18.4 100.0 52.4 47.6 100.0 64.6 35.4 100 30.5 69.5 Deogarh 88.4 11.6 100.0 53.7 46.3 100.0 72.6 27.4 100 31.3 68.7 Total 93.3 6.7 100.0 87.1 12.9 100.0 84.9 15.1 100 73.6 26.4 Central Table Land Bolangir 85.1 14.9 100.0 67.6 32.4 100.0 73.1 26.9 100 46.4 53.6 Sambalpur 67.2 32.8 100.0 45.3 54.7 100.0 47.3 52.7 100 21.8 78.2 Bargarh 74.0 26.0 100.0 36.7 63.3 100.0 57.3 42.7 100 18.4 81.6 Dhenkanal 98.8 1.2 100.0 94.1 5.9 100.0 96.8 3.2 100 86.8 13.2 Sonepur 82.4 17.6 100.0 79.8 20.2 100.0 64.3 35.7 100 58.1 41.9 Angul 99.1 0.9 100.0 94.1 5.9 100.0 97.5 2.5 100 89.5 10.5 Boudh 91.7 8.3 100.0 68.1 31.9 100.0 79.1 20.9 100 40.6 59.4 Nawapara 0.0 100.0 100.0 64.9 35.1 100.0 0.0 100.0 100 38.5 61.5 Total 87.9 12.1 100.0 65.2 34.9 100.0 76.4 23.6 100 38.9 61.1
Eastern Ghat Koraput 87.8 12.2 100.0 62.1 37.9 100.0 69.8 30.2 100 23.7 76.3 Kalahandi 69.6 30.4 100.0 57.3 42.7 100.0 46.4 53.6 100 26.9 73.1 Phulbani 97.9 2.1 100.0 0.0 0.0 0.0 89.5 10.5 100 0.0 0.0 Rayagada 71.7 28.3 100.0 40.0 60.0 100.0 51.1 48.9 100 31.1 47.1 Gajapati 97.3 2.7 100.0 0.0 0.0 0.0 92.4 7.6 100 0.0 0.0 Nowrangpur 94.4 5.6 100.0 65.9 34.1 100.0 84.5 15.5 100 32.6 67.4 Malkanagiri 96.8 3.2 100.0 65.5 34.5 100.0 93.0 7.0 100 73.6 26.4 Total 83.1 16.9 100.0 57.9 42.1 100.0 64.2 35.8 100 27.3 72.6 Coastal Plain Balasore 99.2 0.8 100.0 95.6 4.4 100.0 97.9 2.1 100 83.3 16.7 Cuttack 99.6 0.4 100.0 100.0 0.0 100.0 98.5 1.5 100 100.0 0.0 Puri 99.0 1.0 100.0 0.0 100.0 100.0 95.9 4.1 100 0.0 100.0 Ganjam 97.4 2.6 100.0 46.6 53.4 100.0 92.8 7.2 100 20.8 79.2 Bhadrak 99.5 0.5 100.0 0.0 0.0 0.0 97.8 2.2 100 0.0 0.0 Jajpur 99.2 0.8 100.0 0.0 0.0 0.0 94.5 5.5 100 0.0 0.0 Jagatsinghpur 99.2 0.8 100.0 0.0 0.0 0.0 96.3 3.7 100 0.0 0.0 Kendrapara 99.8 0.2 100.0 0.0 0.0 0.0 98.7 1.3 100 0.0 0.0 Khurda 99.2 0.8 100.0 98.6 1.4 100.0 97.6 2.4 100 95.3 4.7 Nayagarh 98.7 1.3 100.0 90.8 9.2 100.0 95.7 4.3 100 70.3 29.7 Total 99.0 1.0 100.0 91.6 8.4 100.0 96.4 3.6 100 70.5 29.5 State Total 90.8 9.2 100.0 75.4 24.6 100.0 80.5 19.5 100.0 52.6 47.4 Source: Agriculture Insurance Company of India Limited, Regional Office, Bhubaneswar, Odisha
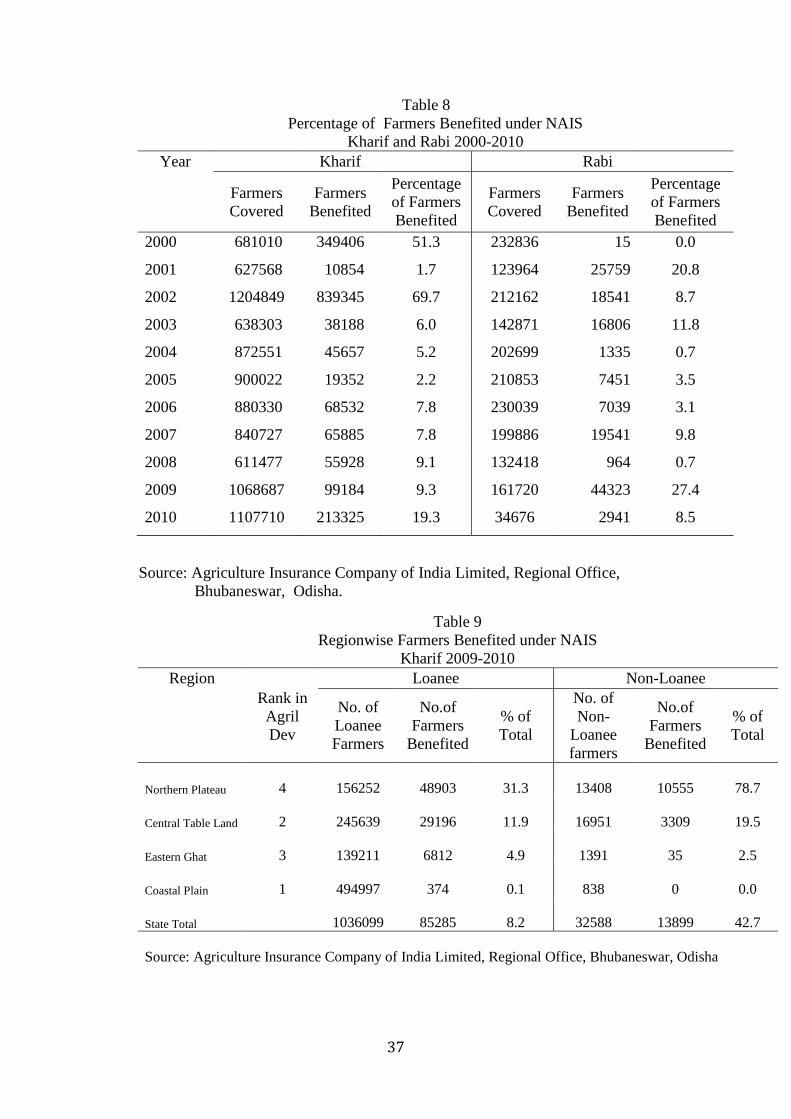
37
Table 8 Percentage of Farmers Benefited under NAIS
Kharif and Rabi 2000-2010 Year Kharif Rabi
Farmers Covered
Farmers Benefited
Percentage of Farmers Benefited
Farmers Covered
Farmers Benefited
Percentage of Farmers Benefited
2000 681010 349406 51.3 232836 15 0.0
2001 627568 10854 1.7 123964 25759 20.8
2002 1204849 839345 69.7 212162 18541 8.7
2003 638303 38188 6.0 142871 16806 11.8
2004 872551 45657 5.2 202699 1335 0.7
2005 900022 19352 2.2 210853 7451 3.5
2006 880330 68532 7.8 230039 7039 3.1
2007 840727 65885 7.8 199886 19541 9.8
2008 611477 55928 9.1 132418 964 0.7
2009 1068687 99184 9.3 161720 44323 27.4
2010 1107710 213325 19.3 34676 2941 8.5
Source: Agriculture Insurance Company of India Limited, Regional Office, Bhubaneswar, Odisha.
Table 9 Regionwise Farmers Benefited under NAIS
Kharif 2009-2010 Region Loanee Non-Loanee
Rank in Agril Dev
No. of Loanee Farmers
No.of Farmers
Benefited
% of Total
No. of Non-
Loanee farmers
No.of Farmers
Benefited
% of Total
Northern Plateau 4 156252 48903 31.3 13408 10555 78.7
Central Table Land 2 245639 29196 11.9 16951 3309 19.5
Eastern Ghat 3 139211 6812 4.9 1391 35 2.5
Coastal Plain 1 494997 374 0.1 838 0 0.0
State Total
1036099 85285 8.2 32588 13899 42.7 Source: Agriculture Insurance Company of India Limited, Regional Office, Bhubaneswar, Odisha
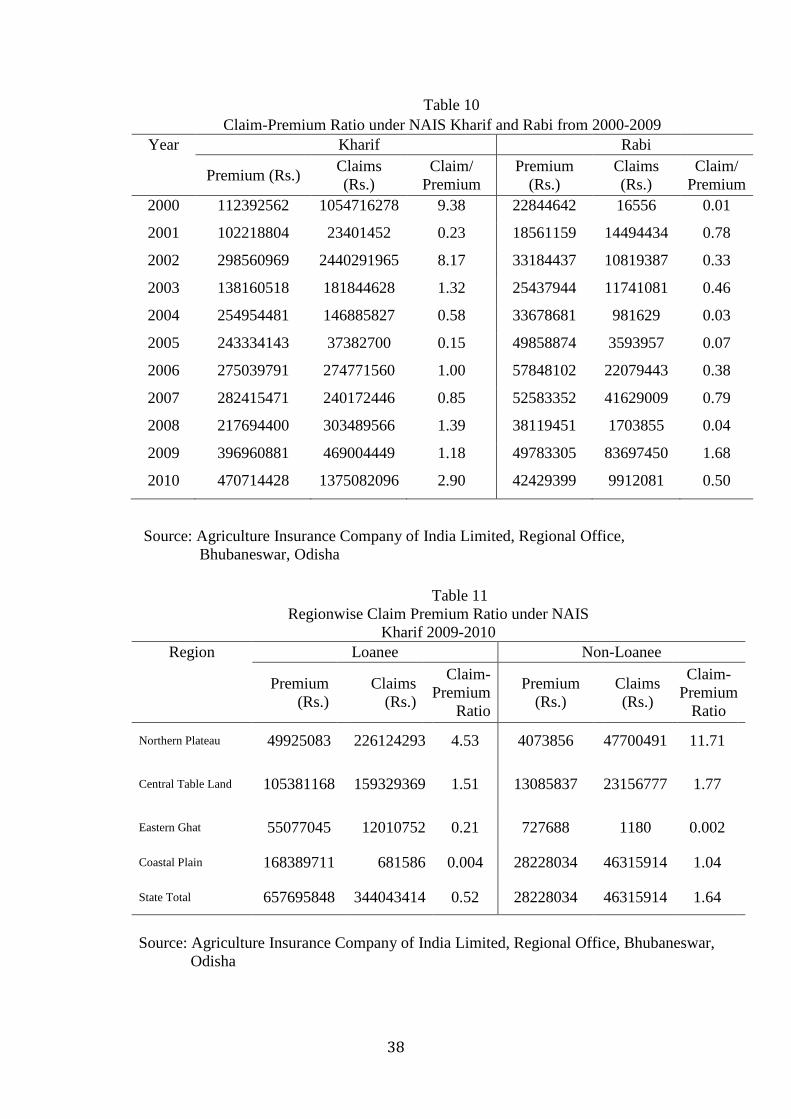
38
Table 10 Claim-Premium Ratio under NAIS Kharif and Rabi from 2000-2009
Year Kharif Rabi
Premium (Rs.) Claims (Rs.)
Claim/ Premium
Premium (Rs.)
Claims (Rs.)
Claim/ Premium
2000 112392562 1054716278 9.38 22844642 16556 0.01
2001 102218804 23401452 0.23 18561159 14494434 0.78
2002 298560969 2440291965 8.17 33184437 10819387 0.33
2003 138160518 181844628 1.32 25437944 11741081 0.46
2004 254954481 146885827 0.58 33678681 981629 0.03
2005 243334143 37382700 0.15 49858874 3593957 0.07
2006 275039791 274771560 1.00 57848102 22079443 0.38
2007 282415471 240172446 0.85 52583352 41629009 0.79
2008 217694400 303489566 1.39 38119451 1703855 0.04
2009 396960881 469004449 1.18 49783305 83697450 1.68
2010 470714428 1375082096 2.90 42429399 9912081 0.50
Source: Agriculture Insurance Company of India Limited, Regional Office, Bhubaneswar, Odisha
Table 11
Regionwise Claim Premium Ratio under NAIS Kharif 2009-2010
Region Loanee Non-Loanee
Premium (Rs.)
Claims (Rs.)
Claim-Premium
Ratio
Premium (Rs.)
Claims (Rs.)
Claim-Premium
Ratio
Northern Plateau 49925083 226124293 4.53 4073856 47700491 11.71
Central Table Land 105381168 159329369 1.51 13085837 23156777 1.77
Eastern Ghat 55077045 12010752 0.21 727688 1180 0.002
Coastal Plain 168389711 681586 0.004 28228034 46315914 1.04
State Total 657695848 344043414 0.52 28228034 46315914 1.64
Source: Agriculture Insurance Company of India Limited, Regional Office, Bhubaneswar, Odisha
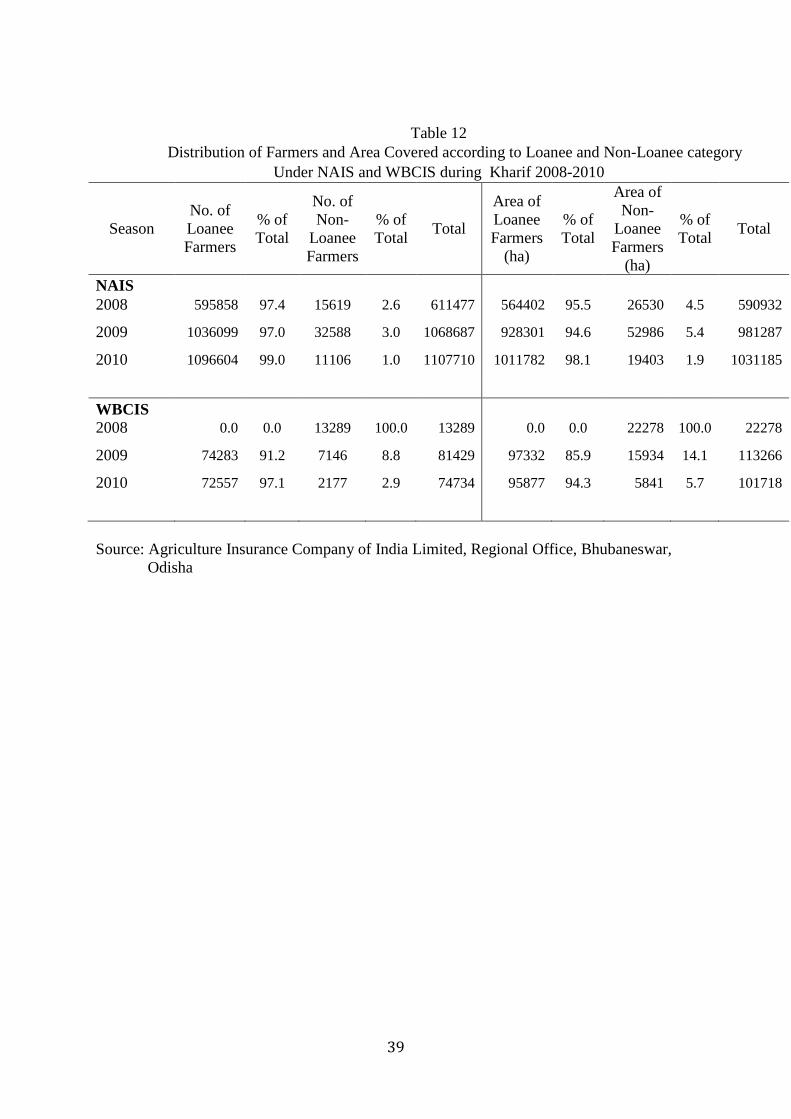
39
Source: Agriculture Insurance Company of India Limited, Regional Office, Bhubaneswar, Odisha
Table 12 Distribution of Farmers and Area Covered according to Loanee and Non-Loanee category
Under NAIS and WBCIS during Kharif 2008-2010
Season No. of Loanee Farmers
% of Total
No. of Non-
Loanee Farmers
% of Total Total
Area of Loanee Farmers
(ha)
% of Total
Area of Non-
Loanee Farmers
(ha)
% of Total Total
NAIS 2008 595858 97.4 15619 2.6 611477 564402 95.5 26530 4.5 590932
2009 1036099 97.0 32588 3.0 1068687 928301 94.6 52986 5.4 981287
2010 1096604 99.0 11106 1.0 1107710 1011782 98.1 19403 1.9 1031185
WBCIS 2008 0.0 0.0 13289 100.0 13289 0.0 0.0 22278 100.0 22278
2009 74283 91.2 7146 8.8 81429 97332 85.9 15934 14.1 113266
2010 72557 97.1 2177 2.9 74734 95877 94.3 5841 5.7 101718
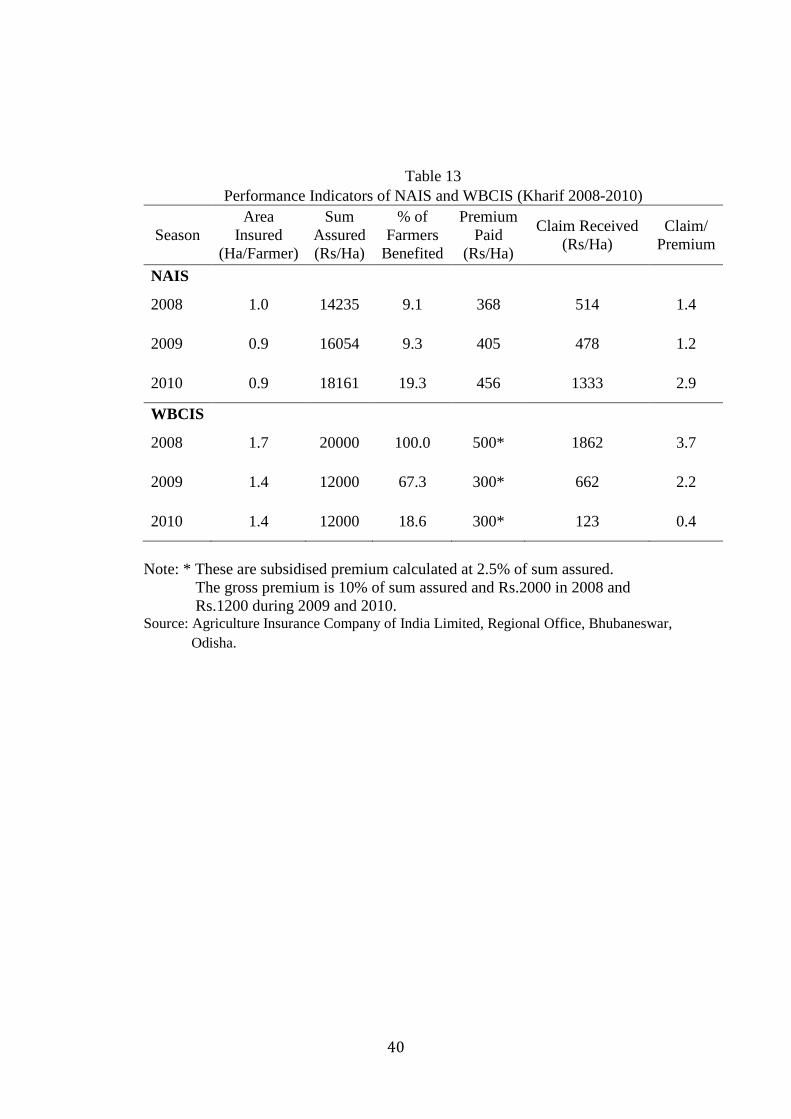
40
Table 13 Performance Indicators of NAIS and WBCIS (Kharif 2008-2010)
Season Area
Insured (Ha/Farmer)
Sum Assured (Rs/Ha)
% of Farmers
Benefited
Premium Paid
(Rs/Ha)
Claim Received (Rs/Ha)
Claim/ Premium
NAIS
2008 1.0 14235 9.1 368 514 1.4
2009 0.9 16054 9.3 405 478 1.2
2010 0.9 18161 19.3 456 1333 2.9
WBCIS
2008 1.7 20000 100.0 500* 1862 3.7
2009 1.4 12000 67.3 300* 662 2.2
2010 1.4 12000 18.6 300* 123 0.4
Note: * These are subsidised premium calculated at 2.5% of sum assured. The gross premium is 10% of sum assured and Rs.2000 in 2008 and Rs.1200 during 2009 and 2010. Source: Agriculture Insurance Company of India Limited, Regional Office, Bhubaneswar, Odisha.