
Critique of the Interpretation of Foundry Silica Sampling...
28
\\NTAPABROOKFIELD\MLW-VOL1\-\WPMLW\MKT\SCHOLZ\AFS OSHA SILICA STANDARD EVALUATION\FINAL REPORT.DOCX Critique of the Interpretation of Foundry Silica Sampling Results Used by OSHA as Support of Feasibility of Foundries Meeting a Reduced Silica Exposure Limit By Robert C. Scholz, P.E., CIH TRC Environmental Corporation Member, AFS 10Q Health and Safety Committee January 6, 2014 AFS 10Q Health and Safety Committee Peer Reviewers: G. Mosher, CIH, Exponent Health & Environmental J. Murphy IV, The Harrison Steel Casting Co. K. Rowntree, CIH, Industrial Hygiene Sciences T. Slavin, CIH, CSP, CPEA, CSHM, Slavin OSH Group
Transcript of Critique of the Interpretation of Foundry Silica Sampling...
\\NTAPABROOKFIELD\MLW-VOL1\-\WPMLW\MKT\SCHOLZ\AFS OSHA SILICA STANDARD EVALUATION\FINAL REPORT.DOCX
Critique of the Interpretation of Foundry Silica Sampling Results Used by OSHA as Support of
Feasibility of Foundries Meeting a Reduced Silica Exposure Limit
By Robert C. Scholz, P.E., CIH TRC Environmental Corporation
Member, AFS 10Q Health and Safety Committee January 6, 2014
AFS 10Q Health and Safety Committee Peer Reviewers: G. Mosher, CIH, Exponent Health & Environmental J. Murphy IV, The Harrison Steel Casting Co. K. Rowntree, CIH, Industrial Hygiene Sciences T. Slavin, CIH, CSP, CPEA, CSHM, Slavin OSH Group

\\NTAPABROOKFIELD\MLW-VOL1\-\WPMLW\MKT\SCHOLZ\AFS OSHA SILICA STANDARD EVALUATION\FINAL REPORT.DOCX Page 1
Introduction In order to provide a greater margin of safety against adverse health effects from exposure to respirable crystalline silica (silica) in foundries, OSHA is proposing to reduce the Permissible Exposure Limit (PEL) for silica. OSHA’s argument that it is technically feasible to reduce the silica exposure of foundry workers to a proposed limit of 50 µg/m3 rests on two major assertions:
1. That available foundry silica exposure samples less than or equal to 50 µg/m3, gathered from foundry workers in twelve key job categories, demonstrate that exposure levels below the proposed reduced standard are achievable by those foundries and by others.
2. That the current state of silica exposure control technology is essentially adequate to control exposures of foundry workers to the proposed exposure limit or below.
Documented guidance of the National Institute for Occupational Safety and Health (NIOSH) proved to be invaluable in testing OSHA’s first assertion. Acknowledging in its report entitled “Occupational Exposure Sampling Strategy Manual” that occupational exposure levels can vary for a worker from shift to shift, NIOSH laid out a strategy that can not only assess the variability seen in repetitive sampling shifts but can also, given a sufficient database of sampling results, predict the confidence level at which a worker’s profile of exposure results could meet current or proposed exposure limits (Reference 1).
The objectives of this paper are twofold. First, to demonstrate that silica exposure results in foundries can be assessed using the strategy proposed by NIOSH. Second, to build a case for a recommendation that any interpretations of silica exposure data developed for the purpose of assessing the technical feasibility of complying with a lower PEL be made only with a demonstrated degree of statistical confidence.
In the following sections of this paper, an introduction to the strategy recommended by NIOSH for the analysis and interpretation of exposure data is first presented, followed by a demonstration that the NIOSH statistical model could probably be employed to predict the silica exposure status of individual foundry workers, or groups of foundry workers in various job categories. Finally, the manner in which OSHA has employed silica exposure results in foundries to justify its conclusions concerning the technical feasibility of the foundry industry meeting a reduced silica exposure limit is discussed in contrast to the NIOSH recommendations for exposure data evaluation, leading up to the conclusions of this paper.
NIOSH Guidelines for Planning and Evaluating Exposure Sampling Results Industrial exposure to air contaminants varies from shift to shift, necessitating statistical consideration of repetitive exposure measurements gathered over an extended period of time to properly assess exposure status. That statement defines NIOSH’s motivation for developing a

\\NTAPABROOKFIELD\MLW-VOL1\-\WPMLW\MKT\SCHOLZ\AFS OSHA SILICA STANDARD EVALUATION\FINAL REPORT.DOCX Page 2
strategy for using exposure sampling results to evaluate compliance with exposure limits and to make decisions concerning the need for application of exposure control measures.
In its report entitled, “Occupational Exposure Sampling Strategy Manual,” NIOSH identifies two important aspects of the variability that is seen to occur in occupational exposure to air contaminants (Reference 1):
1. Sampling and analytical errors.
2. Fluctuations due to the work environment.
NIOSH considers the second of these two sources of variability in worker exposures to be predominant, warranting a longer term approach to exposure assessment that involves repetitive exposure sampling of workers to properly assess the impact of these fluctuations. That silica exposures are indeed variable in foundries is suggested by the extensive list of potential respirable silica sources contained in the manual “Control of Silica Exposures in Foundries”, published by the American Foundry Society (AFS) as part of its OSHA Alliance activities (Reference 2, Tables 2-2 and 2-3).
In its strategy manual, NIOSH has described a straight-forward, publically available data analysis model to characterize the distribution of exposure sampling results. Using this technique, repetitive exposure sampling results measured on individuals or on groups of workers in a particular job category are graphed and subjected to a test to determine whether an exposure data set fits the statistical model. Statistical confidence levels concerning exposure status can be established for data sets that fit the model.
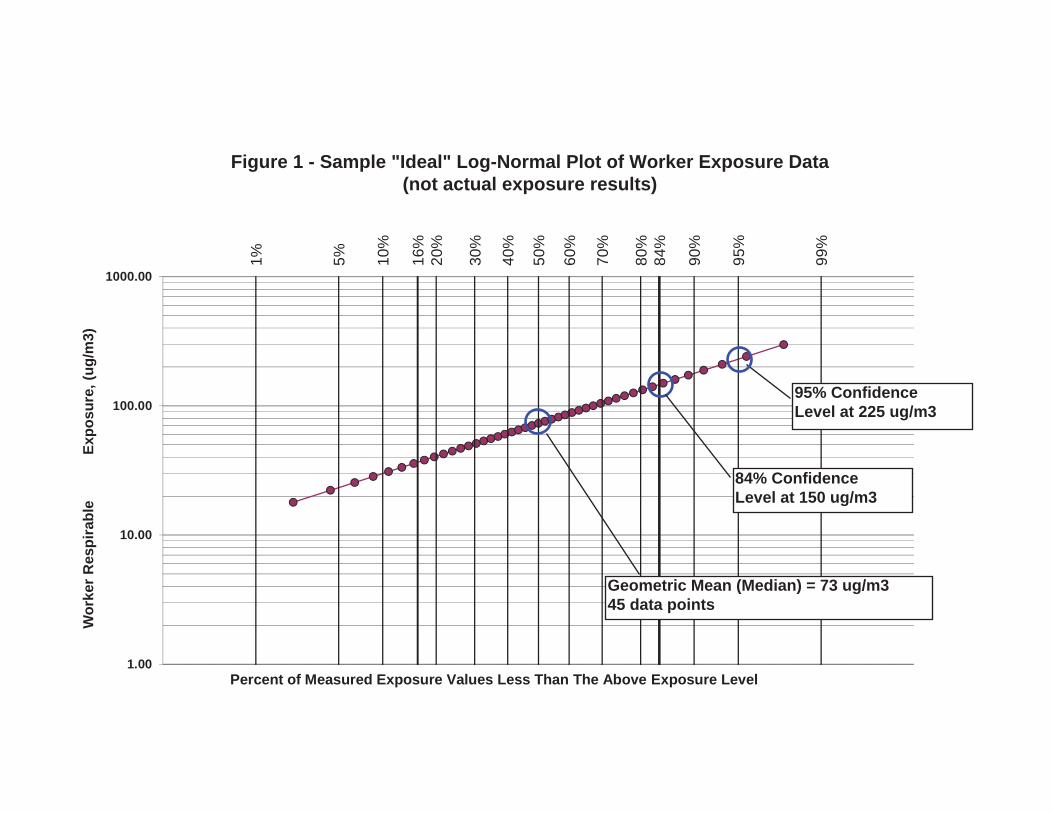
A data set fits the model when the distribution of exposure measurement data on the data plot is shown to be log-normal. Exposure data follow a log-normal distribution when the data points approximate a straight line plotted on a log-probability graph. For ease of explanation, Figure 1, created as a sample, shows an “ideal” log-normal distribution, where the data points all line up perfectly on a straight line. This distribution plot was constructed by first putting the exposure data points in order from lowest to highest exposures and then plotting them at predetermined locations along the abscissa (horizontal axis) of the graph. The height of each plotted point on the graph corresponds to the shift-long time-weighted-average (TWA) concentration of the exposure. After the data set has been thus demonstrated to be log-normally distributed as in Figure 1, confidence limits can be read directly from the graph concerning what percentage of data lies below a certain exposure level. For example, 50 percent (%) of the measurements in Figure 1 lie below the median value of 73 µg/m3. 95% of the data points lie below 225 µg/m3. (Note that this data set was created only for illustrative purposes. They are not actual silica exposure results.) The variability of the exposure data can be represented by a parameter termed the geometric standard deviation. For the portion of data

\\NTAPABROOKFIELD\MLW-VOL1\-\WPMLW\MKT\SCHOLZ\AFS OSHA SILICA STANDARD EVALUATION\FINAL REPORT.DOCX Page 3
above the geometric mean (median), the geometric standard deviation is the quotient of the exposure at 84% divided by the median (50%) exposure. In this case, the geometric standard deviation is 150 / 73 = 2.05, which represents relatively high variation.
In summary, if a plotted distribution of sampling results, either from individual workers or groups of workers in specific job categories in a foundry, can be shown to follow an expected log-normal distribution, then a statistical Upper Confidence Limit (UCL) can be established to define a predicted exposure level at a desired confidence level of worker protection.
Evaluating Foundry Silica Exposure Results Following NIOSH Guidance In this section, NIOSH’s statistical approach is applied to produce and analyze distribution plots from a limited number of repetitive silica sampling data sets provided by seven ferrous and one non-ferrous foundries and taken primarily between the year 2000 and the present. The data sets involved both individual workers (Figures 2a through 2e) and groups of workers in key job categories (Figures 3a through 3l). Each group of workers was limited to workers from a single job category in the same area of a foundry, performing similar tasks on similar process equipment during shifts of normal production. As all of these plots are presented in a similar format, an explanation of what is contained in one of them (Figure 2a) will constitute a guide for reviewing them all.
In Figure 2a, repetitive silica exposure sampling results are presented for a worker who loads iron castings into an enclosed shot blast machine, and later unloads the machine. As prescribed in the previous section, the data points were first put in order from lowest to highest silica exposures and then plotted at predetermined locations along the abscissa (x–axis). The height of each plotted point on the graph corresponds to the shift-long, time-weighted-average (TWA) concentration of the exposure to respirable silica. Note that plotting data points as less than the percentage numbers on the scale results in the plotting of all but the lowest number in the data set.
In their guidance document, NIOSH acknowledges that log-probability graphs should only be used to make preliminary judgments about a log-normal model. Preference should be given to that portion of the data set that is most closely centered on the mean (median) value, which NIOSH considers to be in about the 20 to 80% range of the data. In the graph of Figure 2a, the range of 16 to 84% has been marked off with vertical lines, representing plus or minus one standard deviation from the mean and comprising 68% of the data set. A line-of-best-fit, drawn for the 16 to 84% portion of data on Figure 2a, shows that the data approximates a straight line, suggesting a log-normal distribution. This line intersects the 84% confidence level line at 90 µg/m3. The geometric standard deviation can be calculated as the ratio of the 84% point to the 50% point (mean), which is 2.28.
\\NTAPABROOKFIELD\MLW-VOL1\-\WPMLW\MKT\SCHOLZ\AFS OSHA SILICA STANDARD EVALUATION\FINAL REPORT.DOCX Page 4
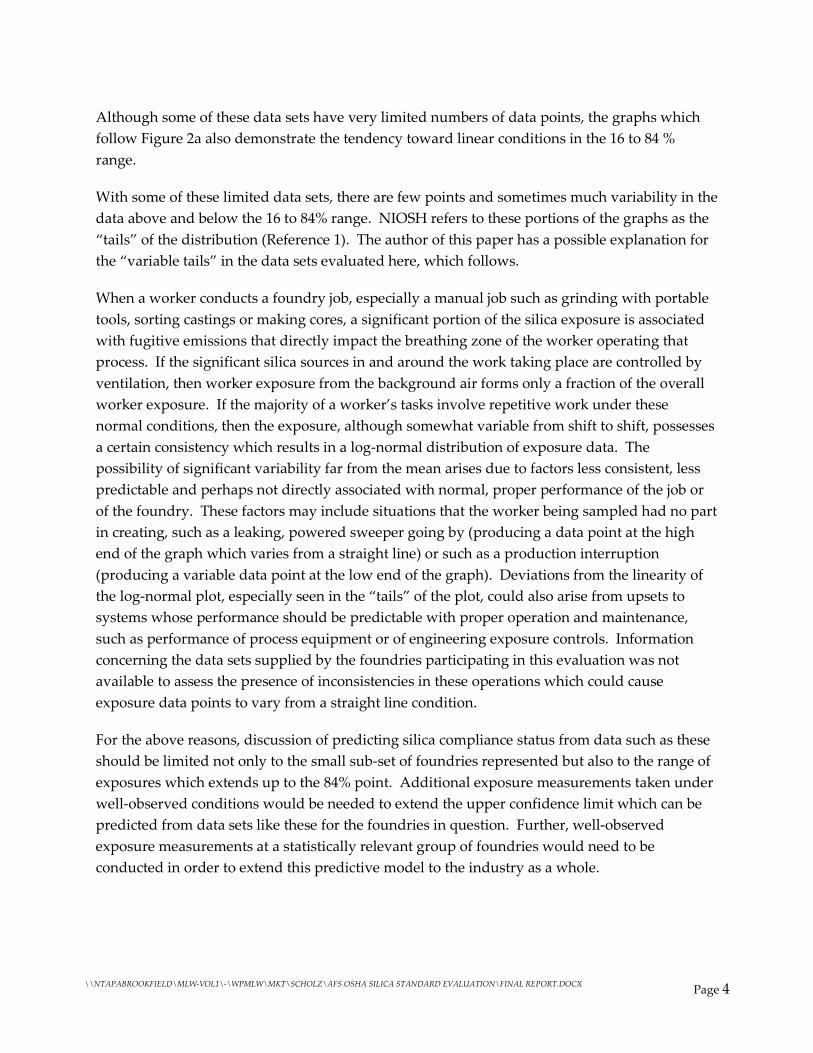
Although some of these data sets have very limited numbers of data points, the graphs which follow Figure 2a also demonstrate the tendency toward linear conditions in the 16 to 84 % range.
With some of these limited data sets, there are few points and sometimes much variability in the data above and below the 16 to 84% range. NIOSH refers to these portions of the graphs as the “tails” of the distribution (Reference 1). The author of this paper has a possible explanation for the “variable tails” in the data sets evaluated here, which follows.
When a worker conducts a foundry job, especially a manual job such as grinding with portable tools, sorting castings or making cores, a significant portion of the silica exposure is associated with fugitive emissions that directly impact the breathing zone of the worker operating that process. If the significant silica sources in and around the work taking place are controlled by ventilation, then worker exposure from the background air forms only a fraction of the overall worker exposure. If the majority of a worker’s tasks involve repetitive work under these normal conditions, then the exposure, although somewhat variable from shift to shift, possesses a certain consistency which results in a log-normal distribution of exposure data. The possibility of significant variability far from the mean arises due to factors less consistent, less predictable and perhaps not directly associated with normal, proper performance of the job or of the foundry. These factors may include situations that the worker being sampled had no part in creating, such as a leaking, powered sweeper going by (producing a data point at the high end of the graph which varies from a straight line) or such as a production interruption (producing a variable data point at the low end of the graph). Deviations from the linearity of the log-normal plot, especially seen in the “tails” of the plot, could also arise from upsets to systems whose performance should be predictable with proper operation and maintenance, such as performance of process equipment or of engineering exposure controls. Information concerning the data sets supplied by the foundries participating in this evaluation was not available to assess the presence of inconsistencies in these operations which could cause exposure data points to vary from a straight line condition.
For the above reasons, discussion of predicting silica compliance status from data such as these should be limited not only to the small sub-set of foundries represented but also to the range of exposures which extends up to the 84% point. Additional exposure measurements taken under well-observed conditions would be needed to extend the upper confidence limit which can be predicted from data sets like these for the foundries in question. Further, well-observed exposure measurements at a statistically relevant group of foundries would need to be conducted in order to extend this predictive model to the industry as a whole.
\\NTAPABROOKFIELD\MLW-VOL1\-\WPMLW\MKT\SCHOLZ\AFS OSHA SILICA STANDARD EVALUATION\FINAL REPORT.DOCX Page 5
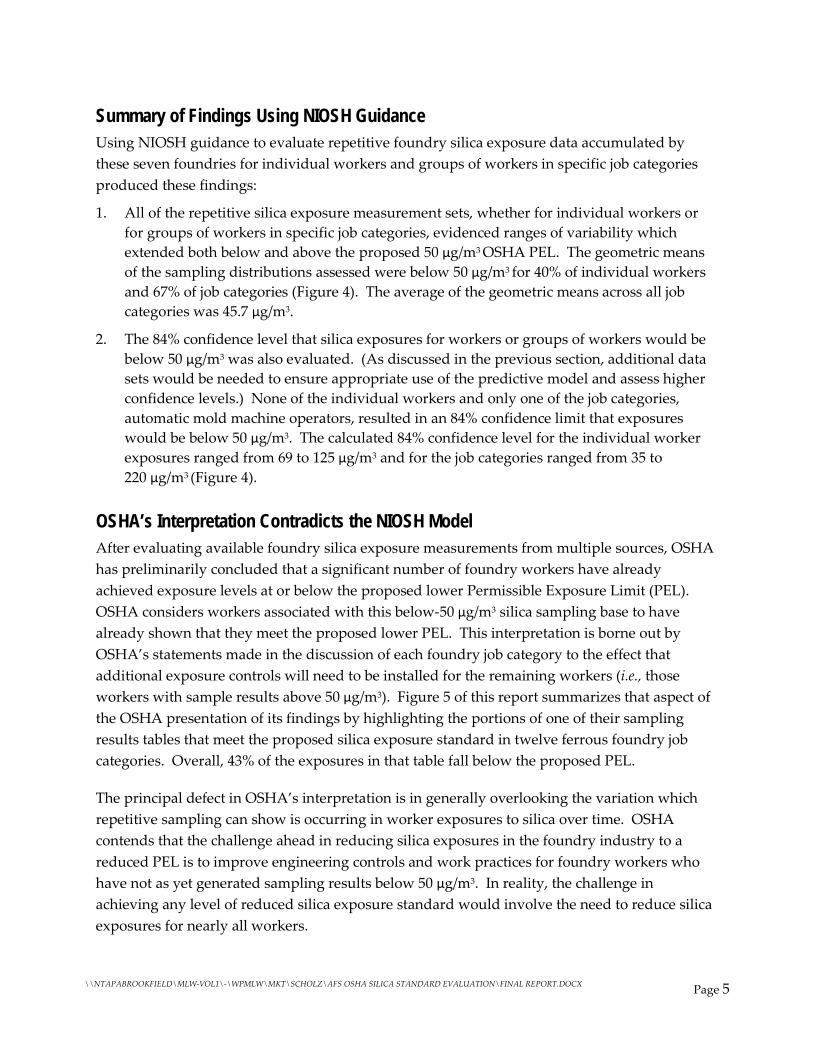
Summary of Findings Using NIOSH Guidance Using NIOSH guidance to evaluate repetitive foundry silica exposure data accumulated by these seven foundries for individual workers and groups of workers in specific job categories produced these findings:
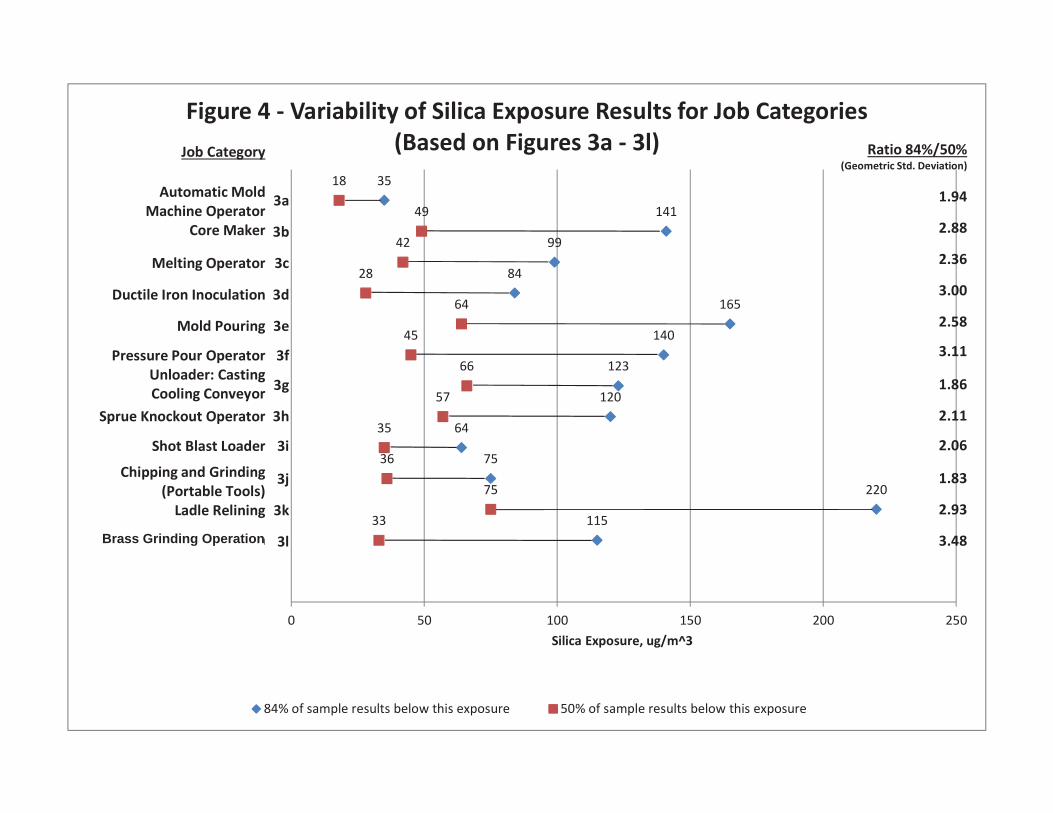
1. All of the repetitive silica exposure measurement sets, whether for individual workers or for groups of workers in specific job categories, evidenced ranges of variability which extended both below and above the proposed 50 µg/m3 OSHA PEL. The geometric means of the sampling distributions assessed were below 50 µg/m3 for 40% of individual workers and 67% of job categories (Figure 4). The average of the geometric means across all job categories was 45.7 µg/m3.
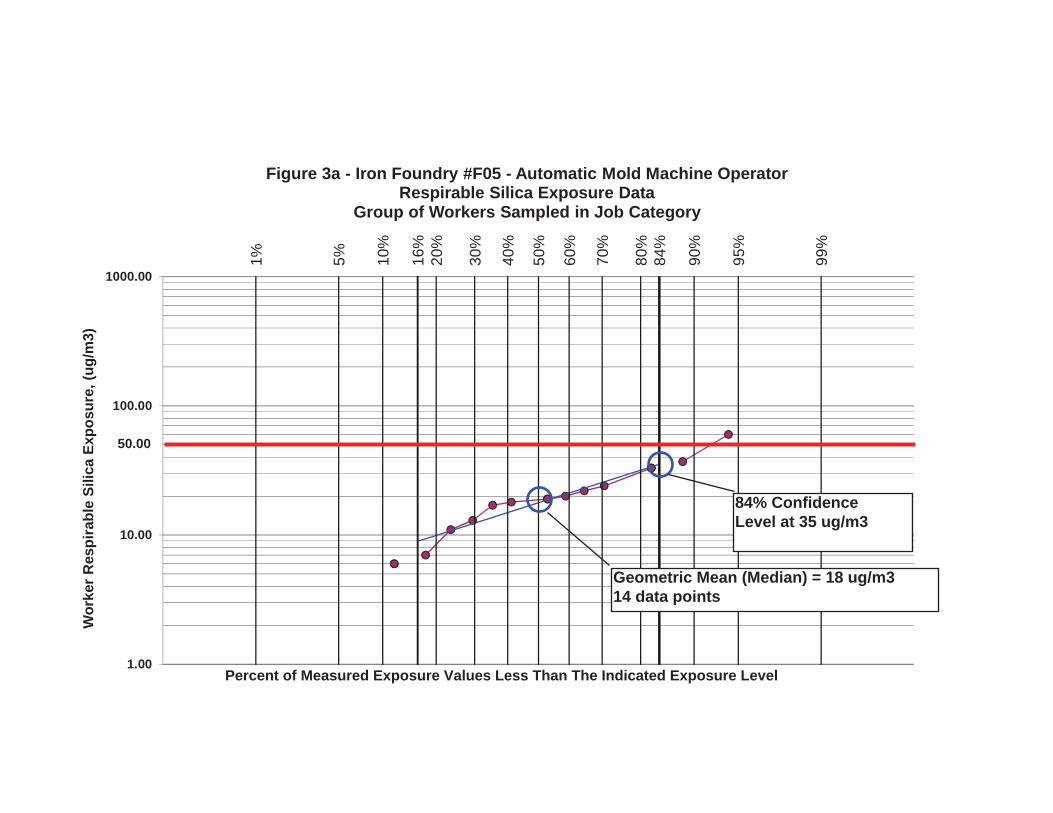
2. The 84% confidence level that silica exposures for workers or groups of workers would be below 50 µg/m3 was also evaluated. (As discussed in the previous section, additional data sets would be needed to ensure appropriate use of the predictive model and assess higher confidence levels.) None of the individual workers and only one of the job categories, automatic mold machine operators, resulted in an 84% confidence limit that exposures would be below 50 µg/m3. The calculated 84% confidence level for the individual worker exposures ranged from 69 to 125 µg/m3 and for the job categories ranged from 35 to 220 µg/m3 (Figure 4).
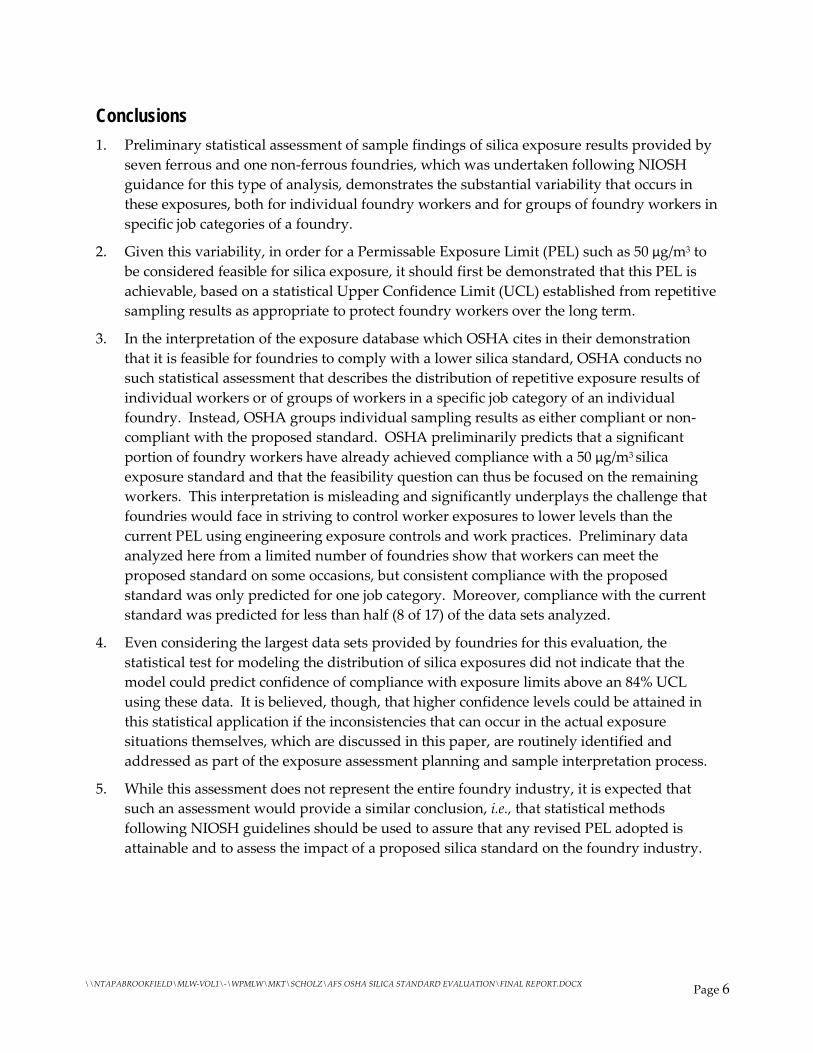
OSHA’s Interpretation Contradicts the NIOSH Model After evaluating available foundry silica exposure measurements from multiple sources, OSHA has preliminarily concluded that a significant number of foundry workers have already achieved exposure levels at or below the proposed lower Permissible Exposure Limit (PEL). OSHA considers workers associated with this below-50 µg/m3 silica sampling base to have already shown that they meet the proposed lower PEL. This interpretation is borne out by OSHA’s statements made in the discussion of each foundry job category to the effect that additional exposure controls will need to be installed for the remaining workers (i.e., those workers with sample results above 50 µg/m3). Figure 5 of this report summarizes that aspect of the OSHA presentation of its findings by highlighting the portions of one of their sampling results tables that meet the proposed silica exposure standard in twelve ferrous foundry job categories. Overall, 43% of the exposures in that table fall below the proposed PEL.
The principal defect in OSHA’s interpretation is in generally overlooking the variation which repetitive sampling can show is occurring in worker exposures to silica over time. OSHA contends that the challenge ahead in reducing silica exposures in the foundry industry to a reduced PEL is to improve engineering controls and work practices for foundry workers who have not as yet generated sampling results below 50 µg/m3. In reality, the challenge in achieving any level of reduced silica exposure standard would involve the need to reduce silica exposures for nearly all workers.
\\NTAPABROOKFIELD\MLW-VOL1\-\WPMLW\MKT\SCHOLZ\AFS OSHA SILICA STANDARD EVALUATION\FINAL REPORT.DOCX Page 6
Conclusions 1. Preliminary statistical assessment of sample findings of silica exposure results provided by
seven ferrous and one non-ferrous foundries, which was undertaken following NIOSH guidance for this type of analysis, demonstrates the substantial variability that occurs in these exposures, both for individual foundry workers and for groups of foundry workers in specific job categories of a foundry.
2. Given this variability, in order for a Permissable Exposure Limit (PEL) such as 50 µg/m3 to be considered feasible for silica exposure, it should first be demonstrated that this PEL is achievable, based on a statistical Upper Confidence Limit (UCL) established from repetitive sampling results as appropriate to protect foundry workers over the long term.
3. In the interpretation of the exposure database which OSHA cites in their demonstration that it is feasible for foundries to comply with a lower silica standard, OSHA conducts no such statistical assessment that describes the distribution of repetitive exposure results of individual workers or of groups of workers in a specific job category of an individual foundry. Instead, OSHA groups individual sampling results as either compliant or non-compliant with the proposed standard. OSHA preliminarily predicts that a significant portion of foundry workers have already achieved compliance with a 50 µg/m3 silica exposure standard and that the feasibility question can thus be focused on the remaining workers. This interpretation is misleading and significantly underplays the challenge that foundries would face in striving to control worker exposures to lower levels than the current PEL using engineering exposure controls and work practices. Preliminary data analyzed here from a limited number of foundries show that workers can meet the proposed standard on some occasions, but consistent compliance with the proposed standard was only predicted for one job category. Moreover, compliance with the current standard was predicted for less than half (8 of 17) of the data sets analyzed.
4. Even considering the largest data sets provided by foundries for this evaluation, the statistical test for modeling the distribution of silica exposures did not indicate that the model could predict confidence of compliance with exposure limits above an 84% UCL using these data. It is believed, though, that higher confidence levels could be attained in this statistical application if the inconsistencies that can occur in the actual exposure situations themselves, which are discussed in this paper, are routinely identified and addressed as part of the exposure assessment planning and sample interpretation process.
5. While this assessment does not represent the entire foundry industry, it is expected that such an assessment would provide a similar conclusion, i.e., that statistical methods following NIOSH guidelines should be used to assure that any revised PEL adopted is attainable and to assess the impact of a proposed silica standard on the foundry industry.

\\NTAPABROOKFIELD\MLW-VOL1\-\WPMLW\MKT\SCHOLZ\AFS OSHA SILICA STANDARD EVALUATION\FINAL REPORT.DOCX
References
1. National Institute for Occupational Safety and Health (NIOSH): “Occupational Exposure Sampling Strategy Manual”, DHEW (NIOSH) Publication No. 77-173.
2. AFS Safety and Health Committee (10Q): “Control of Silica Exposures in Foundries,” Tables 2-2 and 2-3 (can be downloaded from both the AFS and OSHA websites).
1% 10%
20%
30%
40%
60%
70%
80%
90%
99%
95%
5% 50%
16%
84%
1.00
10.00
100.00
1000.00
-3.090 -2.090 -1.090 -0.090 0.910 1.910 2.910
Wor
ker R
espi
rabl
e Si
lica
Expo
sure
, (ug
/m3)
Percent of Measured Exposure Values Less Than The Above Exposure Level
Sample Log-Normal Plot
Geometric Mean (Median) = 73.15 ug/m3
Figure 1 - Sample "Ideal" Log-Normal Plot of Worker Exposure Data (not actual exposure results)
95% Confidence Level at 225 ug/m3
84% Confidence Level at 150 ug/m3
Geometric Mean (Median) = 73 ug/m3 45 data points

Figure #-#
1% 10%
20%
30%
40%
60%
70%
80%
90%
99%
95%
5% 50%
16%
84%
1.00
10.00
100.00
1000.00
-3.090 -2.090 -1.090 -0.090 0.910 1.910 2.910
Wor
ker R
espi
rabl
e Si
lica
Expo
sure
, (ug
/m3)
Percent of Measured Exposure Values Less Than The Indicated Exposure Level
Figure 2a - Iron Foundry #F01 - Shot Blast LoaderRespirable Silica Exposure Data
Individual Worker Sampled
Geometric Mean (Median) = 39.39 ug/m3
84% Confidence Level at 90ug/m384% of the Exposures are Less ThanThis Value
50.0084% Confidence Level at 90 ug/m3 84% of the Exposures are Less Than This Value
Geometric Mean (Median) = 39 ug/m3 22 data points

1% 10%
20%
30%
40%
60%
70%
80%
90%
99%
95%
5% 50%
16%
84%
1.00
10.00
100.00
1000.00
-3.090 -2.090 -1.090 -0.090 0.910 1.910 2.910
Wor
ker R
espi
rabl
e Si
lica
Expo
sure
, (ug
/m3)
Percent of Measured Exposure Values Less Than The Above Exposure Level
Figure 2b - Iron Foundry #F02 - Shakeout OperatorRespirable Silica Exposure Data
Individual Worker Sampled in Job Category
Geometric Mean (Median) = 38.93 ug/m3
50.00
Individual Worker Sampled
Percent of Measured Exposure Values Less Than The Indicated Exposure Level
84% Confidence Level at 69 ug/m3
Geometric Mean (Median) = 39 ug/m3 14 data points
1% 10%
20%
30%
40%
60%
70%
80%
90%
99%
95%
5% 50%
16%
84%
1.00
10.00
100.00
1000.00
-3.090 -2.090 -1.090 -0.090 0.910 1.910 2.910
Wor
ker R
espi
rabl
e Si
lica
Expo
sure
, (ug
/m3)
Percent of Measured Exposure Values Less Than The Above Exposure Level
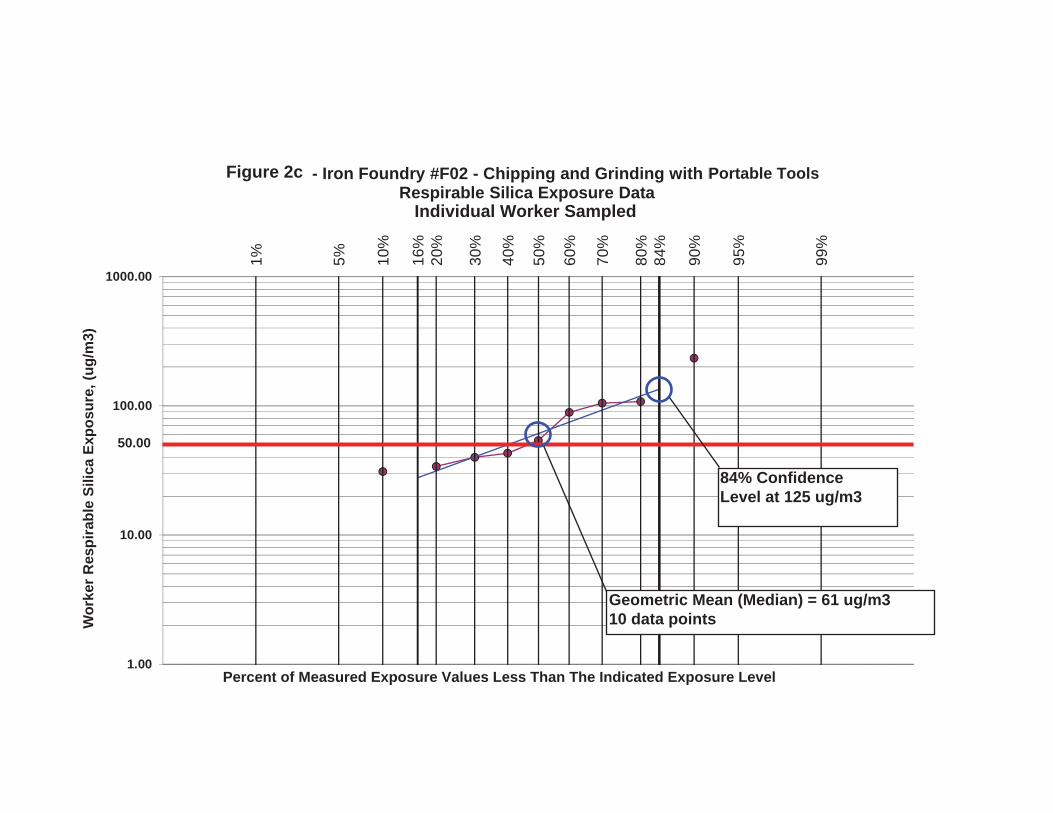
Figure 2d - Iron Foundry #F02 - Chipping and Grinding with Protable ToolsRespirable Silica Exposure Data
Individual Worker Sampled in Job Category
Geometric Mean (Median) = 61.12 ug/m3
50.00
Portable ToolsFigure 2c
Individual Worker Sampled
Percent of Measured Exposure Values Less Than The Indicated Exposure Level
84% Confidence Level at 125 ug/m3
Geometric Mean (Median) = 61 ug/m3 10 data points

1% 10%
20%
30%
40%
60%
70%
80%
90%
99%
95%
5% 50%
16%
84%
1.00
10.00
100.00
1000.00
-3.090 -2.090 -1.090 -0.090 0.910 1.910 2.910
Wor
ker R
espi
rabl
e Si
lica
Expo
sure
, (ug
/m3)
Percent of Measured Exposure Values Less Than The Above Exposure Level
Figure 2e - Iron Foundry #F02 - Sand Cleanup in PitRespirable Silica Exposure Data
Individual Worker Sampled in Job Category
Geometric Mean (Median) = 58.47 ug/m3
50.00
Figure 2d
Percent of Measured Exposure Values Less Than The Indicated Exposure Level
Individual Worker Sampled
84% Confidence Level at 113 ug/m3
Geometric Mean (Median) = 58 ug/m3 8 data points
1% 10%
20%
30%
40%
60%
70%
80%
90%
99%
95%
5% 50%
16%
84%
1.00
10.00
100.00
1000.00
-3.090 -2.090 -1.090 -0.090 0.910 1.910 2.910
Wor
ker R
espi
rabl
e Si
lica
Expo
sure
, (ug
/m3)
Percent of Measured Exposure Values Less Than The Above Exposure Level
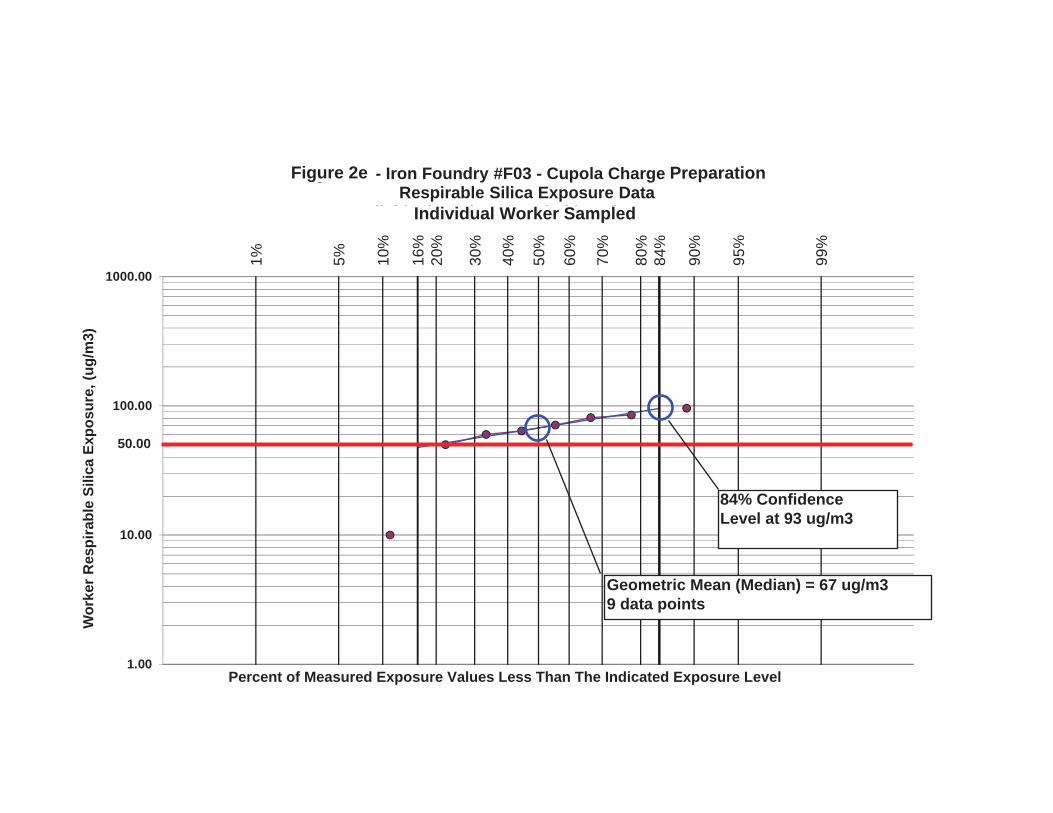
Figure 2f - Iron Foundry #F03 - Cupola Charge PrepartionRespirable Silica Exposure Data
Individual Worker Sampled in Job Category
Geometric Mean (Median) = 67.41 ug/m3
50.00
PreparationFigure 2e
Percent of Measured Exposure Values Less Than The Indicated Exposure Level
Individual Worker Sampled
84% Confidence Level at 93 ug/m3
Geometric Mean (Median) = 67 ug/m3 9 data points
1% 10%
20%
30%
40%
60%
70%
80%
90%
99%
95%
5% 50%
16%
84%
1.00
10.00
100.00
1000.00
-3.090 -2.090 -1.090 -0.090 0.910 1.910 2.910
Wor
ker R
espi
rabl
e Si
lica
Expo
sure
, (ug
/m3)
Percent of Measured Exposure Values Less Than The Above Exposure Level
Figure 3a - Iron Foundry #F05 - Automatic Mold Machine OperatorRespirable Silica Exposure Data
Group of Workers Sampled in Job Category
Geometric Mean (Median) = 17.78 ug/m3
50.00
Percent of Measured Exposure Values Less Than The Indicated Exposure Level
84% Confidence Level at 35 ug/m3
Geometric Mean (Median) = 18 ug/m3 14 data points
1% 10%
20%
30%
40%
60%
70%
80%
90%
99%
95%
5% 50%
16%
84%
1.00
10.00
100.00
1000.00
-3.090 -2.090 -1.090 -0.090 0.910 1.910 2.910
Wor
ker R
espi
rabl
e Si
lica
Expo
sure
, (ug
/m3)
Percent of Measured Exposure Values Less Than The Above Exposure Level
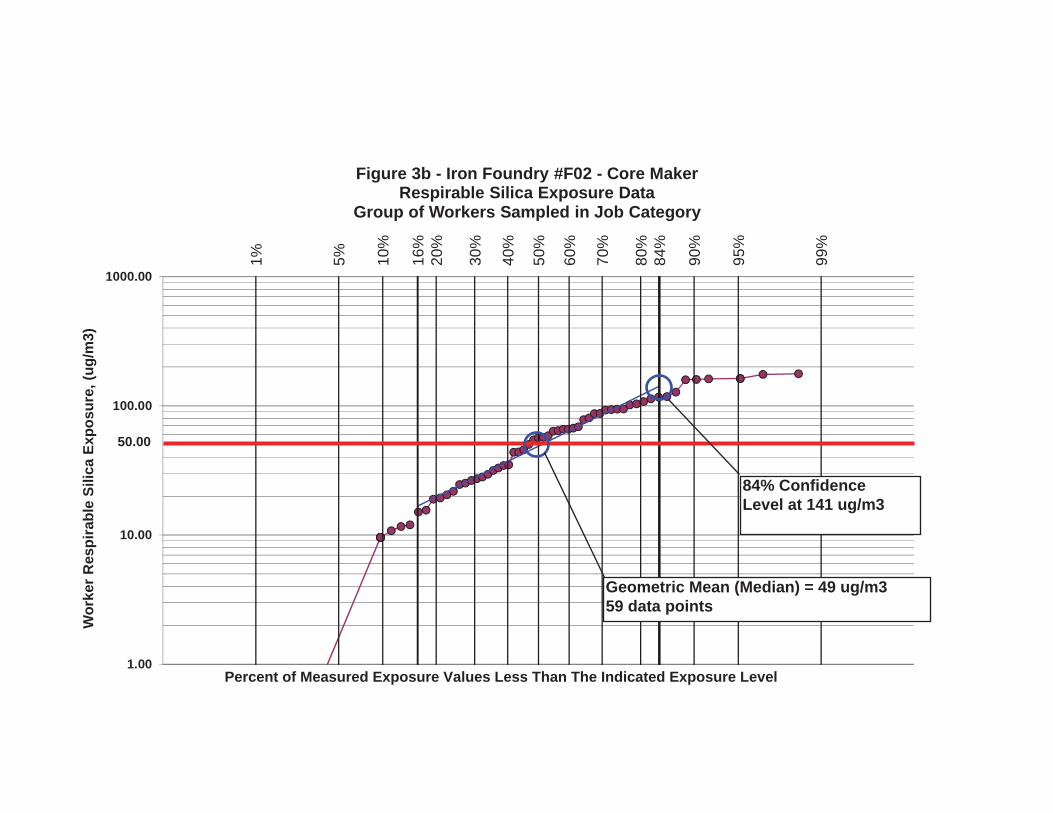
Figure 3b - Iron Foundry #F02 - Core MakerRespirable Silica Exposure Data
Group of Workers Sampled in Job Category
Geometric Mean (Median) = 48.75 ug/m3
50.00
Percent of Measured Exposure Values Less Than The Indicated Exposure Level
84% Confidence Level at 141 ug/m3
Geometric Mean (Median) = 49 ug/m3 59 data points
1% 10%
20%
30%
40%
60%
70%
80%
90%
99%
95%
5% 50%
16%
84%
1.00
10.00
100.00
1000.00
-3.090 -2.090 -1.090 -0.090 0.910 1.910 2.910
Wor
ker R
espi
rabl
e Si
lica
Expo
sure
, (ug
/m3)
Percent of Measured Exposure Values Less Than The Above Exposure Level
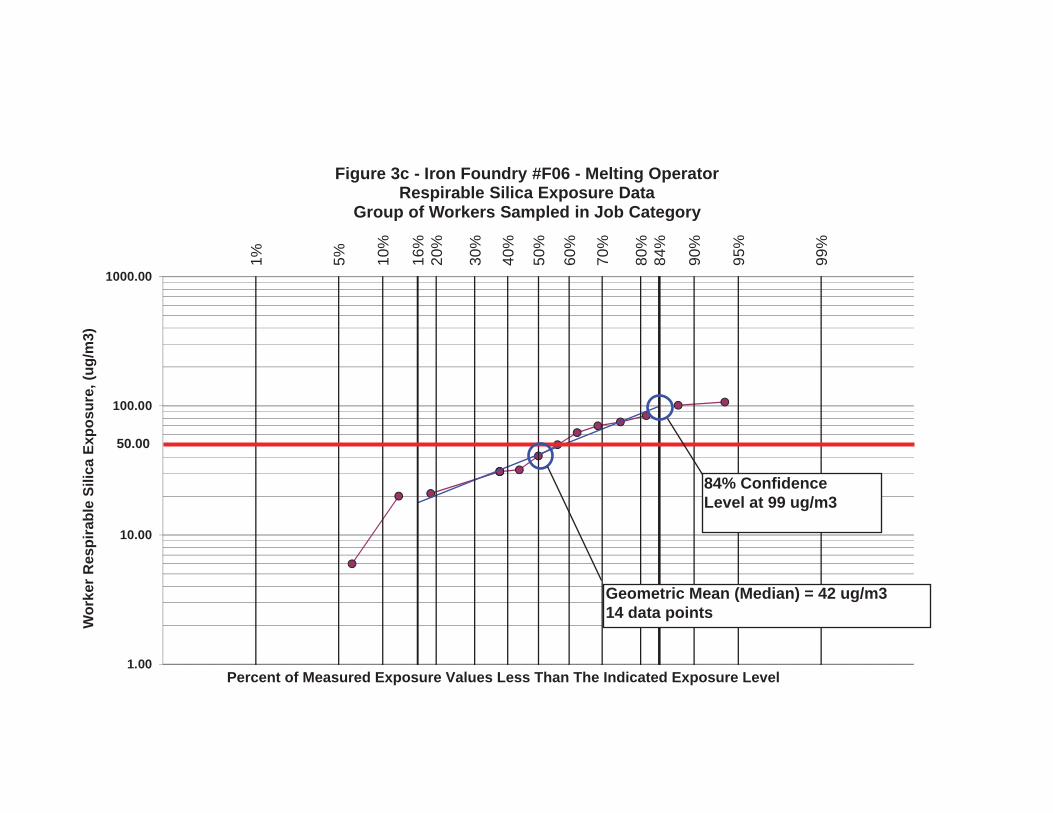
Figure 3c - Iron Foundry #F06 - Melting OperatorRespirable Silica Exposure Data
Group of Workers Sampled in Job Category
Geometric Mean (Median) = 41.97 ug/m3
50.00
Percent of Measured Exposure Values Less Than The Indicated Exposure Level
84% Confidence Level at 99 ug/m3
Geometric Mean (Median) = 42 ug/m3 14 data points

1% 10%
20%
30%
40%
60%
70%
80%
90%
99%
95%
5% 50%
16%
84%
1.00
10.00
100.00
1000.00
-3.090 -2.090 -1.090 -0.090 0.910 1.910 2.910
Wor
ker R
espi
rabl
e Si
lica
Expo
sure
, (ug
/m3)
Percent of Measured Exposure Values Less Than The Above Exposure Level
Figure 3d - Iron Foundry #F06 - Converter Operator (Ductile Iron Inoculation)Respirable Silica Exposure Data
Group of Workers Sampled in Job Category
Geometric Mean (Median) = 27.83 ug/m3
50.00
Percent of Measured Exposure Values Less Than The Indicated Exposure Level
84% Confidence Level at 84 ug/m3
Geometric Mean (Median) = 28 ug/m3 11 data points

1% 10%
20%
30%
40%
60%
70%
80%
90%
99%
95%
5% 50%
16%
84%
1.00
10.00
100.00
1000.00
-3.090 -2.090 -1.090 -0.090 0.910 1.910 2.910
Wor
ker R
espi
rabl
e Si
lica
Expo
sure
, (ug
/m3)
Percent of Measured Exposure Values Less Than The Above Exposure Level
Figure 3e - Iron Foundry #F07 - Mold PouringRespirable Silica Exposure Data
Group of Workers Sampled in Job Category
Geometric Mean (Median) = 64.23 ug/m3
50.00
Percent of Measured Exposure Values Less Than The Indicated Exposure Level
84% Confidence Level at 165 ug/m3
Geometric Mean (Median) = 64 ug/m3 16 data points

1% 10%
20%
30%
40%
60%
70%
80%
90%
99%
95%
5% 50%
16%
84%
1.00
10.00
100.00
1000.00
-3.090 -2.090 -1.090 -0.090 0.910 1.910 2.910
Wor
ker R
espi
rabl
e Si
lica
Expo
sure
, (ug
/m3)
Percent of Measured Exposure Values Less Than The Above Exposure Level
Figure 3f - Iron Foundry #F08 - Pressure Pour OperatorRespirable Silica Exposure Data
Group of Workers Sampled in Job Category
Geometric Mean (Median) = 44.94 ug/m3
50.00
Percent of Measured Exposure Values Less Than The Indicated Exposure Level
84% Confidence Level at 140 ug/m3
Geometric Mean (Median) = 45 ug/m3 14 data points
#F04
1% 10%
20%
30%
40%
60%
70%
80%
90%
99%
95%
5% 50%
16%
84%
1.00
10.00
100.00
1000.00
-3.090 -2.090 -1.090 -0.090 0.910 1.910 2.910
Wor
ker R
espi
rabl
e Si
lica
Expo
sure
, (ug
/m3)
Percent of Measured Exposure Values Less Than The Above Exposure Level
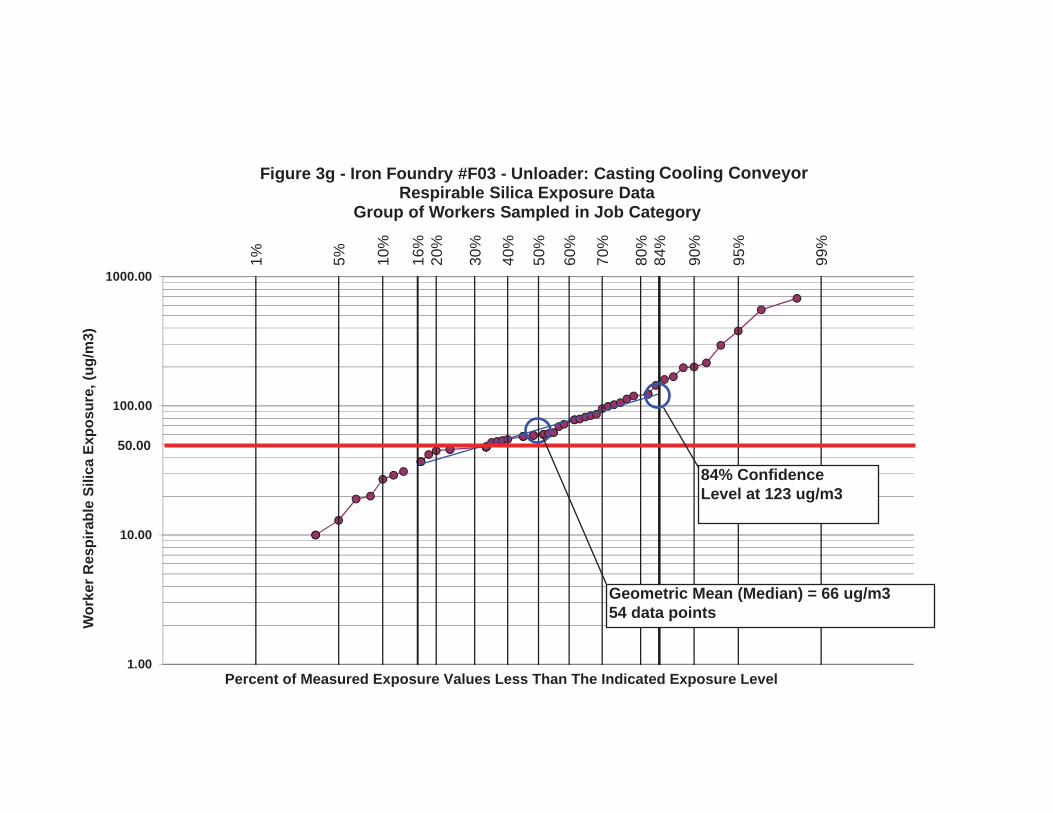
Figure 3g - Iron Foundry #F03 - Unloader: Casting Cooler ConveyorRespirable Silica Exposure Data
Group of Workers Sampled in Job Category
Geometric Mean (Median) = 65.55 ug/m3
50.00
Cooling Conveyor
Percent of Measured Exposure Values Less Than The Indicated Exposure Level
84% Confidence Level at 123 ug/m3
Geometric Mean (Median) = 66 ug/m3 54 data points

1% 10%
20%
30%
40%
60%
70%
80%
90%
99%
95%
5% 50%
16%
84%
1.00
10.00
100.00
1000.00
-3.090 -2.090 -1.090 -0.090 0.910 1.910 2.910
Wor
ker R
espi
rabl
e Si
lica
Expo
sure
, (ug
/m3)
Percent of Measured Exposure Values Less Than The Above Exposure Level
Figure 3h - Iron Foundry #F05 - Sprue Knockoff OperatorRespirable Silica Exposure Data
Group of Workers Sampled in Job Category
Geometric Mean (Median) = 56.86 ug/m3Geometric Mean (Median) = 74.76 ug/m3Geometric Mean (Median) = 74.76 ug/m3Geometric Mean (Median) = 74.76 ug/m3Geometric Mean (Median) = 74.76 ug/m3Geometric Mean (Median) = 56.86 ug/m3
50.00
Percent of Measured Exposure Values Less Than The Indicated Exposure Level
84% Confidence Level at 120 ug/m3
Geometric Mean (Median) = 57 ug/m3 25 data points

1% 10%
20%
30%
40%
60%
70%
80%
90%
99%
95%
5% 50%
16%
84%
1.00
10.00
100.00
1000.00
-3.090 -2.090 -1.090 -0.090 0.910 1.910 2.910
Wor
ker R
espi
rabl
e Si
lica
Expo
sure
, (ug
/m3)
Percent of Measured Exposure Values Less Than The Above Exposure Level
F13-C Shot Blast LoaderRespirable Silica Exposure Data
Geometric Mean (Median) = 35.23 ug/m3
Figure 3i - Iron Foundry #F02 - Shot Blast Loader Respirable Silica Exposure Data
Group of Workers Sampled in Job Category
50.00
Percent of Measured Exposure Values Less Than The Indicated Exposure Level
84% Confidence Level at 64 ug/m3
Geometric Mean (Median) = 35 ug/m3 19 data points

1% 10%
20%
30%
40%
60%
70%
80%
90%
99%
95%
5% 50%
16%
84%
1.00
10.00
100.00
1000.00
-3.090 -2.090 -1.090 -0.090 0.910 1.910 2.910
Wor
ker R
espi
rabl
e Si
lica
Expo
sure
, (ug
/m3)
Percent of Measured Exposure Values Less Than The Above Exposure Level
Figure 3j - Iron Foundry #F02 - Chipping and Grinding with Portable ToolsRespirable Silica Exposure Data
Group of Workers Sampled in Job Category
Geometric Mean (Median) = 35.58 ug/m3
50.00
Percent of Measured Exposure Values Less Than The Indicated Exposure Level
84% Confidence Level at 75 ug/m3
Geometric Mean (Median) = 36 ug/m3 44 data points
1% 10%
20%
30%
40%
60%
70%
80%
90%
99%
95%
5% 50%
16%
84%
1.00
10.00
100.00
1000.00
-3.090 -2.090 -1.090 -0.090 0.910 1.910 2.910
Wor
ker R
espi
rabl
e Si
lica
Expo
sure
, (ug
/m3)
Percent of Measured Exposure Values Less Than The Above Exposure Level
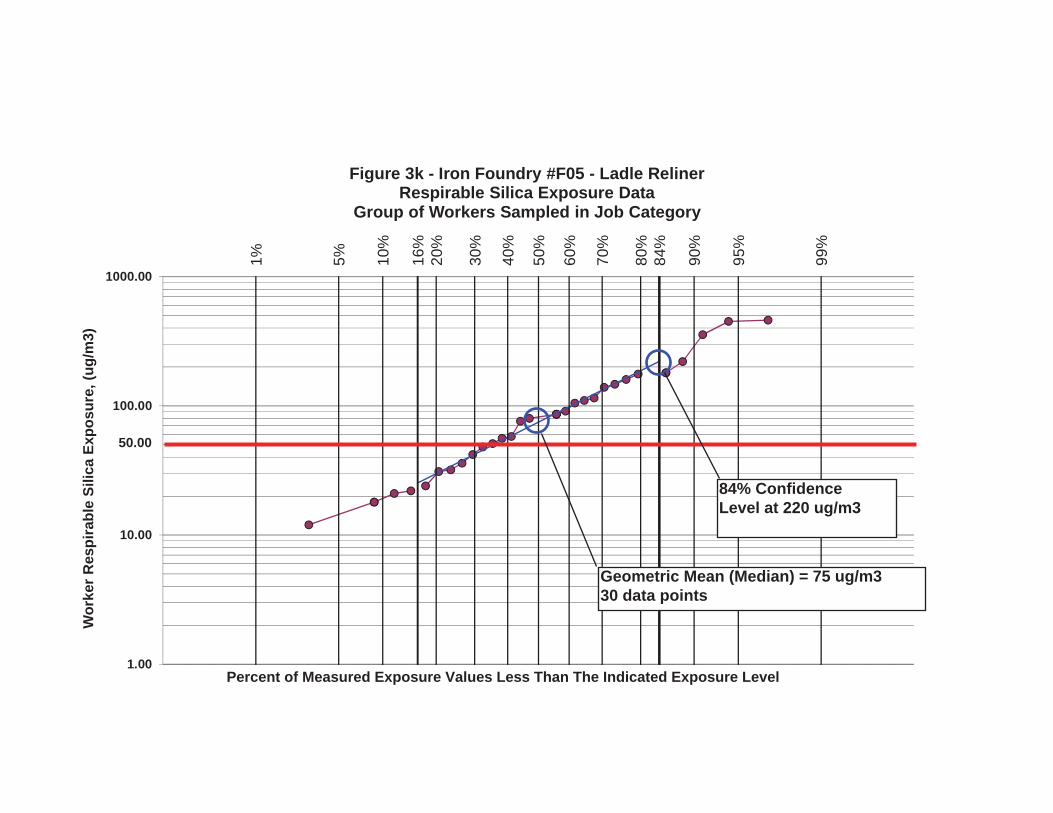
Figure 3k - Iron Foundry #F05 - Ladle RelinerRespirable Silica Exposure Data
Group of Workers Sampled in Job Category
Geometric Mean (Median) = 74.76 ug/m3
50.00
Percent of Measured Exposure Values Less Than The Indicated Exposure Level
84% Confidence Level at 220 ug/m3
Geometric Mean (Median) = 75 ug/m3 30 data points
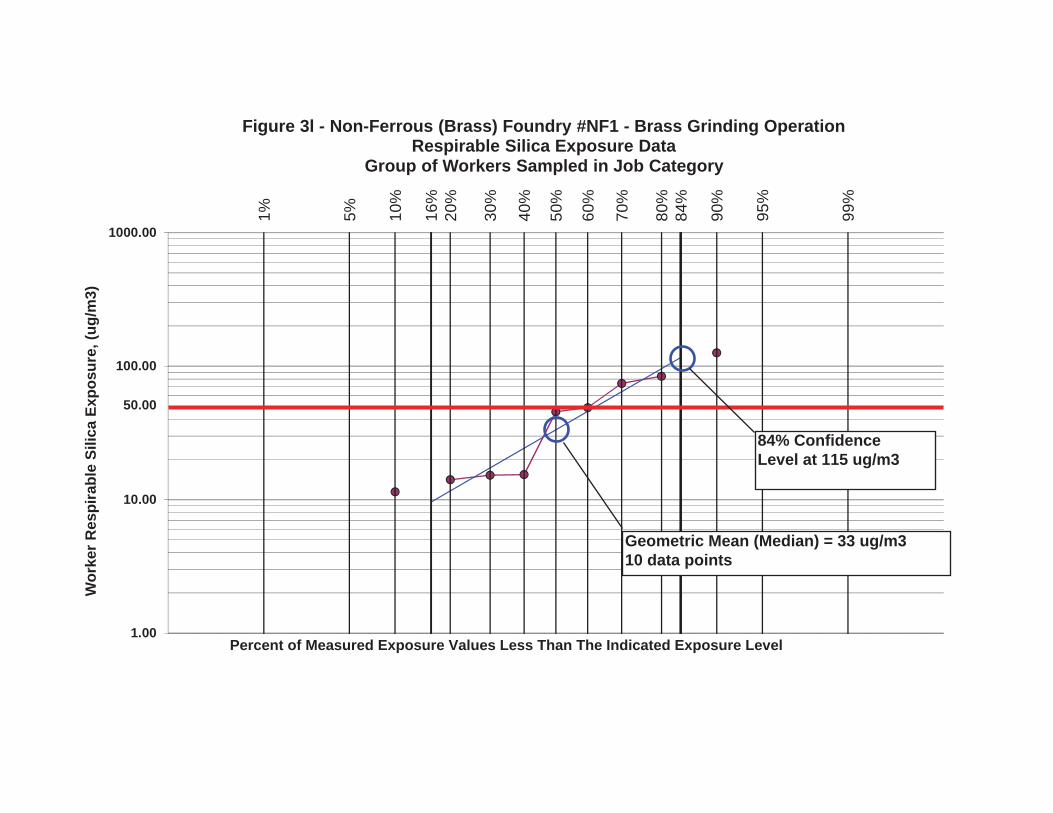
Figure #-#
1% 10%
20%
30%
40%
60%
70%
80%
90%
99%
95%
5% 50%
16%
84%
1.00
10.00
100.00
1000.00
-3.090 -2.090 -1.090 -0.090 0.910 1.910 2.910
Wor
ker R
espi
rabl
e Si
lica
Expo
sure
, (ug
/m3)
Percent of Measured Exposure Values Less Than The Above Exposure Level
Figure 3l - Non-Ferrous (Brass) Foundry #NF1 - Brass Grinding OperationRespirable Silica Exposure Data
Group of Workers Sampled in Job Category
Geometric Mean (Median) = 33.36 ug/m3
50.00
Percent of Measured Exposure Values Less Than The Indicated Exposure Level
84% Confidence Level at 115 ug/m3
Geometric Mean (Median) = 33 ug/m3 10 data points
35
141
99
84
165
140
123
120
64
75
220
115
18
49
42
28
64
45
66
57
35
36
75
33
0 50 100 150 200 250Silica Exposure, ug/m^3
Figure 4 Variability of Silica Exposure Results for Job Categories(Based on Figures 3a 3l)
84% of sample results below this exposure 50% of sample results below this exposure
Job Category
Automatic MoldMachine Operator
Core Maker
Melting Operator
Ductile Iron Inoculation
Mold Pouring
Pressure Pour OperatorUnloader: CastingCooling Conveyor
Sprue Knockout Operator
Shot Blast Loader
Chipping and Grinding(Portable Tools)Ladle Relining
Brass Ginding Operation
3a
3b
3c
3d
3e
3f
3g
3h
3i
3j
3k
3l
Ratio 84%/50%(Geometric Std. Deviation)
1.94
2.88
2.36
3.00
2.58
3.11
1.86
2.11
2.06
1.83
2.93
3.48Brass Grinding Operation

Sand Systems Operator
Molder
Coremaker
Furnace Operator
Pouring Operator
Shakeout Operator
Knockout Operator
Abrasive Blasting Operator
Cleaning/Finishing Operators
Material Handler
Maintenance Operator
Housekeeping Worker
% of SamplesBelow Proposed Exposure Limit
of 50 ug/m3
% of SamplesAbove Proposed Exposure Limit
of 50 ug/m3
Figure 1Charting of Relationship OSHA Silica Exposure Results in
Ferrous Foundries to the Proposed Silica Standard(Based on OSHA Table IV.C-16)
Job Category
80 60 40 20 0 20 40 60 80
Figure 1 - Charting of Relationship OSHA Silica Exposure Results in Ferrous Foundries to the Proposed Silica Standard
(Based on OSHA Table IV.C-16)
Figure 5