
CRITICAL SUCCESS FACTORS INFLUENCING PROJECT SUCCESS … · construction industry. Identifying...
88
CRITICAL SUCCESS FACTORS INFLUENCING PROJECT SUCCESS IN THE DURBAN CONSTRUCTION INDUSTRY BY THULANI A. MSANI Dissertation submitted in compliance with the requirements for the Masters Degree in Technology: Business Administration in the Department of Entrepreneurial Studies and Management, Faculty of Management Sciences at the Durban University of Technology APPROVED FOR FINAL SUBMISSION Supervisor--------------------------------- Date----------------------- Dr H L Garbharran (D P A) Co-supervisor----------------------------- Date----------------------- Mr A. Moorley (MCOMM)
Transcript of CRITICAL SUCCESS FACTORS INFLUENCING PROJECT SUCCESS … · construction industry. Identifying...
CRITICAL SUCCESS FACTORS INFLUENCING PROJECT SUCCESS IN
THE DURBAN CONSTRUCTION INDUSTRY
BY
THULANI A. MSANI
Dissertation submitted in compliance with the requirements for the Masters Degree in
Technology: Business Administration in the Department of Entrepreneurial Studies and
Management, Faculty of Management Sciences at the Durban University of Technology
APPROVED FOR FINAL SUBMISSION
Supervisor--------------------------------- Date-----------------------
Dr H L Garbharran (D P A)
Co-supervisor----------------------------- Date-----------------------
Mr A. Moorley (MCOMM)
i
TABLE OF CONTENTS PAGE
ABSTRACT vi
DECLARATION vii
ACKNOWLEDGEMENT viii
LIST OF FIGURES ix
LIST OF TABLES x
CHAPTER 1
INTRODUCTION AND BACKGROUND TO THE STUDY
1.1 Introduction 1
1.2 Research problem 2
1.3 Research objectives 2
1.3.1 Main objective 2
1.3.2 Sub-objectives of the study 2
1.4 Rationale for study 3
1.5 Limitations 3
1.6 Overview of chapters 4
1.7 Conclusion 5
ii
CHAPTER 2
LITERATURE REVIEW
2.1 Introduction 6
2.2 The Four COMs approach 6
2.3 Comfort 7
2.3.1 Involvement of Stakeholders 7
2.3.2 Competent Project Manager 8
2.3.3 Availability of Resources 11
2.3.4 Adequate funding through the project 13
2.3.5 Comprehensive Contract documentation 14
2.4 Competence 15
2.4.1 Utilization of up-to-date technology 15
2.4.2 Proper emphasis on past experience 15
2.4.3 Competent team 16
2.4.4 Awarding bids to the right designer/contractor 17
2.5 Commitment 18
2.5.1 Top management support 18
2.5.2 Commitment to the Project 18
2.5.3 Clear objectives and scope 19
2.5.4 Political Support 19
2.6 Communication 20
2.6.1 Shared Project Vision 20
iii
2.6.2 Project Plans updated regularly 20
2.6.2.1 Purpose of planning 21
2.6.2.2 Nature of planning 24
2.6.2.3 Planning Process and Outcome 26
2.6.2.4 Developing objectives 26
2.6.3 Frequent Project Meetings 29
2.6.4 Community involvement 29
2.6.5 Handover Procedures 30
2.7 Conclusion 30
CHAPTER 3
RESEARCH METHODOLOGY
3.1 Introduction 31
3.2 Study Type 31
3.3 Target Population 31
3.4 Data collection 32
3.5 Questionnaire design 32
3.6 Data analysis 33
3.6.1 Descriptive Statistics 33
3.6.2 Inferential Statistics 33
3.7 Reliability and validity 34
3.8 Conclusion 34
iv
CHAPTER 4
DATA PRESENTATION AND ANALYSIS OF FINDINGS
4.1 Introduction 36
4.2 Demographic profiles of respondents 37
4.3 Discussion of the four COMs 40
4.3.1 Comfort 40
4.3.2 Competence 42
4.3.3 Commitment 43
4.3.4 Communication 45
4.4 Descriptive analysis: The Mann-Whitney test and Kruskal-Wallis anova 46
4.4.1 Differences between project managers and contractors 46
4.4.2 Differences between male and females perceptions 47
4.4.3 Effect of age between project managers and contractors 49
4.4.4 Tenure in the construction industry 51
4.4.5 Effect of industry sector in contractors and project managers 54
4.5 Conclusion 56
CHAPTER 5
CONCLUSIONS AND RECOMMENDATIONS
5.1 Introduction 57
5.2 The objectives of the study 57
5.2.1 Identifying the critical success factors 57
v
5.2.2 Assessing the perceptions of contractors and project managers relating to critical
success factors 58
5.2.3 Determining whether there is a significant difference in the perceptions of
contractors and project managers on the critical success factors 58
5.2.4 Examining the influence of the biographic variables on the critical success
factors for project managers and contractors 59
5.3 Conclusions about findings of the study 59
5.4 Recommendations based on findings 60
5.5 Research recommendations for further research 60
5.6 Restrictions of the study 61
5.7 Conclusion 62
BIBLIOGRAPHY 63
APPENDICES 74
Appendix One: Letter of consent 74
Appendix Two: Questionnaire 75
vi
ABSTRACT
This study presents an assessment of the perceptions of project managers and contractors
regarding the critical success factors influencing project success in the Durban construction
industry. To achieve this aim, questionnaires were administered to 95 project managers and 61
active grade four contractors in Durban. The critical success factors are encapsulated in
components, that is, comfort, competence, communication and commitment (COMs). These
components make up the four COMs model which forms a basis for evaluation of the
questionnaires.
An in-depth analysis review of the literature on the critical success factors in the construction
industry has affirmed the four COMs model. The interpretation of this quantitative study was
conducted with the use of descriptive and inferential statistics presented in a tabular format.
The findings revealed that both project managers and contractors strongly support the critical
success factors as significant in achieving project success. There was no significant difference in
their perception of critical success factors, given the biographic differences between them.
Achieving project success has eluded the Durban construction industry to a point where it is
battling to keep existing clients. The critical success factors identified in this study have provided
a way forward for project managers and contractors. Hence, the results presented in this study
can be used as a guideline for successful execution of construction projects in Durban. The
Construction Industry Development Board (CIDB) can play a pivotal role by providing an
enabling environment which will facilitate the adoption of the results of this study. For example,
the CIDB can amend its legislation on contracts by making them simple to comprehend. In this
way the number of lawsuits between project managers and contractors would be drastically
reduced.

vii
DECLARATION
I, Thulani Armstrong Msani, hereby declare that the work presented in this dissertation
represents my own work and findings, except where indicated, and that all references, to the best
of my knowledge, are accurately reported.
-------------------------------------- -----------------------------
Thulani Armstrong Msani Date
viii
ACKNOWLEDGEMENTS
I would like to take this opportunity to thank God Almighty for giving me enough wisdom to
accomplish this study.
This study would have not materialized without the guidance and encouragement of my
supervisor, Dr H. L. Garbharran and co-supervisor, Mr A. Moorley from the Faculty of
Management Sciences at Durban University of Technology (DUT).
My sincere thanks go to Mr J. M. Naidoo (statistician) from the University of KwaZulu-Natal,
Westville campus, for his sterling work on data analysis for this study and the recommendations
he made on the objectives. Mr Sookhlal from TBP Building and civils at Westville has been very
instrumental in streamlining this study. One remains indebted to Lucky Dlamini from the S3
Level 3 BTech labs at DUT (Steve Biko campus) for giving me access to the computer, long
before the Research Commons in the library were opened in 2010.
My special thanks go to my family and friends who are too many to count, for their
encouragement and support.

ix
LIST OF FIGURES
Figure 1: Monitoring of buffers 13
Figure 2: Minimization of unknown elements 22
Figure 3: Continuous and iterative nature of project planning 25
x
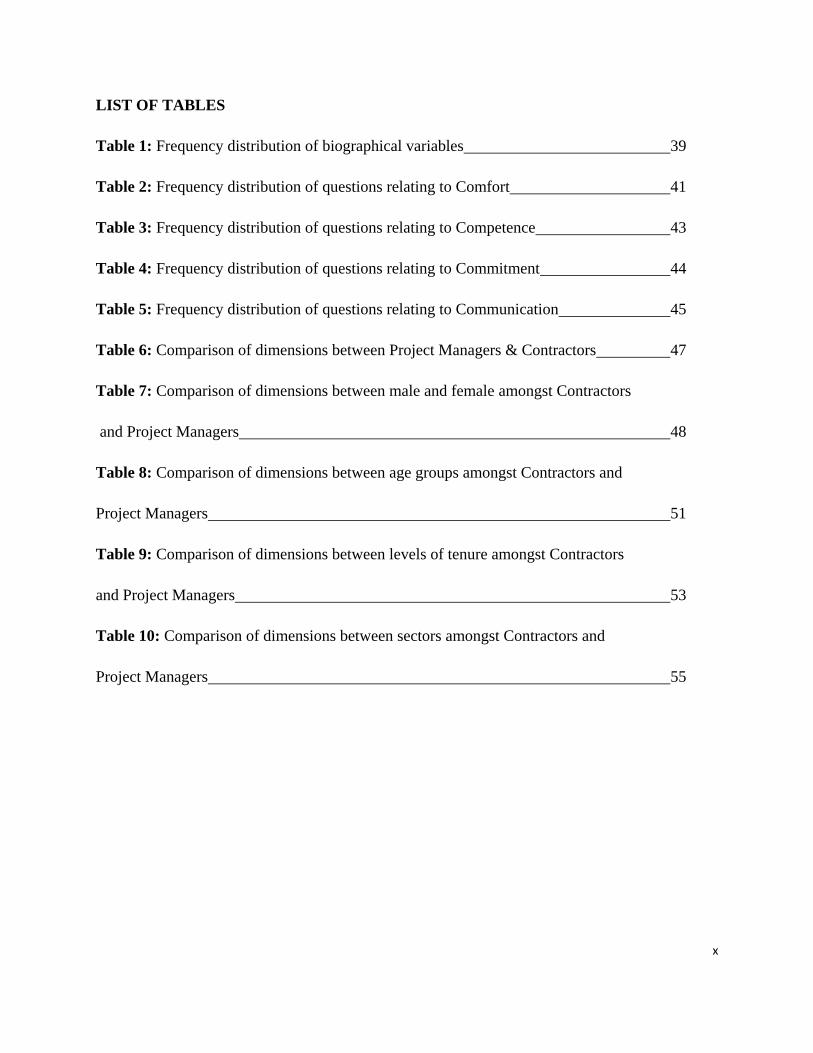
LIST OF TABLES
Table 1: Frequency distribution of biographical variables 39
Table 2: Frequency distribution of questions relating to Comfort 41
Table 3: Frequency distribution of questions relating to Competence 43
Table 4: Frequency distribution of questions relating to Commitment 44
Table 5: Frequency distribution of questions relating to Communication 45
Table 6: Comparison of dimensions between Project Managers & Contractors 47
Table 7: Comparison of dimensions between male and female amongst Contractors
and Project Managers 48
Table 8: Comparison of dimensions between age groups amongst Contractors and
Project Managers 51
Table 9: Comparison of dimensions between levels of tenure amongst Contractors
and Project Managers 53
Table 10: Comparison of dimensions between sectors amongst Contractors and
Project Managers 55
1
CHAPTER 1
INTRODUCTION AND BACKGROUND TO THE STUDY
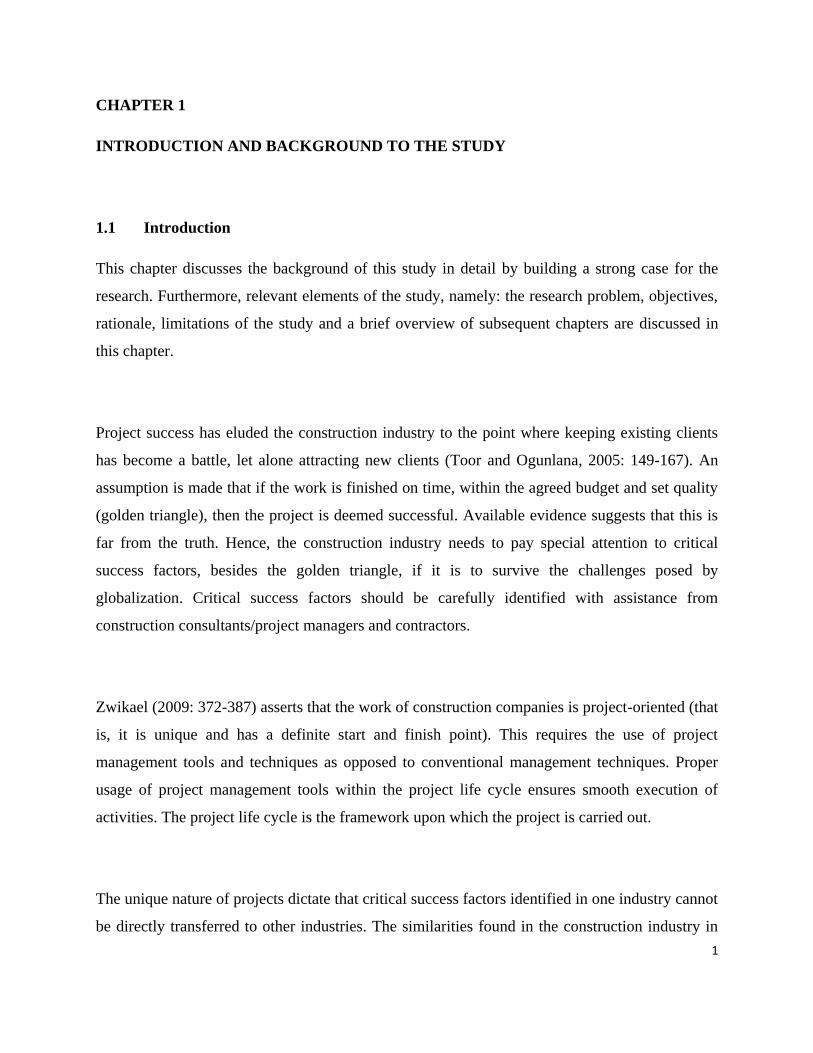
1.1 Introduction
This chapter discusses the background of this study in detail by building a strong case for the
research. Furthermore, relevant elements of the study, namely: the research problem, objectives,
rationale, limitations of the study and a brief overview of subsequent chapters are discussed in
this chapter.
Project success has eluded the construction industry to the point where keeping existing clients
has become a battle, let alone attracting new clients (Toor and Ogunlana, 2005: 149-167). An
assumption is made that if the work is finished on time, within the agreed budget and set quality
(golden triangle), then the project is deemed successful. Available evidence suggests that this is
far from the truth. Hence, the construction industry needs to pay special attention to critical
success factors, besides the golden triangle, if it is to survive the challenges posed by
globalization. Critical success factors should be carefully identified with assistance from
construction consultants/project managers and contractors.
Zwikael (2009: 372-387) asserts that the work of construction companies is project-oriented (that
is, it is unique and has a definite start and finish point). This requires the use of project
management tools and techniques as opposed to conventional management techniques. Proper
usage of project management tools within the project life cycle ensures smooth execution of
activities. The project life cycle is the framework upon which the project is carried out.
The unique nature of projects dictate that critical success factors identified in one industry cannot
be directly transferred to other industries. The similarities found in the construction industry in
2
developing countries such as South Africa makes sharing of knowledge easy. The project
manager (PM) acts as a single point of contact responsible for harnessing identified critical
success factors towards achieving project success (Yang, Shen and Ho, 2009: 159-175).
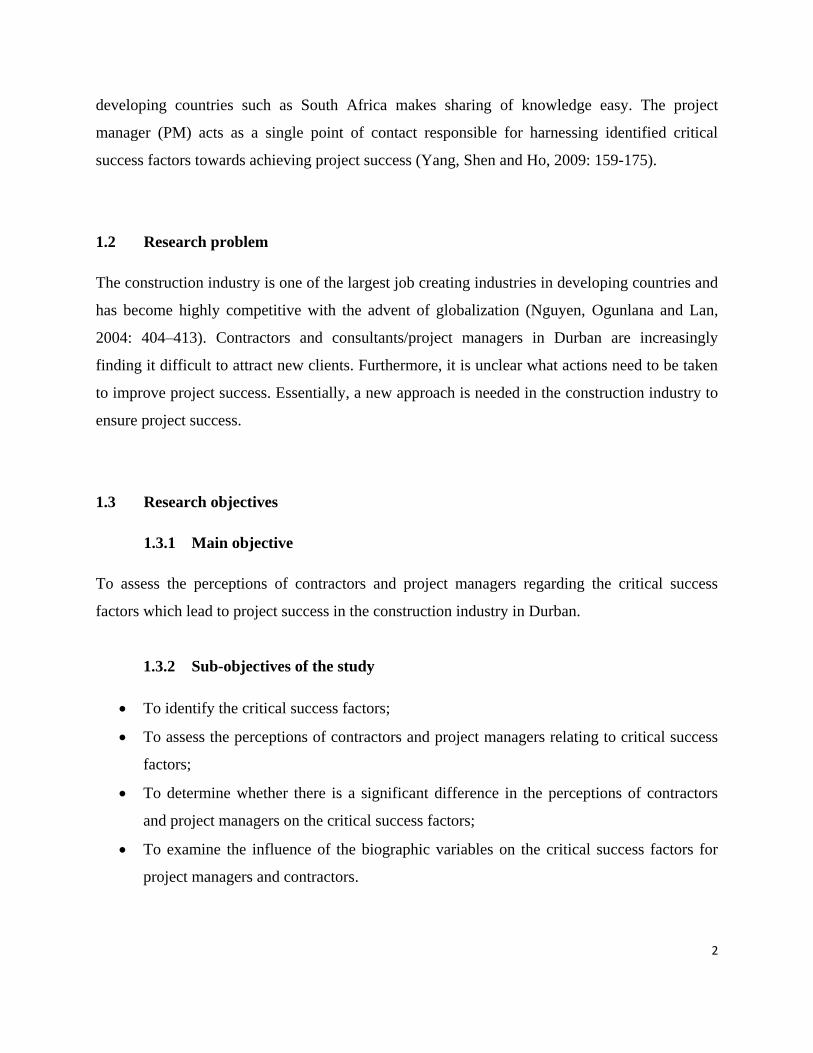
1.2 Research problem
The construction industry is one of the largest job creating industries in developing countries and
has become highly competitive with the advent of globalization (Nguyen, Ogunlana and Lan,
2004: 404–413). Contractors and consultants/project managers in Durban are increasingly
finding it difficult to attract new clients. Furthermore, it is unclear what actions need to be taken
to improve project success. Essentially, a new approach is needed in the construction industry to
ensure project success.
1.3 Research objectives
1.3.1 Main objective
To assess the perceptions of contractors and project managers regarding the critical success
factors which lead to project success in the construction industry in Durban.
1.3.2 Sub-objectives of the study
To identify the critical success factors;
To assess the perceptions of contractors and project managers relating to critical success
factors;
To determine whether there is a significant difference in the perceptions of contractors
and project managers on the critical success factors;
To examine the influence of the biographic variables on the critical success factors for
project managers and contractors.
3
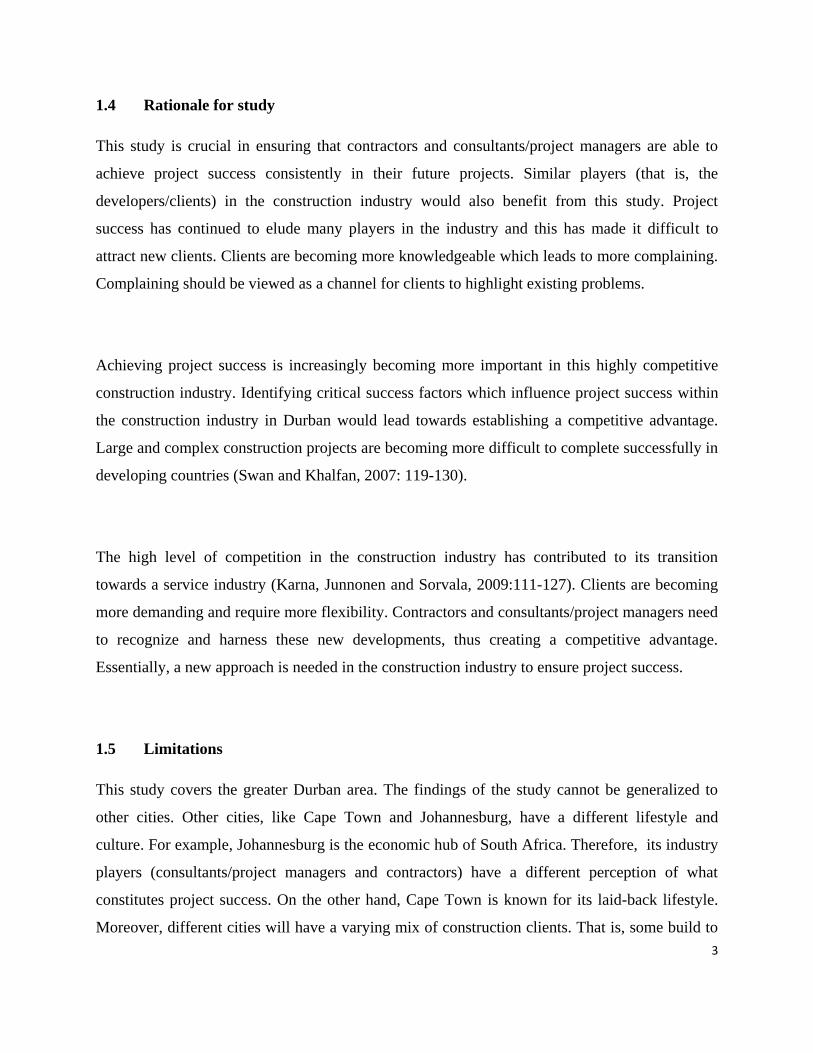
1.4 Rationale for study
This study is crucial in ensuring that contractors and consultants/project managers are able to
achieve project success consistently in their future projects. Similar players (that is, the
developers/clients) in the construction industry would also benefit from this study. Project
success has continued to elude many players in the industry and this has made it difficult to
attract new clients. Clients are becoming more knowledgeable which leads to more complaining.
Complaining should be viewed as a channel for clients to highlight existing problems.
Achieving project success is increasingly becoming more important in this highly competitive
construction industry. Identifying critical success factors which influence project success within
the construction industry in Durban would lead towards establishing a competitive advantage.
Large and complex construction projects are becoming more difficult to complete successfully in
developing countries (Swan and Khalfan, 2007: 119-130).
The high level of competition in the construction industry has contributed to its transition
towards a service industry (Karna, Junnonen and Sorvala, 2009:111-127). Clients are becoming
more demanding and require more flexibility. Contractors and consultants/project managers need
to recognize and harness these new developments, thus creating a competitive advantage.
Essentially, a new approach is needed in the construction industry to ensure project success.
1.5 Limitations
This study covers the greater Durban area. The findings of the study cannot be generalized to
other cities. Other cities, like Cape Town and Johannesburg, have a different lifestyle and
culture. For example, Johannesburg is the economic hub of South Africa. Therefore, its industry
players (consultants/project managers and contractors) have a different perception of what
constitutes project success. On the other hand, Cape Town is known for its laid-back lifestyle.
Moreover, different cities will have a varying mix of construction clients. That is, some build to
4
own, to sell and to accommodate employees and rent out some space. Therefore, the influence on
the quality level required, amount of money to be utilized and level of urgency in executing the
project varies. This study is confined to business projects only in the greater Durban area. It does
not cover the residential projects.
1.6 Overview of chapters
Chapter One: Introduction
Chapter one is an introduction and highlights the motivation for the study. This chapter also
focuses on the purpose and rationale for the study, research objectives and the problem area. The
chapter will also outline the limitations of the study.
Chapter Two: Literature Review
Chapter two will consist of a review of the literature on critical success factors in relation to
project success in the construction industry. This chapter will review the industry players‟
(clients/developers, consultants and contractors) perceptions concerning a successful project (that
is, critical success factors). It will also present a review of the literature on the skills that should
be possessed by the project manager.
Chapter Three: Research Methodology
Chapter three will explain the research methodology used and, in particular, the data collection
method, the questionnaire design, the sampling method and data analysis.
5
Chapter Four: Analysis and Presentation of Results
Chapter four will present the results of the survey. The explanation of the results will start with a
discussion of the demographic information using frequencies and percentages. This discussion
will be followed by a comparison between the level of project success achieved and the presence
of critical success factors in the project environment. Variations resulting from the presence and
non-presence of the critical success factors in the project environment will be presented.
Chapter Five: Conclusions and Recommendations
Chapter five will contain a summary of the previous chapters, and will present conclusions and
recommendations based on the empirical findings. Recommendations will be made for future
research.
1.7 Conclusion
In this chapter, a strong case was made for this study by presenting a background on the research
problem. Furthermore, relevant elements of the study, namely: the research problem, objectives,
rationale, limitations of the study and a brief overview of subsequent chapters were discussed in
this chapter.
The next chapter provides the literature review on critical success factors influencing project
success in the building construction industry.
6
CHAPTER 2
LITERATURE REVIEW
CRITICAL PROJECT SUCCESS FACTORS IN THE CONSTRUCTION INDUSTRY
2.1 Introduction
Chapter one outlined the background for this study. Relevant elements of the study, namely: the
research problem, objectives, rationale, limitations of the study and a brief overview of
subsequent chapters were discussed. This chapter reviews the literature on the critical success
factors influencing project success in the building construction industry. It highlights the need to
look beyond the golden triangle of time, cost and quality in a quest to achieve project success. In
a bid to streamline the discussion, critical success factors are grouped into four categories,
namely: comfort, competence, communication and commitment (COMs). The project managers
and contractors are positioned as the major role players in the construction industry. Thus, an in-
depth discussion on the skills that should be possessed by the project manager is also undertaken.
The aim of the literature review is to provide a context for the entire research study. It is within
this context that the researcher is able to develop a solid case for undertaking the study.
Reviewing existing literature, on the aspect in question, allows the researcher to identify the
“gap” that exists. The researcher achieves this by performing an in-depth critique of the existing
literature. An in-depth critique entails identifying shortcomings on the existing literature and
making possible contributions. Furthermore, the literature review gives direction to the research
methodology which has to be used in this study. Using the correct research methodology ensures
that the findings are meaningful to the researcher.
2.2 The Four COMs approach
Project success in the construction industry in South Africa, and in most developing countries, is
measured by the “golden triangle” parameters such as time, cost and quality (Ojiako, Johansen
and Greenwood, 2008: 405-417). The high number of project failures suggests the existence of
underlying critical success factors which have not been identified. Critical success factors are
7
those inputs to the project management system that directly increase the likelihood of achieving
project success. Nguyen, Ogunlana and Lan (2004: 404-413) identified and grouped success
factors under four categories which are entitled the four COMs: comfort, competence,
commitment and communication.
2.3 Comfort
2.3.1 Involvement of Stakeholders
Swan and Khalfan (2007: 119-130) advise that management of external stakeholders, such as the
public, are crucial for successful project delivery. The needs of stakeholders have to be managed
and influenced in a manner that ensures project success. Stakeholders can be classified in two
categories: primary and secondary. Primary stakeholders have a legal contractual relationship to
the project. For example, an electrical engineering subcontractor is appointed to provide wiring
for the building to be constructed. Secondary stakeholders do not form part of the daily
discussions and decisions but can influence the project positively or negatively. For instance, the
public is gaining significant bargaining power nowadays.
Periodic reassessment of stakeholders should be performed by the project manager (PM) at
various stages of the project (Assudani and Kloppenborg, 2010: 67-80). This would enable the
PM to address any concerns from stakeholders before they impact negatively on the project.
Public projects have a varied mix of secondary stakeholders. For example, the community,
politicians and the municipality‟s views may change as the project receives more publicity. The
community is most likely to change their stance if the environmental impact of the project
possesses danger to their long-term health. For instance, the building of an oil refinery would, in
the long-term, put the lives of the community nearby at risk, due to its emissions. Nowadays,
secondary stakeholders are becoming more knowledgeable about their rights and the advent of
the internet has made it possible to source information from far afield places. Hence, the
bargaining power of secondary stakeholders is growing from strength to strength.
8
Politicians‟ views on the project are motivated by different interests, namely: to score political
points; to boost one‟s political career and to be genuinely concerned of the well-being of the
community. Projects at municipality level may result in residents‟ rates being increased in order
to finance and maintain the structure afterwards. Politicians would capitalize on this in a bid to
score political points, more especially if local municipality elections are around the corner. It‟s
difficult for unsuspecting communities to discern whether the politicians are raising concerns on
the project in a bid to boost their political career or are genuinely concerned about the
community. Hence, the project manager (PM) should keep a close watch on politicians as they
can easily mobilize communities to act against the project or make demands that would delay the
project.
Municipalities are headed by leaders who subscribe to certain political parties. The executive
committee of the leading political party can influence the municipality to reduce funding for the
project. Reducing funding will require significant changes to the scope and the project plan.
Thus, it is more difficult for the PM to handle public sector projects. Successful management of
stakeholders is dependent largely on the PM developing a well-defined communication plan
(Rowlinson and Cheung, 2008: 611-623).
2.3.2 Competent Project Manager
The project manager has to possess both technical and “soft” skills in order to be deemed
competent. The technical skills that should be possessed by the PM in the building construction
industry include being a subject matter-expert (SME). That is, s/he must have an in-depth
knowledge of the structural design of buildings. Hence, PM‟s have a degree or a national
diploma in architecture. Having such knowledge enables the PM to provide leadership in the
manner in which the construction must be conducted. Contractors develop respect for a PM who
is able to give direction on technical challenges of construction.
Soft skills complement technical skills of the PM and require constant development. These skills
include: team management, emotional intelligence, transformational leadership and conflict
9
management. One of the crucial primary tasks of the PM is to carefully define roles and
responsibilities of the project team members (Anantatmula, 2010: 13-22). Defining roles for
team members has to consider individual strengths and weaknesses. In this way, the PM won‟t
have to micromanage team members, thereby allowing him/her ample time to attend to pressing
matters.
The building construction industry is an emotionally demanding environment. Hence, the PM
has to develop sufficient capacity to solve problems by carefully utilizing his/her emotions
(Corona, 2010: 22-34). The careful use of emotions (emotional intelligence) by the PM can
contribute immensely towards achieving project success. Careful analysis of all the stakeholders‟
emotions allows the PM to respond with a strategy that will be embraced by all concerned. For
example, community members would be emotional about demolishing a memorial building in
order to make way for a new environmentally friendly building and lobby against such a
development. The PM has to carefully grasp the extent of the community‟s emotional state and
devise a strategy that would highlight the importance of constructing an environmentally friendly
building. This strategy would also entail showing empathy to emotional attachment that the
community has developed towards the building.
By and large, projects bring about change in organizations. Thus, the PM‟s level of emotional
intelligence will determine how he/she responds to the change (Clarke, 2010: 604-624). The rate
of change within the construction industry is fast and the PM needs to be decisive at all times.
Nurturing the skill of emotional intelligence will prove useful for the PM in facilitating project
success.
Malach-Pines, Dvir and Sadech (2009: 268-291) assert that project managers achieve a high
degree of project success when they manage projects which match their personality. Moreover,
the size and complexity of the project calls for varying degrees of technical and personal skills.
A subject-matter-expert (SME) project manager should avoid the temptation of micromanaging
in a highly technical project. Limsila and Ogunlana (2008: 164-184) suggest that a
10
transformational leadership style ensures high work performance and organizational commitment
of subordinates. Transformational leaders are able to inspire subordinates to transcend their own
interests for the benefit of the project. Moreover, they are able to leave a profound effect on
everyone that they interact with at any organizational level.
Achieving project success within the construction industry would also require a comprehensive
overhaul of quality management. Lack of clear quality benchmarks has made it difficult to
achieve project success within the construction industry. Transformational leadership is crucial
in implementing a comprehensive total quality management programme (Rui, Emerson and Luis,
2010: 7-18). As a transformational leader, the PM would be able to gain the needed trust from
project team members and stakeholders alike. The trust gained would allow the PM to make the
necessary quality adjustments which will facilitate project success.
Projects, by their nature, require individuals from different backgrounds, cultures and expertise
to work towards a common goal. This is a breathing ground for conflicts as individuals with
strong egos are likely to clash. Thus, it is increasingly becoming important for the PM to develop
conflict management skills. Resolving conflicts would require the PM to determine the most
appropriate attitude to have during negotiations to facilitate the desired outcome. Attitudes that
would not facilitate the desired outcome would then be avoided (Yousefi, Hipel and Hegazy,
2010: 99-107). For instance, the PM should maintain a concerted effort to listen attentively to
clashing parties and remain impartial at all times. Essentially, the PM must seek win-win
outcomes for parties concerned. This would entail nudging the parties to take the “middle road”
by encountering short-term loses in order to gain in the long-term.
Furthermore, successful project managers have exhibited seven traits which facilitate project
success, besides technical and soft skills. These traits include taking an initiative, being
enthusiastic, being finance /business inclined, wanting to lead, being analytical, handling
autonomy and wanting challenges. Successful project managers are all self-starters. They are not
11
afraid to take the initiative by taking a plunge into the deep end. Taking an initiative in projects
signals a high level of confidence by the PM and commitment to the organization. Enthusiastic
project managers find it easy to motivate those around them. Project team members need to be
constantly motivated through the challenges they encounter in the project. Having a natural touch
for business enables the PM to solve complex problems, respond to change faster and even
anticipate change beforehand. Scenario planning has elevated successful PM‟s head and
shoulders above their peers (Wideman, 2010: 7).
Successful project managers naturally want to lead (Wideman, 2010: 7). This demystifies the
belief that project managers get into the profession by accident. Project managers, that want to
lead, naturally are more than willing to learn new skills and embrace challenges that are inherent
in projects. Avoiding the trap of “paralysis by analysis”, when making business decisions, comes
naturally to successful project managers. Hence, successful PM‟s are decisive when dealing with
change. Handling autonomy comes naturally to successful project managers. For example,
successful PM‟s don‟t have to be told what to do, when to do it and how it should be done. The
organization develops immense respect and trust towards the project manager. Wanting new
challenges is synonymous with successful project managers. The abovementioned traits clearly
form a foundation or a template for choosing project managers that are intrinsically positioned to
facilitate project success.
2.3.3 Availability of Resources
Projects, within organizations, often involve different departments and make it difficult for the
PM to gain control over resources. The PM is often left at the mercy of functional managers
since he/she has no positional power within the organization. This can easily create unnecessary
conflict between the PM and functional managers. Therefore, the PM has to formulate a resource
management plan in conjunction with relevant stakeholders to ensure that resources are available
when needed. This plan has to be adequately developed and distributed to every section that is
involved in the project (Newton, 2005: 110).
12
A resource management plan is not foolproof. Unforeseen uncertainties can still hamper the
availability of resources. For example, the sharp rise in the demand of cement can adversely
affect its availability. In the run-up towards the Federation of International Football Association
(FIFA) Soccer World Cup in South Africa (SA), there was a significant shortage of cement.
Cement had to be sourced from far afield places as the demand had increased sharply throughout
the country due to large scale construction projects that had to be completed before kick-off. The
usage of a feeding buffer at an insert point is helpful in dealing with uncertainties (Zhen Yu, Wei
Yang and Jian, 2010: 1056-1060). Figure 1 illustrates clearly how a feeding buffer can be
introduced to the existing network diagram. A network diagram is a schematic representation of
the sequence of planned events for the entire projects‟ activities. The size of the feeding buffer
would be inferred by assessing the level of risk associated with the project. Risk assessment
takes place during the feasibility study in the initiation phase of the project life-cycle.
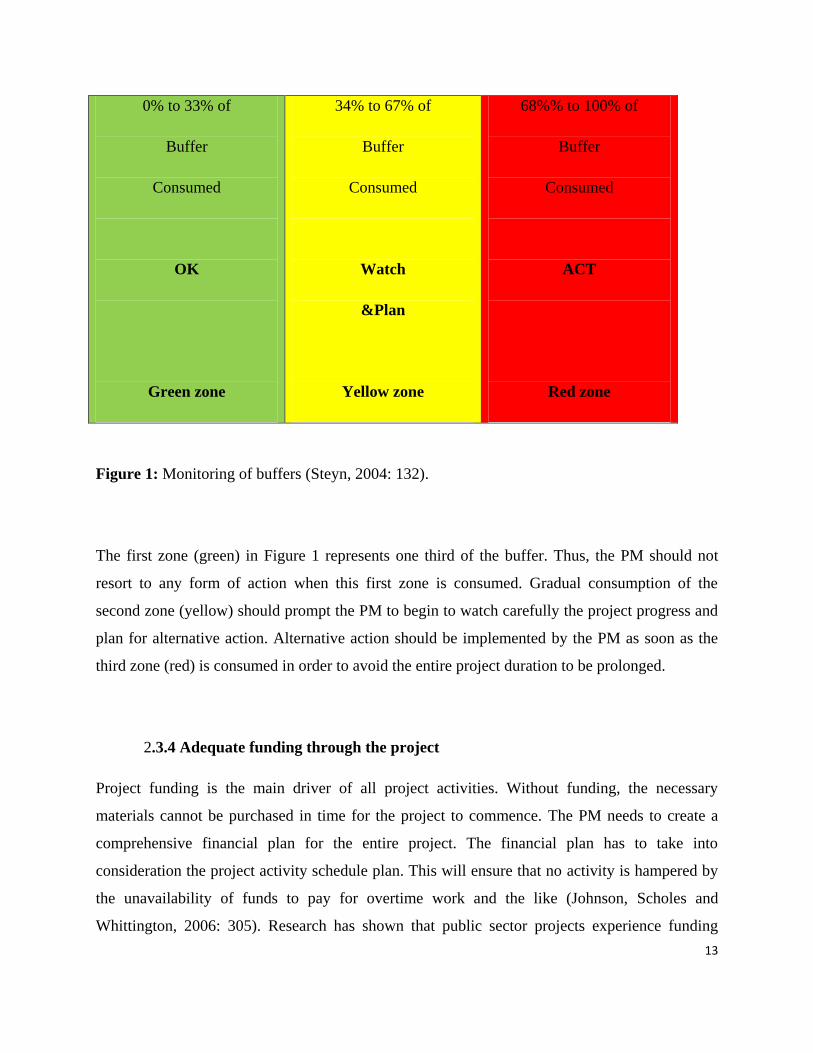
The PM exerts control over the project by dividing the feeding buffer into three zones of equal
size, as seen in Figure 1 (Steyn, 2004: 132).
13
0% to 33% of
Buffer
Consumed
OK
Green zone
34% to 67% of
Buffer
Consumed
Watch
&Plan
Yellow zone
68%% to 100% of
Buffer
Consumed
ACT
Red zone
Figure 1: Monitoring of buffers (Steyn, 2004: 132).
The first zone (green) in Figure 1 represents one third of the buffer. Thus, the PM should not
resort to any form of action when this first zone is consumed. Gradual consumption of the
second zone (yellow) should prompt the PM to begin to watch carefully the project progress and
plan for alternative action. Alternative action should be implemented by the PM as soon as the
third zone (red) is consumed in order to avoid the entire project duration to be prolonged.
2.3.4 Adequate funding through the project
Project funding is the main driver of all project activities. Without funding, the necessary
materials cannot be purchased in time for the project to commence. The PM needs to create a
comprehensive financial plan for the entire project. The financial plan has to take into
consideration the project activity schedule plan. This will ensure that no activity is hampered by
the unavailability of funds to pay for overtime work and the like (Johnson, Scholes and
Whittington, 2006: 305). Research has shown that public sector projects experience funding
14
problems more than private projects (Zwelisha, 2010). This is due to several problems, namely:
structural issues, political issues, financial management capacity and change of leadership.
The organizational structure of government makes it difficult for funds to be channelled through
it smoothly. For instance, in national projects, funds come all the way from the national sphere of
government through the provincial sphere before they reach the local municipality level. The
amount of red tape in between the spheres delays funds for projects in most cases. Political
support has proved crucial in public sector projects. Projects that would be most beneficial to the
citizenry are most likely to get funding with immediate effect. This phenomenon is mostly
prevalent at local municipality level and is fueled by the benefit-cost analysis approach
(Samuelson and Marks, 2006: 17). Councillors of local municipalities find it difficult to deliver
community projects within the stipulated date due to the availability of funds. Local
municipalities are mostly inundated with a range of projects which calls for prudent financial
management. A change of leadership, especially at a local municipality level, can signal a
change of priorities. Hence, funding for projects can easily be minimized or even cancelled and
channelled elsewhere.
2.3.5 Comprehensive Contract documentation
All relevant stakeholders have to enter into contractual agreements regarding the activities to be
performed in the project. The PM has to ensure that even internal stakeholders, such as
functional managers, have signed performance contracts. The contracts must clearly stipulate the
quality, time and cost parameters to be met. If no contract is signed by parties, it would be
difficult to implement any project goals (Kerzner, 2006: 826). The growing number of lawsuits,
nowadays, between contractors and project managers, is not encouraging (Sookhalal, 2010). This
calls for the simplification of the contract documents and involvement of a mediator before a
lawsuit is considered. The mediator should have in-depth knowledge of the building construction
industry.
15
2.4 Competence
2.4.1 Utilization of up-to-date technology
The construction industry has seen immense technological developments over the past ten years
in developed countries. Developing countries, like South Africa, are experiencing problems of
selecting the right technology. This problem is further complicated by the incompetence of the
project team. Adopting new technology and utilizing it to its full potential has become critical in
achieving a competitive advantage in the construction industry. The PM has to identify all
technology needs for the project during the briefing (scope formulation) stage (Nguyen,
Ogunlana and Lan, 2004: 404-413).
The usage of technology in hi-tech work functions has been associated with project cost
successes (Yang, 2007: 1041-1051). The project manager needs to bear in mind that time and
costs are inseparable (Kerzner, 2006: 597). Thus, any technology that would save time during the
execution phase of the project should be carefully considered. Ideally, the technology chosen
should require minimal maintenance and training for employees. The PM should also realize that
the cost savings may only be realized in the long-term when all employees are fully trained.
Thus, the payback period for the new technology should be carefully calculated. The payback
period is the duration (months or years) it would take for the technology to cover the initial
capital outlay.
2.4.2 Proper emphasis on past experience
Tacit knowledge plays a vital role in enhancing organizational performance and achievement of
competitive advantage in the construction industry (Pathirage, Amaratunga and Haigh, 2007:
115-126). Tacit knowledge is gained over the years by trial and error and is mostly not
documented. The inclusion of the competent PM during scope formulation will enable him/her to
ascertain the level of tacit knowledge needed for the project. Harrison (2007: 15) points out that
a competent PM would then look within the organization and assess if adequate levels of tacit
16
knowledge exist and if a suitable person may be required to ensure the smooth execution of the
project. Chan, Wong and Lam (2006: 909-927) point out that the PM should have previous
experience in public housing in order to increase the likelihood of achieving project success in
this sector.
The PM should encourage project members to document tacit knowledge gained from the
project. A project information management system (PIMS), that gives common access to
relevant parties, should be utilized (Steyn, 2004: 51). This would ensure that mistakes made in
current projects are not carried forward to new projects. Experience gained in executing public
sector projects is often lost when the PM leaves the organization. Execution of public sector
projects is particularly difficult, due to the number of stakeholders involved. Up–and coming
project managers can learn a lot from experienced PM‟s if their experiences are documented in
systems such as the PIMS. A socially cohesive environment needs to be created in order to
encourage tacit knowledge to be communicated (Subashini, 2010: 36-39). This is due to the fact
that tacit knowledge is elusive and embedded in the individual. The individual would be
reluctant to share such knowledge if trust and mutual commitment is not present.
2.4.3 Competent team
The PM has to assemble the most competent team and take into consideration cultural
differences. Muller, Spang and Ozcan (2009: 70-93) advise that project team members from
different cultural backgrounds will have varying decision – making styles. For instance, Swedish
teams are more transparent, whilst German teams are willing to accept unpopular decisions.
Cultural differences can cause unnecessary tension amongst team members, if not addressed
appropriately. A thorough skills gap analysis has to be conducted by the PM and relevant
functional managers. Additional training should be provided to team members that get to do the
actual work in the project. Furthermore, London, Chen and Bavinton (2005: 295-318) propose
that a positive and continual response to change is the best way of addressing cross-cultural
communication difficulties within teams.
17
Project management teams can achieve a competitive advantage by being engaged in a steady
flow of hi-return projects (Melkonian and Picq, 2010: 79-90). This calls for top management to
be active is lining up projects with a view of avoiding to keep the project team idle for extended
periods. No amount of training can compare to on-the job training that is achieved by trial and
error. Hence, engaging the project team on a steady flow of hi-return projects offers an excellent
opportunity to learn new skills.
2.4.4 Awarding bids to the right designer/contractor
The process of awarding of bids to the right project manager/contractor has increased the level of
competition in the construction industry, especially in the public sector. Most governments in the
developing countries, like South Africa, have limited financial resources. Therefore,
governments tend to award bids to contractors that have a proven track record and hold the most
cost-effective proposal. A benefit-cost analysis should be carried out prior to the awarding
process (Samuelson and Marks, 2006: 17). This provides clarity on the amount to be spent on the
project.
The best method to use when selecting contractors is the multiple criteria (Phillips, Martin,
Dainty and Price, 2008: 307-320). The multiple criteria method considers the following issues:
understanding of client‟s objectives, construction practices, successful track record, quality
management procedures, transparency of cost data and understanding of partnering. Moreover,
the method also considers existence of established health and safety policy, understanding of best
value and technical ability. The ability of contractors to clearly comprehend the client‟s
objectives in the project scope document is crucial in achieving project success (Harrison, 2007:
13). Clients nowadays are becoming more knowledgeable about the building construction
industry (Toor and Ogunlana, 2009: 149-167). Project objectives should ideally be specific,
measurable, assignable, realistic and time related (SMART). The prospective contractor should
be able to implement the latest construction practices stipulated by the governing authority, i.e.,
the Construction Industry Development Board (CIDB) in South Africa (SA).
18
A successful track record of previous projects bodes well for the prospective contractor. This
track record will go a long way in proving that the contractor is not a fly-by-night case and can
be trusted. Adherence to quality management procedures proves the credibility of the contractor.
For example, the contractor should be listed as an “active” member on the CIDB list of
contractors. The contractor should clearly illustrate in the bid proposal how cost data was
derived. This would ensure that only realistic costing of the project is undertaken and under
costing is discouraged. Under costing, with a view of increasing chances of being chosen,
undermines the bidding process.
2.5 Commitment
2.5.1 Top management support
Projects come about due to a strategic objective that the firm has to achieve (Johnson, Scholes
and Whittington, 2006: 504). Therefore, top management support has to be unwavering
throughout the project. Top management support goes beyond the provision of funds and making
resources available. It includes aspects such as providing clarity on the project objectives and
reassuring project team members that they will be valuable after the project. Changes that would
come about due to the project can cause team members to be highly skeptical of their future in
the organization. This will directly affect their level of performance towards the project.
2.5.2 Commitment to the Project
Changes induced by the project can even result in individualism, where each person pursues their
goals which are against those of the project (Nguyen, Ogunlana and Lan, 2004: 404-413). The
PM needs to avoid such situations from occurring, by conducting an open briefing session with
all affected parties before the project commences and clarify project objectives with a view of
getting their buy-in. Occasional visits throughout the project by top management provides
encouragement to the project team. In order to avoid individualism, the PM has to draw up a
19
linear responsibility chart (LRC) indicating exactly the person responsible for a specific activity
(Kerzner, 2006: 200).
Organizations have to create jobs that offer a clear glide path (growth plan) for project
employees to give optimal commitment (Jafri, 2010: 62-68). Project employees have to perceive
a strong component of professionalism about their jobs. An environment that encourages
employees to consider project management as a profession is a breathing ground for innovation.
Employees that feel valuable are most likely to be innovative and constantly seek better methods
of improving the quality of work performed. A low level of organizational commitment from
project employees is bound to translate to less than optimal performance in the project activities
(Dwivedula and Bredillet, 2010: 79-88).
2.5.3 Clear objectives and scope
Project objectives have to be iterated and validated on a regular basis throughout the project life-
cycle (Lindahl and Ryd, 2007: 147-156). The scope should be as simple as possible and cover all
possible “grey” areas that may cause confusion. It is widely accepted that project scope (brief)
changes are inevitable. This is due to the fact that reality can turn out to be different to what was
expected. Othman, Hassan and Pasquire (2004: 248-258) believe that adopting a dynamic brief
development (DBD) approach to the project scope will facilitate project success. However,
changes made to the scope during the execution phase will cost more than if they were made at
the initiation phase. It is also worth noting that costs and time are inseparable (Kerzner, 2006:
597). Research (Forsythe, 2008: 485-496) reveals that construction clients make quality
judgements progressively throughout the project. This supports the DBD approach of scope
management.
20
2.5.4 Political Support
Public projects are easily influenced by the politics of the day. For example, energy utilities have
to get as much political support as possible in a bid to convince the citizenry of the need to build
a nuclear power station. Opposition parties in parliament may try to influence the citizenry to go
for a hydro power station with substantial cost savings. This can prove to be a nightmare for the
power utility without political support from the ruling party in government. Commitment from
legitimate stakeholders, like the non - governmental organizations (NGOs) and ruling party in
parliament, remains crucial to the success of public projects (Jacobson and Choi, 2008: 637-657).
2.6 Communication
2.6.1 Shared Project Vision
The project manager has to identify the interests of all relevant stakeholders, and ensure that they
buy-in to the project vision (Yang, Shen and Ho, 2009: 159-175). In a large project that involves
more than four departments, the PM will have to get the project sponsor to assist in selling the
project vision. The project sponsor has to be someone from an executive management position
with considerable influence within the organization. The project vision has to be communicated
with relevant parties on a continuous basis throughout the project life-cycle. A well developed
and articulated vision has an immense contribution towards achieving project success
(Christenson and Walker, 2008: 611-622). A vision creates a collective ideal that employees and
management alike aspire to achieve. Optimal performance from employees cannot be expected
in the absence of an enduring vision and supportive environment.
2.6.2 Project Plans updated regularly
Once the project objectives have been set and the scope completed, the PM has to commence
with the second phase of planning. The project plan is a living document which has to be updated
as the project progresses. The PM has to use tools such as the work break-down structure (WBS)
to break down work into activities assignable to specific individuals. Special focus must be given
21
to activity definition and project plan development as these prove to be critical planning
processes (Zwikael, 2009: 372-387).
2.6.2.1 Purpose of planning
The primary aim of engaging in project planning is to execute the project scope. Once top
management of the organization approves the scope, the PM then has to gather all the relevant
information and resources which will be useful in executing the scope. The PM and line
managers should appoint project team members who will assist with the planning process and
eventual execution of the project. When choosing project team members, one must bear in mind
that specialists are not necessarily good planners and executors. Thus, the PM and line managers
need to be cautious of this fact when selecting project team members. The project team should be
encouraged to voice their opinions without fear of rejection. This will ensure that team members
buy-in to the project and give their full support during execution.
Projects are time bound and temporary by nature. The expected duration is usually set during the
scope formulation process in the initiation phase of the project. This is largely due to the fact that
projects are strategic in nature and, in most cases, are used to gain a competitive advantage over
the organization‟s competitors. For instance, they are used to exploit an opportunity in the
market before the “window” closes after a certain time period. Furthermore, the PM should
realize that time and cost management are inseparable in project management (Kerzner, 2006:
597). Thus, planning is undertaken to ensure that the set time line is satisfied, which, in turn, will
ensure that costs are kept within the budget.
Project planning helps to create a benchmark for execution (Harrison, 2007). The benchmark is
then used at execution to provide direction for the project team as events unfold. Events that
unfold at execution may cause confusion to project team members with regard to standards that
need to be adhered to. The benchmark set during planning clears any ambiguity that might exist,
22
thus facilitating decision making. Benchmark setting should be conducted by the PM in
consultation with experienced project team members and line managers.
Organizations use projects as a tool for implementing their strategic objectives that may be
aimed at changing the manner in which the organization operates. Thus, projects can be viewed
as change agents. The PM needs to recognize this fact and ensure that the strategic objectives of
the organization are reflected in the planning process. The strategic objectives may not be clearly
stated in the scope statement, thus the need for the PM to be present during the scope formulation
process (Msani, 2007: 20).
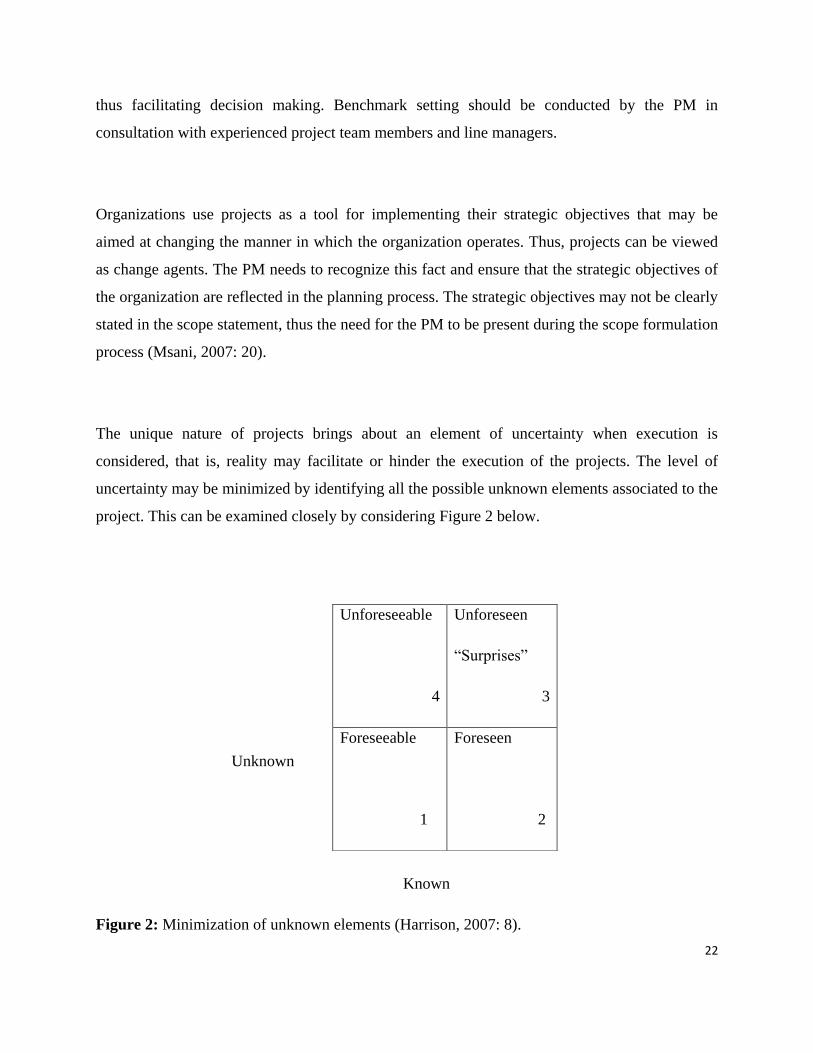
The unique nature of projects brings about an element of uncertainty when execution is
considered, that is, reality may facilitate or hinder the execution of the projects. The level of
uncertainty may be minimized by identifying all the possible unknown elements associated to the
project. This can be examined closely by considering Figure 2 below.
Unknown
Known
Figure 2: Minimization of unknown elements (Harrison, 2007: 8).
Unforeseeable
4
Unforeseen
“Surprises”
3
Foreseeable
1
Foreseen
2
23
The PM should ideally start in the first quadrant (Foreseeable) elements which are not easily
recognizable but can be identified by asking thought-provoking questions concerning the
possibilities that reality can bring. This will minimize the number of unknowns and enable the
PM to consider the second quadrant (Foreseen) elements which have been encountered before,
perhaps in previous projects. Elements that are not covered in the first and second quadrants
must then fall in the third quadrant (Unforeseen). These elements may be identified by specialists
through experience and engaging in detailed planning (Harrison, 2007: 9).
Project managers should not fall in the trap of trying to identify the (Unforeseeable) elements of
the project. These elements cannot easily be discovered even by engaging in detailed planning.
This is largely due to the fact that the probability of occurrence of these is very low. Thus, it is
irrelevant to focus on these elements. For example, a soccer player being struck by lightning
during a game has a low probability of occurrence. The ratio is about 1: 10 million, for argument
sake. Therefore, these elements can be classified as unmanageable risk that is closely associated
with the environmental conditions where the project will be carried out (Msani, 2007: 19).
It is important to note that Figure 2 represents a dynamic model, which means that the unknown
elements can change with time. This phenomenon makes planning to be one of the most difficult
aspects of the project that the PM has to deal with. Research (Kerzner, 2006: 398) has shown that
the PM has to spend a reasonable amount of time in dealing with this dynamic model, as this has
a direct influence on the likelihood of project success. Most projects are “undercooked”, that is,
not enough time is spent in planning or dealing with unknown elements and, as a result, project
success is compromised. This then raises the question “At what point must one stop planning and
begin with execution”. One should stop planning when the final “picture” is closely similar to
that of reality, thus ensuring a smooth transition. The idea here is to be able to “hit the ground
running” at execution (Burke, 2006: 180).
24
Planning enables the PM to identify the organization‟s strengths and weaknesses in terms of
resources to be utilized in the project. Strengths may include the availability of skilled labour,
enough financial capacity and the recognition of project management as a discipline. On the
other hand, weaknesses may include a high rate of absenteeism, low morale amongst employees
and lack of support from top management. An analysis of the strengths and weaknesses gives the
PM a better understanding of whether the organization has what it takes to deal with the
challenges that the project will raise (Kerzner, 2006: 190).
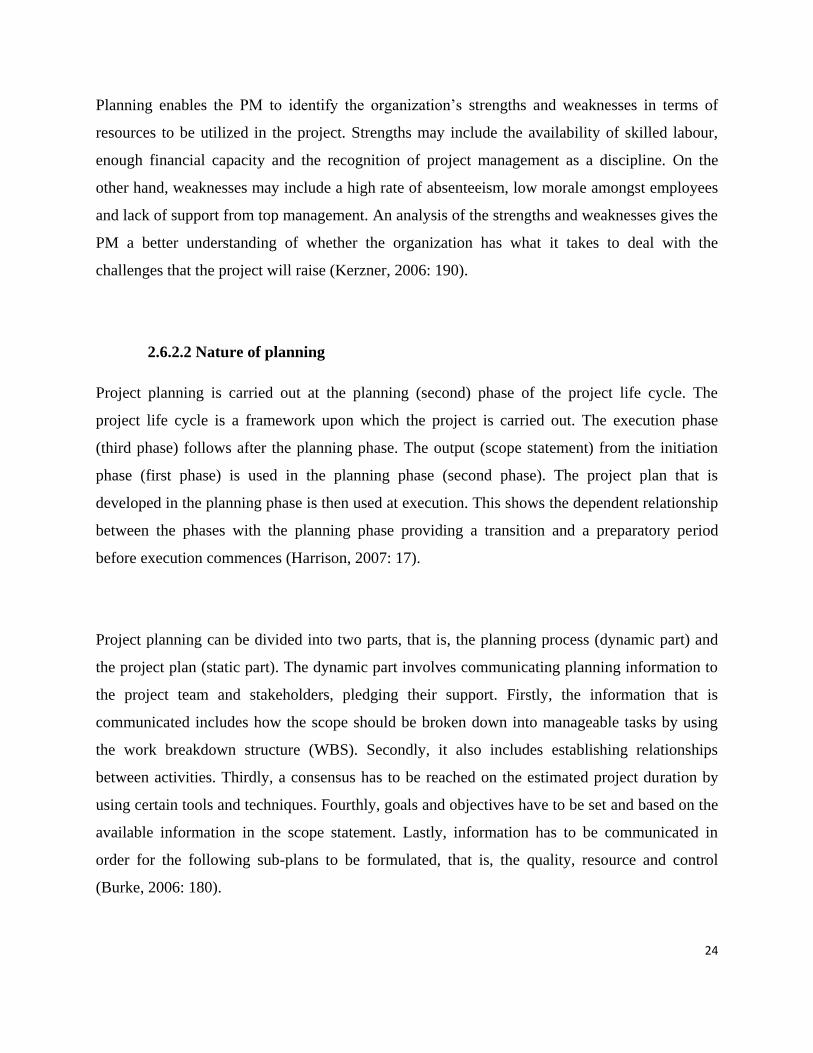
2.6.2.2 Nature of planning
Project planning is carried out at the planning (second) phase of the project life cycle. The
project life cycle is a framework upon which the project is carried out. The execution phase
(third phase) follows after the planning phase. The output (scope statement) from the initiation
phase (first phase) is used in the planning phase (second phase). The project plan that is
developed in the planning phase is then used at execution. This shows the dependent relationship
between the phases with the planning phase providing a transition and a preparatory period
before execution commences (Harrison, 2007: 17).
Project planning can be divided into two parts, that is, the planning process (dynamic part) and
the project plan (static part). The dynamic part involves communicating planning information to
the project team and stakeholders, pledging their support. Firstly, the information that is
communicated includes how the scope should be broken down into manageable tasks by using
the work breakdown structure (WBS). Secondly, it also includes establishing relationships
between activities. Thirdly, a consensus has to be reached on the estimated project duration by
using certain tools and techniques. Fourthly, goals and objectives have to be set and based on the
available information in the scope statement. Lastly, information has to be communicated in
order for the following sub-plans to be formulated, that is, the quality, resource and control
(Burke, 2006: 180).
25
The outcome (project plan) of the planning process is static, as mentioned above, and represents
a “picture” of what reality should be at execution. This is bound to create problems at execution
as reality is not static but dynamic in nature. This would then prompt the PM to make changes
from time to time in the project plan as reality unfolds. Changes made in the project plan have to
be reflected in the scope statement (Msani, 2007: 21). Therefore, planning is continuous and
iterative as shown by Figure 3.
Initiation phase Planning phase Execution phase
Figure 3: Continuous and iterative nature of project planning (Msani, 2007: 10).
The above figure shows that scope changes are inevitable in a project. Therefore, the scope
formulation process at the initiation phase should include a scope change control system which
will ensure that changes are made by authorized people in consultation with all stakeholders
(Burke, 2006: 105).
Project Plan
(Static)
Project Plan
Changes made
As reality unfolds
Scope document
Changes must be
reflected here
Reality
Dynamic by
nature
26
2.6.2.3 Planning Process and Outcome
Goal and Objective setting
The PM, in consultation with line managers and the project team, must to go through the process
outlined below in order to be in a good position to execute the scope. The level of detail that will
be shown will depend on the experience they have in the industry.
(a) Outcome a consensus has to be reached on the final
bottom line that the client expects regardless of
the manner in which it will be achieved.
(b) Goals targets that have to be reached so that the
outcome is what the client has desired.
(c) Objectives these are things that have to be achieved so that the scope is
realized.
The objectives must meet the scope 100%.
2.6.2.4 Developing objectives
Time dimension
The work breakdown structure (WBS) will be used to breakdown the scope to manageable tasks
that are assignable to individuals. Breaking down the scope is crucial in ensuring that all tasks
associated with the project are taken into account at an early stage.
The duration of all the individual activities identified has to be estimated by either using
historical data or expert knowledge. Historical data should be used with a certain level of caution
27
as the conditions in previous projects could have been different. In the case where the PM is a
subject-matter expert (SME), the project team members would refrain from giving unrealistic
estimates. Even though the PM may be an SME, estimates still need to be negotiated with team
members in order to get their support in the execution of the project.
A decision has to be made on the sequence of activities, that is, which ones would be done in
series and concurrently in order to save time. The decision can be taken based on the following
criteria (Kerzner, 2006: 420):
Hard-logic These are activities that have to be done in
series at all times, e.g., the foundation of a
building has to be laid first before the
superstructure is put in place;
Soft logic These can be either done in series or
concurrently depending on the consensus
reached between the PM, line managers
and project team; and
External dependencies These dependencies may be beyond the
control of the PM, e.g., government laws.
28
The PM can then use network analysis to join the activities in order to determine the
project duration. Network analysis is one of the tools in project management that
is used to give a pictorial representation of how the scope will be executed. By determining the
critical path in the network, the PM is able to work out the expected duration of the project. The
critical path has activities with no slack and forms the longest path. Thus, a delay on any of its
activities would result in a delay of the entire project. Essentially, the PM can then control the
project at execution by focusing on the critical path (Steyn, 2004: 132).
Cost dimension
Setting up cost objectives is driven mainly by „how‟ and „who‟ is involved in the process. The
„how‟ part involves the process that will be used to execute the project. For instance, transporting
raw material by railway carriages or trucks would influence the cost to be incurred. The „who‟
part deals with the level of experience, skills and expertise possessed by the project team
members who will carry out the work. The PM should bear in mind that errors made in cost
estimation at the early stage of the project will be progressively more expensive to correct in
later stages.
One of the widely used tools in cost estimation is the bottom-up method (Harrison, 2007: 23).
This involves adding up costs for all the individual activities per level in the WBS starting from
the bottom. This will give the PM a realistic overall cost of the project which should then be
compared to the allocated budget. The PM may use the acquired information to request for
additional funds if the allocated budget is below the calculated figure.
Quality dimension
Research (Phillips et al., 2008: 307-320) has shown that there are different views on what quality
is. One view from operations states that quality is achieved by consistently conforming to the
client‟s expectations. On the other hand, quality is said to be in the eye of the beholder (client).
That is, the customer‟s perception of quality is all that is important. Clients‟ perceptions differ,
29
thus making it difficult for organizations to make products or services that will suit or satisfy all
their customers. One then takes the view that quality is achieved when the gap between the
clients‟ perception and expectations, is closed.
2.6.3 Frequent Project Meetings
Meetings are a great way of communicating, but can turn out to be a waste of time, if not
carefully planned. The PM has to formulate a detailed communication plan for the entire project
duration. The communication plan has to stipulate the name of the person, „how often‟ and
„what‟ information must be communicated. Essentially, the PM must communicate with the
project team, legitimate stakeholders, the client and project sponsor (Newton, 2005:38). Frequent
communication with relevant parties will ensure that everyone is on the same page as far as
project progress is concerned.
2.6.4 Community involvement
With South Africa facing such a high unemployment problem, private and public construction
projects must consider utilizing local residents in order to gain support. Communities are most
likely to oppose construction projects which will not offer them meaningful employment
opportunities. Providing employment opportunities to local communities would indirectly
enhance the organization‟s brand standing as being socially responsible (Kotler and Keller, 2006:
286). The PM has to establish a single point of contact (SPOC) amongst the community
members. Communities are most likely to oppose construction projects which will not offer them
meaningful employment opportunities. Continuous communication must be maintained with the
community SPOC during the project so that any issues can be addressed immediately when they
arise.
The PM should be aware that community members often have multi interests concerning the
project (Teo and Loosemore, 2010: 216-235). Hence, it is crucial for the PM to identify a SPOC
30
when engaging the community from the beginning. The involvement of the community is
particularly important in public sector projects. For example, public facilities, like libraries and
schools, are later vulnerable to vandalization. This is mainly due to the fact that a sense of
ownership was not instilled in the community by allowing participation in the construction
process.
2.6.5 Handover Procedures
Karna, Junnonen and Sorvala (2009: 111-127) assert that the construction industry is
increasingly becoming a service industry. Therefore, industry players have to become more
client-oriented. That is, a new mentality of “working with the client” instead of “working for the
client” must be developed. Working with the client also entails developing a detailed handover
procedure stipulating the sequence of events and the people assigned on the day. Handover
procedures must be developed and communicated to all relevant parties including top
management.
2.7 Conclusion
This chapter has presented an in-depth analysis of the critical success factors in the literature
review. The eighteen critical success factors identified have been encapsulated in the four COMs
model. The next chapter deals with the methodology used in collecting and analyzing data in this
study.
31
CHAPTER 3
RESEARCH METHODOLOGY
3.1 Introduction
This chapter deals with the methodology used in collecting and analyzing data in this study. An
indepth account on how data was collected and the research instruments utilized will be given.
Special focus will be given to the target population, data collection, questionnaire design, data
analysis and the justification of the approaches used.
3.2 Study Type
This cross sectional research is a quantitative study and explores the relationship between critical
success factors (independent variable) present within the construction project environment and
the effect they have towards achieving project success (the dependent variable). Descriptive
research will describe characteristics of construction clients within the Durban area. Descriptive
studies are based on some previous understanding of the nature of the research problem
(Saunders, Lewis and Thornhill, 2007: 134). Inferential statistics allow one to make inferences
from the sample to the population (Birley and Moreland, 2007: 351-353). In this study, they will
be used to ascertain if there is a significant difference in the manner in which project managers
and contractors perceive critical success factors.
3.3 Target Population
This will be a census study consisting of two target populations. According to Blumberg, Cooper
and Schindler (2008: 245), a census study ensures that data is collected from all the elements in
the population. The target populations of N1=95 and N2=61 were obtained from the
Construction Industry Development Board (CIDB) register on its website consisting of project
managers and active grade 4 contractors, respectively, within the greater Durban area (Register,
32
2010). According to Lee and Lings (2008: 269), the target population is the population which the
researcher would ideally like to generalize the results.
3.4 Data collection
As this is a quantitative study, the survey method will be used to gather primary data (Easterby-
Smith, Thorpe and Jackson, 2008: 11). Data collection forms an important part of a problem
solving process to clarify the purpose of any research (Pellissier, 2007: 24). Fieldworkers were
employed to administer the questionnaire on a face-to-face basis in order to facilitate a response
(Nguyen, Ogunlana and Lan, 2004: 404-413). They were adequately trained to conduct the
process.
3.5 Questionnaire design
The preliminary questionnaire was pilot tested with four developers, three consultants and three
contractors. Adjustments were then made to the questionnaire by the statistician and the final
copy distributed to the active grade four contractors and project managers in Durban. Eventually,
two questionnaires emerged: one for the grade four contractors and the second one for the project
managers. The literature review clearly indicated that the contractors and the project managers
were the major role players in the construction industry (Barrett, 2008: 189). Thus, having two
separate questionnaires allowed the researcher to assess the perceptions of contractors and
project managers, respectively, towards critical success factors which lead to project success.
The questionnaires were divided into two sections, namely: the demographic section and success
factors. The demographic section was included in order to assess whether data collected was not
influenced by the individual differences such as gender, age, years in the industry, sector of
industry, type and value of projects undertaken. The success factors‟ section was made up of
close-ended questions with five possible responses. Close-ended questions were preferred as they
reduce the respondent‟s bias and facilitated coding of the questionnaire (Akintoye and Main,
33
2007: 597-617) An open-ended question was included at the end to allow the respondent to add
any factor or views.
3.6 Data analysis
Data was analysed using the SPSS Package. The following types of statistical analyses were
conducted:
3.6.1 Descriptive Statistics
Descriptive statistics describe the phenomena of interest (Saunders, Lewis and Thornhill, 2007:
134). The following types of descriptive statistics were used:
a) Frequencies and percentages to obtain a demographic profile of the contractor and project
manager groups; and
b) Measures of Central Tendency and Dispersion. These were calculated to obtain a “feel
for the data”. The mean as well as the standard deviation were utilized. The mean was
used to ascertain the subjects‟ perceptions of the dimensions of the critical success factors
and the standard deviation determined the extent of variation in the subjects‟ perceptions
of the dimensions of the critical success factors for both groups, respectively.
3.6.2 Inferential Statistics
Inferential statistics allows one to make inferences from the sample to the population. These
statistics are used when a researcher wants to know how variables are related to one another and
whether there is any difference between two or more groups (Birley and Moreland, 2007: 351-
353). The following inferential statistics were used:
a) Correlation. The Pearson Correlation Matrix established the direction, strength and
significance of the relationship among the critical success factor dimensions for each group,
respectively; and
34
b) The t- test. The t- test established whether there was a significant difference in the
perceptions of the dimensions, critical success factors between the contractor and project
manager groups. This test statistic was also used to determine whether there was a significant
difference in the perception of the dimensions, critical success factors among the
demographic variables with two groups for the contractor and project manager groups,
respectively.
The analysis of variance examined whether there was a significant difference in the perception of
the dimensions, critical success factors among the demographic variables with more than two
groups for the contractor and project manager groups, respectively.
3.7 Reliability and validity
Reliability ensures that internal consistency amongst factors exists (Parasuraman, Grewal and
Krishnan, 2007: 132-133). This questionnaire used in this study was adapted from the Vietnam
study (Nguyen, Ogunlana and Lan, 2004: 404-413). They reported that the reliability coefficient
was 0.675. Therefore, the Cronbach reliability coefficient for this study is acceptable.
Validity ensures that the tool (questionnaire) used is appropriate for the study undertaken (Leedy
and Ormrod, 2006: 274). A pilot test was used to refine and assess the questionnaire‟s face
validity (Leedy and Ormrod, 2006: 274). A pilot test of the questionnaire was undertaken with
four developers, and six contractors. Confirmatory factor analysis was used in order to ensure the
construct validity of the research (Maree, 2007: 219).
3.8 Conclusion
This chapter has provided an indepth account on the methodology used in this study. A solid
background has been formed for the interpretation of the data collected in the census, as
represented in the next chapter. A case for selecting a quantitative approach and selecting a

35
questionnaire as the appropriate research method has been made. The comprehensive design of
the research and the selection of elements have been illustrated. Details regarding the collection
and data analysis method to be used were given. Finally, an overview of how the reliability and
construct validity of the research were established concluded the chapter. The following chapter
presents the data and gives an indepth analysis on the findings thereof.
36
CHAPTER 4
DATA PRESENTATION AND ANALYSIS OF FINDINGS
4.1 Introduction
Chapter three outlined the methodology for this research. This chapter discusses in detail the
findings of this study. The various sections of the questionnaire are analyzed in detail and
accompanied by numerical tabulations. The chapter essentially discusses the themes obtained
from the questionnaires.
The questionnaire was formulated with consideration to the critical success factors, as
highlighted in chapter two (in the literature review section). These factors make up the eighteen
questions in section B of the questionnaire and are encapsulated in the four COMs model. The
demographic profile of respondents is discussed in detail with the use of frequency distribution
tables. A descriptive analysis of 95 project managers and 61 grade four contractors was
conducted using the Mann-Whitney test and Kruskal – Wallis anova. This was performed with a
view to ascertain if there exists a significant difference between project managers, and
contractors, perception towards critical success factors.
The analysis covered is quantitative in nature. It was interesting to note that biographical
variables did not have a significant influence of the perception of project managers and
contractors towards the critical success factors. Biographical variables consisted of age groups
ranging from 20-23 to 60 and above, tenure, public or private sector and value of projects
undertaken. It was also disturbing to note the percentage of women in the construction industry is
still low for both contractors and project managers.
37
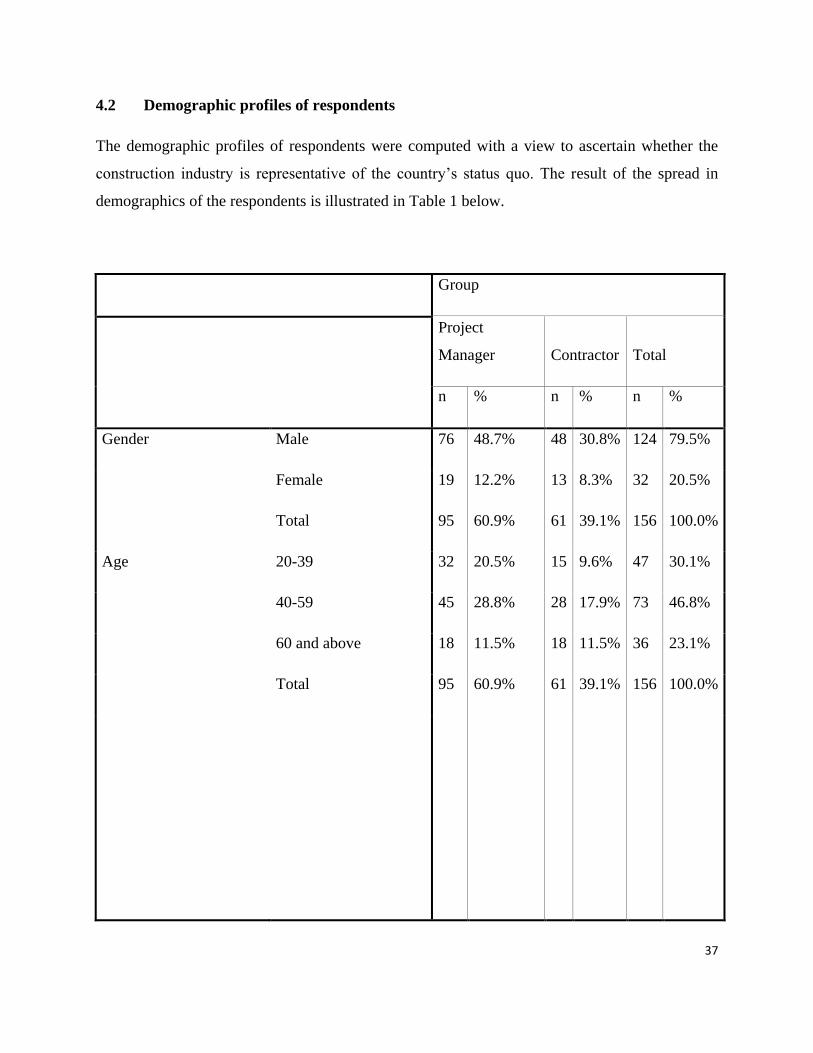
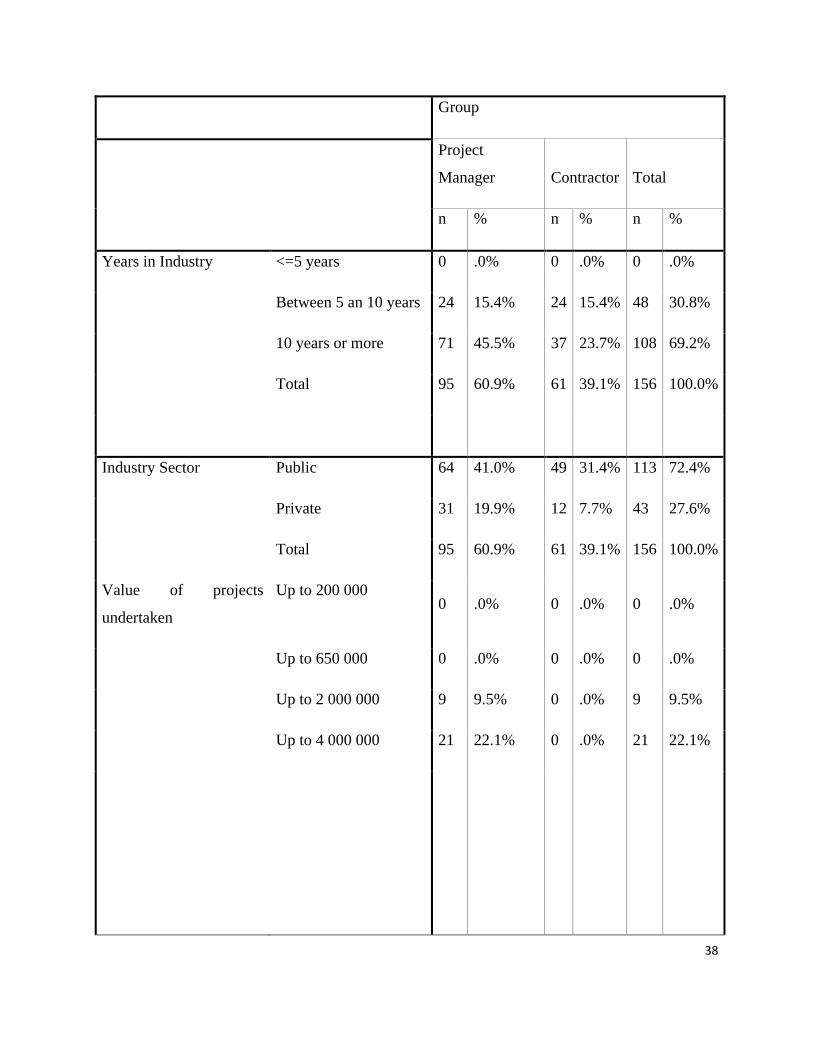
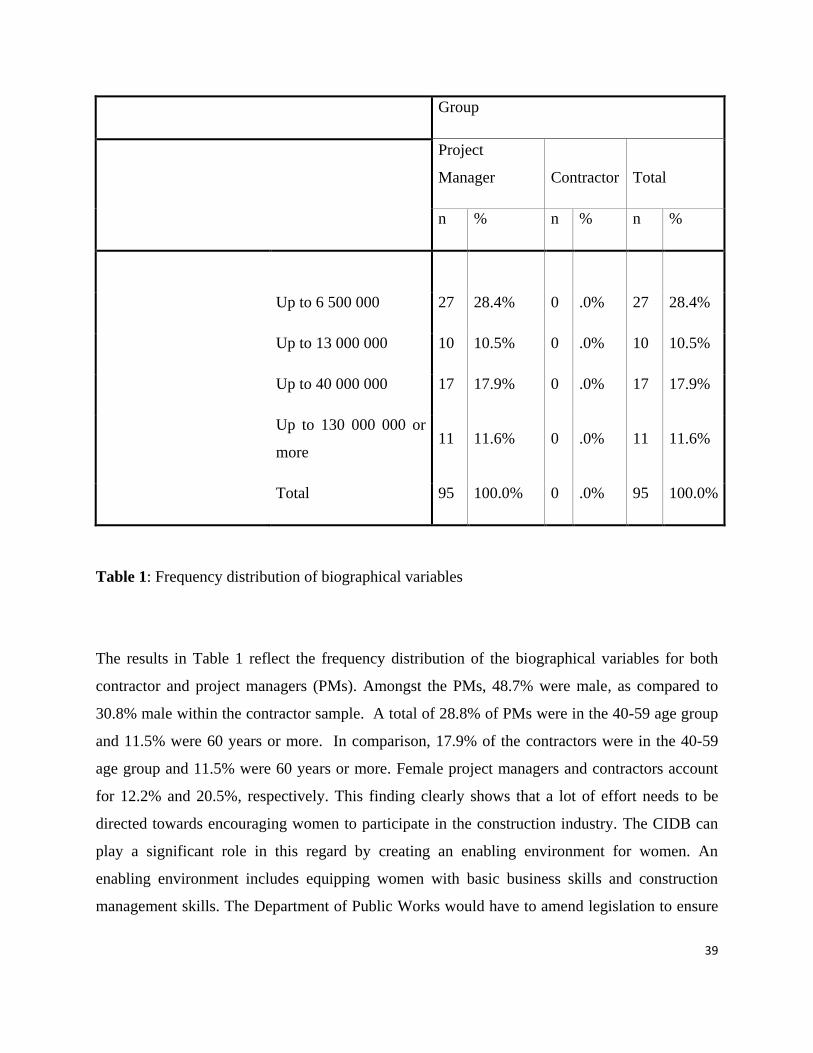
4.2 Demographic profiles of respondents
The demographic profiles of respondents were computed with a view to ascertain whether the
construction industry is representative of the country‟s status quo. The result of the spread in
demographics of the respondents is illustrated in Table 1 below.
Group
Project
Manager Contractor Total
n % n % n %
Gender Male 76 48.7% 48 30.8% 124 79.5%
Female 19 12.2% 13 8.3% 32 20.5%
Total 95 60.9% 61 39.1% 156 100.0%
Age 20-39 32 20.5% 15 9.6% 47 30.1%
40-59 45 28.8% 28 17.9% 73 46.8%
60 and above 18 11.5% 18 11.5% 36 23.1%
Total 95 60.9% 61 39.1% 156 100.0%
38
Group
Project
Manager Contractor Total
n % n % n %
Years in Industry <=5 years 0 .0% 0 .0% 0 .0%
Between 5 an 10 years 24 15.4% 24 15.4% 48 30.8%
10 years or more 71 45.5% 37 23.7% 108 69.2%
Total 95 60.9% 61 39.1% 156 100.0%
Industry Sector Public 64 41.0% 49 31.4% 113 72.4%
Private 31 19.9% 12 7.7% 43 27.6%
Total 95 60.9% 61 39.1% 156 100.0%
Value of projects
undertaken
Up to 200 000 0 .0% 0 .0% 0 .0%
Up to 650 000 0 .0% 0 .0% 0 .0%
Up to 2 000 000 9 9.5% 0 .0% 9 9.5%
Up to 4 000 000 21 22.1% 0 .0% 21 22.1%
39
Group
Project
Manager Contractor Total
n % n % n %
Up to 6 500 000 27 28.4% 0 .0% 27 28.4%
Up to 13 000 000 10 10.5% 0 .0% 10 10.5%
Up to 40 000 000 17 17.9% 0 .0% 17 17.9%
Up to 130 000 000 or
more 11 11.6% 0 .0% 11 11.6%
Total 95 100.0% 0 .0% 95 100.0%
Table 1: Frequency distribution of biographical variables
The results in Table 1 reflect the frequency distribution of the biographical variables for both
contractor and project managers (PMs). Amongst the PMs, 48.7% were male, as compared to
30.8% male within the contractor sample. A total of 28.8% of PMs were in the 40-59 age group
and 11.5% were 60 years or more. In comparison, 17.9% of the contractors were in the 40-59
age group and 11.5% were 60 years or more. Female project managers and contractors account
for 12.2% and 20.5%, respectively. This finding clearly shows that a lot of effort needs to be
directed towards encouraging women to participate in the construction industry. The CIDB can
play a significant role in this regard by creating an enabling environment for women. An
enabling environment includes equipping women with basic business skills and construction
management skills. The Department of Public Works would have to amend legislation to ensure
40
that a sizable amount of its tenders are awarded to women at lower grades. In this way, women at
lower grades will have sufficient time to nurture their skills and be able to grow their businesses.
A total of 31.4% of the contractors were employed in the public sector, as compared to 41% of
the project managers. This is largely due to the fact that South Africa is a developing country,
and the public sector offers most of the tenders. Ideally, the private sector should be issuing large
numbers of tenders which, in turn, would create sustainable employment opportunities. A larger
proportion of the project managers were working for 10 years or more. This is due to the fact that
it takes a significant number of years to gain enough experience and a good reputation which
would enable one to do consulting or undertake difficult projects.
4.3 Discussion of the four COMs
The discussion of the four COMs as the four groups of critical success factors for the business
construction industry in Durban are given in the following sections.
4.3.1 Comfort
This component emphasizes that projects are executed in comfort when components such as
competent project managers, continuous involvement of stakeholders, availability of resources,
funding and comprehensive contract documentation. The frequency distribution of questions is
illustrated in Table 2, where question 1 relates to the continuing involvement in projects of all
stakeholders. Question 5 relates to the competent project manager and question 9 relates to the
availability of resources throughout the project. Question 13 relates to the adequate funding until
project completion and question 17 relates to comprehensive contract documentation being
signed by all relevant parties before the project commences.
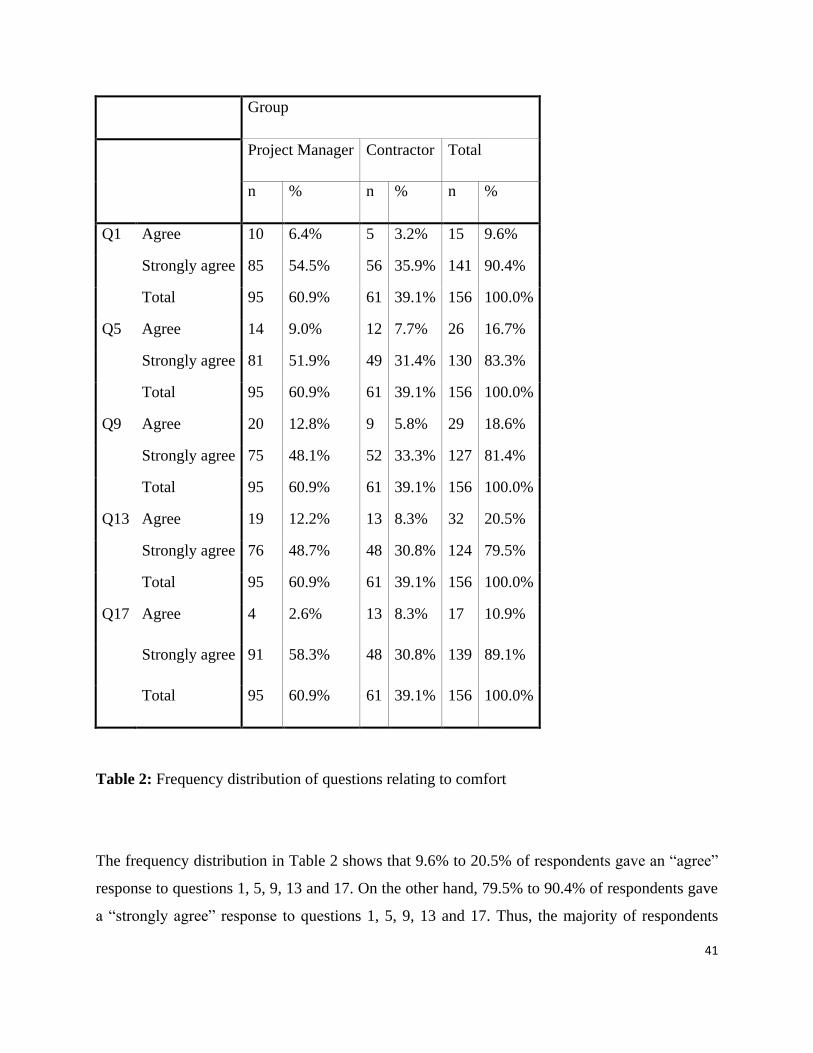
41
Group
Project Manager Contractor Total
n % n % n %
Q1 Agree 10 6.4% 5 3.2% 15 9.6%
Strongly agree 85 54.5% 56 35.9% 141 90.4%
Total 95 60.9% 61 39.1% 156 100.0%
Q5 Agree 14 9.0% 12 7.7% 26 16.7%
Strongly agree 81 51.9% 49 31.4% 130 83.3%
Total 95 60.9% 61 39.1% 156 100.0%
Q9 Agree 20 12.8% 9 5.8% 29 18.6%
Strongly agree 75 48.1% 52 33.3% 127 81.4%
Total 95 60.9% 61 39.1% 156 100.0%
Q13 Agree 19 12.2% 13 8.3% 32 20.5%
Strongly agree 76 48.7% 48 30.8% 124 79.5%
Total 95 60.9% 61 39.1% 156 100.0%
Q17 Agree 4 2.6% 13 8.3% 17 10.9%
Strongly agree 91 58.3% 48 30.8% 139 89.1%
Total 95 60.9% 61 39.1% 156 100.0%
Table 2: Frequency distribution of questions relating to comfort
The frequency distribution in Table 2 shows that 9.6% to 20.5% of respondents gave an “agree”
response to questions 1, 5, 9, 13 and 17. On the other hand, 79.5% to 90.4% of respondents gave
a “strongly agree” response to questions 1, 5, 9, 13 and 17. Thus, the majority of respondents
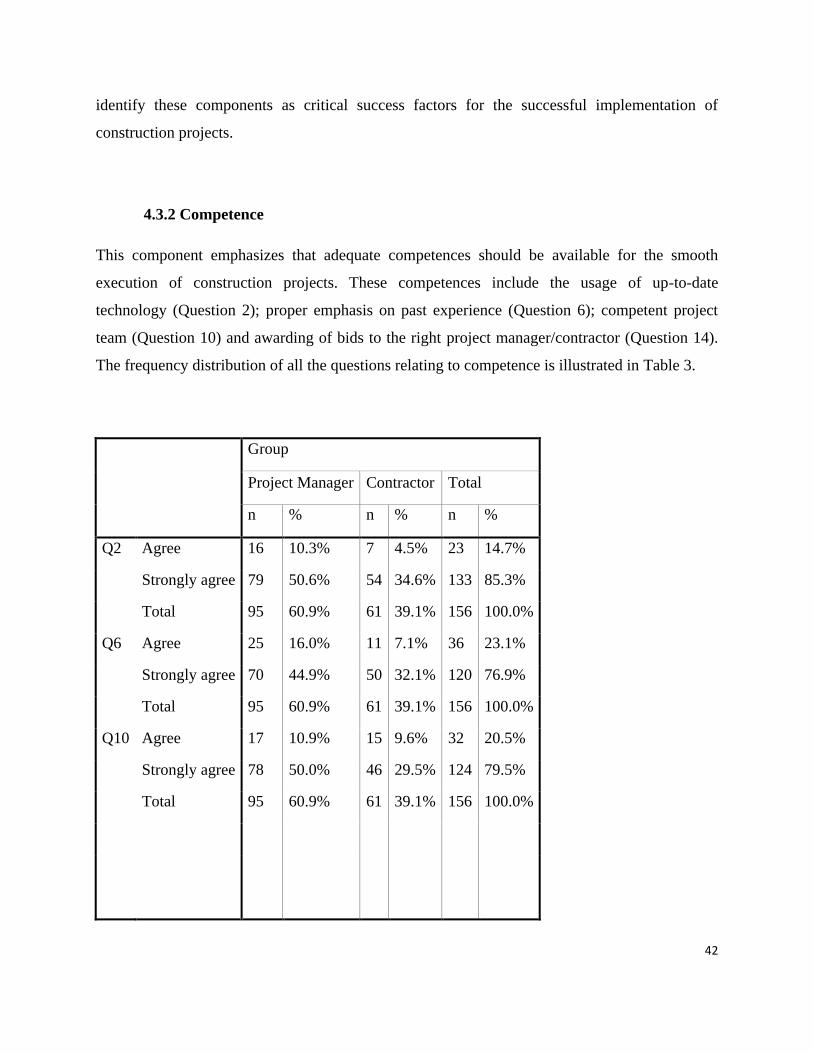
42
identify these components as critical success factors for the successful implementation of
construction projects.
4.3.2 Competence
This component emphasizes that adequate competences should be available for the smooth
execution of construction projects. These competences include the usage of up-to-date
technology (Question 2); proper emphasis on past experience (Question 6); competent project
team (Question 10) and awarding of bids to the right project manager/contractor (Question 14).
The frequency distribution of all the questions relating to competence is illustrated in Table 3.
Group
Project Manager Contractor Total
n % n % n %
Q2 Agree 16 10.3% 7 4.5% 23 14.7%
Strongly agree 79 50.6% 54 34.6% 133 85.3%
Total 95 60.9% 61 39.1% 156 100.0%
Q6 Agree 25 16.0% 11 7.1% 36 23.1%
Strongly agree 70 44.9% 50 32.1% 120 76.9%
Total 95 60.9% 61 39.1% 156 100.0%
Q10 Agree 17 10.9% 15 9.6% 32 20.5%
Strongly agree 78 50.0% 46 29.5% 124 79.5%
Total 95 60.9% 61 39.1% 156 100.0%
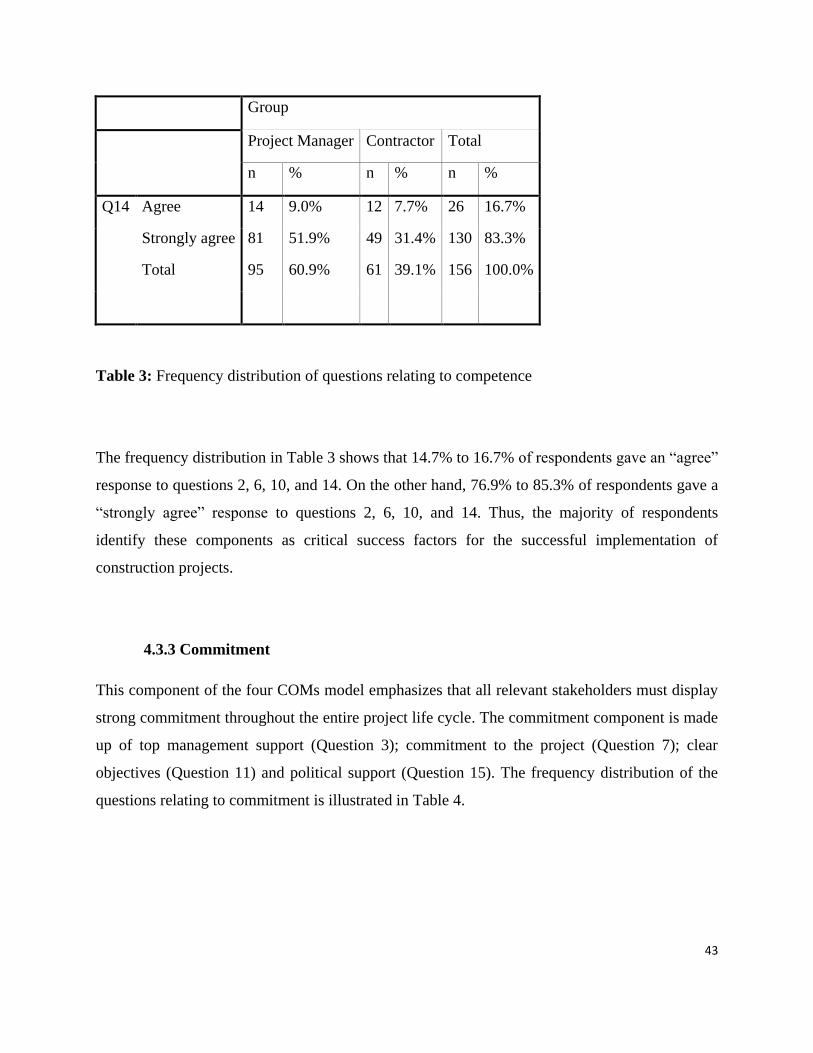
43
Group
Project Manager Contractor Total
n % n % n %
Q14 Agree 14 9.0% 12 7.7% 26 16.7%
Strongly agree 81 51.9% 49 31.4% 130 83.3%
Total 95 60.9% 61 39.1% 156 100.0%
Table 3: Frequency distribution of questions relating to competence
The frequency distribution in Table 3 shows that 14.7% to 16.7% of respondents gave an “agree”
response to questions 2, 6, 10, and 14. On the other hand, 76.9% to 85.3% of respondents gave a
“strongly agree” response to questions 2, 6, 10, and 14. Thus, the majority of respondents
identify these components as critical success factors for the successful implementation of
construction projects.
4.3.3 Commitment
This component of the four COMs model emphasizes that all relevant stakeholders must display
strong commitment throughout the entire project life cycle. The commitment component is made
up of top management support (Question 3); commitment to the project (Question 7); clear
objectives (Question 11) and political support (Question 15). The frequency distribution of the
questions relating to commitment is illustrated in Table 4.
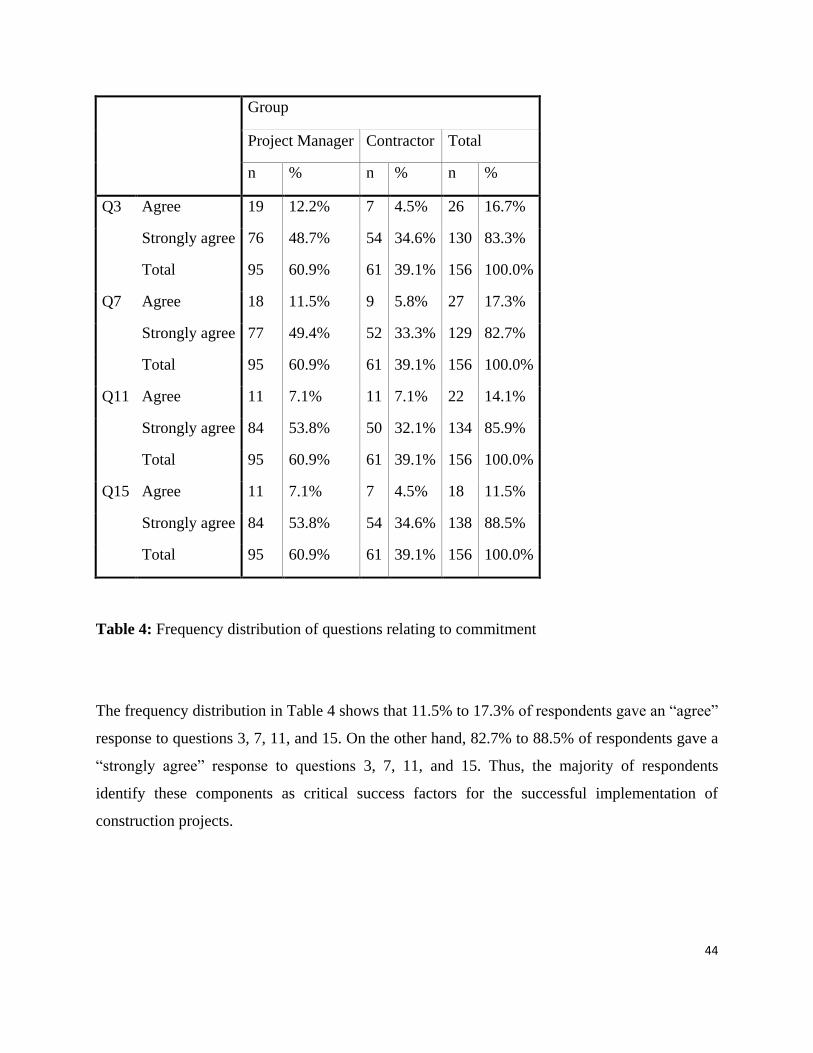
44
Group
Project Manager Contractor Total
n % n % n %
Q3 Agree 19 12.2% 7 4.5% 26 16.7%
Strongly agree 76 48.7% 54 34.6% 130 83.3%
Total 95 60.9% 61 39.1% 156 100.0%
Q7
Agree 18 11.5% 9 5.8% 27 17.3%
Strongly agree 77 49.4% 52 33.3% 129 82.7%
Total 95 60.9% 61 39.1% 156 100.0%
Q11 Agree 11 7.1% 11 7.1% 22 14.1%
Strongly agree 84 53.8% 50 32.1% 134 85.9%
Total 95 60.9% 61 39.1% 156 100.0%
Q15 Agree 11 7.1% 7 4.5% 18 11.5%
Strongly agree 84 53.8% 54 34.6% 138 88.5%
Total 95 60.9% 61 39.1% 156 100.0%
Table 4: Frequency distribution of questions relating to commitment
The frequency distribution in Table 4 shows that 11.5% to 17.3% of respondents gave an “agree”
response to questions 3, 7, 11, and 15. On the other hand, 82.7% to 88.5% of respondents gave a
“strongly agree” response to questions 3, 7, 11, and 15. Thus, the majority of respondents
identify these components as critical success factors for the successful implementation of
construction projects.
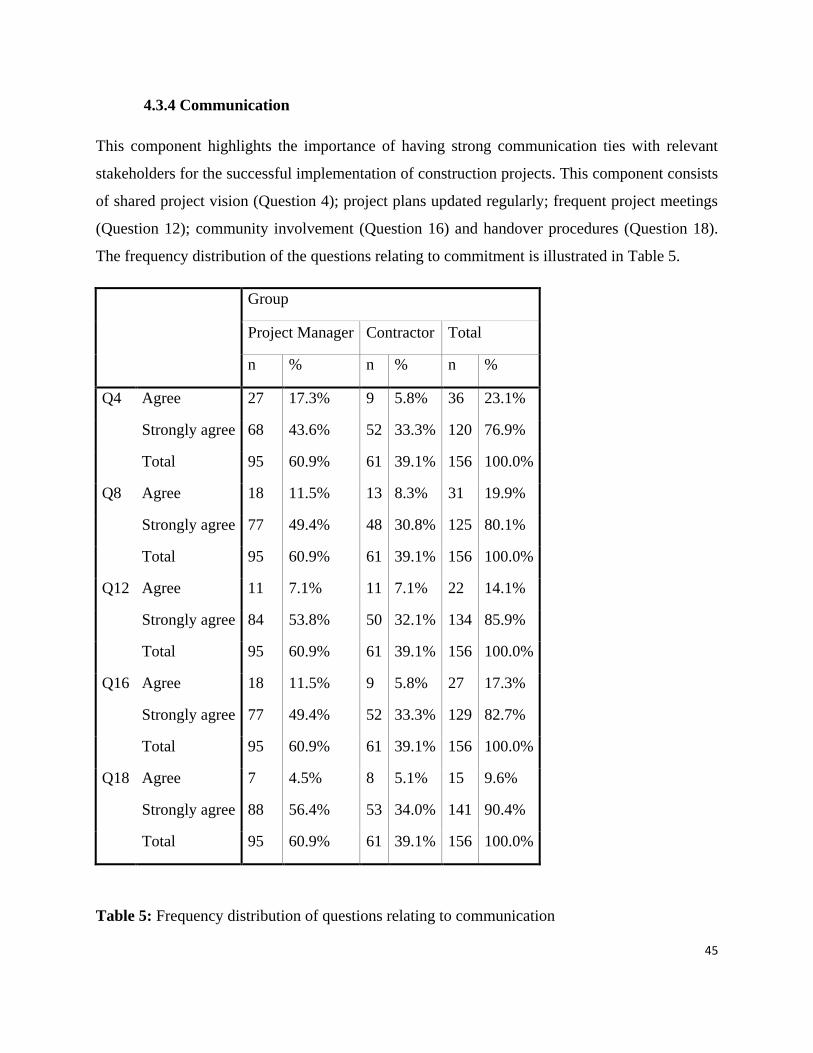
45
4.3.4 Communication
This component highlights the importance of having strong communication ties with relevant
stakeholders for the successful implementation of construction projects. This component consists
of shared project vision (Question 4); project plans updated regularly; frequent project meetings
(Question 12); community involvement (Question 16) and handover procedures (Question 18).
The frequency distribution of the questions relating to commitment is illustrated in Table 5.
Group
Project Manager Contractor Total
n % n % n %
Q4 Agree 27 17.3% 9 5.8% 36 23.1%
Strongly agree 68 43.6% 52 33.3% 120 76.9%
Total 95 60.9% 61 39.1% 156 100.0%
Q8 Agree 18 11.5% 13 8.3% 31 19.9%
Strongly agree 77 49.4% 48 30.8% 125 80.1%
Total 95 60.9% 61 39.1% 156 100.0%
Q12 Agree 11 7.1% 11 7.1% 22 14.1%
Strongly agree 84 53.8% 50 32.1% 134 85.9%
Total 95 60.9% 61 39.1% 156 100.0%
Q16 Agree 18 11.5% 9 5.8% 27 17.3%
Strongly agree 77 49.4% 52 33.3% 129 82.7%
Total 95 60.9% 61 39.1% 156 100.0%
Q18 Agree 7 4.5% 8 5.1% 15 9.6%
Strongly agree 88 56.4% 53 34.0% 141 90.4%
Total 95 60.9% 61 39.1% 156 100.0%
Table 5: Frequency distribution of questions relating to communication
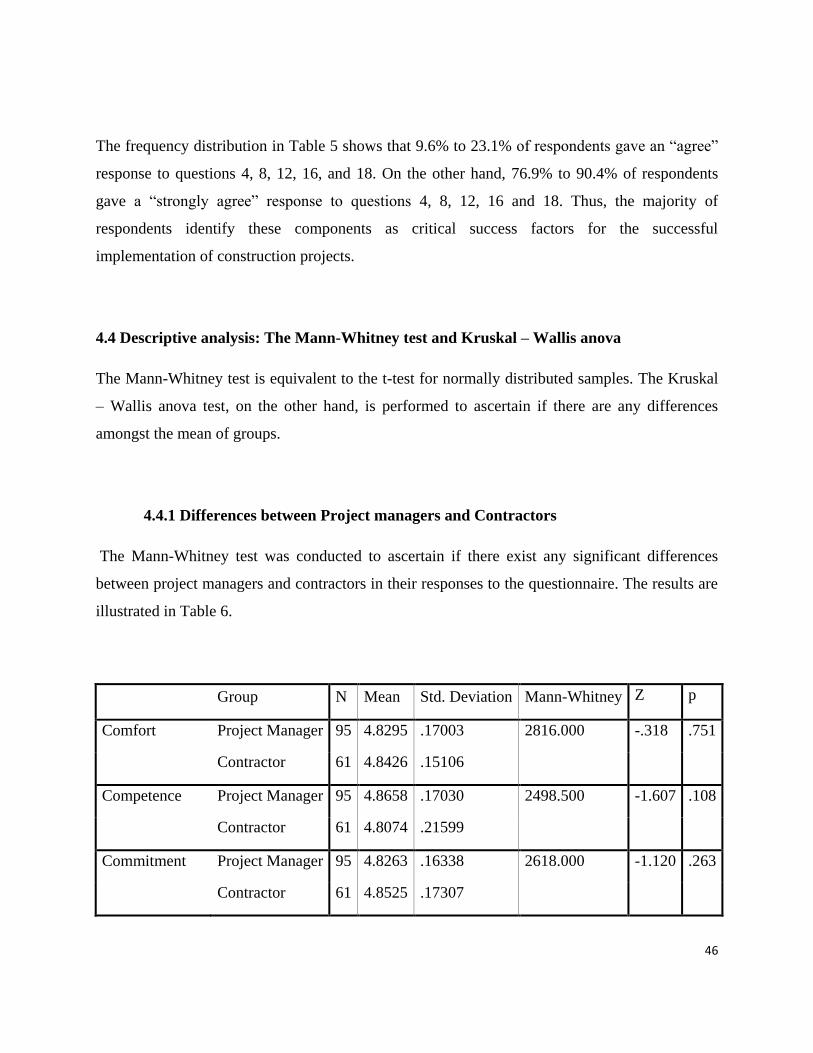
46
The frequency distribution in Table 5 shows that 9.6% to 23.1% of respondents gave an “agree”
response to questions 4, 8, 12, 16, and 18. On the other hand, 76.9% to 90.4% of respondents
gave a “strongly agree” response to questions 4, 8, 12, 16 and 18. Thus, the majority of
respondents identify these components as critical success factors for the successful
implementation of construction projects.
4.4 Descriptive analysis: The Mann-Whitney test and Kruskal – Wallis anova
The Mann-Whitney test is equivalent to the t-test for normally distributed samples. The Kruskal
– Wallis anova test, on the other hand, is performed to ascertain if there are any differences
amongst the mean of groups.
4.4.1 Differences between Project managers and Contractors
The Mann-Whitney test was conducted to ascertain if there exist any significant differences
between project managers and contractors in their responses to the questionnaire. The results are
illustrated in Table 6.
Group N Mean Std. Deviation Mann-Whitney Z p
Comfort Project Manager 95 4.8295 .17003 2816.000 -.318 .751
Contractor 61 4.8426 .15106
Competence Project Manager 95 4.8658 .17030 2498.500 -1.607 .108
Contractor 61 4.8074 .21599
Commitment Project Manager 95 4.8263 .16338 2618.000 -1.120 .263
Contractor 61 4.8525 .17307
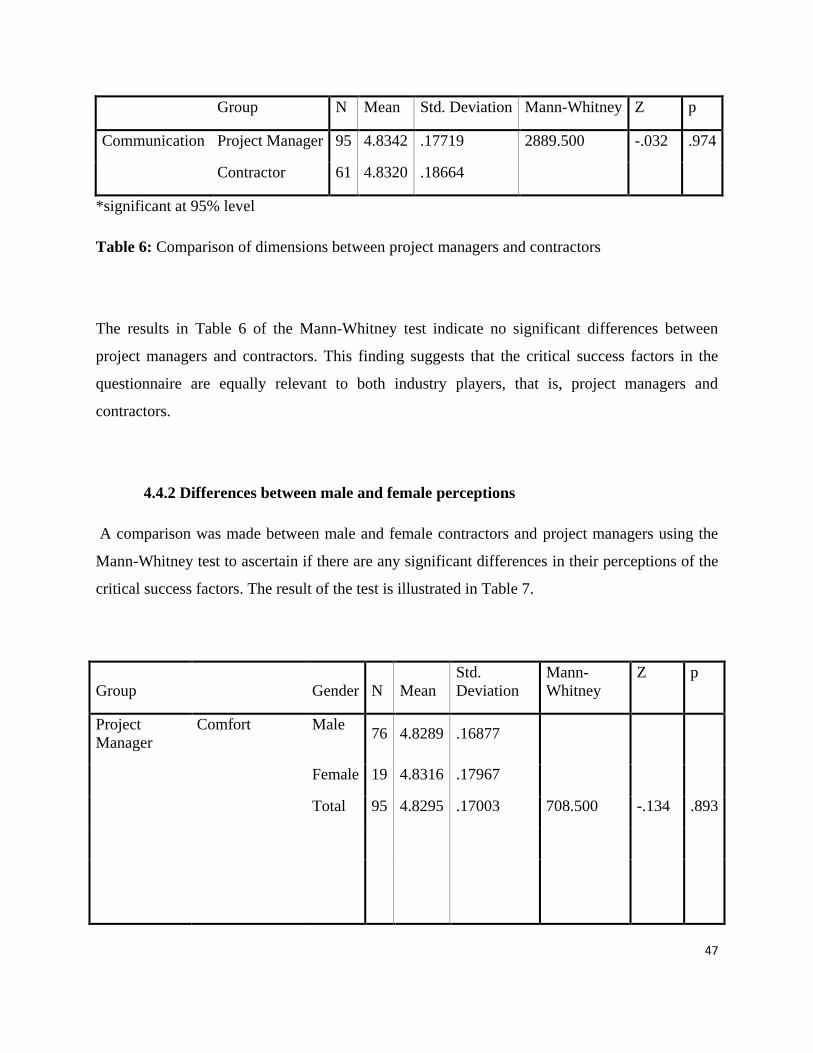
47
Group N Mean Std. Deviation Mann-Whitney Z p
Communication Project Manager 95 4.8342 .17719 2889.500 -.032 .974
Contractor 61 4.8320 .18664
*significant at 95% level
Table 6: Comparison of dimensions between project managers and contractors
The results in Table 6 of the Mann-Whitney test indicate no significant differences between
project managers and contractors. This finding suggests that the critical success factors in the
questionnaire are equally relevant to both industry players, that is, project managers and
contractors.
4.4.2 Differences between male and female perceptions
A comparison was made between male and female contractors and project managers using the
Mann-Whitney test to ascertain if there are any significant differences in their perceptions of the
critical success factors. The result of the test is illustrated in Table 7.
Group Gender N Mean
Std.
Deviation
Mann-
Whitney
Z p
Project
Manager
Comfort Male 76 4.8289 .16877
Female 19 4.8316 .17967
Total 95 4.8295 .17003 708.500 -.134 .893
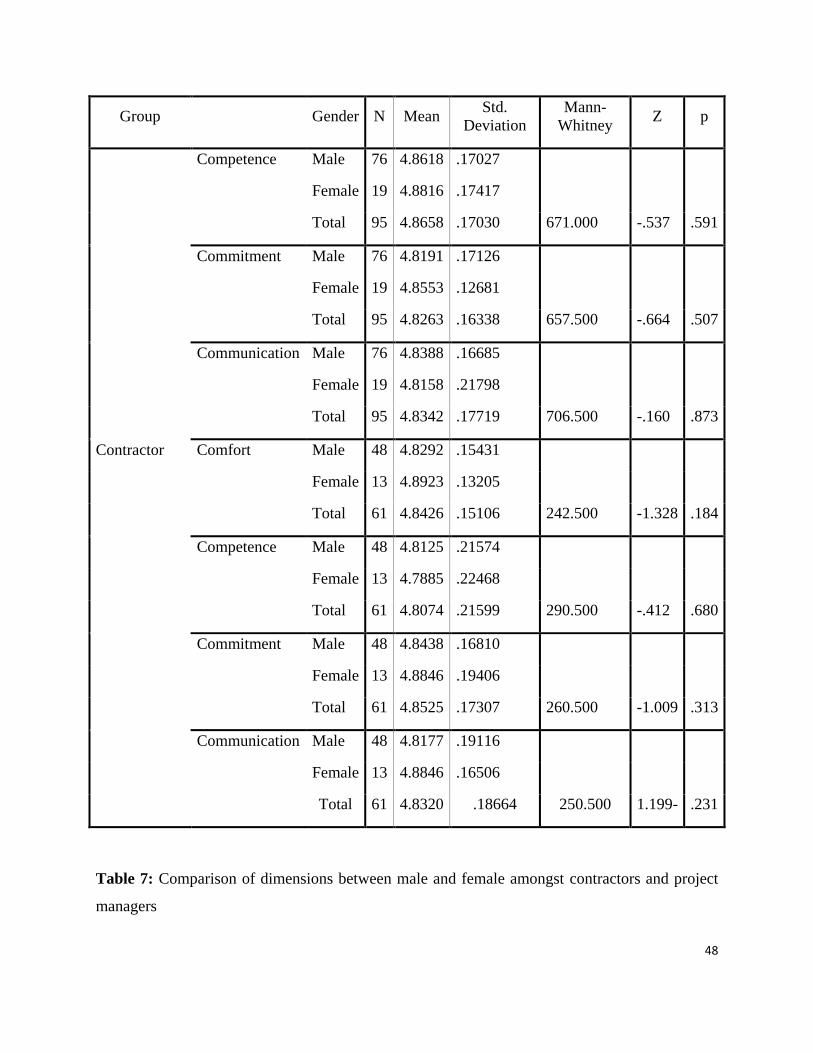
48
Group Gender N Mean Std.
Deviation
Mann-
Whitney Z p
Competence Male 76 4.8618 .17027
Female 19 4.8816 .17417
Total 95 4.8658 .17030 671.000 -.537 .591
Commitment Male 76 4.8191 .17126
Female 19 4.8553 .12681
Total 95 4.8263 .16338 657.500 -.664 .507
Communication Male 76 4.8388 .16685
Female 19 4.8158 .21798
Total 95 4.8342 .17719 706.500 -.160 .873
Contractor Comfort Male 48 4.8292 .15431
Female 13 4.8923 .13205
Total 61 4.8426 .15106 242.500 -1.328 .184
Competence Male 48 4.8125 .21574
Female 13 4.7885 .22468
Total 61 4.8074 .21599 290.500 -.412 .680
Commitment Male 48 4.8438 .16810
Female 13 4.8846 .19406
Total 61 4.8525 .17307 260.500 -1.009 .313
Communication Male 48 4.8177 .19116
Female 13 4.8846 .16506
Total 61 4.8320 .18664 250.500 1.199- .231
Table 7: Comparison of dimensions between male and female amongst contractors and project
managers
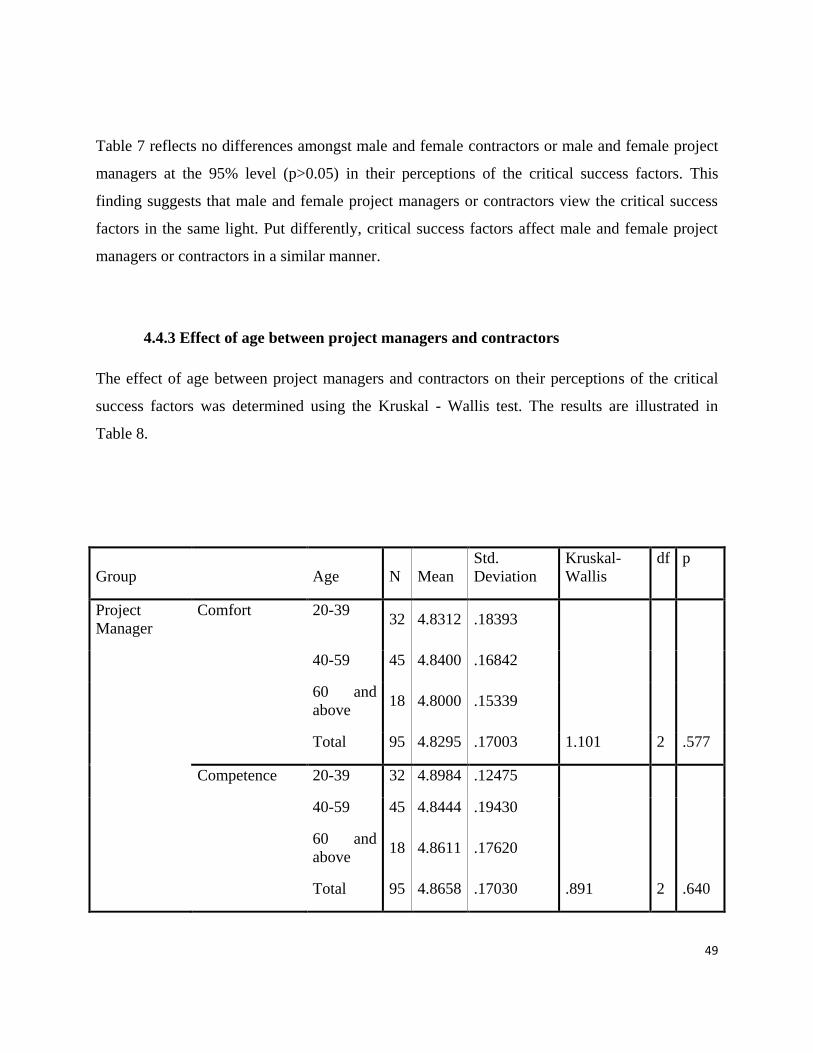
49
Table 7 reflects no differences amongst male and female contractors or male and female project
managers at the 95% level (p>0.05) in their perceptions of the critical success factors. This
finding suggests that male and female project managers or contractors view the critical success
factors in the same light. Put differently, critical success factors affect male and female project
managers or contractors in a similar manner.
4.4.3 Effect of age between project managers and contractors
The effect of age between project managers and contractors on their perceptions of the critical
success factors was determined using the Kruskal - Wallis test. The results are illustrated in
Table 8.
Group Age N Mean
Std.
Deviation
Kruskal-
Wallis
df p
Project
Manager
Comfort 20-39 32 4.8312 .18393
40-59 45 4.8400 .16842
60 and
above 18 4.8000 .15339
Total 95 4.8295 .17003 1.101 2 .577
Competence 20-39 32 4.8984 .12475
40-59 45 4.8444 .19430
60 and
above 18 4.8611 .17620
Total 95 4.8658 .17030 .891 2 .640
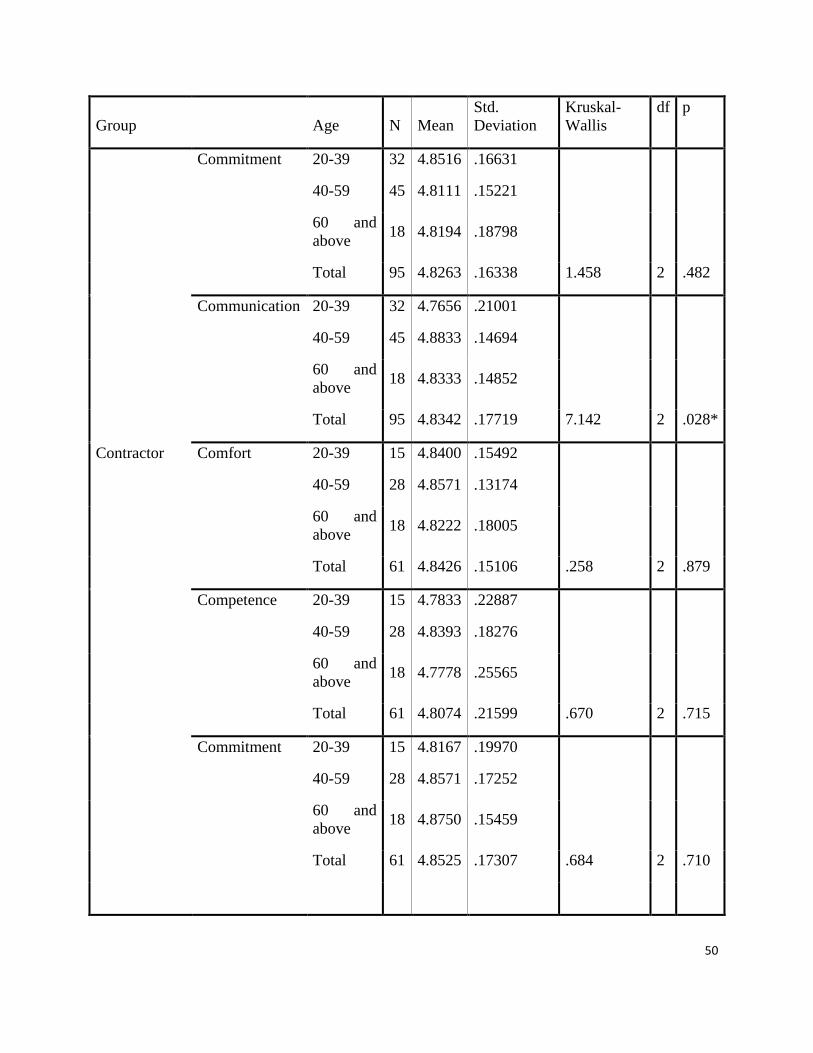
50
Group Age N Mean
Std.
Deviation
Kruskal-
Wallis
df p
Commitment 20-39 32 4.8516 .16631
40-59 45 4.8111 .15221
60 and
above 18 4.8194 .18798
Total 95 4.8263 .16338 1.458 2 .482
Communication 20-39 32 4.7656 .21001
40-59 45 4.8833 .14694
60 and
above 18 4.8333 .14852
Total 95 4.8342 .17719 7.142 2 .028*
Contractor Comfort 20-39 15 4.8400 .15492
40-59 28 4.8571 .13174
60 and
above 18 4.8222 .18005
Total 61 4.8426 .15106 .258 2 .879
Competence 20-39 15 4.7833 .22887
40-59 28 4.8393 .18276
60 and
above 18 4.7778 .25565
Total 61 4.8074 .21599 .670 2 .715
Commitment 20-39 15 4.8167 .19970
40-59 28 4.8571 .17252
60 and
above 18 4.8750 .15459
Total 61 4.8525 .17307 .684 2 .710
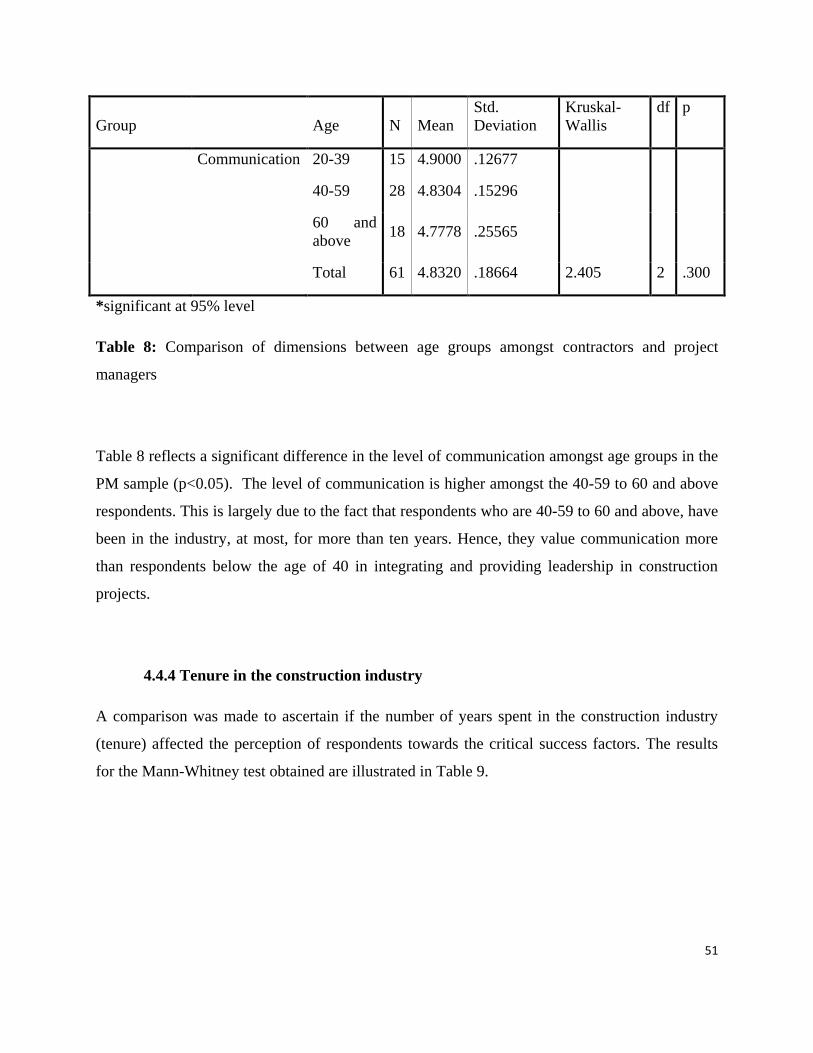
51
Group Age N Mean
Std.
Deviation
Kruskal-
Wallis
df p
Communication 20-39 15 4.9000 .12677
40-59 28 4.8304 .15296
60 and
above 18 4.7778 .25565
Total 61 4.8320 .18664 2.405 2 .300
*significant at 95% level
Table 8: Comparison of dimensions between age groups amongst contractors and project
managers
Table 8 reflects a significant difference in the level of communication amongst age groups in the
PM sample (p<0.05). The level of communication is higher amongst the 40-59 to 60 and above
respondents. This is largely due to the fact that respondents who are 40-59 to 60 and above, have
been in the industry, at most, for more than ten years. Hence, they value communication more
than respondents below the age of 40 in integrating and providing leadership in construction
projects.
4.4.4 Tenure in the construction industry
A comparison was made to ascertain if the number of years spent in the construction industry
(tenure) affected the perception of respondents towards the critical success factors. The results
for the Mann-Whitney test obtained are illustrated in Table 9.
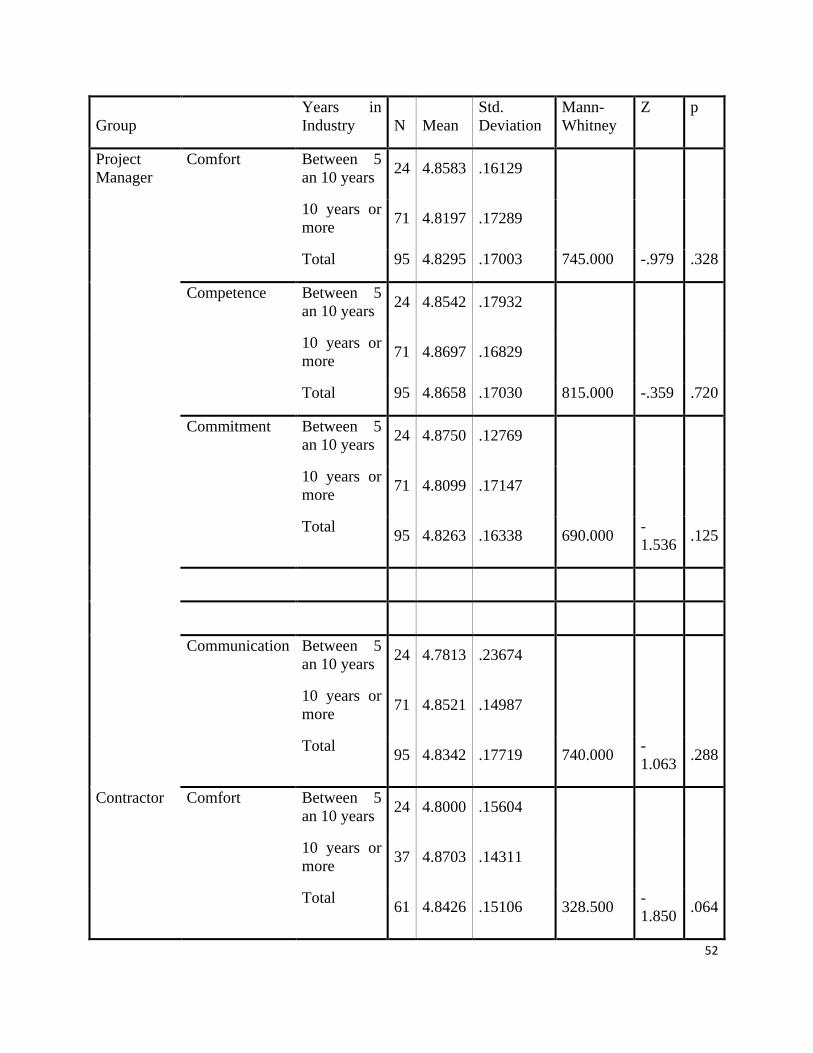
52
Group
Years in
Industry N Mean
Std.
Deviation
Mann-
Whitney
Z p
Project
Manager
Comfort Between 5
an 10 years 24 4.8583 .16129
10 years or
more 71 4.8197 .17289
Total 95 4.8295 .17003 745.000 -.979 .328
Competence Between 5
an 10 years 24 4.8542 .17932
10 years or
more 71 4.8697 .16829
Total 95 4.8658 .17030 815.000 -.359 .720
Commitment Between 5
an 10 years 24 4.8750 .12769
10 years or
more 71 4.8099 .17147
Total 95 4.8263 .16338 690.000
-
1.536 .125
Communication Between 5
an 10 years 24 4.7813 .23674
10 years or
more 71 4.8521 .14987
Total 95 4.8342 .17719 740.000
-
1.063 .288
Contractor Comfort Between 5
an 10 years 24 4.8000 .15604
10 years or
more 37 4.8703 .14311
Total 61 4.8426 .15106 328.500
-
1.850 .064
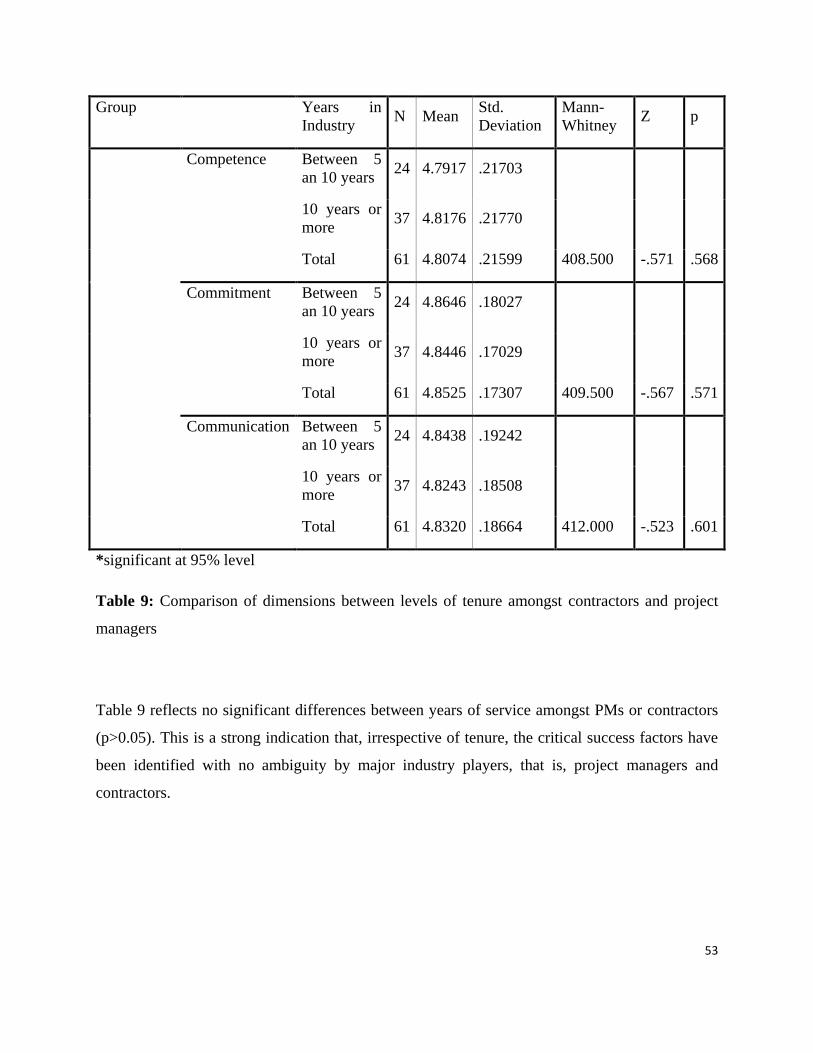
53
Group Years in
Industry N Mean
Std.
Deviation
Mann-
Whitney Z p
Competence Between 5
an 10 years 24 4.7917 .21703
10 years or
more 37 4.8176 .21770
Total 61 4.8074 .21599 408.500 -.571 .568
Commitment Between 5
an 10 years 24 4.8646 .18027
10 years or
more 37 4.8446 .17029
Total 61 4.8525 .17307 409.500 -.567 .571
Communication Between 5
an 10 years 24 4.8438 .19242
10 years or
more 37 4.8243 .18508
Total 61 4.8320 .18664 412.000 -.523 .601
*significant at 95% level
Table 9: Comparison of dimensions between levels of tenure amongst contractors and project
managers
Table 9 reflects no significant differences between years of service amongst PMs or contractors
(p>0.05). This is a strong indication that, irrespective of tenure, the critical success factors have
been identified with no ambiguity by major industry players, that is, project managers and
contractors.
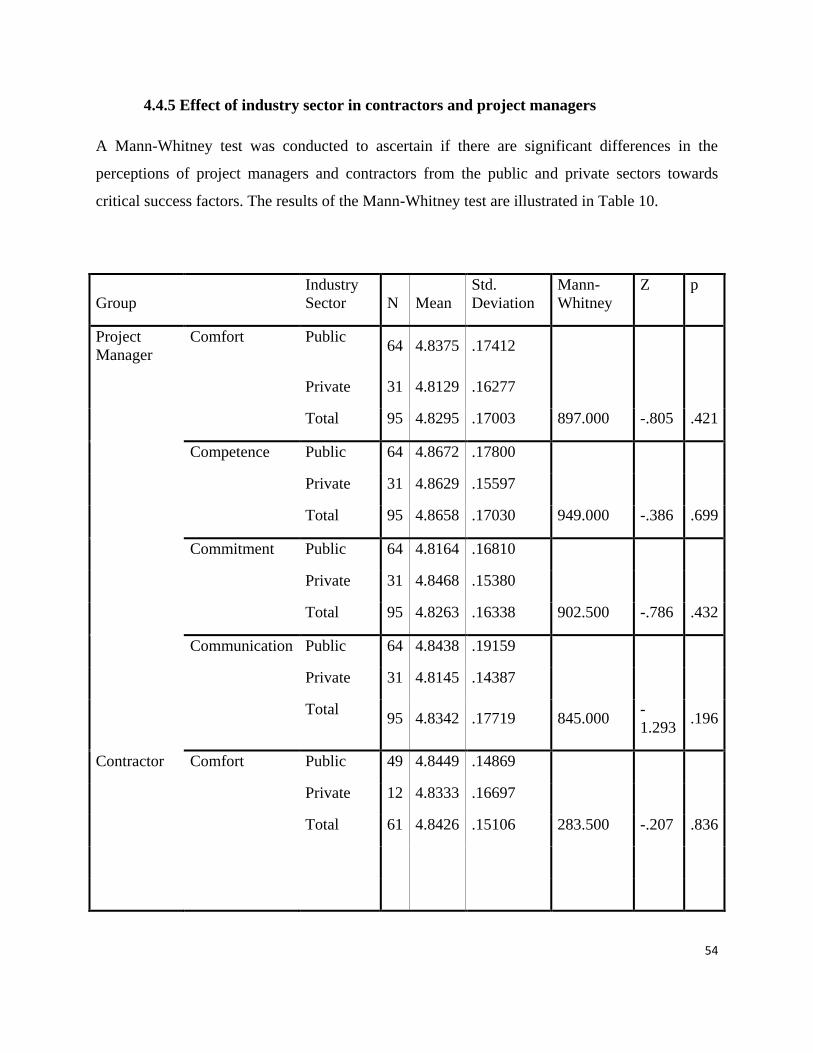
54
4.4.5 Effect of industry sector in contractors and project managers
A Mann-Whitney test was conducted to ascertain if there are significant differences in the
perceptions of project managers and contractors from the public and private sectors towards
critical success factors. The results of the Mann-Whitney test are illustrated in Table 10.
Group
Industry
Sector N Mean
Std.
Deviation
Mann-
Whitney
Z p
Project
Manager
Comfort Public 64 4.8375 .17412
Private 31 4.8129 .16277
Total 95 4.8295 .17003 897.000 -.805 .421
Competence Public 64 4.8672 .17800
Private 31 4.8629 .15597
Total 95 4.8658 .17030 949.000 -.386 .699
Commitment Public 64 4.8164 .16810
Private 31 4.8468 .15380
Total 95 4.8263 .16338 902.500 -.786 .432
Communication Public 64 4.8438 .19159
Private 31 4.8145 .14387
Total 95 4.8342 .17719 845.000
-
1.293 .196
Contractor Comfort Public 49 4.8449 .14869
Private 12 4.8333 .16697
Total 61 4.8426 .15106 283.500 -.207 .836
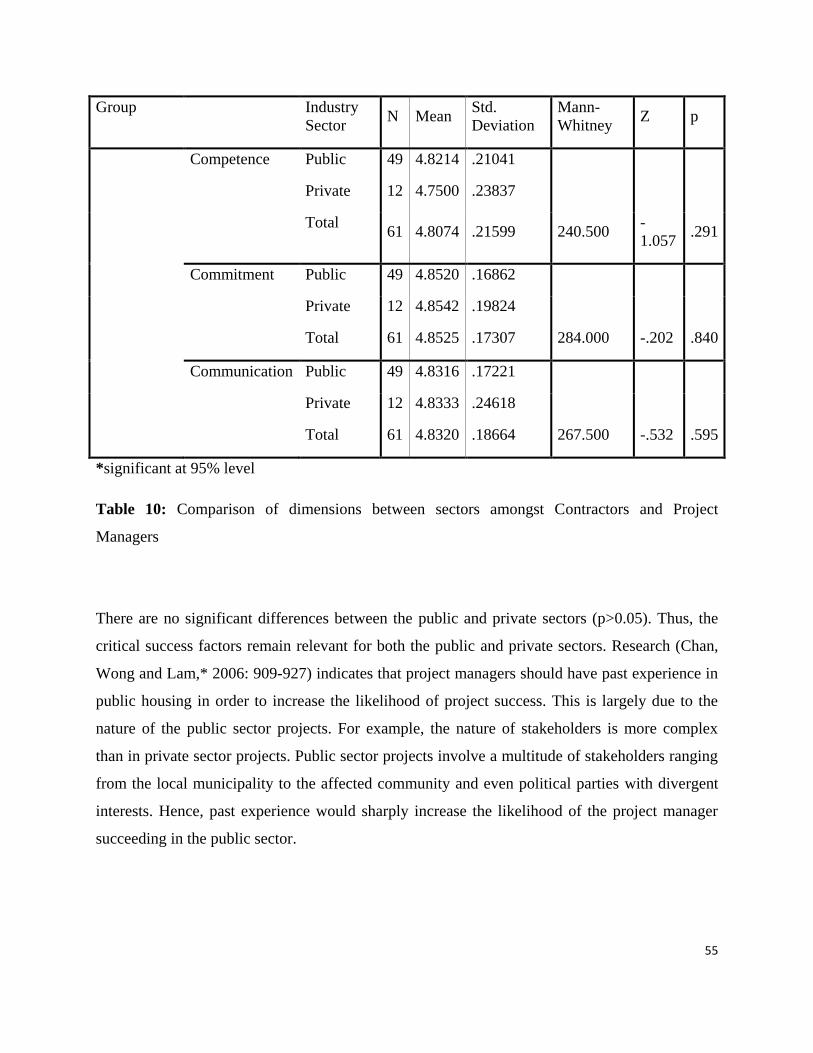
55
Group Industry
Sector N Mean
Std.
Deviation
Mann-
Whitney Z p
Competence Public 49 4.8214 .21041
Private 12 4.7500 .23837
Total 61 4.8074 .21599 240.500
-
1.057 .291
Commitment Public 49 4.8520 .16862
Private 12 4.8542 .19824
Total 61 4.8525 .17307 284.000 -.202 .840
Communication Public 49 4.8316 .17221
Private 12 4.8333 .24618
Total 61 4.8320 .18664 267.500 -.532 .595
*significant at 95% level
Table 10: Comparison of dimensions between sectors amongst Contractors and Project
Managers
There are no significant differences between the public and private sectors (p>0.05). Thus, the
critical success factors remain relevant for both the public and private sectors. Research (Chan,
Wong and Lam,* 2006: 909-927) indicates that project managers should have past experience in
public housing in order to increase the likelihood of project success. This is largely due to the
nature of the public sector projects. For example, the nature of stakeholders is more complex
than in private sector projects. Public sector projects involve a multitude of stakeholders ranging
from the local municipality to the affected community and even political parties with divergent
interests. Hence, past experience would sharply increase the likelihood of the project manager
succeeding in the public sector.
56
4.5 Conclusion
In this chapter, an indepth analysis was performed on the data collected in the study. The
demographic profile of respondents indicated a drastic need for women to be encouraged to enter
the construction industry. Female project managers and contractors only accounted for 12.2%
and 20.5%, respectively. Furthermore, frequency distribution tests were conducted on the four
components of the four COMs model which strengthened the case for the critical success factors
in the questionnaire. A descriptive analysis was conducted on the data using the Mann-W hitney
test and Kruskal-Wallis anova test. These tests revealed that there is no significant difference
between project managers‟ and contractors‟ perception towards the critical success factors.
The next chapter focuses on the conclusions, recommendations, objectives of the study, further
research and restrictions of this study.
57
CHAPTER 5
CONCLUSIONS AND RECOMMENDATIONS
5.1 Introduction
The previous chapter (four) has given an in-depth analysis of the data collected in this study from
project managers and contractors. Thus, this chapter focuses on the conclusions drawn from the
indepth data analysis. Objectives of this study are revisited in a bid to assess whether they
coincide with the results from the data analysis. Limitations of the study and recommendations
for further studies are made.
5.2 The objectives of the study
The aim of this study was to assess the perceptions of contractors and project managers
regarding the critical success factors which lead to project success in the construction industry in
Durban. The following section presents conclusions to the study based on the objectives outlined
earlier in chapter one above.
5.2.1 Identifying the critical success factors
The literature review has been instrumental in outlining critical success factors which lead to
project success in the construction industry. These critical success factors go beyond the “golden
triangle” of time, cost and quality. Data analysis has strongly indicated that both project
managers and contractors have identified the eighteen critical success factors in the
questionnaire, as relevant for the successful execution of construction projects in Durban.
A small percentage of respondents gave additional factors which they viewed as critical for the
successful execution of projects in Durban. The additional factors outlined by these respondents
58
are contained in this study. For example, respondents mentioned misunderstandings arising from
contracts documents as a crucial factor which has resulted in the increase in lawsuits (Sookhalal,
2010). This factor was covered in the questionnaire under the “comprehensive contract
documentation” question. A few respondents, mostly from the public sector, were disheartened
by getting paid at irregular intervals. This factor is covered under the “adequate funding until
project completion” question. Furthermore, respondents also pointed out their frustration at the
awarding of bids especially in the public sector. Again, this factor was covered under the
“awarding of bids to the right project manager/contractor” question. Essentially, project
managers and contractors are confirming that correct critical factors have been identified by this
study.
5.2.2 Assessing the perceptions of contractors and project managers relating to
critical success factors
By and large, project managers and contractors have shown their strong support of the critical
success factors in this study. This was displayed by the fact that a significant number of
respondents gave scores of 4s and 5s as their answers in the questionnaire. Clearly, the major
players (project managers and contractors) in the construction industry unanimously agree on the
critical success factors in this study. The challenge that now remains is to sensitive all relevant
stakeholders. For example, the Construction Industry Development Board (CIDB) needs to
intervene, where necessary, with a view of making the environment more conducive for
successful execution of projects. The CIDB has a crucial role to play in ensuring that its
legislation talks to the critical success factors, if any progress is to be made.
5.2.3 Determining whether there is a significant difference in the perceptions of
contractors and project managers on the critical success factors
Both project managers and contractors have shown no significant differences in the manner they
perceive the critical success factors. There was no significant difference between male and
female project managers in the manner they perceived critical success factors. Similarly, male
59
and female contractors showed no significant difference in their perception of critical success
factors. This finding emphasizes that critical success factors are inherent in the construction
sector environment.
5.2.4 Examining the influence of the biographic variables on the critical success
factors for project managers and contractors
The respondents in this study contained different biographic variables, namely: age groups,
tenure, public or private and value of projects. Therefore, it was interesting to observe how these
varialbles would influence the results. Firstly, all age groups, ranging from 20 -39 to 60 and
above, showed no significant differences in their perceptions of the critical success factors.
Secondly, the number of years spent in the industry (tenure) showed no considerable impact in
the manner that project managers and contractors perceived critical success factors. Thirdly, the
type of industry sector (private or public) where projects were undertaken proved to have no
significant influence over the perception of project managers and contractors towards success
factors. However, it was noted that, in order to increase the likelihood of project success in the
public sector, the project manager should possess experience in this sector (Chan, Wong and
Lam, 2006: 909-927) Lastly, the value of the projects undertaken had no significant influence on
the manner in which project managers and contractors perceived success factors.
5.3 Conclusions about findings of the study
This study has gone a long way into providing much needed clarity on how project managers and
contractors can begin to address the issue of project success. The inability to achieve project
success has resulted in a situation where industry players find it difficult to keep existing clients,
let alone finding new ones. Durban contractors and project managers have reached a point where
they were not sure on what steps need to be taken to address this issue. Hence, the findings of
this study present, in a simplistic manner, eighteen critical success factors that project managers
and contractors need to observe cautiously to increase the likelihood of project success.
60
5.4 Recommendations based on findings
The findings of this study have resulted in the following recommendations:
Over and above the “golden triangle”, an enabling environment should be established
which will ensure that construction projects are executed in comfort, by competent
individuals, with a clear communication plan (including skills) and receive commitment
from all relevant stakeholders;
Simplification of contracts should be one of the CIDB‟s key priorities as this issue has
resulted in the increase of lawsuits recently (Sookhalal, 2010). This has created an
atmosphere of mistrust, mainly between project managers and contractors, since, in most
cases, contractors do not deal directly with the client;
Working on several projects at the same time should be avoided at all cost as it has the
potential of compromising the quality of the project. The CIDB could institute legislation
that allows contractors to work on a certain number of projects at a given interval of time.
This legislation will also ensure that projects are evenly spread across contractors; and
Awarding of bids to the right project manager or contractor in the public sector must be
conducted by an independent body which is not aligned to the local authorities or
municipalities. This issue has caused a lot of frustration for most contractors and project
managers.
5.5 Research recommendations for further research
Although several issues emerged during the course of the investigation, this study was confined
to the stipulated aspects. However, there are critical aspects for further study if one adopts the
view that project success is an ongoing endeavour.
For further research, the following aspects could be explored:
61
Construction projects have had a fair share of casualties. This problem has posed
questions on the ability of industry players to assess the risks involved per project
and then plan accordingly. Therefore, risk management remains a big challenge
for the construction industry;
The role that employee ownership would have on the level of project performance
as most employees who report to contractors are temporary workers with no extra
benefits, besides their pay cheques;
A wider geographical location can be chosen so that a larger number of
respondents from other provinces are included; and
The construction industry is becoming service oriented (Karna, Junnonen and
Sorvala, 2009: 111-127). It will be useful to investigate to what extent does
employing skills utilized in the service industry influence the likelihood of project
success.
5.6 Restrictions of the study
This study covered only Durban-based project managers and active grade four contractors.
Hence, the results of this study cannot be immediately applied to other cities and provinces. This
is due factors like level of growth in the industry, culture and nature of clients. The level of
development that the industry has reached will be reflected by the number of contractors that
have reached grades 4 up to 9. Furthermore, the rate at which contractors qualify for higher
grades is indicative of the progress made in the industry. The culture found in the various cities is
different, thus slightly influencing the perception that project managers and contractors will have
towards critical success factors. The varying mix of public and private clients from different
provinces will slightly influence the perception of project managers and contractors.
62
5.7 Conclusion
This study has managed to identify eighteen critical success factors which will increase the
likelihood of achieving project success in the Durban construction industry. It should be noted
that adopting these critical success factors requires a significant change of attitudes and practices.
Changing attitudes and practices is a process that can easily take up to ten years at most (Barrett,
2008: 100). Hence, industry players (project managers and contractors) need to have a long –
term approach when addressing the issue of project success which has eluded the construction
industry in Durban. Clients, on the other hand, are becoming more knowledgeable. This has seen
the construction industry becoming more service oriented (Karna, Junnonen and Sorvala, 2009:
111-127). Industry players need to address this new development accordingly if they are to
survive this highly competitive industry.
Government intervention has to be directed at ensuring that an equitable environment exists for
both experienced and new players. For example, legislation has to ensure that new contractors
get sufficient tenders in order to acquire the requisite skills and experience to move to higher
grades. The CIDB‟s role is crucial in that its policies should talk to the critical success factors.
63
Bibliography
Akintoye, A. and Main, J. 2007. Collaborative relationships in construction: the UK contractor‟s
perception. Engineering, Construction and Architectural Management, 14 (6): 597-617.
Anantatmula, V. S. 2010. Project Manager Leadership Role in Improving Project Performance.
Engineering Management Journal, 22 (1): 13-22.
Assudani, R. and Kloppenborg, T. J. 2010. Managing stakeholders for project management
success: an emergent model of stakeholders. Journal of General Management, 35 (3): 67-80.
Barrett, P. 2008. Revaluing Construction. Oxford: Blackwell Publishing.
Birley, G. and Moreland, N. 2007. A Practical Guide to Academic Research. 5th
ed. London:
Kogan Page.
Blumberg, B., Cooper, D. R. and Schindler, P. S. 2008. Business Research Methods. 2nd
ed.
Berkshire: McGraw-Hill Education.
64
Burke, R. 2006. Project Management: Planning and Control Techniques. 5th
ed. New York:
Burke Publishing.
Chan, A. P. C., Wong, F. K. W. and Lam, P. T. I. 2006. Assessing quality relationships in public
housing. International Journal of Quality & Reliability Management, 23 (8): 909–927.
Christenson, D. and Walker, D. H. T. 2008. Using vision as a critical success element in project
management. International Journal of Managing Projects in Business, 1 (4): 611-622.
Clarke, N. 2010. Emotional Intelligence and Its Relationship to Transformational Leadership and
Key Project Manager Competences. Project Management Journal, 41 (2) : 5-20.
Corona, M. A. 2010. The Relationship Between Emotional Intelligence and Transformational
Leadership: A Hispanic American Examination. Business Journal of Hispanic Research, 4 (1) :
22-34.
Dwivedula, R. and Bredillet, C. 2010. The Relationship Between Organizational and
Professional Commitment in the Case of Project Workers: Implications for Project Management.
Project Management Journal, 41 (4): 79-88.
Easterby-Smith, M., Thorpe, R. and Jackson, P. R. 2008. Management Research. 3rd
ed. London:
SAGE Publications Ltd.
65
Forsythe, P. 2008. Modelling customer perceived service quality in housing construction.
Engineering, Construction and Architectural Management, 15 (5): 485-496.
Harrison, B. 2007. Project Planning. Paper prepared for the Specialist Project Management
Programme. Durban University of Technology, 10 July 2007.
Jacobson, C. and Choi, S. O. 2008. Success factors: public works and public – private
partnerships. International Journal of Public Sector Management, 21 (6): 637 – 657.
Jafri, M. H. 2010. Organizational Commitment and Employee‟s Innovative Behaviour- A Study
in Retail Sector. Journal of Management Research, 10 (1): 62-68.
Johnson, G., Scholes, K. and Whittington, R. 2006. Exploring Corporate Strategy. Text and
Cases. 7th
ed. London: Pearson Education.
Karna, S., Junnonen, J. and Sorvala, V. 2009. Modelling structure of customer satisfaction with
construction. Journal of Facilities Management, 7 (2): 111-127.
66
Kerzner, H. 2006. ProjectManagement: A system approach to Planning, Scheduling and
Controlling. 9th
ed. New Jersey: John Wiley & Sons Publications.
Kotler, P. and Keller, K. L. 2006. Marketing Management. 12th
ed. New Jersey: Pearson
education.
Lee, N. and Lings, I. 2008. Doing Business Research: A Guide to Theory and Practice. London:
SAGE Publication.
Leedy, P. and Ormrod, J. 2006. Practical Research: Planning and Design. 9th
ed. New Jersey:
Merrill Prentice Hall.
Limsila, K. and Ogunlana, S. O. 2008. Performance and leadership outcome correlates of
leadership styles and subordinate commitment. Construction and Architectural Management, 15
(2): 164 – 184.
67
Lindahl, G. and Ryd, N. 2007. Client‟s goals and the construction project management process.
Facilities, 25 (3/4): 147 – 156.
London, K., Chen, J. and Bavinton, N. 2005. Adopting reflexive capability in international
briefing. Facilities, 23 (7/8): 295-318.
Malach-Pines, A., Dvir, D. and Sadech, A. 2009. Project manager – project (PM – P) fit and
project success. International Journal of Operations & Productions Management, 29 (3): 268 –
291.
Maree, K. 2007. First Steps in Research. Pretoria: Van Schaik Publishers.
Melkonian, T. and Picq, T. 2010. Opening the “Black Box” of Collective Competence in
Extreme Projects: Lessons From the French Special Forces. Project Management Journal, 41
(3): 79-90.
68
Msani, T. A. 2007. Nature and Purpose of Project Planning. Paper prepared for the Specialist
Project Management Programme. Durban University of Technology, 02 June 2007.
Muller, R., Spang, K. and Ozcan, S. 2009. Cultural differences in decision making in project
teams. International Journal of Managing Projects in Business, 2 (1): 70 – 93.
Newton, R. 2005. The Project Manager. London: Pearson Education.
Nguyen, L. D., Ogunlana, S. O. and Lan, D. T. X. 2004. A study on Project success factors in
large construction projects in Vietnam. Engineering, Construction and Architectural
Management, 11 (6): 404-413.
Ojiako, U., Johansen, E. and Greenwood, D. 2008. A qualitative re-construction pf project
measurement criteria. Industrial Management &Data Systems, 108 (3): 405-417.
69
Othman, A. A. E., Hassan, T. M. and Pasquire, C. L. 2004. Drivers for dynamic brief
development in construction. Engineering, Construction and Architectural Management, 11 (4):
248-258.
Parasuraman, A., Grewal, D. and Krishnan, R. 2007. Marketing Research. 2nd
ed. Boston:
Houghton Mifflin.
Pathirage, C. P., Amaratunga, D. G. and Haigh, R. P. 2007. Tacit knowledge and organisational
performance: construction industry perspective. Journal of Knowledge Management, 11 (1): 115-
126.
Pellissier, R. 2007. Business Research Made Easy. Cape Town: Juta & Co.
Phillips, S., Martin, J., Dainty, A. and Price, A. 2008. Analysis of the quality attributes used in
establishing best value tenders on the UK social housing sector. Engineering, Construction and
Architectural Management, 15 (4): 307-320.
70
Register of Contractors [online]. 2010. Available at:
http://www.registers.cidb.org.za/reports/contractorlisting.asp_[Accessed 12 May 2010].
Rowlinson, S. and Cheung, Y. K. 2008. Stakeholder management through empowerment:
modelling project success. Construction Management & Economics, 26 (6): 611-623.
Rui, C., Emerson, M. and Luis, L. 2010. Transformational Leadership and TQM
Implementation. Advances in Management, 3 (6): 7-18.
Samuelson, W. F. and Marks, S. G. 2006. Managerial Economics. 5th
ed. New Jersey: John
Wiley & Sons.
Saunders, M., Lewis, P. and Thornhill, A. 2007. Research Methods for Business Students. 4th
ed.
Harlow: Pearson Education Limited.
Sekaran, U. and Bougie, R. 2010. Research Methods for Business. New York: John Wiley &
Son.
71
Sookhlal, V. 2010. Interview with Mr Vanil Sookhlal, Commercial Director, tbp Building &
Civils, Durban, 3 May.
Steyn, H. 2004. Project Management: Principles and practices. 1st ed. Pretoria: Funda Project
Management (Pty) Ltd Publications.
Subashini, R. 2010. Tacit Knowledge-The Ultimate Essence of an Organization. Advances In
Management, 3 (8): 36-39.
Swan, W. and Khalfan, M. M. A. 2007. Mutual objective setting for partnering projects in the
public sector. Engineering, Construction and Architectural Management, 14 (2): 119-130.
Teo, M. M. M. and Loosemore, M. 2010. Community-based protest against construction
projects: The social determinants of protest movement continuity. International Journal of
Managing Projects in Business, 3 (2): 216-235.
Toor, S. And Ogunlana, S. O. 2009. Construction professionals‟ perception of critical success
factors for large – scale construction projects. Construction Innovation, 9 (2): 149-167.
72
Wideman, M. 2010. Behavior Profiles [online] 2010. Available at:
http://www.maxwideman.com/guests/behavior_profiles/intro.htm [Accessed 04 June 2010].
Yang, J., Shen, Q. and Ho, M. 2009. An overview of previous studies in stakeholder
management and its implications for the construction industry. Journal of Facilities
Management, 7 (2): 159 – 175.
Yang, L. 2007. Exploring the links between technology usage and project outcomes.
Construction Management and Economics, 25 (10): 1041-1051.
Yousefi, S., Hipel, K. W. and Hegazy, T. 2010. Attitude-based strategic negotiation for conflict
management in construction projects. Project Management Journal, 41 (4): 99-107.
Zhen Yu, Z., Wei Yang, Y. and Jian, Z. 2010. Application of Innovative Critical Chain Method
for Project Planning and Control under Resource Constraints and Uncertainty. Journal of
Construction Engineering & Management, 136 (9): 1056-1060.
73
Zwelisha, M. 2010. Interview with Mr Musa Zwelisha, Director, Zwelisha Contractors and
Cleaning Services, Durban, 10 June.
Zwikael, O. 2009. Critical planning processes in construction projects. Construction Innovation,
9 (4): 372 – 387.
74
APPENDICES
Appendix One: Letter of consent
12 Khan Lane
Unit 4 Fatima Heights
Isipingo Rail
4133
Dear Respondent
I am studying towards my Master of Technology Degree in Business Administration at the
Durban University of Technology (DUT). The title of my research project is Critical Success
Factors influencing Project Success in the Durban Construction industry. I would appreciate
your co-operation in completing this questionnaire.
The completion of the questionnaire should not take longer than 10 minutes of your time. I
want to thank you in advance for your time. Please be assured that your identity will remain
anonymous and your responses will be kept confidential.
Participation in this research study is voluntary and you may withdraw from the study at any
time without providing a reason.
Your participation in this research is greatly appreciated.
Yours faithfully
Thulani Armstrong Msani
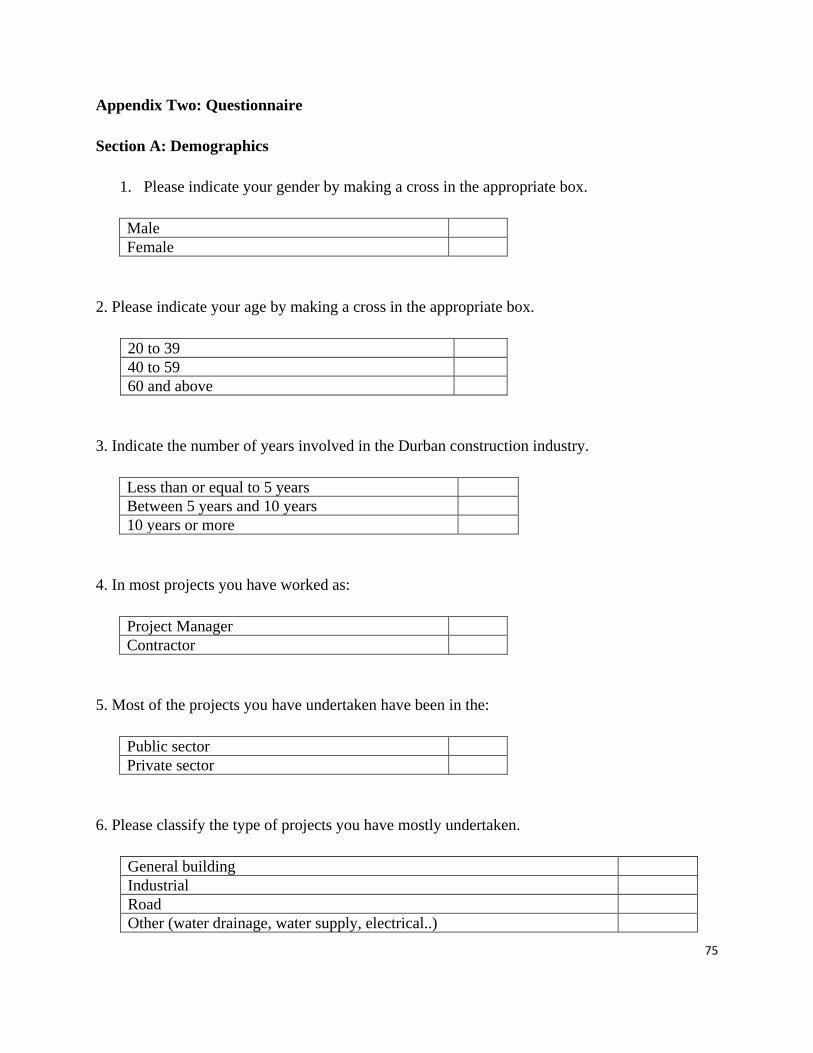
75
Appendix Two: Questionnaire
Section A: Demographics
1. Please indicate your gender by making a cross in the appropriate box.
Male
Female
2. Please indicate your age by making a cross in the appropriate box.
20 to 39
40 to 59
60 and above
3. Indicate the number of years involved in the Durban construction industry.
Less than or equal to 5 years
Between 5 years and 10 years
10 years or more
4. In most projects you have worked as:
Project Manager
Contractor
5. Most of the projects you have undertaken have been in the:
Public sector
Private sector
6. Please classify the type of projects you have mostly undertaken.
General building
Industrial
Road
Other (water drainage, water supply, electrical..)
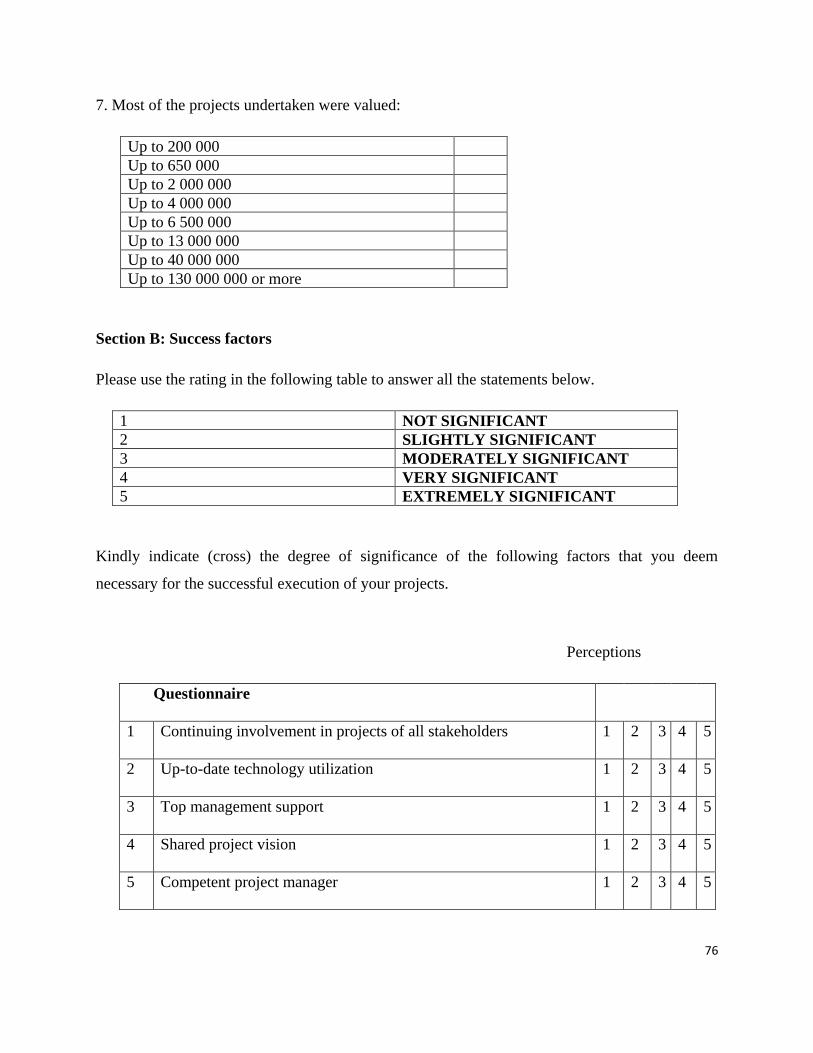
76
7. Most of the projects undertaken were valued:
Up to 200 000
Up to 650 000
Up to 2 000 000
Up to 4 000 000
Up to 6 500 000
Up to 13 000 000
Up to 40 000 000
Up to 130 000 000 or more
Section B: Success factors
Please use the rating in the following table to answer all the statements below.
1 NOT SIGNIFICANT
2 SLIGHTLY SIGNIFICANT
3 MODERATELY SIGNIFICANT
4 VERY SIGNIFICANT
5 EXTREMELY SIGNIFICANT
Kindly indicate (cross) the degree of significance of the following factors that you deem
necessary for the successful execution of your projects.
Perceptions
Questionnaire
1 Continuing involvement in projects of all stakeholders 1 2 3 4 5
2 Up-to-date technology utilization 1 2 3 4 5
3 Top management support 1 2 3 4 5
4 Shared project vision 1 2 3 4 5
5 Competent project manager 1 2 3 4 5
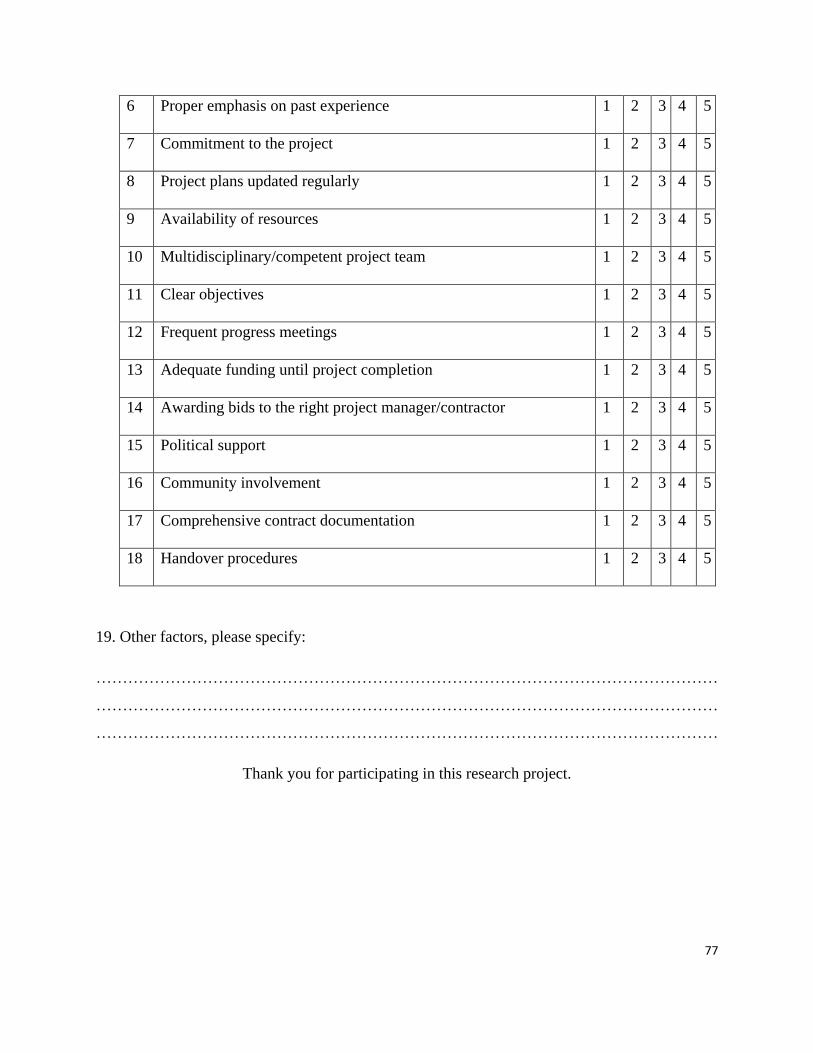
77
6 Proper emphasis on past experience 1 2 3 4 5
7 Commitment to the project 1 2 3 4 5
8 Project plans updated regularly 1 2 3 4 5
9 Availability of resources 1 2 3 4 5
10 Multidisciplinary/competent project team 1 2 3 4 5
11 Clear objectives 1 2 3 4 5
12 Frequent progress meetings 1 2 3 4 5
13 Adequate funding until project completion 1 2 3 4 5
14 Awarding bids to the right project manager/contractor 1 2 3 4 5
15 Political support 1 2 3 4 5
16 Community involvement 1 2 3 4 5
17 Comprehensive contract documentation 1 2 3 4 5
18 Handover procedures 1 2 3 4 5
19. Other factors, please specify:
………………………………………………………………………………………………………
………………………………………………………………………………………………………
………………………………………………………………………………………………………
Thank you for participating in this research project.