CRITICAL SUCCESS FACTORS FOR ACCOUNTING … CHIBUEZE KALU.pdf · parents for their unreserved love,...
148
CRITICAL SUCCESS FACTORS FOR ACCOUNTING INFORMATION SYSTEMS DATA QUALITY BY UKAH CHIBUEZE KALU PG/MBA/10/54752 DEPARTMENT OF ACCOUNTANCY FACULTY OF BUSINESS ADMINISTRATION UNIVERSITY OF NIGERIA, ENUGU CAMPUS. OCTOBER 2011.
Transcript of CRITICAL SUCCESS FACTORS FOR ACCOUNTING … CHIBUEZE KALU.pdf · parents for their unreserved love,...
1
CRITICAL SUCCESS FACTORS FOR ACCOUNTING INFORMATION SYSTEMS
DATA QUALITY
BY
UKAH CHIBUEZE KALU PG/MBA/10/54752
DEPARTMENT OF ACCOUNTANCY FACULTY OF BUSINESS ADMINISTRATION
UNIVERSITY OF NIGERIA, ENUGU CAMPUS.
OCTOBER 2011.
2
TITLE PAGE
CRITICAL SUCCESS FACTORS FOR ACCOUNTING INFORMATION SYSTEMS DATA QUALITY
BY
UKAH CHIBUEZE KALU PG/MBA/10/54752
BEING A PROJECT REPORT SUBMITTED IN PARTIAL FULFILMENT OF THE REQUIREMENTS FOR THE AWARD OF MASTER OF BUSINESS ADMINISTRATION (MBA) DEGREE IN
ACCOUNTANCY
DEPARTMENT OF ACCOUNTANCY FACULTY OF BUSINESS ADMINISTRATION
UNIVERSITY OF NIGERIA, ENUGU CAMPUS,
SUPERVISOR: DR. R.O. UGWOKE
OCTOBER 2011.
3
CERTIFICATION
I UKAH, CHIBUEZE KALU, a postgraduate student in the Department of
Accountancy with registration number PG/MBA/10/54752 has satisfactorily
completed the requirements for course and research work for the award of
Master of Business Administration (MBA) degree in Accountancy.
To the best of my knowledge, the work embodied in this project is original
and has not been submitted in part or in full for any other Diploma or degree
of this or any other university.
………………………. ………………… Ukah, Chibueze Kalu Date PG/MBA/10/54752. Candidate.
4
APPROVED This project work was carried out by Ukah, Chibueze Kalu, a postgraduate
student with registration number PG/MBA/10/54752 in the department of
Accountancy and have been approved and accepted by the Department of
Accountancy, Faculty of Business Administration, University of Nigeria,
Enugu Campus, Enugu.
……………………. ………………… Dr. R.O. Ugwoke Date Supervisor ............................... ………………….. Dr. R.O. Ugwoke Date Head of Department
5
DEDICATION
This project is entirely dedicated to God Almighty for his infinite mercies,
guidance and protection and for making my dream come true. Also to my
friends, and sponsors, CSP Kalu Ukah whose financial support remains the
“back-bone” of my academic pursuits.

6
ACKNOWLEDGMENTS I would like to acknowledge the assistance of many people who provided
help, support, and encouragement, enabling me to complete my M.B.A
project. In particular, I would like to acknowledge the contribution of my
principle supervisor and Accountancy Head of Department, Dr. R.O.
Ugwoke who guided and encouraged me from the beginning and throughout
my whole M.B.A candidature.
Equally, I will not forget to acknowledge the support extended to me by all
the lecturers of the Faculty of Business Administration, especially
Department of Accountancy. My appreciation also goes to the management
of First Bank Plc, Zenith Bank Plc, Nigeria Breweries Plc and Nigeria
Bottling Company Plc all in Enugu State for their co-operation in making
available information necessary to complete this work. All my friends and
colleagues are equally appreciated for their spiritual, moral and financial
support and particularly in the family of Okechukwu Nonso Beloved that
provided invaluable assistance and support. Special thanks to Agu O. Agu,
who helped me at many critical stages of my research and to Chikwendu
Henry A., Sam-Igbeta Felisha and Postgraduate Students Fellowship
University of Nigeria Enugu Campus, whose friendships helped me greatly
on completion of this project work.

7
To my family members, I wish to express my gratitude and love to my
parents for their unreserved love, support and encouragement. The courage
and determination they taught me have made my life so wonderful.
Finally, my profound gratitude goes to Almighty God who is the Alpha and
Omega, Giver of Wisdom and Knowledge, for His provision, guidance and
protection throughout my Masters programme at University of Nigeria.
UKAH, CHIBUEZE KALU PG/MBA/10/54752
8
TABLE OF CONTENTS
Title Page … … … … … … … … … i
Certification … … … … … … … … … ii
Approval Page … … … … … … … … iii
Dedication … … … … … … … … … iv
Acknowledgments … … … … … … … … v
Table of Contents … … … … … … … … vii
List of Figures … … … … … … … … xi
List of Tables … … … … … … … … vii
Abstract … … … … … … … … … x
CHAPTER ONE: INTRODUCTION
1.1 Background of the Study … … … … … … 1
1.2 Statement of the Problems … … … … … 3
1.3 Objectives of the Study … … … … … … 5
1.4 Research Questions … … … … … … 5
1.5 Research Hypothesis … … … … … … 6
1.6 Significance of the Study … … … … … 7
1.7 Scope of the Study … … … … … … 8
1.8 Limitations of the Study … … … …. … … 9
1.9 Operational Definition of Key Terms … … … … 10
1.10 Profile of the Organization used for the Study … … 11
1.10.1 First Bank Plc … … … … … … … 11
9
1.10.2 Zenith Bank Plc … … … … … … … 12
1.10.3 Nigeria Breweries Plc … … … … … … 13
1.10.4 Nigeria Bottling Company Plc … … … … … 13
References … … … … … … … … 15
CHAPTER TWO: REVIEW OF RELATED LITERATURE
2.1 Introduction … … … … … … … 16
2.2 Data Quality … … … … … … … 16
2.3 Accounting Information System … … … … 19
2.4 Data Quality of Accounting Information System … … 19
2.4.1 Data Quality in AIS for this research … … … … 22
2.5 Quality Management … … … … … 24
2.5.1 Quality management: Just-in-time … … … … 27
2.5.2 Product Perspective on Data Quality Management … … 29
2.5.3 Product Quality and Service Quality … … … … 30
2.5.4 Data Quality in Database System … … … … 36
2.6 Critical Success Factors for Quality Management and TQM… 32
2.7 Total Data Quality Management … … … … 35
2.7.1 Data Quality in e-Business … … … … … 36
2.7.2 Framework for Data Quality Research … … … 36
2.7.3 Important Steps in Ensuring Data Quality … … … 40
2.8 Data Quality in Accounting Information System … … 43
2.8.1 The Model for factors Influencing Data Quality in AIS … 43
10
2.8.2 Possible factors that Impact on Data Quality in AIS… … 46
2.8.3 Critical factors for Ensuring Data Quality in AIS … … 46
2.9 Stakeholder Groups for Data Quality in AIS … … … 47
References … … … … … … … … 53
CHAPTER THREE: RESEARCH METHODOLOGY
3.1 Introduction … … … … … … … 53
3.2 Research Design … … … … … … … 53
3.3 Sources of Data … … … … … … … 54
3.4 Area of Study … … … … … … … 55
3.5 Instruments for Data Collection … … … … 55
3.6 Population of the Study … … … … … … 56
3.7 Sampling Procedure … … … … … … 56
3.8 Sample Size Determination … … … … … 57
3.9 Validity of the Research Instrument … … … … 59
3.10 Reliability of the Research Instrument … … … … 59
3.11 Questionnaire Design and Administration … … … 61
3.12 Data Treatment Technique(s) … … … … … 61
References … … … … … … … … 64
CHAPTER FOUR: PRESENTATION AND ANALYSIS OF DATA
4.1 Introduction … … … … … … … 65
4.2 Analysis of Questionnaire … … … … … 66
11
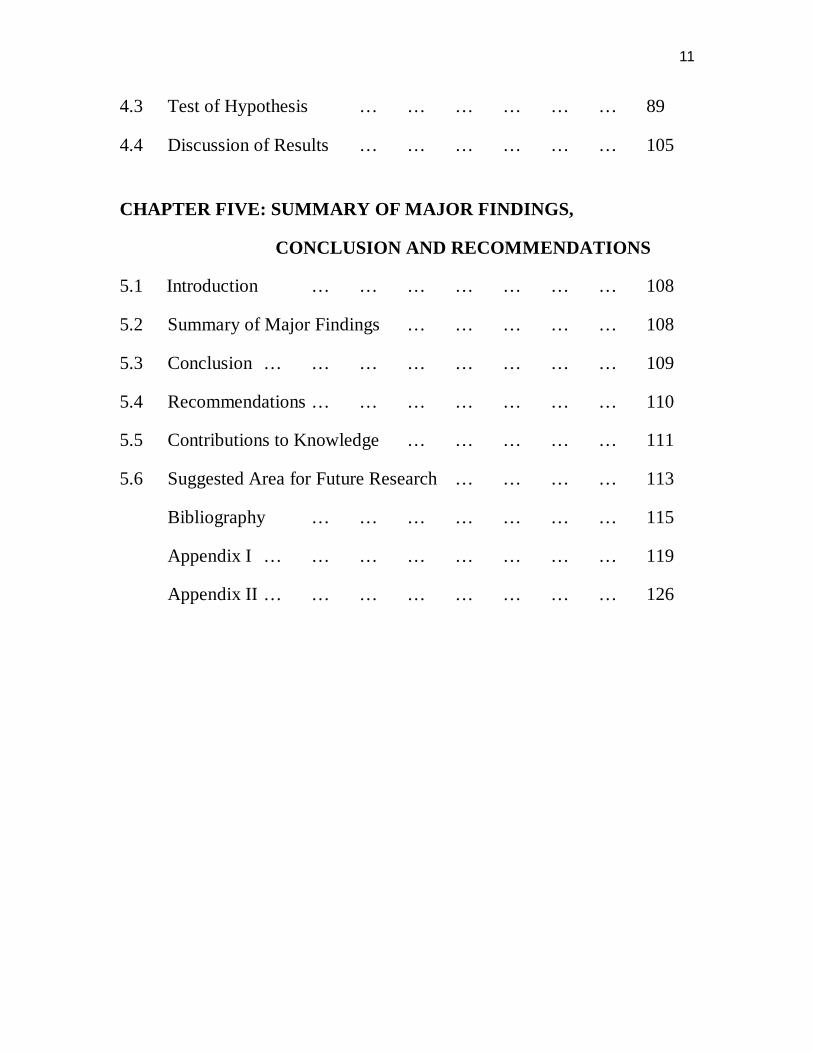
4.3 Test of Hypothesis … … … … … … 89
4.4 Discussion of Results … … … … … … 105 CHAPTER FIVE: SUMMARY OF MAJOR FINDINGS,
CONCLUSION AND RECOMMENDATIONS
5.1 Introduction … … … … … … … 108
5.2 Summary of Major Findings … … … … … 108
5.3 Conclusion … … … … … … … … 109
5.4 Recommendations … … … … … … … 110
5.5 Contributions to Knowledge … … … … … 111
5.6 Suggested Area for Future Research … … … … 113
Bibliography … … … … … … … 115
Appendix I … … … … … … … … 119
Appendix II … … … … … … … … 126
12
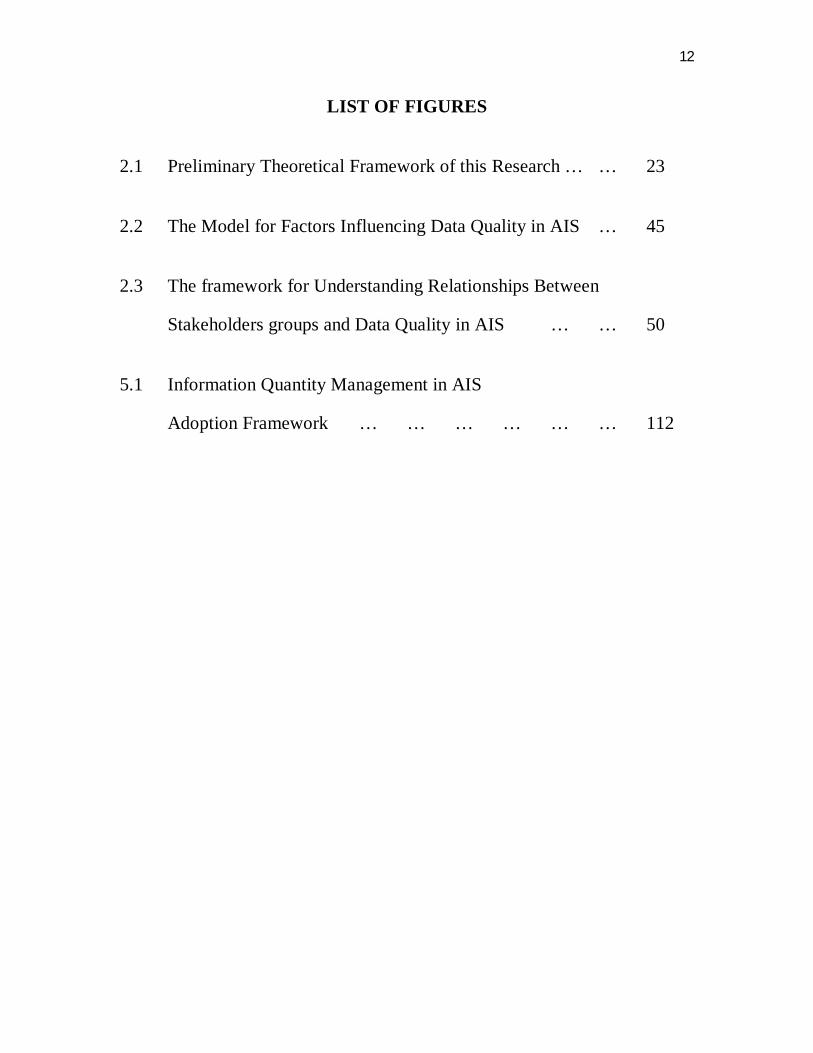
LIST OF FIGURES
2.1 Preliminary Theoretical Framework of this Research … … 23
2.2 The Model for Factors Influencing Data Quality in AIS … 45
2.3 The framework for Understanding Relationships Between
Stakeholders groups and Data Quality in AIS … … 50
5.1 Information Quantity Management in AIS
Adoption Framework … … … … … … 112
13
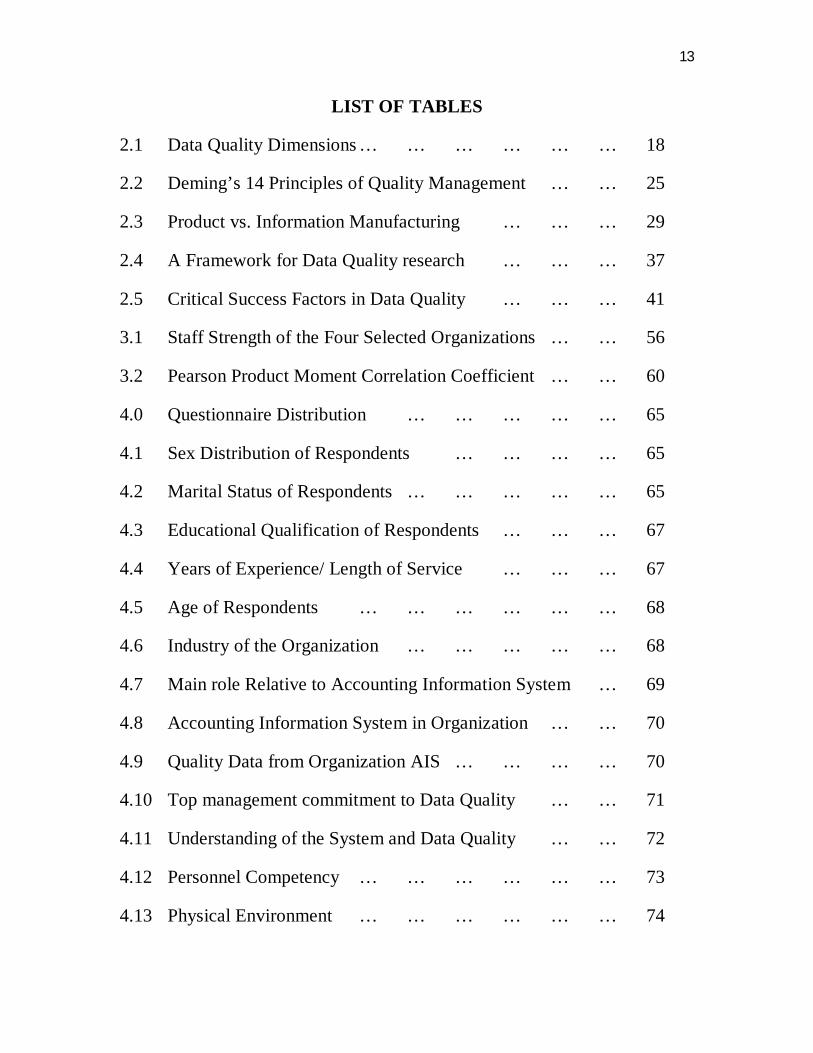
LIST OF TABLES
2.1 Data Quality Dimensions … … … … … … 18
2.2 Deming’s 14 Principles of Quality Management … … 25
2.3 Product vs. Information Manufacturing … … … 29
2.4 A Framework for Data Quality research … … … 37
2.5 Critical Success Factors in Data Quality … … … 41
3.1 Staff Strength of the Four Selected Organizations … … 56
3.2 Pearson Product Moment Correlation Coefficient … … 60
4.0 Questionnaire Distribution … … … … … 65
4.1 Sex Distribution of Respondents … … … … 65
4.2 Marital Status of Respondents … … … … … 65
4.3 Educational Qualification of Respondents … … … 67
4.4 Years of Experience/ Length of Service … … … 67
4.5 Age of Respondents … … … … … … 68
4.6 Industry of the Organization … … … … … 68
4.7 Main role Relative to Accounting Information System … 69
4.8 Accounting Information System in Organization … … 70
4.9 Quality Data from Organization AIS … … … … 70
4.10 Top management commitment to Data Quality … … 71
4.11 Understanding of the System and Data Quality … … 72
4.12 Personnel Competency … … … … … … 73
4.13 Physical Environment … … … … … … 74
14
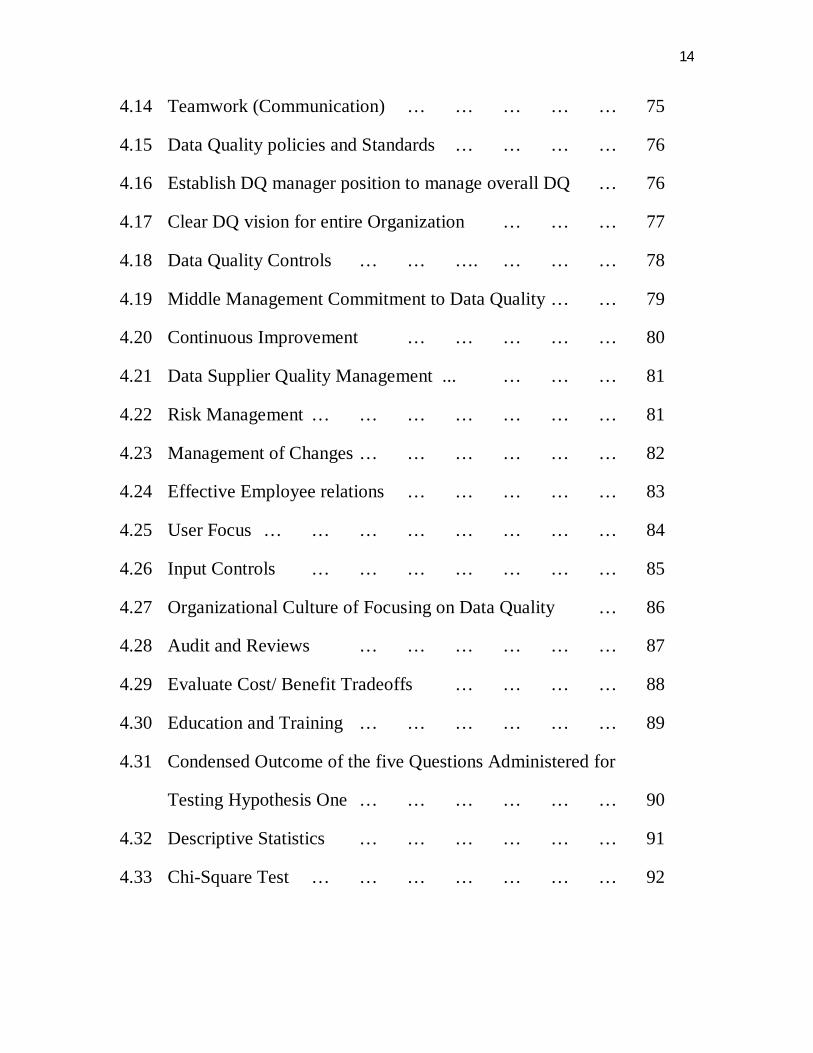
4.14 Teamwork (Communication) … … … … … 75
4.15 Data Quality policies and Standards … … … … 76
4.16 Establish DQ manager position to manage overall DQ … 76
4.17 Clear DQ vision for entire Organization … … … 77
4.18 Data Quality Controls … … …. … … … 78
4.19 Middle Management Commitment to Data Quality … … 79
4.20 Continuous Improvement … … … … … 80
4.21 Data Supplier Quality Management ... … … … 81
4.22 Risk Management … … … … … … … 81
4.23 Management of Changes … … … … … … 82
4.24 Effective Employee relations … … … … … 83
4.25 User Focus … … … … … … … … 84
4.26 Input Controls … … … … … … … 85
4.27 Organizational Culture of Focusing on Data Quality … 86
4.28 Audit and Reviews … … … … … … 87
4.29 Evaluate Cost/ Benefit Tradeoffs … … … … 88
4.30 Education and Training … … … … … … 89
4.31 Condensed Outcome of the five Questions Administered for
Testing Hypothesis One … … … … … … 90
4.32 Descriptive Statistics … … … … … … 91
4.33 Chi-Square Test … … … … … … … 92
15
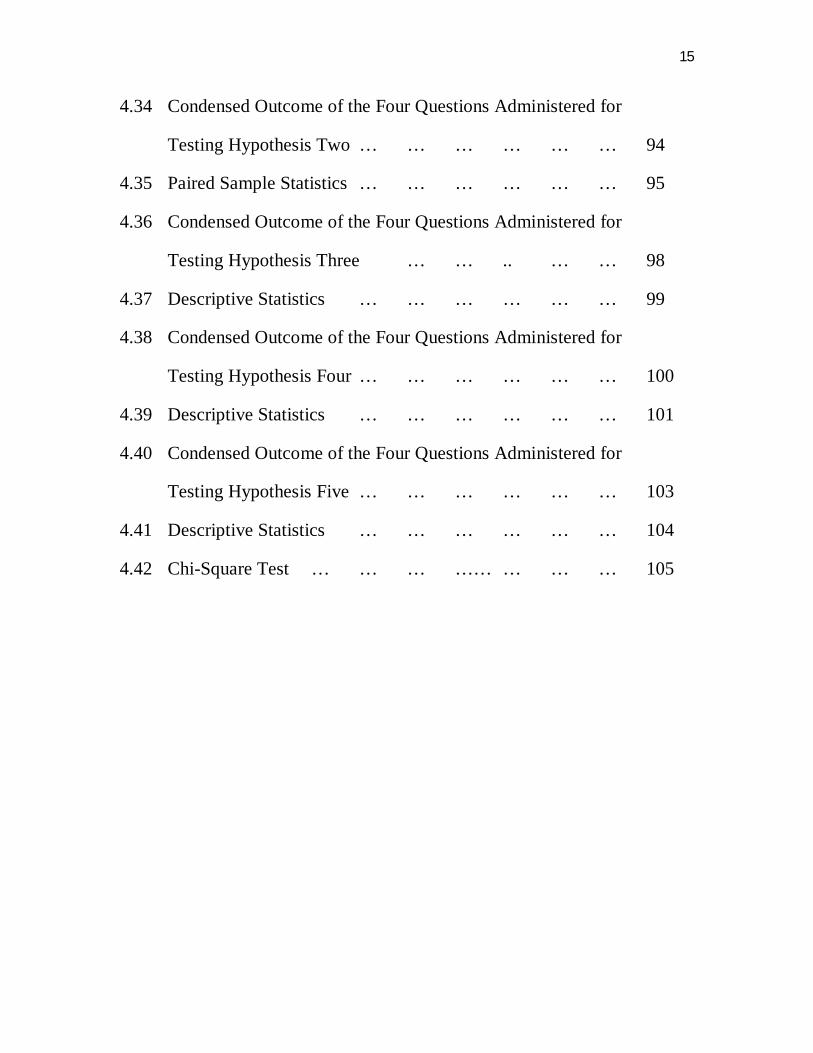
4.34 Condensed Outcome of the Four Questions Administered for
Testing Hypothesis Two … … … … … … 94
4.35 Paired Sample Statistics … … … … … … 95
4.36 Condensed Outcome of the Four Questions Administered for
Testing Hypothesis Three … … .. … … 98
4.37 Descriptive Statistics … … … … … … 99
4.38 Condensed Outcome of the Four Questions Administered for
Testing Hypothesis Four … … … … … … 100
4.39 Descriptive Statistics … … … … … … 101
4.40 Condensed Outcome of the Four Questions Administered for
Testing Hypothesis Five … … … … … … 103
4.41 Descriptive Statistics … … … … … … 104
4.42 Chi-Square Test … … … …… … … … 105
16
ABSTRACT
Today’s organizations are operating and competing in an information age. Quality information is critical to organizations’ success in today’s highly competitive environment. Accounting information systems (AIS) as a discipline within information systems require high quality data. However, empirical evidence suggests that data quality is problematic in AIS. Therefore, knowledge of critical factors that are important in ensuring data quality in accounting information systems is desirable. A literature review evaluates previous research work in quality management, data quality, and accounting information systems. It was found that there was a gap in the literature about critical success factors for data quality in accounting information systems. Based on this gap in the literature and the findings of the exploratory stage of the research, a preliminary research model for factors influence data quality in AIS was developed. A framework for understanding relationships between stakeholder groups and data quality in accounting information systems was also developed. The major stakeholders are information producers, information custodians, information managers, information users, and internal auditors. A model for critical success factors for AIS DQ was proposed and examined in four Nigerian organizations were carried out, where two of them were banking organizations and the other two are manufacturing organizations. Each case was examined as a whole to obtain an understanding of the opinions and perspectives of the respondents from each individual organization as to what are considered to be the important factors in the case Furthermore, the variations between five different stakeholder groups were also examined. The results of the four main case studies suggested 26 factors that may have impact on data quality in AIS. The major findings from the survey are: 1. respondents rated the importance of the factors and the actual performance of those factors consistently higher. 2. Four factors were found to be significantly different between different stakeholder groups: user focus, measurement and reporting, data supplier quality management and audit and reviews. 3. The top three critical factors for ensuring data quality in AIS were: top management commitment, education and training, and the nature of the accounting information systems. The key contribution of this project is the theoretical framework developed from the analysis of the findings of this research, which is the first such framework built upon empirical study that explored factors influencing data quality in AIS and their interrelationships with stakeholder groups and data quality outcomes. That is, it is now clear which factors impact on data quality in AIS, and which of those factors are critical success factors for ensuring high quality information outcomes. In addition, the performance level of factors was also incorporated into the research framework. Since the actual performance of factors has not been highlighted in other studies, this research adds new theoretical insights to the extant literature. In turn, this research confirms some of the factors mentioned in the literature and adds a few new factors. Moreover, stakeholder groups of data quality in AIS are important considerations and need more attention. The research framework of this research shows the relationship between stakeholder groups, important factors and data quality outcomes by highlighting stakeholder groups’ influence on identifying the important factors, as well as the evaluation of the importance and performance of the factors.
17
CHAPTER ONE
INTRODUCTION
1.1 BACKGROUND OF THE STUDY
Quality information is one of the competitive advantages for an organization. In an
accounting information system, the quality of the information provided is
imperative to the success of the systems. Accounting Information System (AIS) as
one of the most critical systems in the organization has also changed its way of
capturing, processing, storing and distributing information. Information has
become a key resource of most organizations, economies, and societies. Indeed, an
organization’s basis for competition has changed from tangible products to
intangible information. More and more organizations believe that quality
information is critical to their success (Wang, R.Y 2006).
However, not many of them have turned this belief into effective action. Poor
quality information can have significant social and business impacts (Strong, Lee
and Wang, 1997). There is strong evidence that data quality problems are
becoming increasingly prevalent in practice (Redman, T.C 1998). Most
organizations have experienced the adverse effects of decisions based on
information of inferior quality (Huang, Lee and Wang, 1999). It is likely that some
data stakeholders are not satisfied with the quality of the information delivered in
their organizations. In brief, information quality issues have become important for
organizations that want to perform well, obtain competitive advantage, or even
just survive in the 21st century.
18
In particular, Accounting Information Systems (AIS) maintain and produce the
data used by organizations to plan, evaluate, and diagnose the dynamics of
operations and financial circumstances (Anthony, Reese and Herrenstein, 2005).
Providing and assuring quality data is an objective of accounting. With the advent
of AIS, the traditional focus on the input and recording of data needs to be offset
with recognition that the systems themselves may affect the quality of data
(Fedorowicz and Lee, 1998). Indeed, empirical evidence suggests that data quality
is problematic in AIS (Johnson, Leith, and Neter, 1981). AIS data quality is
concerned with detecting the presence or absence of target error classes in
accounts (Kaplan, Krishnan, Padman and Peters, 1998).
Thus, knowledge of the critical factors that influence data quality in AIS will assist
organizations to improve their accounting information systems’ data quality.
While many AIS studies have looked at internal control and audit, Data Quality
(DQ) studies have focused on the measurement of DQ outcomes. It appears that
there have been very few attempts to identify the Critical Success Factors (CSFs)
for data quality in AIS. Thus, there is a need for research to identify the critical
success factors that affect organizations’ AIS DQ.
Information technology has changed the way in which traditional accounting
systems work. There is more and more electronically captured information that
needs to be processed, stored, and distributed through IT-based accounting
systems. Advanced IT has dramatically increased the ability and capability of
processing accounting information. At the same time, however, it has also
introduced some issues that traditional accounting systems have not experienced.
One critical issue is the data quality in AIS. IT advantages can sometimes create
19
problems rather than benefiting an organization, if data quality issues have not
been properly addressed. Information overload is a good example. Do we really
need the quantity of information generated by the systems to make the right
decision? Another example is e-commerce. Should the quality of data captured
online always be trusted?
Data quality has become crucial for the success of AIS in today’s IT age. The need
arises for quality management of data, as data processing has shifted from the role
of operations support to a major operation in itself (Romney, M. and Steinbart, P.
J., 2009). Therefore, knowledge of those factors impact on data quality in
accounting information systems is desirable, because those factors can increase the
operating efficiency of AIS and contribute to the effectiveness of management
decision making.
1.2 STATEMENT OF THE PROBLEM
The proliferation of computerized database with relative increase in errors of such
stored data base in organizations which depend on them to support business
process and decision making has been questioned by many analysts.
The number of errors in stored data and the organizational impact of these errors is
likely to increase (Klein 1998).
Also, inaccurate and incomplete data may adversely affect the competitive success
of an organization (Redman 1992). Indeed, poor quality information can have
significant social and business impacts. For example, NBC News reported that
“dead people still eat!” Because of outdated information in US government
20
databases, food stamps continued to be sent to recipients long after they died.
Fraud from food stamps costs US taxpayers billions of dollars.
Equally, losses in millions incurred by business organizations who were caught
unawares by dramatic changes in interest rates is of great concern to both owners
and management.
In particular, there are consequences of poor data quality in AIS. For example,
errors in an inventory database may cause managers to make decisions that
generate overstock or under-stock conditions (Bowen 1993). One minor data entry
error, such as the unit of product/service price, could go through an organization’s
AIS without appropriate data quality checks, and cause losses to an organization
and / or harm its reputation.
More so, most of the information system research into data quality focuses on the
theoretical modeling of controls and measurement while few studies have
attempted to understand what causes the difference in AIS data quality outcomes,
and what should be done to ensure high quality accounting information.
Most organizations have experienced the adverse effects of decision based on
information of inferior quality. However, not many of them have turned this belief
into effective action. Poor quality information can have significant social and
business impacts.
Therefore, there is lack of knowledge of the CSF for data quality in AIS that can
assist organizations to ensure and improve accounting information quality.
These has necessitated the conduct of this research.
21
1.3 OBJECTIVES OF THE STUDY
The main objective of this study is to examine the critical success factors for
accounting information systems data quality. The subsidiary objectives include the
following:
(1) To determine the factors that affects the variation of data quality in
accounting information systems.
(2) To ascertain the variations with regard to the perceptions of importance of
those factors that affect data quality in accounting information systems.
(3) To examine the stakeholder perceptions on importance of critical factors
for accounting information systems.
(4) To investigate the factors that are critical success factors to ensure a high
quality of data in accounting information systems
(5) To examine the organizations perspective in the importance and
performance of critical success factors for accounting information system
data quality.
1.4 RESEARCH QUESTIONS
In order to explore the research problem, the focus of this project is on five
research questions which reflect on the objectives of the study are fielded.
(1) What factors affect the variation of data quality in accounting information
systems?
(2) Are there any variations with regard to the perceptions of importance of
those factors that affect data quality in accounting information systems?
22
(3) What are the perceptions of stakeholder groups in importance of critical
factors for accounting information systems?
(4) Which of these factors are critical success factors to ensure a high quality of
data in accounting information systems data quality?
(5) What are organizations perspective in the importance and performance of
critical success factors for accounting information system data quality?
1.5 RESEARCH HYPOTHESES
In analyzing the critical success factors for accounting information systems’ data
quality, some tentative statements were formed to help answer the research
questions hence the following hypotheses that have to be tested were put forward
for this study.
Hypothesis One
Ho: There are no significant factors that affect the variation of data quality in
accounting information system.
H1: There are significant factors that affect the variation of data quality in
accounting information system.
Hypothesis Two
H0: There are no significant differences between the perceptions of importance
of critical factors for accounting information systems’ data quality, and
actual performance of those factors.
H1: There are significant differences between the perceptions of importance of
critical factors for accounting information systems’ data quality, and actual
performance of those factors.
23
Hypothesis Three
H0: There are no significant differences between different stakeholder groups in
their perceptions of importance of critical factors for accounting
information systems’ data quality.
H1: There are a significant difference between different stakeholder groups in
their perceptions of importance of critical factors for accounting
information systems’ data quality.
Hypothesis Four
H0: There are no significant critical success factors to ensure a high quality of
data in accounting information systems.
H1: There are significant critical success factors to ensure a high quality of data
in accounting information systems.
Hypothesis Five
H0: Different organizations have the same perspective in the importance and
performance of critical success factors for accounting information systems
data quality.
H1: Different organizations have different perspective in the importance and
performance of critical success factors for accounting information systems
data quality.
1.6 SIGNIFICANCE OF THE STUDY
Identifying the critical success factors for AIS could enhance the ability of AIS’s
to gather data, process information and prepare reports. Outcomes of this research
will contribute to the body of knowledge both in AIS and data quality field, and it
24
may benefit other research into these areas. For example, it can help arouse the
awareness of data quality issues in AIS field, and to make it possible to establish
the linkage of the identified CSFs with the existing data quality dimensions for
outcomes assessment.
Thus, understanding how these factors affect organizations’ AIS performance may
be useful to practitioners. Focusing on those factors that are more critical than
others will lead to efficiency and effectiveness AIS’s procedures. In brief, the
results from this research are likely to help the academic community for future
researchers, organizations’ top management, accountants, and IT managers obtain
better understanding of AIS DQ issues.
1.7 SCOPE OF THE STUDY
This study is limited to four Nigerian companies selected for the case study in this
research. Two of them were chosen from banking industry, and two from
manufacturing industry. As there is no one set of criteria to distinguish banking
industry and manufacturing industry for the purpose of the case study analysis of
this research, employee number was use to define the size of the organizations.
Although criteria defining organizations as bank, manufacturing vary, in this
research organizations with more than 1000 employees were categorized as
manufacturing companies while those organizations with fewer than 1000
employees were categorized as banking industries. In order to respect the privacy
of the participating organizations and individual interviewees they were not
identified by their real names or actual position titles.
25
1.8 LIMITATIONS OF THE STUDY
As part of the research experience by researchers all over the globe; certain
limitations hindered the effective and smooth collection of data for the work.
These in specific terms include: inadequate working fund, lack of time and
difficulties (minimal) in obtaining needed data relevant to the subject matter of
critical success factors for accounting information systems data quality.
Financial Constraint: The finance needed to carry out this work is too much and
cannot be afforded by the student. This to an extent hampered the success of this
work.
Time Constraint: Time was really a big constraint in carrying out this research
study. The researcher had to combine the collection of materials for the study with
other academic activities. The study was not easy to carryout due to distant part of
the organizations and the huge financial burden involved.
Non-Challant Attitude of Respondents: Another limitation in the course of
carrying this study was the non-chalet attitude of the respondents in supplying the
necessary information. This was probably due to their ignorance of the main
purpose of the study. Also many refused to grant interviews or answer question
bordering on the activities of the organizations.
Scope of the Research: The study was constrained to Nigerian organizations;
therefore, the conclusions drawn from this study may have a potential problem on
generalization.
26
1.9 OPERATIONAL DEFINITIONS OF KEY TERMS
This section develops the definition of core terms for this research because precise
definitions of core terms are the foundation of any research project.
Accounting Information System: Accounting information system (AIS) is a
system of records, usually computer based, which combines accounting principles
and concepts with the benefits of an information system and which is used to
analyze and record business transactions for the purpose to prepare financial
statements and provide accounting data to the organizations studied.
Critical Success Factor: Critical success factor (CSF) is the term for an element
that is necessary for an organization or project to achieve its mission.
Data Quality: Data Quality (DQ) is the state of completeness, validity,
consistency, timeliness and accuracy that makes data appropriate for a specific
use.
Data Suppliers: Data suppliers are those who provide raw, un-organized data to
the accounting systems which include both internal and external such as, other
departments within the organization (internal), and trading partners (external).
Information Users: Information users are the users of the accounting information
which include both internal and external users. Such as: top management and
general users within the organization (internal), banks and government (external).
Middle Management: is responsible for implementing the strategic decisions of
top management. Middle managers make tactical/short-range decisions.
27
Non-management Employees: who include production, clerical, and staff
personnel.
Stakeholder: Stakeholder is a person, group, organization, or system who affects
or can be affected by the organization's actions
Small to Medium Organizations: Small to medium organizations (SMEs) are
companies whose headcount or turnover falls below certain limits.
Top Management: Executive or senior management includes the highest
management positions in an organization.
1.10 PROFILE OF THE ORGANIZATION USED FOR THE STUDY
1.10.1 First Bank Plc
First Bank Plc is one of the oldest financial institutions in Nigeria and was the first
bank to be established in West Africa. The bank was incorporated as a limited
liability company in March 1894 and was listed on The Nigerian Stock Exchange
in March 1971. Following the Central Bank of Nigeria’s (“CBN”) induced
industry-wide consolidation in 2005, the bank acquired its merchant banking
subsidiary, FBN (Merchant Bankers) Limited and MBC International Bank Plc.
The bank offers a wide array of financial services to a diverse customer base
through its local and offshore offices, including 465 branch offices country wide
and 532 ATM’s. In addition to growing organically through new products and
branch development, other viable domestic acquisitions are being explored as the
Bank marked its 110 years of existence during which it pioneered the art and
science of modern banking in the country.
28
First Bank of Nigeria maintains a subsidiary in the United Kingdom, FBN Bank
(UK), which has a branch in Paris. The bank also has representative offices in
South Africa and China. In October 2011, the bank acquired Banque International
de Credit (BIC), a leading bank in the Democratic Republic of Congo (DRC).
(http://www.firstbanknigeria.com/Portals/2/pdf/Rating_rep/FirstBank%20-
%20GCRFinal%20%20rpt%2008.pdf)
1.10.2 Zenith Bank Plc
Zenith Bank was established in May 1990. It became a public limited company in
July 2004, and had an initial public offering on the Nigerian Stock Exchange
(NSE) on October 21 of that year. Also in 2004, credit rating agency Fitch Ratings
identified its credit as AA- on their long-term scale.
Zenith Bank Plc is a Nigeria-based commercial bank engaged in the provision of
universal banking services to corporate, commercial and individual customers.
The Bank provides services as savings and current accounts, treasury and
financing services, investment banking, mortgage loans, trade financing, fund
management and investment banking, import and export finance, and cash and
liquidity management services to the wholesale and retail market, among others.
In addition, various types of credit and debit cards, Internet and telephone
banking, as well as money transfer services. The Company operates a number of
subsidiaries include, among others, Zenith Realtors Ltd, Zenith Registrars, Zenith
General Insurance, Zenith Pension Custodian, Zenith Securities, Zenith Life
Assurance, Zenith Capital, Zenith Medicare and Zenith Trustees Limited.
29
1.10.3 Nigeria Breweries Plc
Nigerian Breweries Plc (NB), incorporated in 1946, is the pioneer and largest
brewing company in Nigeria with current annual production capacity estimated at
10 mn hectolitres. The company is engaged in brewing, marketing and selling of
alcoholic and non-alcoholic products such as lagers, stouts, non-alcohol malt
drinks and soft drinks. Nigerian Breweries Plc (NB) is a subsidiary of Dutch
brewer, Heineken N.V. and distributes its products across Nigeria. NB offers beer
under the Star and Gulder brands, lager under the Heineken brand, malt drinks
under the Maltina and Amstel Malta brands, premium stout under the Legend
brand, and sparkling soft drinks under the Fayrouz brand. The company operates
five breweries in Lagos, Aba, Kaduna, Ibadan and Ama regions in Nigeria, as well
as a malting plant in Aba region providing a geographical spread across the
country, albeit bias for cities in the southern part of Nigeria. It classifies its sales
regions into six units namely, Lagos, Central, East, West, North, and South. The
company is headquartered in Lagos, Nigeria. Listed on the Nigerian Stock
Exchange in 1990, NB is one of the most capitalized and actively traded
companies outside the banking and insurance sectors.
(http://proshareng.com/news/download.php?item=Nigerian%20Breweries%20Plc
%)
1.10.4 Nigeria Bottling Company Plc
The Nigerian Bottling Company Plc (NBC) was incorporated in November 1951,
as a subsidiary of the A.G. Leventis Group with the franchise to bottle and sell
Coca-Cola products in Nigeria. From a humble beginning as a family business, the

30
company has grown to become a predominant bottler of non-alcoholic beverages
in Nigeria, responsible for the manufacture and sale of over 33 different Coca-
Cola brands. Other popular brands of beverage produced by the company are Eva
Water, Five Alive fruit juice and the newly introduced Burn energy drink.
Production began in 1953 at a bottling facility in Ebute-Metta, Lagos. The
company presently has 13 bottling facilities and over 80 distribution warehouses
located across the country. Since production started, NBC Plc has remained the
largest bottler of non-alcoholic beverages in the country in terms of sales volume,
with about 1.8 billion bottles sold per year, making it the second largest market in
Africa. Today, the company is part of the Coca-Cola Hellenic Bottling company
(CCHBC), one of Coca-Cola Company’s largest anchor bottlers worldwide.
CCHBC operates in 28 countries, serving 540 million consumers and selling over
1.3 billion unit cases of beverage annually.
31
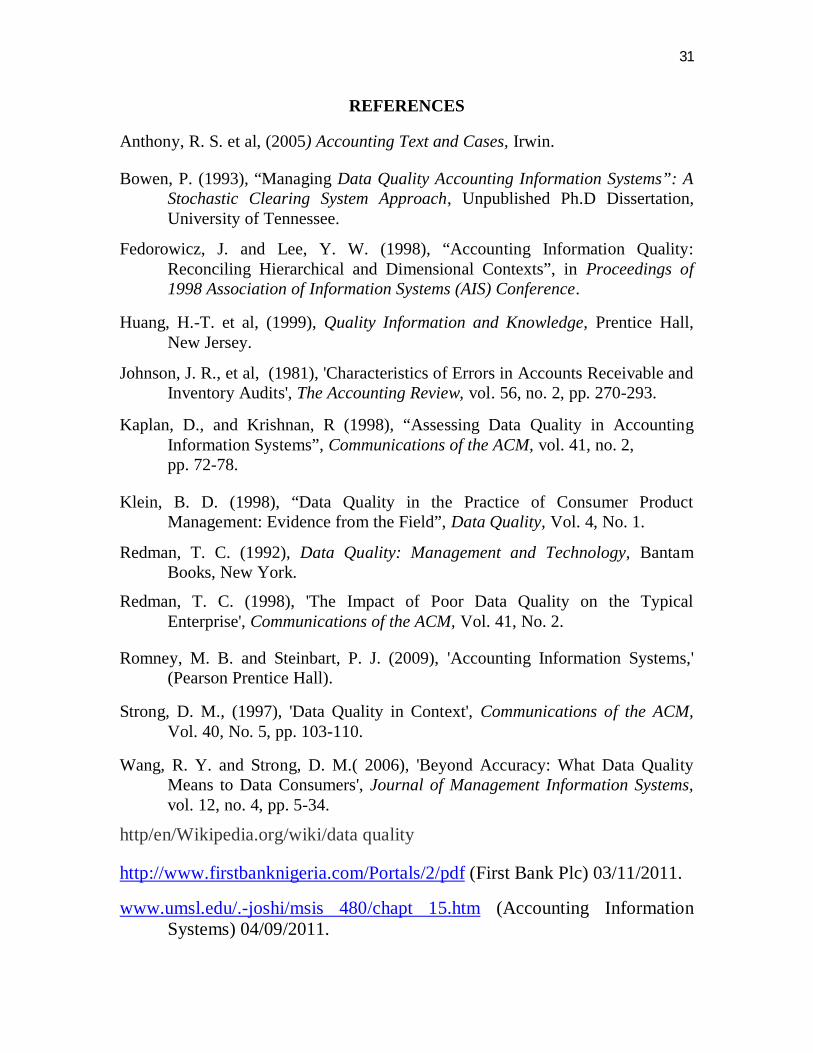
REFERENCES
Anthony, R. S. et al, (2005) Accounting Text and Cases, Irwin.
Bowen, P. (1993), “Managing Data Quality Accounting Information Systems”: A Stochastic Clearing System Approach, Unpublished Ph.D Dissertation, University of Tennessee.
Fedorowicz, J. and Lee, Y. W. (1998), “Accounting Information Quality: Reconciling Hierarchical and Dimensional Contexts”, in Proceedings of 1998 Association of Information Systems (AIS) Conference.
Huang, H.-T. et al, (1999), Quality Information and Knowledge, Prentice Hall,
New Jersey.
Johnson, J. R., et al, (1981), 'Characteristics of Errors in Accounts Receivable and Inventory Audits', The Accounting Review, vol. 56, no. 2, pp. 270-293.
Kaplan, D., and Krishnan, R (1998), “Assessing Data Quality in Accounting Information Systems”, Communications of the ACM, vol. 41, no. 2,
pp. 72-78.
Klein, B. D. (1998), “Data Quality in the Practice of Consumer Product Management: Evidence from the Field”, Data Quality, Vol. 4, No. 1.
Redman, T. C. (1992), Data Quality: Management and Technology, Bantam Books, New York.
Redman, T. C. (1998), 'The Impact of Poor Data Quality on the Typical Enterprise', Communications of the ACM, Vol. 41, No. 2.
Romney, M. B. and Steinbart, P. J. (2009), 'Accounting Information Systems,' (Pearson Prentice Hall). Strong, D. M., (1997), 'Data Quality in Context', Communications of the ACM,
Vol. 40, No. 5, pp. 103-110. Wang, R. Y. and Strong, D. M.( 2006), 'Beyond Accuracy: What Data Quality
Means to Data Consumers', Journal of Management Information Systems, vol. 12, no. 4, pp. 5-34.
http/en/Wikipedia.org/wiki/data quality
http://www.firstbanknigeria.com/Portals/2/pdf (First Bank Plc) 03/11/2011.
www.umsl.edu/.-joshi/msis 480/chapt 15.htm (Accounting Information Systems) 04/09/2011.
32
CHAPTER TWO
REVIEW OF RELATED LITERATURE
2.1 INTRODUCTION
The aim of this chapter is to review the literature concerning data quality,
accounting information systems, and quality management that are relevant to the
research problem. The background theories / parent disciplines used to develop the
theoretical framework are discussed first broadly and then in a more focused way
on the research problem.
2.2 DATA QUALITY
The core term of data quality needs to be clarified from information. Information
and data are often different, for example, data is a collection of symbols which
signify real world system states and are brought together because they are
considered relevant to some purposeful activity. Information is an objective
commodity carried by symbols and relates to who produced it, why and how it
was produced and its relationship to the real world state it signifies (Shanks and
Darke 1999). Although data and information are different concepts, data quality is
often treated as the same as information quality in some literature and real-world
practice. Therefore, in this research, data quality and information quality are
synonymous.
The general definition of data quality is ‘data that is fit for use by data consumers’
(Huang et al, 1999). Many data quality dimensions have been identified.
Commonly identified data quality dimensions are:
33
Accuracy, which occurs when the recorded value is in conformity with the
actual value;
Timeliness, which occurs when the recorded value is not out of date;
Completeness, which occurs when all values for a certain variable are
recorded, and
Consistency, which occurs when the representation of the data values, is the
same in all cases.
Four other data quality dimensions have been identified (Wang and Strong 1996)
that are also widely accepted:
Intrinsic dimensions define the quality of data in its own right;
Contextual dimensions define data quality within the context of the task at
hand;
Accessibility dimensions emphasize the role of information systems in
providing data, and;
Representational dimensions define data quality in terms of the
presentation and delivery of data.
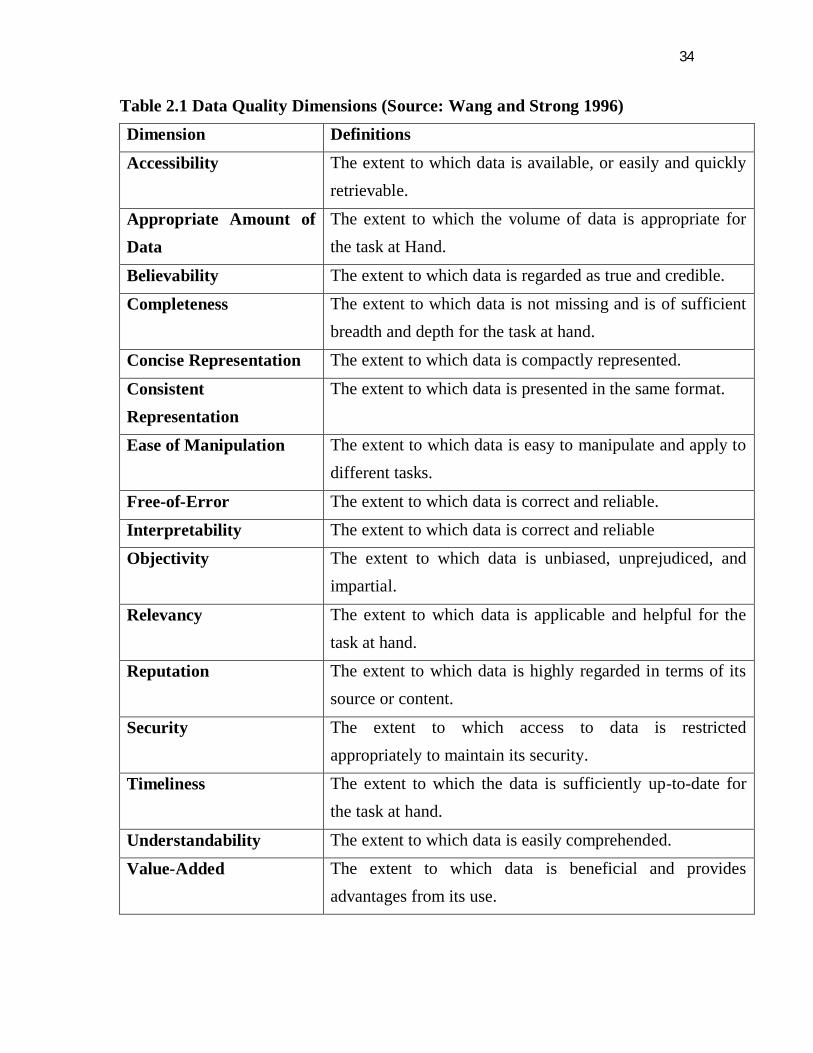
A set of comprehensive essential dimensions of data quality for delivering high
quality data has been determined as follows:
34
Table 2.1 Data Quality Dimensions (Source: Wang and Strong 1996) Dimension Definitions
Accessibility The extent to which data is available, or easily and quickly retrievable.
Appropriate Amount of Data
The extent to which the volume of data is appropriate for the task at Hand.
Believability The extent to which data is regarded as true and credible.
Completeness The extent to which data is not missing and is of sufficient breadth and depth for the task at hand.
Concise Representation The extent to which data is compactly represented.
Consistent Representation
The extent to which data is presented in the same format.
Ease of Manipulation The extent to which data is easy to manipulate and apply to different tasks.
Free-of-Error The extent to which data is correct and reliable.
Interpretability The extent to which data is correct and reliable
Objectivity The extent to which data is unbiased, unprejudiced, and impartial.
Relevancy The extent to which data is applicable and helpful for the task at hand.
Reputation The extent to which data is highly regarded in terms of its source or content.
Security The extent to which access to data is restricted appropriately to maintain its security.
Timeliness The extent to which the data is sufficiently up-to-date for the task at hand.
Understandability The extent to which data is easily comprehended.
Value-Added The extent to which data is beneficial and provides advantages from its use.
35
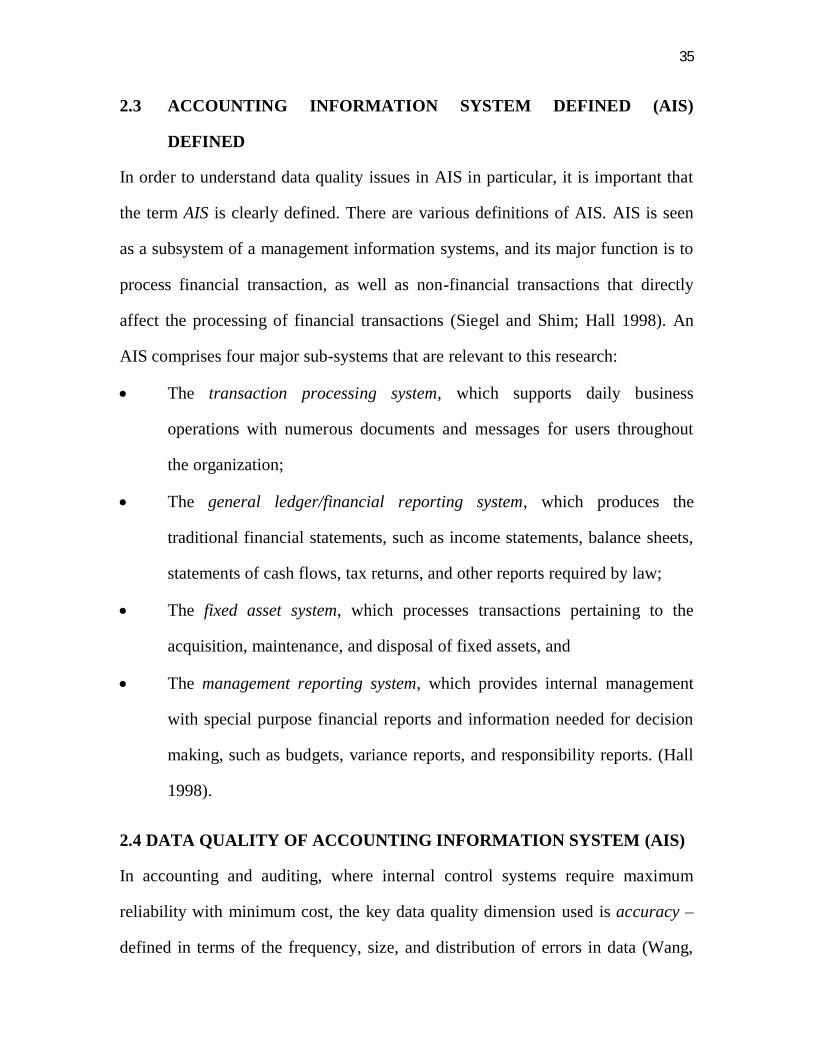
2.3 ACCOUNTING INFORMATION SYSTEM DEFINED (AIS)
DEFINED
In order to understand data quality issues in AIS in particular, it is important that
the term AIS is clearly defined. There are various definitions of AIS. AIS is seen
as a subsystem of a management information systems, and its major function is to
process financial transaction, as well as non-financial transactions that directly
affect the processing of financial transactions (Siegel and Shim; Hall 1998). An
AIS comprises four major sub-systems that are relevant to this research:
The transaction processing system, which supports daily business
operations with numerous documents and messages for users throughout
the organization;
The general ledger/financial reporting system, which produces the
traditional financial statements, such as income statements, balance sheets,
statements of cash flows, tax returns, and other reports required by law;
The fixed asset system, which processes transactions pertaining to the
acquisition, maintenance, and disposal of fixed assets, and
The management reporting system, which provides internal management
with special purpose financial reports and information needed for decision
making, such as budgets, variance reports, and responsibility reports. (Hall
1998).
2.4 DATA QUALITY OF ACCOUNTING INFORMATION SYSTEM (AIS)
In accounting and auditing, where internal control systems require maximum
reliability with minimum cost, the key data quality dimension used is accuracy –
defined in terms of the frequency, size, and distribution of errors in data (Wang,
36
Storey and Firth 1995). In assessing the value of accounting information,
researchers have also identified relevance and timeliness as desirable attributes.
The emphasis of accounting information systems literature on data quality is on
internal control systems and audits. Accounting professionals have been concerned
with data quality measurement for some time (Wang et al. 1995).The global
business environment is changing and creating new strategic management
challenges, as well as accounting information management challenges. The United
States Government Accounting Office (GAO) defines information management
as: Strategic information is one critical, integrated part of any general management
framework. Similar to the way modern organizations have gradually become
dependent on information technologies, it has become an indispensable lens
through which to view most vital general management decisions. Strategic
information management typically involves defining a mission based on customer
segments and needs, establishing core processes that accomplish the mission;
understanding the key decisions that guide mission delivery processes; supporting
those decisions with the right information available to the right people at the right
time; and using technology to collect, process, and disseminate information in
ways that improve the delivery of products, goods, and services to customers (The
United States Government Accounting office).
A very early attempt at AIS data quality measurement was a statistical approach to
measure errors in outputs of internal control systems. Another mathematical model
of the accounting internal control system and measures of reliability and cost was
developed by Cushin. Later researchers moved on to address data quality as it
37
relates to audit populations (Johnson, Leitch and Neter 1981; Groomer and Murthy
1989). Others presented models of the internal control process that responded to
guidelines and regulations calling for auditors to evaluate management’s effort to
assure that accounting data was correct (Hamlen 1980; Stratton1981; Fields, Sami
and Sumners 1986). Some AIS research extended the models developed in the
accounting literature, and analyzed cost/quality control trade-offs for information
systems, and furthermore extended to spreadsheet models (Ballou and Pazer 1985,
Ballou, Belardo and Klein 1987). A model of internal control from a survey of
audit data was developed by Nichols (1987). Some researchers have presented a
review of information systems research as it applied to accounting and auditing.
Others have developed a methodology which provides management with a
quantitative measure for determining the quality of data in information systems
(Paradice and Fuerst 1991). Researchers have also used a decision support systems
approach-combining human judgment and model-based procedures. This allows
auditor-determined variability in establishing quality thresholds to assessing data
quality in AIS (Kaplan et al 1998).
The management accountants within AIS were viewed as involving the design and
operation of financial advisory and information systems in organizational settings.
Three factors influence quality of management accounting:
Compliance, which focuses on the design and operation of systems
concerned with technical compliance with external regulations and
reporting requirement.
38
Control, which is the systems to support resource management and control
including standard costing and variance analysis, flexible budgeting,
responsibility accounting and accounting performance measures; and
Competitive support, which is the provision of financial services to the
management team in order to enhance the firm’s competitiveness. The
accounting function is seen as one of producing financial services, which
add value, and the management team is seen as a consumer of those
services.
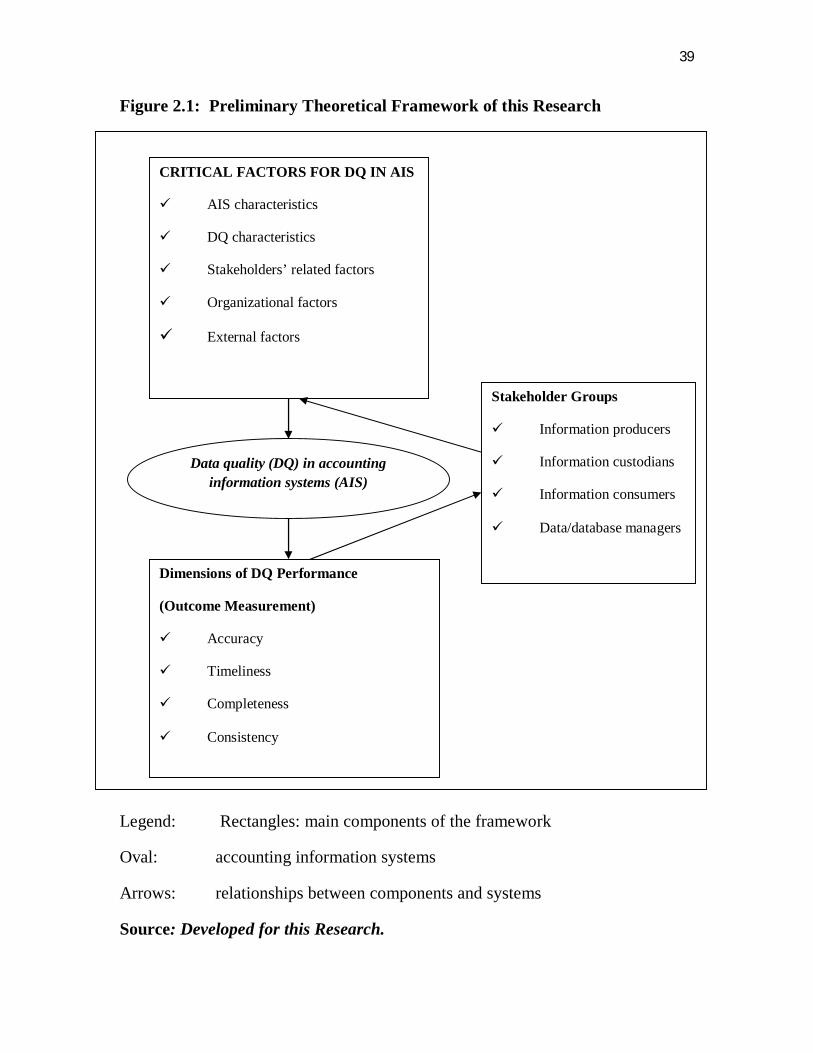
2.4.1 What is Data Quality in AIS for this Research?
The dimensions that have been identified by Ballou et al (1993) will be adopted in
this research because they cover the most important dimensions that have been
addressed in the AIS literature and have been reasonably widely accepted in the
data quality field. Therefore, quality data in AIS in this research means accurate,
timely, complete, and consistent data.
39
Figure 2.1: Preliminary Theoretical Framework of this Research
Legend: Rectangles: main components of the framework
Oval: accounting information systems
Arrows: relationships between components and systems
Source: Developed for this Research.
CRITICAL FACTORS FOR DQ IN AIS
AIS characteristics
DQ characteristics
Stakeholders’ related factors
Organizational factors
External factors
Dimensions of DQ Performance
(Outcome Measurement)
Accuracy
Timeliness
Completeness
Consistency
Stakeholder Groups
Information producers
Information custodians
Information consumers
Data/database managers
Data quality (DQ) in accounting information systems (AIS)
40
There are some similarities between quality data manufacturing and quality
product manufacturing. For instance, both quality data and quality product need to
conform to specification, lower defect rates and improved customer satisfaction
(Wang, Kon and Madnick, 1993). Therefore, quality management concepts in
general and CSFs developed for quality management could aid the development of
the theoretical framework of this research. The discussion in this section is about
quality management that is the first parent discipline, while data quality
management in particular as the second parent discipline will be covered in the
next section.
2.5 QUALITY MANAGEMENT
Quality management in general has been a major concern of businesses and
research for many years, and is managed by using quality measurements,
reliability engineering, and statistical quality control (Crosby, 1979; Garvin,
1988). Many attempts have been made to define quality. One of the fundamental
definitions for quality is ‘fitness for use’ that includes quality of design, quality of
conformance, abilities, and field service (Juran, 1979). Some focus on the cultural
and behavioral aspects of quality, such as, Crosby (Crosby, 1979) identified major
steps to achieve quality improvement, which consist of management commitment,
quality measurement, cost of quality evaluation, quality awareness, and
commitment to the ‘zero defects’ performance standard. Deming states that ‘A
product or a service possesses quality if it helps somebody and enjoys a good and
sustainable market’ (Deming, 1993). His philosophy focuses on bringing about
improvements in product and service quality by reducing uncertainty and
variability in the design and manufacturing process (Evans and Lindsay, 1996).
41
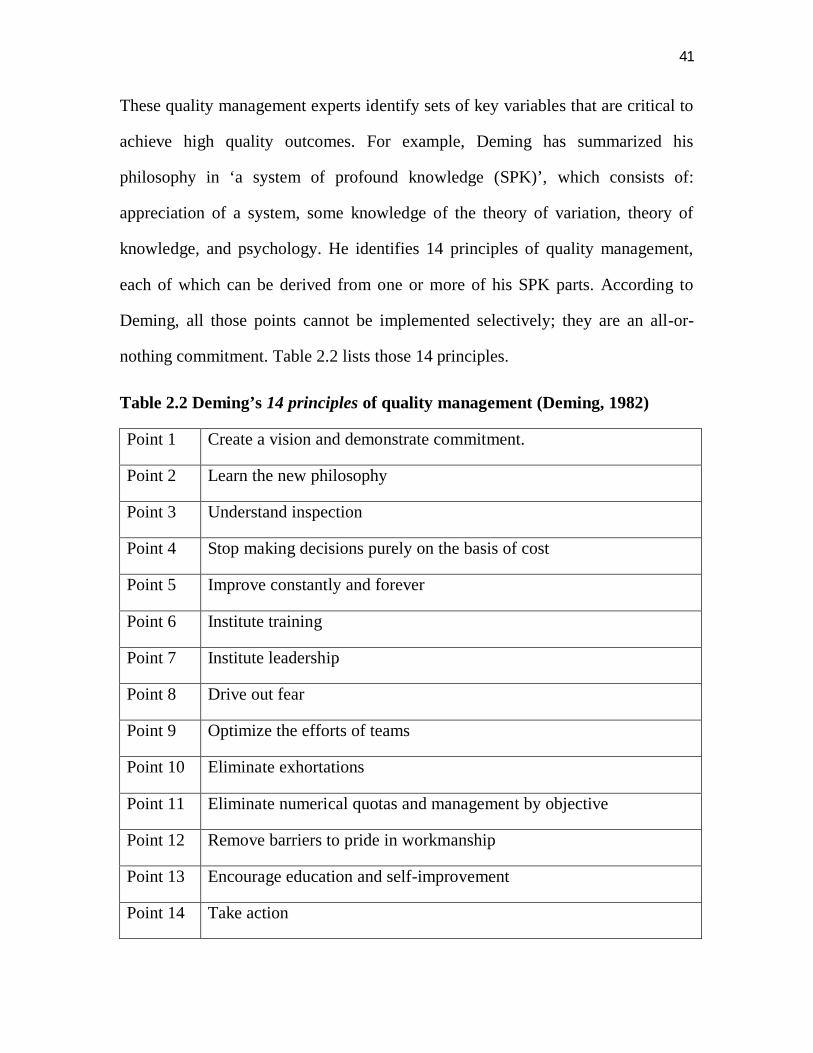
These quality management experts identify sets of key variables that are critical to
achieve high quality outcomes. For example, Deming has summarized his
philosophy in ‘a system of profound knowledge (SPK)’, which consists of:
appreciation of a system, some knowledge of the theory of variation, theory of
knowledge, and psychology. He identifies 14 principles of quality management,
each of which can be derived from one or more of his SPK parts. According to
Deming, all those points cannot be implemented selectively; they are an all-or-
nothing commitment. Table 2.2 lists those 14 principles.
Table 2.2 Deming’s 14 principles of quality management (Deming, 1982)
Point 1 Create a vision and demonstrate commitment.
Point 2 Learn the new philosophy
Point 3 Understand inspection
Point 4 Stop making decisions purely on the basis of cost
Point 5 Improve constantly and forever
Point 6 Institute training
Point 7 Institute leadership
Point 8 Drive out fear
Point 9 Optimize the efforts of teams
Point 10 Eliminate exhortations
Point 11 Eliminate numerical quotas and management by objective
Point 12 Remove barriers to pride in workmanship
Point 13 Encourage education and self-improvement
Point 14 Take action
42
In comparing quality philosophies (i.e. Deming, Juran, and Crosby), it is clear that
quality is viewed as crucial for organizations to obtain competitive advantages,
and it requires a total commitment from everyone in the organization.
The philosophies of Deming, Juran, and Crosby provide fundamental principles on
which quality management, and total quality is based. However, those principles
are only proposed by the experts without rigorous supporting evidence. Therefore,
sometimes, they might not be able to provide sufficient specificity for real-world
organizations’ initiation of quality improvements and quality performance
evaluation (Motwani, 2001). There are also practical frameworks of quality
awards, such as the Malcolm Baldrige National Quality Award, the Deming Prize
and the European Quality Award. Together with experts’ philosophies they
comprise the principal theories, concepts and frameworks that direct real-world
quality management practice.
Research in quality management has evolved from the analysis of specific success
cases to scientific theory building. For example, in the early seventies, a scientific
theory building model was formulated by Wallace (1971), which involves
observation, empirical generalization, turning empirical generalizations into
theories, hypothesis generation and testing and logical deduction. More recent
quality management empirical studies focus on hypothesis generation and testing
(Flynn, Schoeder and Sakakibara, 1994; Black and Porter, 1996; Ahire, Golhar
and Waller, 1996) and logical deduction (Anderson et al., 1995; Rungtusanatham
et al., 1998). The next section details the major studies into the development of
constructs of critical success factors for quality management.
43
2.5.1 Quality Management: Just-In-Time
In comparison to TQM, in the field of Just-in-Time (JIT), a survey was carried out
(Zhu and Meredith 1995) of published articles on JIT inventory control strategies
to study the critical factors affecting JIT applications. They provided a list of JIT
implementation elements. Among those elements those that were related to quality
where: quality circle, cross-training, JIT education, relationship with suppliers,
communication, JIT team, quality certificate of suppliers, top management
commitment and co-worker relations.
Procedures / Processes Improvement and Training
In order to stay competitive in their respective industries, many organizations are
pursuing quality improvement operational strategies. However, they often only
focus on improving products and services for their customers, not the
improvement of the procedures for the production and distribution of their
products and services
(McCahon, Ryes and Ward, 1996). The International Quality Study showed that
approximately 80 per cent of Nigerian businesses did not focus on process
improvement compared to 50 per cent of Japanese firms (1991). The study further
defined process improvement as the practice of continuously reviewing, analyzing,
incorporating changing consumer expectations and refining the process so that
products and services continuously improve. In addition, the study suggested that
organizations should invest more in process improvement, and therefore, needed
to realign employee training to meet this need.
44
Training is critical for organizations’ quality improvement efforts to achieve their
goals. The challenge for organizations that are already aware of quality
improvement lies in their unfamiliarity with the amount of training and education
required to support the implementation of effective quality improvement strategies
(Johnson, 1993). Because lack of appropriate training has led to negative
outcomes or not being able to achieve the proposed objectives, some organizations
have failed their quality initiatives (Revelle, 1993). Therefore, proper investment
in the workforce – education and training - is crucial in ensuring the success of the
implementation of quality strategies (Aguayo, 1990). However, many quality
initiatives have failed, in spite of the large amount of resources spent on training
(Chang, 1993), because many obstacles impeded the effectiveness of training:
improper needs assessment, unskilled trainers and poor training techniques.
Organizations have often rushed into training programs without thoughtful needs
assessments (Johnson, 1993). Overly ambitious quality directors sometimes
implemented unnecessary training programs that were exercises in information
overload, dooming them to failure (Chang, 1993).
Therefore, in order to ensure positive training results, organizations need to
complete necessary phases for training: first, needs assessment; second,
development; and third evaluation. There has been research into the evaluation of
the effectiveness of different training techniques in meeting different training
objectives. Although results from these studies were slightly different, they all
highlight the important role that training performs in the quality management
process.
45
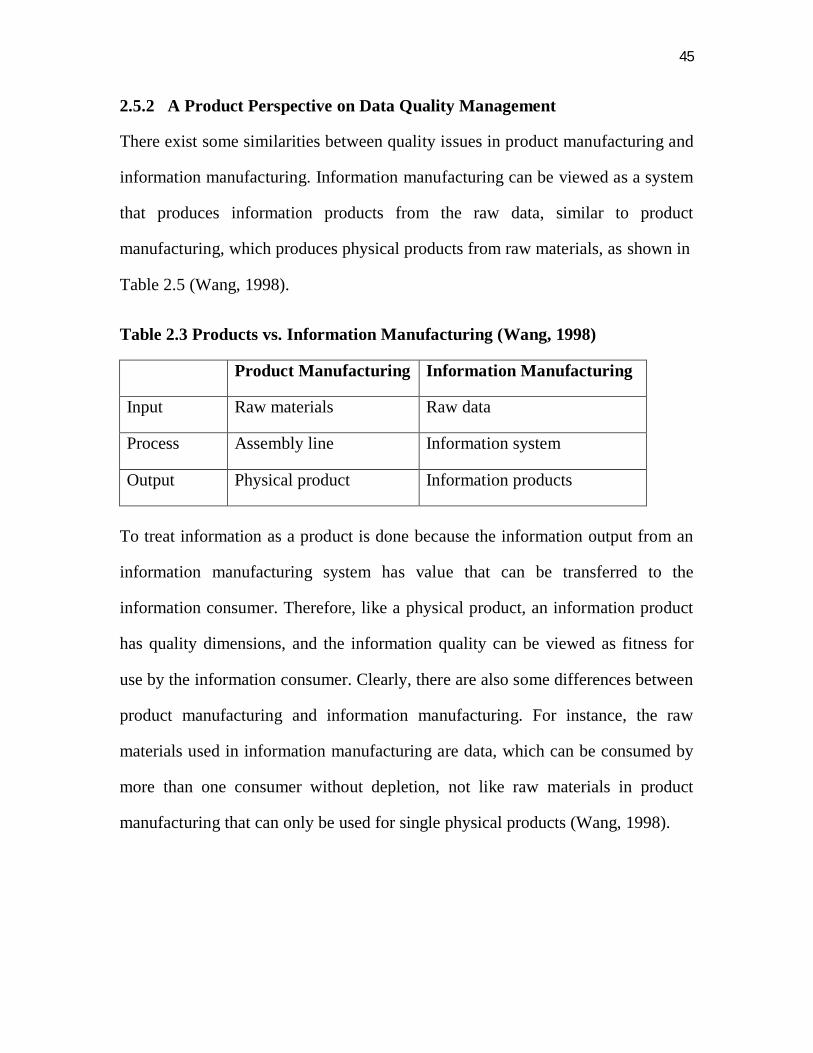
2.5.2 A Product Perspective on Data Quality Management
There exist some similarities between quality issues in product manufacturing and
information manufacturing. Information manufacturing can be viewed as a system
that produces information products from the raw data, similar to product
manufacturing, which produces physical products from raw materials, as shown in
Table 2.5 (Wang, 1998).
Table 2.3 Products vs. Information Manufacturing (Wang, 1998)
Product Manufacturing Information Manufacturing
Input Raw materials Raw data
Process Assembly line Information system
Output Physical product Information products
To treat information as a product is done because the information output from an
information manufacturing system has value that can be transferred to the
information consumer. Therefore, like a physical product, an information product
has quality dimensions, and the information quality can be viewed as fitness for
use by the information consumer. Clearly, there are also some differences between
product manufacturing and information manufacturing. For instance, the raw
materials used in information manufacturing are data, which can be consumed by
more than one consumer without depletion, not like raw materials in product
manufacturing that can only be used for single physical products (Wang, 1998).
46
In the semantic data modeling area, research suggests capturing more meaning
about application data. Semantics in data models have various dimensions and
categories, such as the quality and context of data that have significant
implications for users in the business community (Madnick, 1992). Data of poor
quality and mismatched context may lead to erroneous decisions. Therefore,
capturing data quality and context semantics at an early stage of database design is
a critical issue for both database researchers and practitioners (Tu and Wang,
1993).
Several research efforts have addressed the issue of explicitly representing quality
information, such as attribute-based research to facilitate cell-level tagging of data
to enable consumers to retrieve data that conforms to their quality requirements
(Wang and Madnick, 1990; Wang, Kon and Madnick, 1993a; Wang, Reddy and
Kon, 1993).
2.5.3 Product Quality and Service Quality
Information should be treated as both a product and a service. The literature draws
distinctions between product quality and service quality of information (Zeithaml,
Berry and Parasuraman, 1990). Product quality includes product features that
involve the tangible measures of information quality, such as accuracy,
completeness, and freedom from errors. Service quality includes dimensions
related to the service delivery process, and intangible measures such as ease of
manipulation, security, and added value of the information to consumers (Kahn,
Strong and Wang, 2002).
47
2.5.4 Data Quality in Database Systems
In a conventional database management system (DBMS), the quality of data has
been treated implicitly through functions such as recovery, concurrency, integrity,
and security control. However, from the data consumer’s perspective, those
functions are not sufficient to ensure the quality of data in the database (Wang,
Kon and Madnick, 1993b). For example, although there are some essential built-in
functions for ensuring data quality in a database like integrity constraints and
validity checks, they are often not sufficient to win consumers’ confidence on data
(Maxwell, 1989). In fact, data is used by a range of different organizational
functions with different perceptions of what constitutes quality data, and therefore
it is difficult to meet all data consumers’ quality requirements. Thus, data quality
needs to be calibrated in a manner that enables consumers to use their own
yardsticks to measure the quality (Wang, Reddy and Gupta, 1993).
In database design, although the primary focus is not on data quality itself, there
are many tools that have been developed for the purpose of data quality
management. For example, it is recommended to build integrity constraints and
use normalization theory to prevent data incompleteness and inconsistencies, as
well as through transaction management to prevent data corruption. However,
those tools are only related to system design and control. Although they can help
for making sure of the quality of data in the system, by themselves they are not
sufficient to solve the issue of imperfect data in the real world.
Data quality is affected by other factors rather than only by the system, such as
whether it reflects real world conditions, and can be easily used and understood by
the data user. If the data is not interpretable and accessible by the user, even
48
accurate data is of little value. Therefore, a methodology for designing and
representing corporate data models is needed. The use of scenarios, subject areas
and design rationale was found to be effective in enhancing understanding of
corporate data models (Shanks and Darke, 1999).
2.6 CRITICAL SUCCESS FACTORS FOR QUALITY MANAGEMENT
AND TQM.
Research into quality management and TQM has identified many critical success
factors that affect an organization’s position. Many of those studies were based on
the principles of quality experts including Deming, Juran, Feigenbaum
(Feigenbaum, 1991), and Crosby, as well as the practical frameworks like the
Baldrige Award criteria. In addition, the Ernst and Young and American Quality
Foundation (1992) study reviewed the quality management practices in the USA
and the other major economies of the world. The study found that not all methods
are equally beneficial to all organizations. Instead, it found that the level of quality
performance should be used to define practices.
In order to evaluate quality management implementation status, valid instruments
for measurement are important. A questionnaire to measure management policies
related to total quality management has been developed by Saraph, Benson, and
Schroeder (1989). Their research identifies eight critical factors of quality
management in business enterprises, which include:
• Role of divisional top management and quality policy;
• Role of the quality management;
• Training;
• Product/ service design;
49
• Supplier quality management;
• Process management /operating;
• Quality data and reporting and
• Employee relations.
CSFs for quality management identified by Saraph et al (1989) have been tested
by other researchers, and the results have confirmed the reliability and construct
validity of the instrument (Badri, Davis and Davis1995). Those eight factors have
been widely accepted in the TQM field. Other researchers of TQM study critical
success factors have used different methodologies (Porter and Parker 1993;
Tamimi and Gershon 1995; Ahire, Golhar and Waller 1996). Different sets of
factors have been found by other researchers (Black and Porter 1996; Ramirez and
Loney 1993). Furthermore, there is also research concerning the critical success
factors for implementation of TQM in small and medium enterprises (Yusof and
Aspinwall 1999).
For example, there is a 10-dimensional 32-item instrument of critical factors of
quality management developed by Black and Porter (1996) based on the Malcolm
Baldrige National Quality Award (MBNQA) of the USA. The 10 dimensions
included:
• People and customer management;
• Supplier partnerships;
• Communication of improvement information;
• Customer satisfaction orientation;
• External interface management;
• Strategic quality management;
50
• Teamwork structures for improvement;
• Operational quality planning;
• Quality improvement measurement systems; and
• Corporate quality culture.
This instrument was further tested by a recent cross-sectional study of quality–
oriented companies in Hong Kong (Lai, Weerakoon and Cheng, 2002). The study
surveyed companies of four types of industries: manufacturing, service,
construction and public utility. The results showed that although the companies in
all the industry types view quality management as an integrated approach, giving
generally equal importance to all aspects of quality management implementation,
those companies in the public utility and service industries appear to have a higher
level of quality management. Furthermore, among the quality management
implementation factors, the companies in service and construction industries were
perceived to be relatively weak in the factors of teamwork structures for
improvement, and those in the manufacturing industry put less effort into the
communication of improvement information.
A recent study by Motwani (2001) provided a comparative analysis of the
empirical studies of critical factors of TQM (Table 2.3), which found that
validated scales for integrated TQM developed by the empirical studies
complement one another. Furthermore, those empirical studies had higher validity
and were more comprehensive than the non-empirical TQM studies; and also
‘incorporated most of the TQM implementation constructs’ as proposed by quality
management experts (Motwani, 2001). By grouping the similar constructs from
51
those studies, seven factors could be identified, which contributed to an integrated
TQM:
• Top management commitments;
• Quality measurement and benchmarking;
• Process management;
• Employee training and empowerment;
• Suppler quality management; and
• Customer involvement and satisfaction. (Motwani, 2001)
2.7 TOTAL DATA QUALITY MANAGEMENT (TDQM)
To achieve a state of high data quality, an organization needs to implement Total
Data Quality Management (TDQM). Different industries with different goals and
environments can develop more specific and customized programs for data quality
management to suit their own needs. However, some researchers argue that
regardless of differences organizations must follow certain steps in order to enable
the successful implementation of a viable TDQM:
1) Clearly define what the organization means by quality in general and data
quality in particular;
2) Develop a set of measures for the important dimensions of data quality for
the organization that can be linked to the organization’s general goals and
objectives. (Avison, D. and Myers, M. D. 2002)
52
2.7.1 Data Quality in e-Business
Data quality in the context of eBusiness has some different features from the
issues in the traditional environment, because of the increasing utilization of
Internet and online transactions in the eBusiness environment. The e-Business
organization has more interactions with the environment, which adds complexities
to data quality. Therefore, it is imperative for e-Business organizations to establish
data quality strategies and implementation methodologies that suit their eBusiness
transformation approaches (Segev and Wang, 2001). While basic principles of
traditional information systems methodologies still apply, the scope and context
have changed significantly in the eBusiness environment.
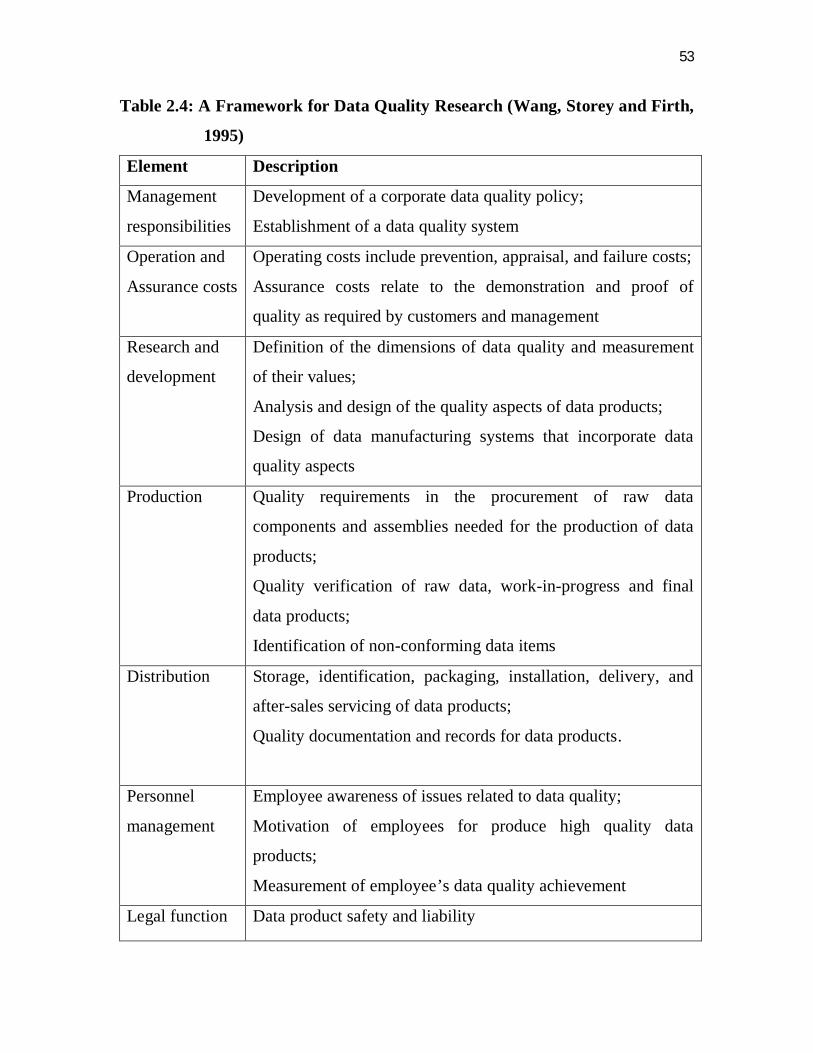
2.7.2 A Framework for Data Quality Research
To aid the understanding of data quality in theory and practice, a framework for
data quality analysis was developed by Wang, Storey and Firth (1995),.This
framework comprises seven elements: management responsibilities, operation and
assurance costs, research and development, production, distribution, personnel
management, and legal function (see Table 2.6). The framework was further
employed to analyze articles relevant to data quality research in the same study. It
covered articles from a wide range of different disciplines and across the period
from 1970 up to 1994, which provided a comprehensive review of studies in data
quality and related areas.
53
Table 2.4: A Framework for Data Quality Research (Wang, Storey and Firth,
1995)
Element Description
Management
responsibilities
Development of a corporate data quality policy;
Establishment of a data quality system
Operation and
Assurance costs
Operating costs include prevention, appraisal, and failure costs;
Assurance costs relate to the demonstration and proof of
quality as required by customers and management
Research and
development
Definition of the dimensions of data quality and measurement
of their values;
Analysis and design of the quality aspects of data products;
Design of data manufacturing systems that incorporate data
quality aspects
Production Quality requirements in the procurement of raw data
components and assemblies needed for the production of data
products;
Quality verification of raw data, work-in-progress and final
data products;
Identification of non-conforming data items
Distribution Storage, identification, packaging, installation, delivery, and
after-sales servicing of data products;
Quality documentation and records for data products.
Personnel
management
Employee awareness of issues related to data quality;
Motivation of employees for produce high quality data
products;
Measurement of employee’s data quality achievement
Legal function Data product safety and liability
54
Due to the significance of Wang et al’s (1995) study, this section discusses some
relevant components of the framework of the study. The citations of this section
are mainly from Wang et al’s (1995) article. The first important component that
needs to be addressed is management responsibilities. The importance of top
management’s commitment and involvement has been recognized by many quality
management studies as described in Section 2.3 of this chapter when discussing
the parent discipline one of this research. Similarly, the importance of top
management commitment has also been addressed by data quality studies.
However, despite the increasing awareness of the need for corporate policy for
data quality management, there is a lack of research into what constitutes the
success of data quality policies and systems. In particular, in order to convince top
management of the importance of data quality to the survival of the organization
in the dynamic global environment, research that assists management in
identifying data quality factors that affect a company’s position is needed (Wang,
Storey and Firth, 1995). The cost of data quality effort is another important area in
data quality research.
There are two different types of costs for a data quality system. They are operating
costs (prevention, appraisal and failure), and assurance costs (Wang, Storey and
Firth, 1995). In particular, information systems research has looked into
cost/quality tradeoffs of internal control for ensuring the quality output from an
information system that covers processing activities, corrective procedures, and
penalties for failing to detect errors. Furthermore, researchers have also found that
there is a need to obtain better estimates of the penalty costs of poor data quality.
However, it is very hard to quantify the cost of data errors, though it is very costly.
55
One of the critical aspects for data quality research is to identify the appropriate
dimensions and measurement methods for the quality of information. Wang et al’s
(1995) study indicates that researchers in data quality, information systems
success and user satisfaction, and accounting and auditing areas have attempted to
identify data quality dimensions. In the previous discussion, some commonly
accepted definitions of data quality have been included. Dimensions identified by
other studies are discussed in this section.
In the information systems field, information quality has been assessed from the
users’ viewpoint, such as Orlikowski, W. J. and Baroudi, J. J. 1991), which
identifies usability, reliability, independence as major information quality
dimensions. Studies in evaluating the quality and value of information systems
have identified information quality attributes like accuracy, timeliness, precision,
reliability, relevancy, completeness. In addition, research into user satisfaction and
user involvement has also identified similar attributes. Furthermore, researchers
have also looked into the measurement of data quality attributes. For example, the
reliability attribute is divided and measured by internal reliability, relative
reliability that related to fulfilling the information user’s requirements, and
absolute reliability as to how well the data represents reality. Other relevant
aspects have also been addressed, such as, the measurement of usefulness of
information, the effectiveness of the system, the quality of information systems
and the evaluation of the structure of executive information systems.
One important contribution of Wang et al’s framework is to include personnel
management as part of the data quality management, which is the area that has
been overlooked by data quality research. Not too many studies have looked into
56
human related factors that impact on data quality. Among those few attempts into
personnel issues, a framework for understanding data production that incorporates
the person environment fit and the effect of employees’ ability and motivation has
been developed (Nicolaou, A. I. 2000). This study discovered that when data
production is separated from data use, such as one worker creates data and another
uses it, data quality problems are more likely to occur. Another study, showed how
a company’s employees identified the importance of data quality improvement and
aroused top management’s awareness, which then led to further action in dealing
with the issues. The attention to data quality issues by the company’s management
and employees helped the improvement of data quality in the company’s large
MIS database.
2.7.3 Important Steps in ensuring Data Quality
In the data quality field, not much research has been conducted directly into the
investigation of critical success factors for ensuring high quality data. Only a few
researchers have attempted to identify critical success factors of data quality, for
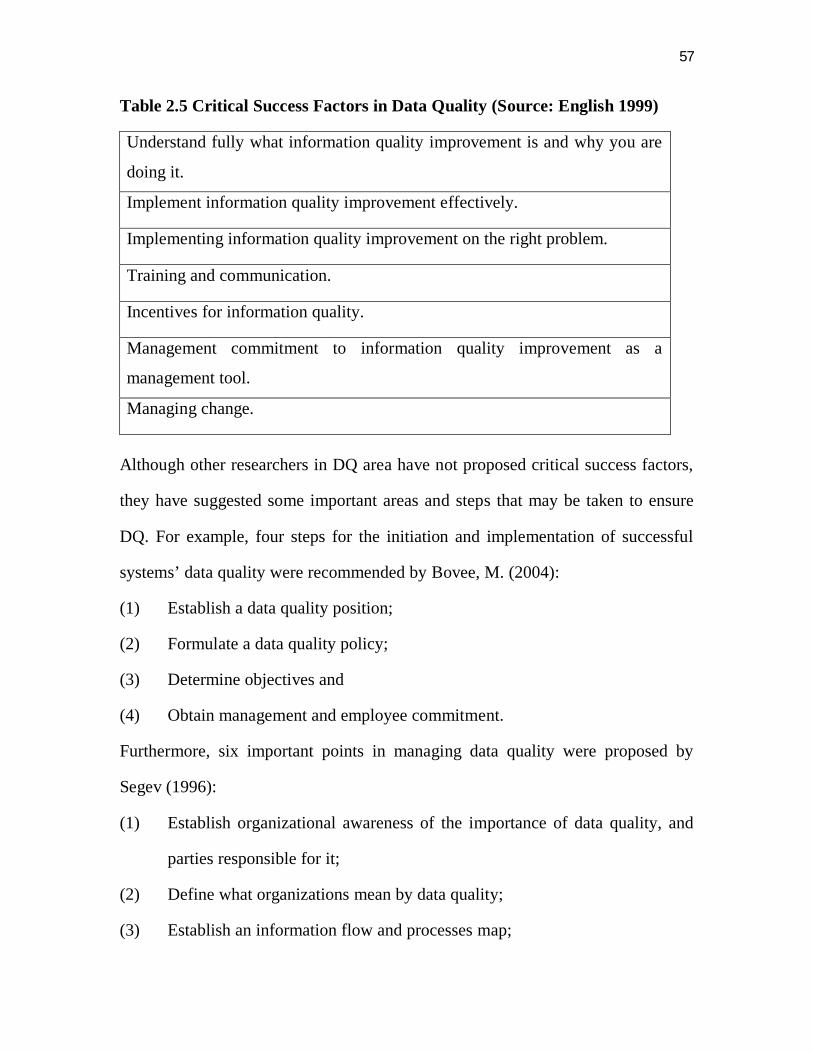
example Table 2.7 shows the seven factors suggested by English (1999).
57
Table 2.5 Critical Success Factors in Data Quality (Source: English 1999)
Understand fully what information quality improvement is and why you are
doing it.
Implement information quality improvement effectively.
Implementing information quality improvement on the right problem.
Training and communication.
Incentives for information quality.
Management commitment to information quality improvement as a
management tool.
Managing change.
Although other researchers in DQ area have not proposed critical success factors,
they have suggested some important areas and steps that may be taken to ensure
DQ. For example, four steps for the initiation and implementation of successful
systems’ data quality were recommended by Bovee, M. (2004):
(1) Establish a data quality position;
(2) Formulate a data quality policy;
(3) Determine objectives and
(4) Obtain management and employee commitment.
Furthermore, six important points in managing data quality were proposed by
Segev (1996):
(1) Establish organizational awareness of the importance of data quality, and
parties responsible for it;
(2) Define what organizations mean by data quality;
(3) Establish an information flow and processes map;
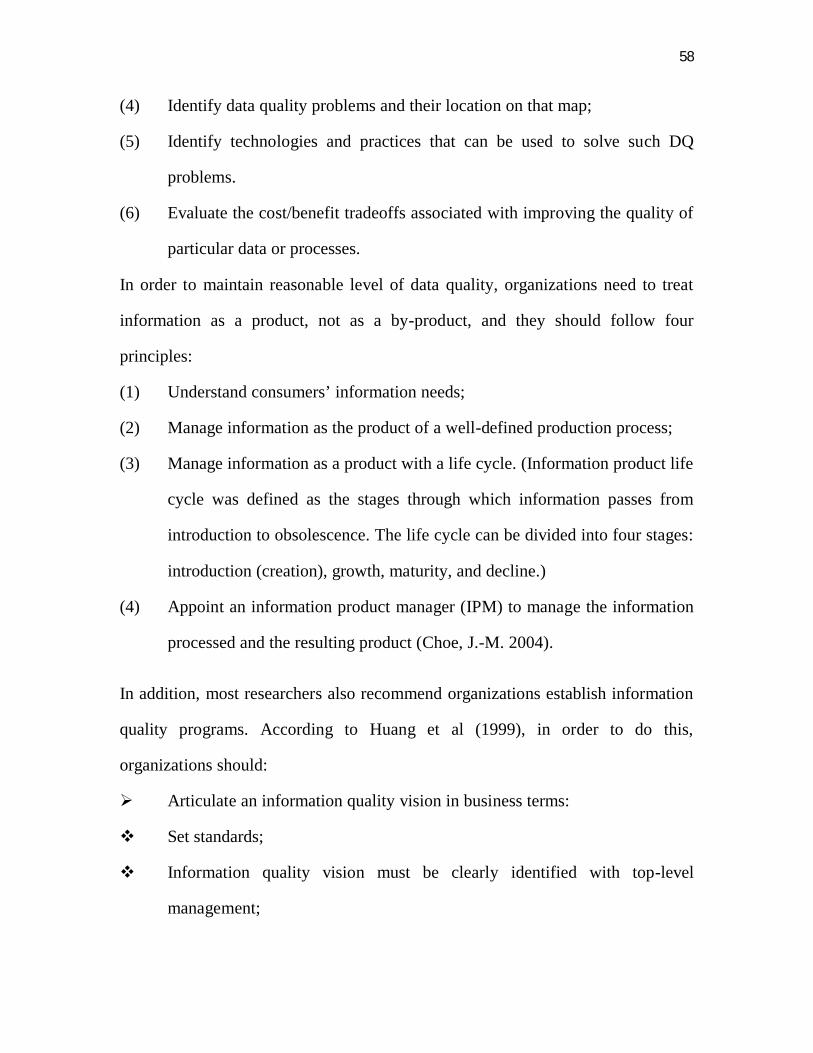
58
(4) Identify data quality problems and their location on that map;
(5) Identify technologies and practices that can be used to solve such DQ
problems.
(6) Evaluate the cost/benefit tradeoffs associated with improving the quality of
particular data or processes.
In order to maintain reasonable level of data quality, organizations need to treat
information as a product, not as a by-product, and they should follow four
principles:
(1) Understand consumers’ information needs;
(2) Manage information as the product of a well-defined production process;
(3) Manage information as a product with a life cycle. (Information product life
cycle was defined as the stages through which information passes from
introduction to obsolescence. The life cycle can be divided into four stages:
introduction (creation), growth, maturity, and decline.)
(4) Appoint an information product manager (IPM) to manage the information
processed and the resulting product (Choe, J.-M. 2004).
In addition, most researchers also recommend organizations establish information
quality programs. According to Huang et al (1999), in order to do this,
organizations should:
Articulate an information quality vision in business terms:
Set standards;
Information quality vision must be clearly identified with top-level
management;
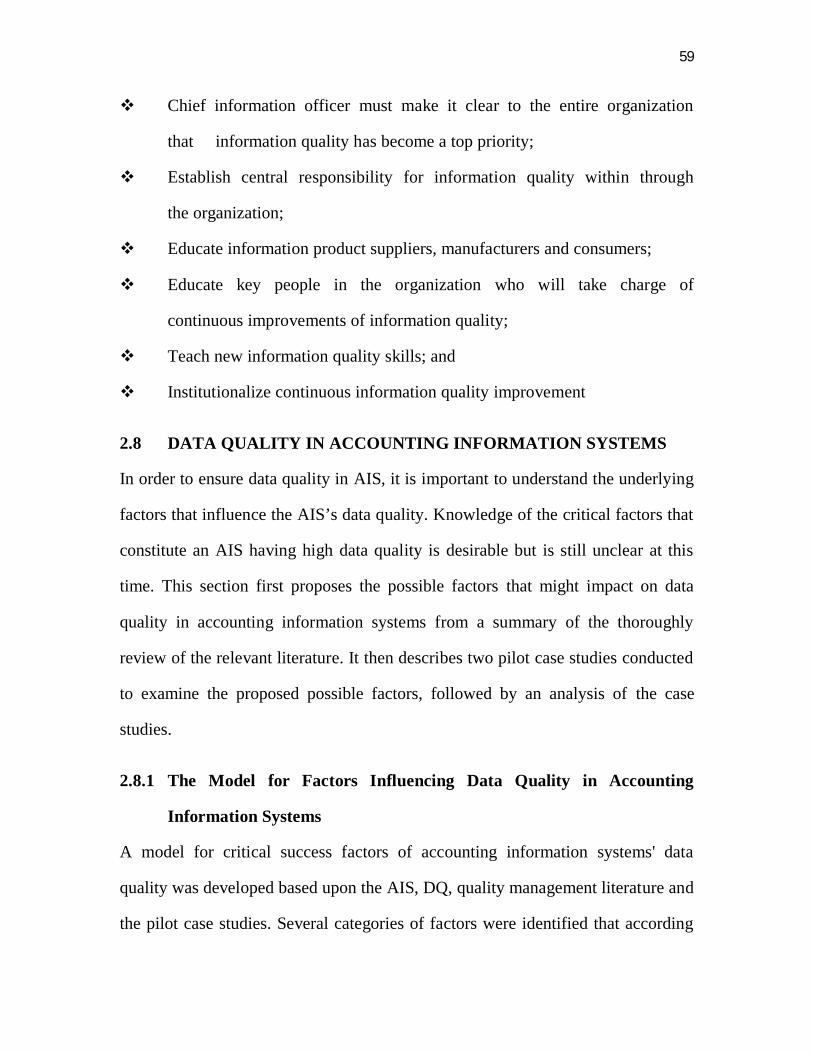
59
Chief information officer must make it clear to the entire organization
that information quality has become a top priority;
Establish central responsibility for information quality within through
the organization;
Educate information product suppliers, manufacturers and consumers;
Educate key people in the organization who will take charge of
continuous improvements of information quality;
Teach new information quality skills; and
Institutionalize continuous information quality improvement
2.8 DATA QUALITY IN ACCOUNTING INFORMATION SYSTEMS
In order to ensure data quality in AIS, it is important to understand the underlying
factors that influence the AIS’s data quality. Knowledge of the critical factors that
constitute an AIS having high data quality is desirable but is still unclear at this
time. This section first proposes the possible factors that might impact on data
quality in accounting information systems from a summary of the thoroughly
review of the relevant literature. It then describes two pilot case studies conducted
to examine the proposed possible factors, followed by an analysis of the case
studies.
2.8.1 The Model for Factors Influencing Data Quality in Accounting
Information Systems
A model for critical success factors of accounting information systems' data
quality was developed based upon the AIS, DQ, quality management literature and
the pilot case studies. Several categories of factors were identified that according
60
to the theoretical and empirical literature have the potential to influence data
quality in AIS. These categories were: AIS characteristics, DQ characteristics,
stakeholders’ related factors, organizational factors, and external factors.
The first level is the external environment that consists of external factors, the
second level is the organizational environment that consists of organizational
factors, and the third level is the accounting information systems, which has AIS
characteristics and DQ characteristics. Stakeholders of AIS could come from
within the AIS, outside the AIS but within the organization, and outside the
organization. For example, AIS could have both internal and external information
suppliers and customers. Within each of those identified categories, a list of
factors was grouped. Factors were identified by the comprehensive literature
review and the empirical pilot case studies. The relationship between factors and
categories is shown in Figure 2.4, and forms the model for factors influencing data
quality in accounting information systems.
Although there is only one factor, nature of the AIS, under the category of AIS
characteristics, this factor has many attributes, such as the number of the systems
/packages, the number of staff, what kind of the system it is, the age and maturity
of the system, and the organizational structure of the system. There are seven
factors listed under the category of DQ characteristics, those factors are all related
directly to the data quality itself. They are: appropriate DQ policies and standard
and its implementation, DQ approaches (control and improvement), Role of DQ,
Internal control, Input control, Understanding of the systems and DQ, and
Continuous improvement of DQ. As previously mentioned the stakeholders of AIS
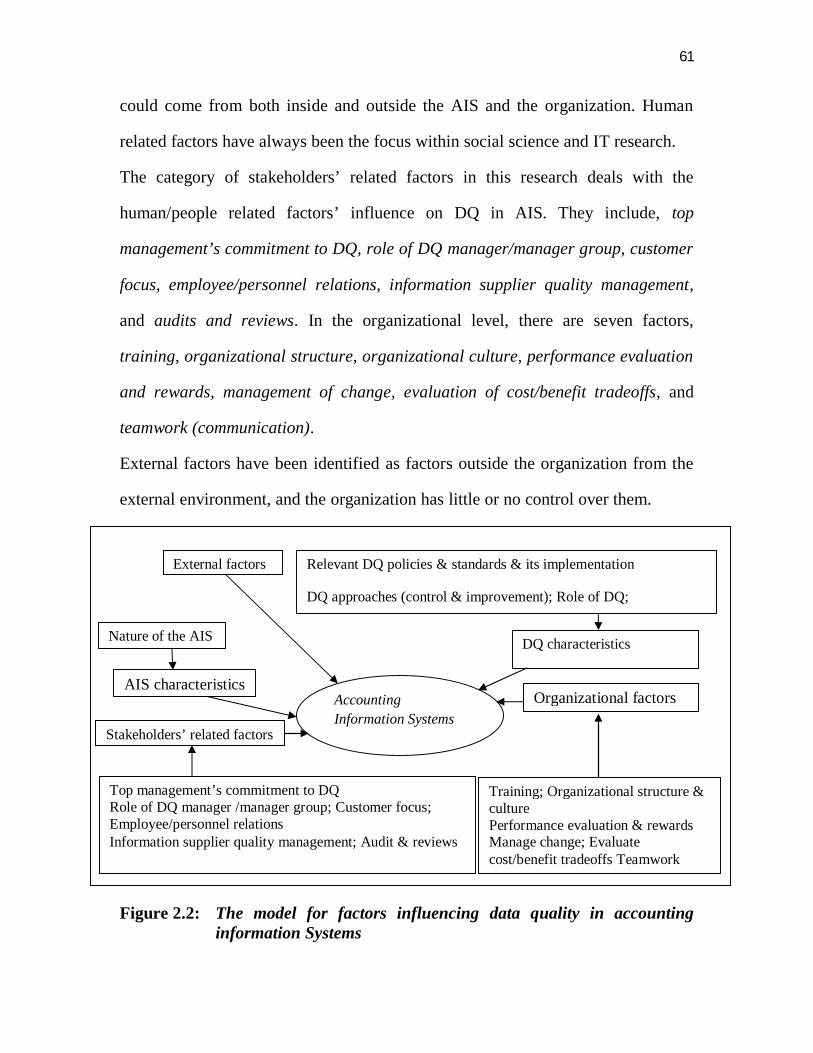
61
could come from both inside and outside the AIS and the organization. Human
related factors have always been the focus within social science and IT research.
The category of stakeholders’ related factors in this research deals with the
human/people related factors’ influence on DQ in AIS. They include, top
management’s commitment to DQ, role of DQ manager/manager group, customer
focus, employee/personnel relations, information supplier quality management,
and audits and reviews. In the organizational level, there are seven factors,
training, organizational structure, organizational culture, performance evaluation
and rewards, management of change, evaluation of cost/benefit tradeoffs, and
teamwork (communication).
External factors have been identified as factors outside the organization from the
external environment, and the organization has little or no control over them.
Figure 2.2: The model for factors influencing data quality in accounting
information Systems
External factors
Nature of the AIS
AIS characteristics
Stakeholders’ related factors
Top management’s commitment to DQ Role of DQ manager /manager group; Customer focus; Employee/personnel relations Information supplier quality management; Audit & reviews
DQ characteristics
Training; Organizational structure & culture Performance evaluation & rewards Manage change; Evaluate cost/benefit tradeoffs Teamwork
Accounting Information Systems
Relevant DQ policies & standards & its implementation
DQ approaches (control & improvement); Role of DQ;
Organizational factors
62
2.8.2 Possible factors that Impact on Data Quality in Accounting
Information Systems
Although the critical success factors for high data quality in AIS have not been
addressed, there have been many studies of critical success factors in quality
management such as Total Quality Management (TQM) and Just-In-Time (JIT)
(Davis and Davis 1995; Yusof and Aspinwall 1999). Some of the data quality
literature has addressed the critical points and steps for DQ (Segev 2001; Huang et
al 1999; English 2009). Table 2.8 indicates the related research efforts and reflects
whether these research efforts addressed certain issues or elements of critical
factors of quality or data quality management.
2.8.3 Critical Factors for Ensuring Data Quality in AIS
From comparing the ranking of the most critical factors and the ranking based on
the mean importance rating, it is clear that there were some similarities, most
critical factors were also ranked in the mean importance rating, and therefore, they
can be identified as critical success factors for data quality in AIS. The first three
are:
1) Top Management Commitment, which means top management recognize
the importance of data quality in AIS and support data quality activities;
2) Nature of Accounting Information Systems, which means to have
suitable and adequate systems / packages; and;
3) Input Controls, which means get the information right in its initial phase,
that is, input, so as to prevent input errors (“Garbage-In-Garbage-Out”). In
addition, three other factors were deemed to be critical success factors for
63
data quality in AIS, although they were not considered to be as crucial as
the first three.
They are:
4) Personnel Competency, which means the employment of well-trained,
experienced and qualified individual personnel at all levels, from top and
middle management to employees. In other words, there should be highly
skilled and knowledgeable people in both the technical and the business
areas;
5) Teamwork (Communication), which means working as a team and having
sufficient communication between different departments and within
departments, and between different professionals, such as accounting and
IT; and
6) Middle Management Commitment to Data Quality, which means the
acceptance of responsibility for data quality performance by middle
managers, and having effective procedures at middle management level.
2.9 STAKEHOLDER GROUPS FOR DQ IN AIS
In order to understand the stakeholders groups’ impact on accounting information
quality, it is essential to identify their relationships with accounting information
systems. The framework for understanding stakeholders in accounting information
systems proposed in this chapter combines the stakeholder concepts from data
quality, data warehouse, accounting information systems and quality management
areas.
64
In data quality and data warehouse fields, there are four stakeholder groups that
have been identified who are responsible for creating, maintaining, using, and
managing data. They are data producers, data custodians, data consumers, and data
managers (Strong et al, 1997; Wang, 1998; Sharks and Darke 1998). In the
accounting information systems area, auditors were recognized as fulfilling the
role of monitoring how the accounting information systems work and the quality
of the information which has been generated by the systems. Internal auditors
especially perform the internal policing and quality adviser role within the
organization.
Data quality research focuses on processing. Accounting management research
focuses on results checking and monitoring. In the quality management area the
source where raw data comes from is also addressed. In the quality management
literature, suppliers’ quality management has been highlighted as the important
aspect of the total quality management. In accounting information systems, data
suppliers also play a role in data quality management. Therefore, they are also
included in the framework.
Thus, in summary and combination of the above mentioned areas, for the purpose
of this research, the stakeholders in accounting information systems have been
identified as follows:
Information producers: create or collect information for the AIS;
Information custodians: design, develop and operate the AIS;
Information users: use the accounting information in their works;
65
Information managers: are responsible for managing the information
quality in the AIS;
Internal auditors: monitor the AIS and its data quality, check internal
controls in the AIS; and
Data suppliers: provide the unorganized raw data to the AIS
The framework components and their interrelationships are shown in Figure 2.5.
In accounting information systems, different stakeholders have different functional
roles in relation to the quality of the information. The framework relates all
stakeholders to accounting information systems on three different levels. The
lower level has only one stakeholder group - the data suppliers who provide
unorganized raw data to the AIS. It represents the input stage, which is getting raw
data into the AIS. In the middle level, there are four stakeholder groups, namely,
information producers, information custodians, information managers, and internal
auditors, who are responsible for creating and collecting the information,
designing, developing and operating the AIS, managing information, and
monitoring AIS and information respectively. This important level contains the
processing, storing, maintaining, and monitoring stages. The final and highest
level distributes the organized, useful information to the information users, and it
is the output stage.
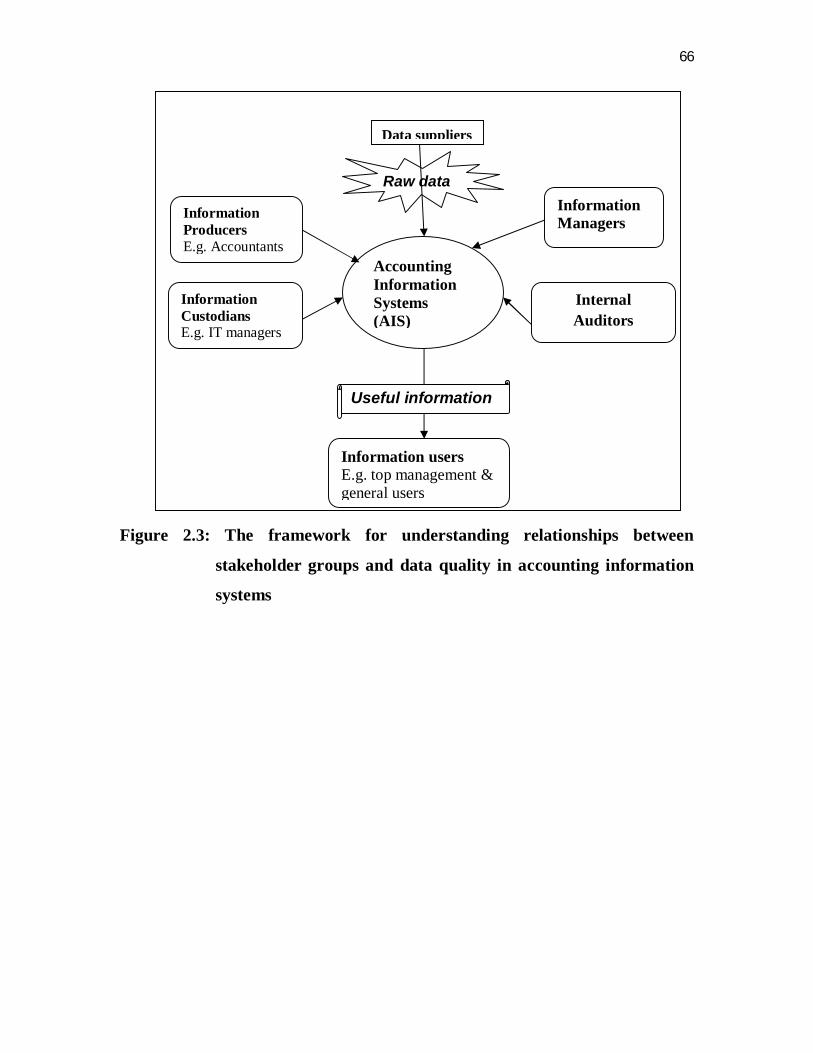
66
Figure 2.3: The framework for understanding relationships between
stakeholder groups and data quality in accounting information
systems
Data suppliers
Raw data
Information Producers E.g. Accountants
Information Custodians E.g. IT managers
Information Managers
Internal Auditors
Accounting Information Systems (AIS)
Useful information
Information users E.g. top management & general users
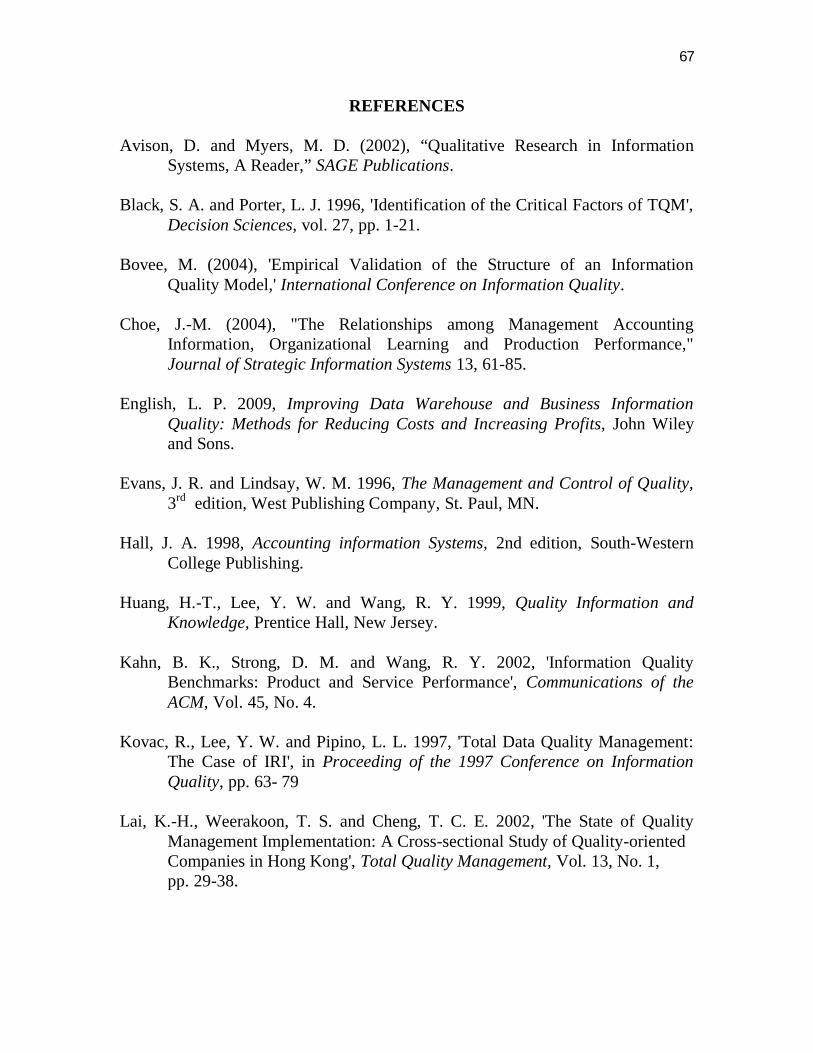
67
REFERENCES
Avison, D. and Myers, M. D. (2002), “Qualitative Research in Information Systems, A Reader,” SAGE Publications. Black, S. A. and Porter, L. J. 1996, 'Identification of the Critical Factors of TQM',
Decision Sciences, vol. 27, pp. 1-21. Bovee, M. (2004), 'Empirical Validation of the Structure of an Information Quality Model,' International Conference on Information Quality. Choe, J.-M. (2004), "The Relationships among Management Accounting Information, Organizational Learning and Production Performance," Journal of Strategic Information Systems 13, 61-85. English, L. P. 2009, Improving Data Warehouse and Business Information Quality: Methods for Reducing Costs and Increasing Profits, John Wiley and Sons. Evans, J. R. and Lindsay, W. M. 1996, The Management and Control of Quality,
3rd edition, West Publishing Company, St. Paul, MN. Hall, J. A. 1998, Accounting information Systems, 2nd edition, South-Western
College Publishing. Huang, H.-T., Lee, Y. W. and Wang, R. Y. 1999, Quality Information and
Knowledge, Prentice Hall, New Jersey. Kahn, B. K., Strong, D. M. and Wang, R. Y. 2002, 'Information Quality
Benchmarks: Product and Service Performance', Communications of the ACM, Vol. 45, No. 4.
Kovac, R., Lee, Y. W. and Pipino, L. L. 1997, 'Total Data Quality Management:
The Case of IRI', in Proceeding of the 1997 Conference on Information Quality, pp. 63- 79
Lai, K.-H., Weerakoon, T. S. and Cheng, T. C. E. 2002, 'The State of Quality
Management Implementation: A Cross-sectional Study of Quality-oriented Companies in Hong Kong', Total Quality Management, Vol. 13, No. 1, pp. 29-38.
68
Management Accounting and Integrated Information Systems: A Literature Review, International Journal of Accounting Information Systems 8, 40-68. Motwani, J. 2001, 'Measuring Critical Factors of TQM', Measuring Business
Excellence, Vol. 5, No. 2, pp. 27-30.
Nicolaou, A. I. (2000). "A Contingency Model of Perceived Effectiveness in Accounting Information Systems Organizational Coordination and Control Effects," International Journal of Accounting Information Systems 1, 91-105. Orlikowski, W. J. and Baroudi, J. J. (1991), "Studying Information Technology in Organizations: Research Approaches and Assumptions," Information Systems Research 2, 1-28. Segev, A. and Wang, R. 2001, 'Data Quality Challenges in Enabling eBusiness Transformation', in Proceedings of the Sixth International Conference on Information Quality, pp. 77-82. Shanks, G. and Darke, P. 1998, 'Understanding Data Quality in Data Warehousing: A Semiotic Approach', in Proceeding of the 1998 Conference on Information Quality, Boston, Massachusetts. Strong, D. M., Lee, Y. W. and Wang, R. Y. 1997, 'Data Quality in Context',
Communications of the ACM, Vol. 40, No. 5, pp. 103-110. Wang, R. Y., Storey, V. C. and Firth, C. P. 1995, 'A Framework for Analysis of Data Quality Research', IEEE Transactions on Knowledge and Data Engineering, Vol. 7, No. 4, pp. 623-639. Wang, R. Y. and Strong, D. M. 2006, 'Beyond Accuracy: What Data Quality
Means to Data Consumers', Journal of Management Information Systems, Vol. 12, No. 4, pp. 5-34.
Yusof, S. M. and Aspinwall, E. 1999, 'Critical Success Factors for Total Quality
Management Implementation in Small and Medium Enterprises', Total Quality Management, p. 803.
69
CHAPTER THREE
RESEARCH METHODOLOGY
3.1 INTRODUCTION
This chapter describes the steps, tool and techniques used in carrying out this
study deriving from the theoretical empirical literature of previous chapters. This
chapter, first of all builds a framework which will permit the analysis of the
linkages between the variables. Therefore the chapter further throws light on the
research design, source of data, method of data collection and population of the
study. Other issues that it will examined are sample size determination, sampling
techniques, validity and reliability of the instrument, statistical tools for data
analysis.
3.2 RESEARCH DESIGN
In the view of Onwumere (2009:111), research design is a kind of blue print that
guides the researcher in his or her investigation and analysis. For the purpose of
this study, descriptive survey design was used for the study. The method is
considered adequate and most appropriate because it helped the researcher to
describe, examine, record, analyze and interpret the variables that exit in the study.
It is also worthwhile in view of the relatively large population from which the
information was collected. More so it is very economical for independent
researchers. Furthermore, the researcher also find it necessary to employ oral
interview because of its factual implication on the study. Some historical
documents were also reviewed for a more in depth and comprehensive coverage.
70
3.3 SOURCE OF DATA:
The data used for this research work were obtained specifically from two sources
namely: Primary and Secondary sources of data.
3.3.1 Primary Sources
Primary data: The primary data include the data collected from questionnaire
administered by the researcher, the personal interview, observation. The primary
data also include information collected from direct survey, which involves direct
contact with the respondents. In this study, the research used questionnaire as the
main tool for the primary data collection. The researcher distributed the questioner
to potential respondents who filled and returned them.
3.3.2 Secondary Sources
The secondary sources involve the use of existing but related but related literature,
which was produced by earlier researchers for the purpose of contributing their
quota to the problem under study. Specifically the data collection sources to be
used for extracting secondary data for this study include relevant documents, such
as position descriptions, policy manuals, organizational structure charts and
training documents; as well as some published information about organizations,
such as financial statements and annual reports, journals, magazines, text-books
and internet.
71
3.4 AREA OF STUDY
This study covers banks and manufacturing companies in Enugu, Enugu state.
These are First Bank Plc, Zenith bank Plc, Nigeria Bottling Company and Nigeria
Breweries Plc. For the purpose of this work, two banks and two manufacturing
companies were selected.
3.5 INSTRUMENTS FOR DATA COLLECTED
The instruments that were used for data collection include: structured
questionnaire, observation and interview.
1. Questionnaire: Structured questionnaire was administered to respondents
and the contents of the questionnaire were clear enough to elicit accurate
responses from the selected organizations as attached in Appendix II. The
instrument was structure in liker scale form, it contained twenty-nine
questions and three hundred-seventeen copies were administered to the
respondents. The scale grading follows:
Not important (NI) / Disagree (D) ------------- 1
Little importance (LI) / Strongly Disagree (SD) ------------- 2
Average importance (AI) / Undecided (U) ------------- 3
Very important (VI) / Agree (A) ------------- 4
Extremely (E) / Strongly Agree (SA) ------------ 5
2. Interview Schedule: Some respondents were interviewed personally using
interview schedule to get more details about the study especially those not
covered by the questionnaire. Semi-structured interviews were conducted
with key stakeholders of AIS. In data quality studies, four types of
stakeholders have been identified; they are data producers, data custodians,
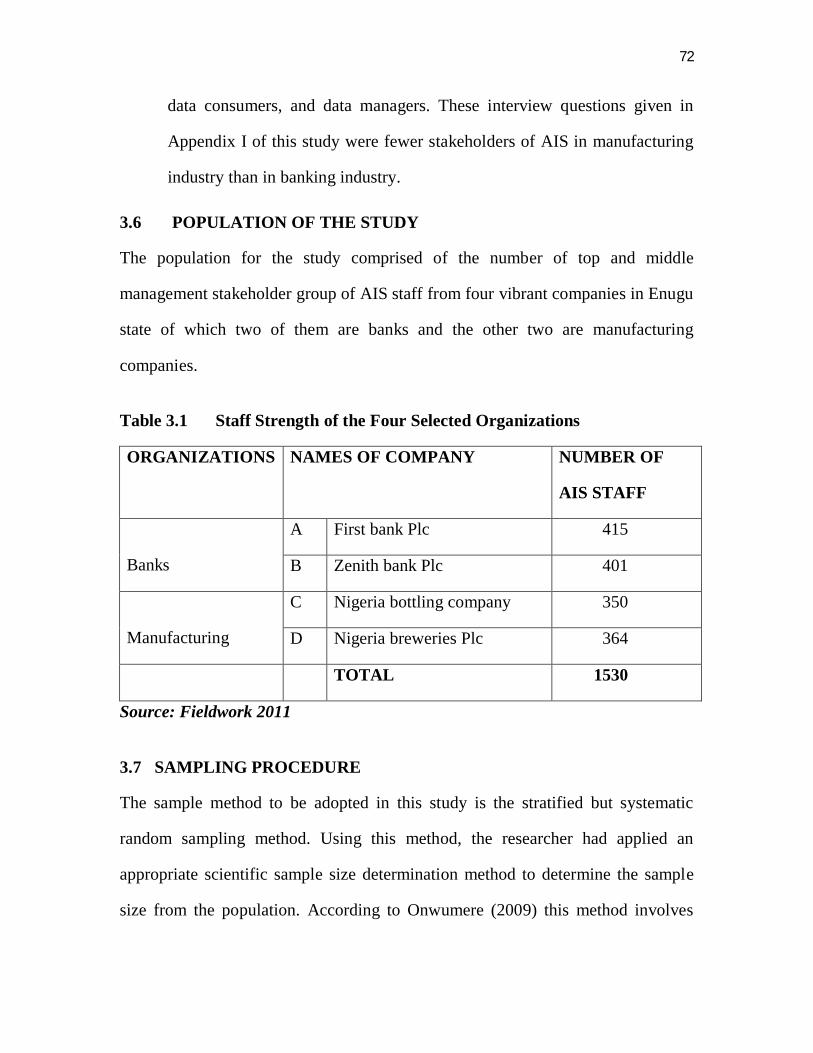
72
data consumers, and data managers. These interview questions given in
Appendix I of this study were fewer stakeholders of AIS in manufacturing
industry than in banking industry.
3.6 POPULATION OF THE STUDY
The population for the study comprised of the number of top and middle
management stakeholder group of AIS staff from four vibrant companies in Enugu
state of which two of them are banks and the other two are manufacturing
companies.
Table 3.1 Staff Strength of the Four Selected Organizations
ORGANIZATIONS NAMES OF COMPANY NUMBER OF
AIS STAFF
Banks
A First bank Plc 415
B Zenith bank Plc 401
Manufacturing
C Nigeria bottling company 350
D Nigeria breweries Plc 364
TOTAL 1530
Source: Fieldwork 2011
3.7 SAMPLING PROCEDURE
The sample method to be adopted in this study is the stratified but systematic
random sampling method. Using this method, the researcher had applied an
appropriate scientific sample size determination method to determine the sample
size from the population. According to Onwumere (2009) this method involves
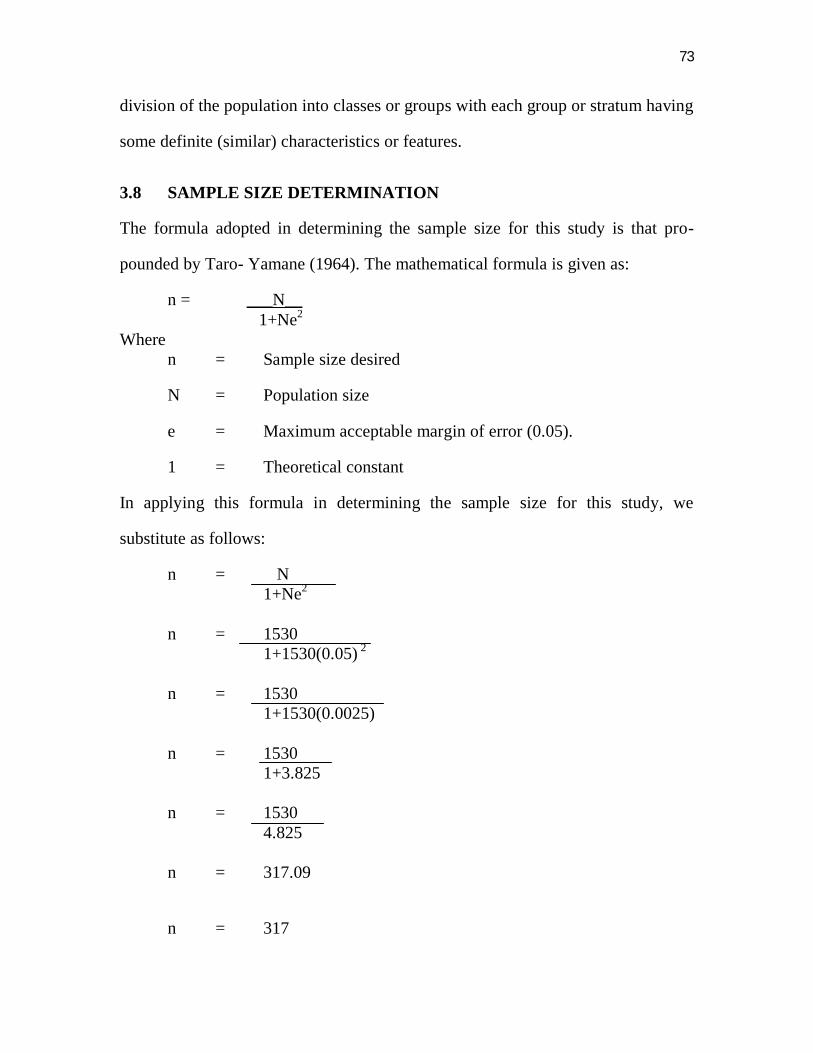
73
division of the population into classes or groups with each group or stratum having
some definite (similar) characteristics or features.
3.8 SAMPLE SIZE DETERMINATION
The formula adopted in determining the sample size for this study is that pro-
pounded by Taro- Yamane (1964). The mathematical formula is given as:
n = ___N__ 1+Ne2
Where n = Sample size desired
N = Population size
e = Maximum acceptable margin of error (0.05).
1 = Theoretical constant
In applying this formula in determining the sample size for this study, we
substitute as follows:
n = N 1+Ne2 n = 1530 1+1530(0.05) 2
n = 1530 1+1530(0.0025) n = 1530 1+3.825 n = 1530 4.825 n = 317.09
n = 317
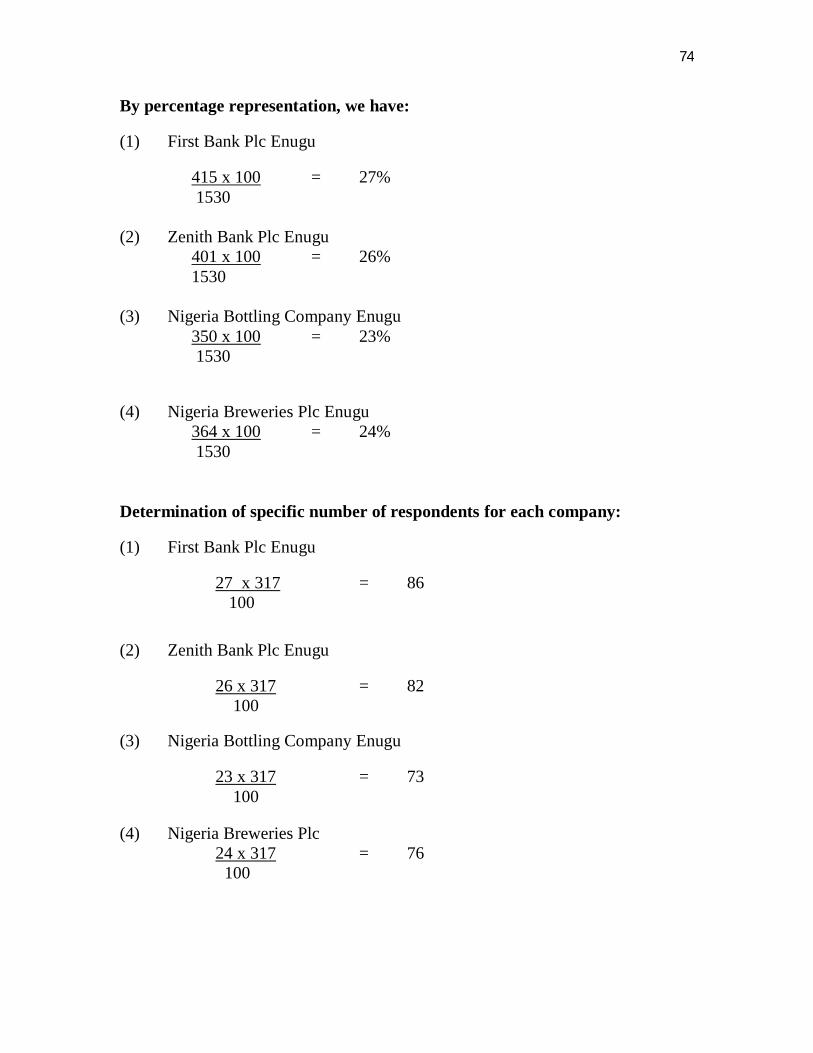
74
By percentage representation, we have:
(1) First Bank Plc Enugu
415 x 100 = 27% 1530
(2) Zenith Bank Plc Enugu 401 x 100 = 26% 1530 (3) Nigeria Bottling Company Enugu
350 x 100 = 23% 1530
(4) Nigeria Breweries Plc Enugu
364 x 100 = 24% 1530
Determination of specific number of respondents for each company:
(1) First Bank Plc Enugu
27 x 317 = 86 100
(2) Zenith Bank Plc Enugu
26 x 317 = 82 100 (3) Nigeria Bottling Company Enugu
23 x 317 = 73 100 (4) Nigeria Breweries Plc
24 x 317 = 76 100
75
3.9 VALIDITY OF THE RESEARCH INSTRUMENT
Onwumere (2005:66), defines validity as “the extent to which a measuring
instrument on application performs the function for which it was designed,”
To ascertain the validity of the instrument, content validity was adopted, in which
the researcher subjected the instrument to face to face validity by giving it to two
executives of the Institute of Chartered Accountant of Nigeria ICAN), Enugu
chapter, who examined the items and made sure they were in line with the
objectives of the study. The structure and language of the questionnaire was
modified in the light of the corrections. The instrument was structured in such a
way as to minimize the effect of errors like inconsistency and ambiguity. The
extent to which differences in sore represent true differences in the attributes being
measured. Whether they reflect the influence of other factors and to what degree
they do so.
3.10 RELIABILITY OF THE RESEARCH INSTRUMENT
Aham (2000:87) defines reliability as “the ability of a particular measuring
instrument to yield similar result when applied to the same situation at different
times.”
The reliability of the instrument was determined by a reliability test through the
use of pilot study. The pre-test was done using twenty copies of questionnaire
administered to the respondents of the selected firm. All questionnaire distributed
were completed and returned using the Pearson product moment correlation
coefficient of reliability was found to be high, r = 0.95 showing that there is
consistency in the items of the survey.
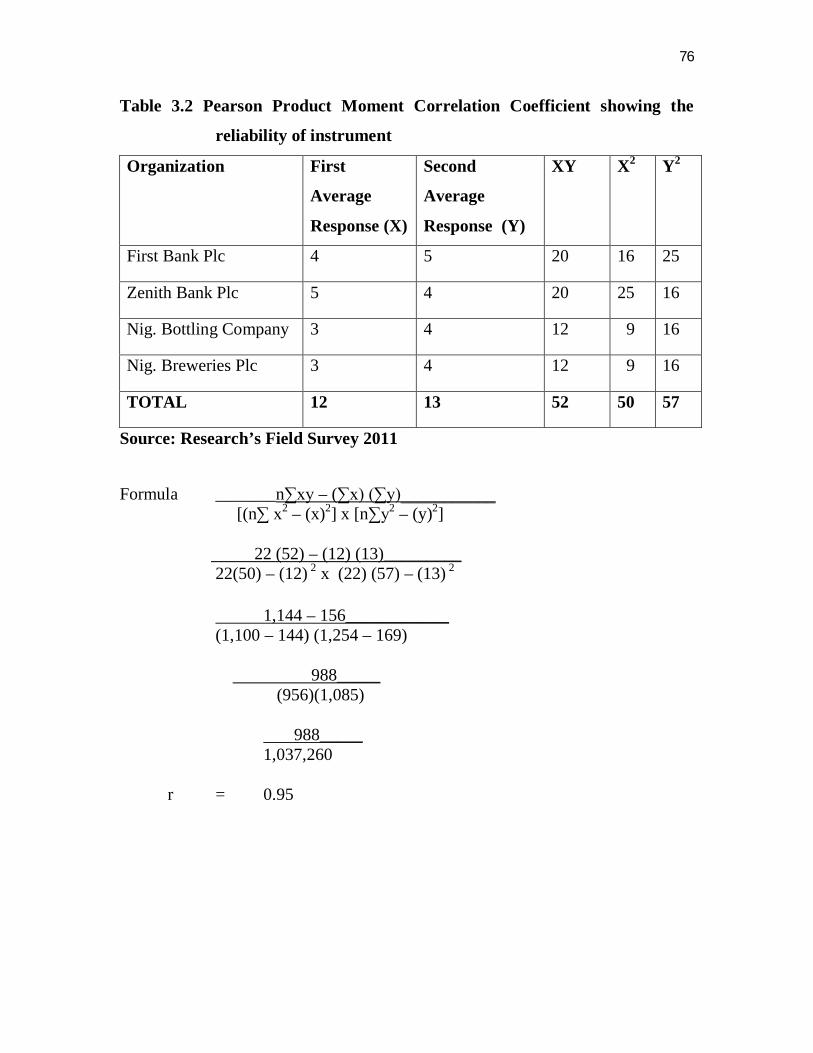
76
Table 3.2 Pearson Product Moment Correlation Coefficient showing the
reliability of instrument
Organization First
Average
Response (X)
Second
Average
Response (Y)
XY X2 Y2
First Bank Plc 4 5 20 16 25
Zenith Bank Plc 5 4 20 25 16
Nig. Bottling Company 3 4 12 9 16
Nig. Breweries Plc 3 4 12 9 16
TOTAL 12 13 52 50 57
Source: Research’s Field Survey 2011
Formula _______n∑xy – (∑x) (∑y)___________ [(n∑ x2 – (x)2] x [n∑y2 – (y)2] 22 (52) – (12) (13)_________ 22(50) – (12) 2 x (22) (57) – (13) 2
1,144 – 156____________ (1,100 – 144) (1,254 – 169) 988_____ (956)(1,085) 988_____ 1,037,260 r = 0.95
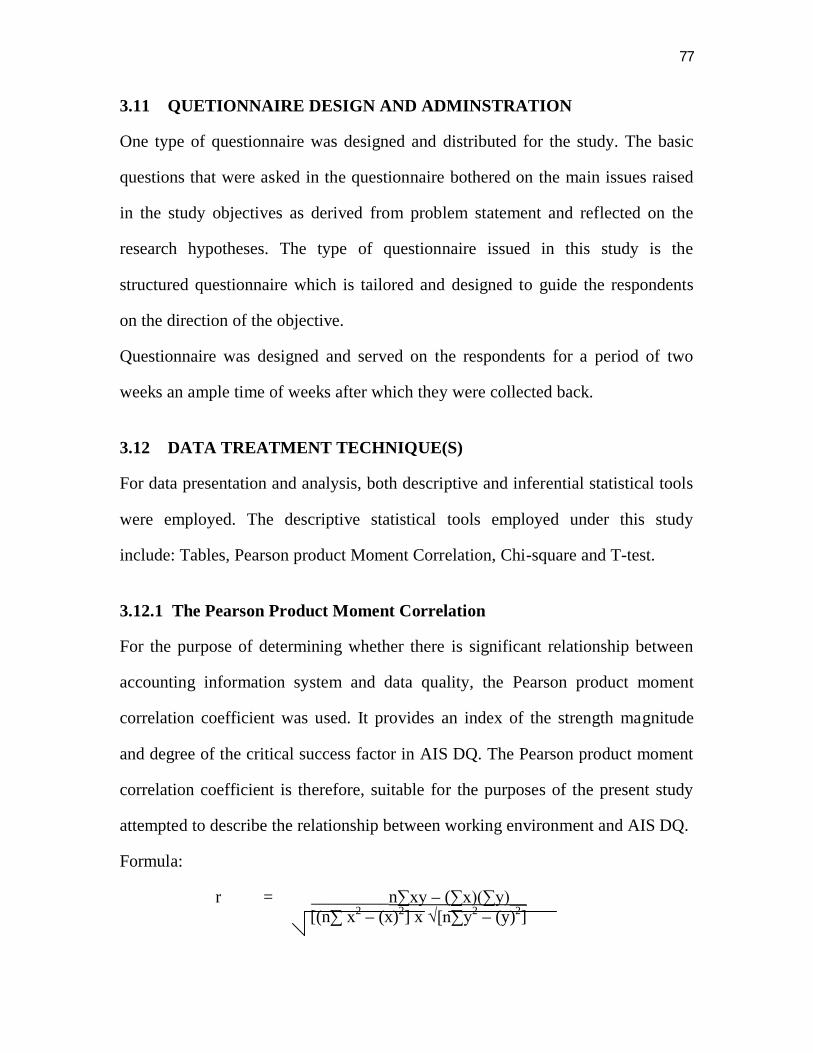
77
3.11 QUETIONNAIRE DESIGN AND ADMINSTRATION
One type of questionnaire was designed and distributed for the study. The basic
questions that were asked in the questionnaire bothered on the main issues raised
in the study objectives as derived from problem statement and reflected on the
research hypotheses. The type of questionnaire issued in this study is the
structured questionnaire which is tailored and designed to guide the respondents
on the direction of the objective.
Questionnaire was designed and served on the respondents for a period of two
weeks an ample time of weeks after which they were collected back.
3.12 DATA TREATMENT TECHNIQUE(S)
For data presentation and analysis, both descriptive and inferential statistical tools
were employed. The descriptive statistical tools employed under this study
include: Tables, Pearson product Moment Correlation, Chi-square and T-test.
3.12.1 The Pearson Product Moment Correlation
For the purpose of determining whether there is significant relationship between
accounting information system and data quality, the Pearson product moment
correlation coefficient was used. It provides an index of the strength magnitude
and degree of the critical success factor in AIS DQ. The Pearson product moment
correlation coefficient is therefore, suitable for the purposes of the present study
attempted to describe the relationship between working environment and AIS DQ.
Formula:
r = _________n∑xy – (∑x)(∑y)__ [(n∑ x2 – (x)2] x √[n∑y2 – (y)2]
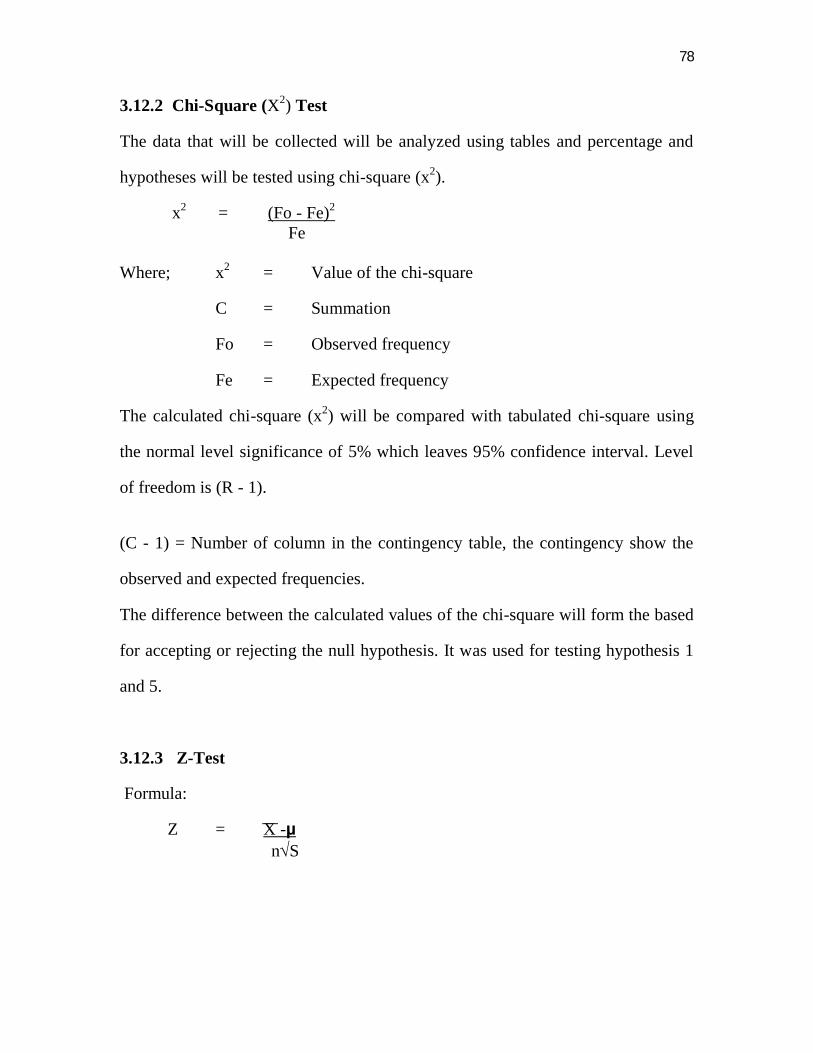
78
3.12.2 Chi-Square (X2) Test
The data that will be collected will be analyzed using tables and percentage and
hypotheses will be tested using chi-square (x2).
x2 = (Fo - Fe)2 Fe Where; x2 = Value of the chi-square
C = Summation
Fo = Observed frequency
Fe = Expected frequency
The calculated chi-square (x2) will be compared with tabulated chi-square using
the normal level significance of 5% which leaves 95% confidence interval. Level
of freedom is (R - 1).
(C - 1) = Number of column in the contingency table, the contingency show the
observed and expected frequencies.
The difference between the calculated values of the chi-square will form the based
for accepting or rejecting the null hypothesis. It was used for testing hypothesis 1
and 5.
3.12.3 Z-Test
Formula:
Z = X -µ nS
__
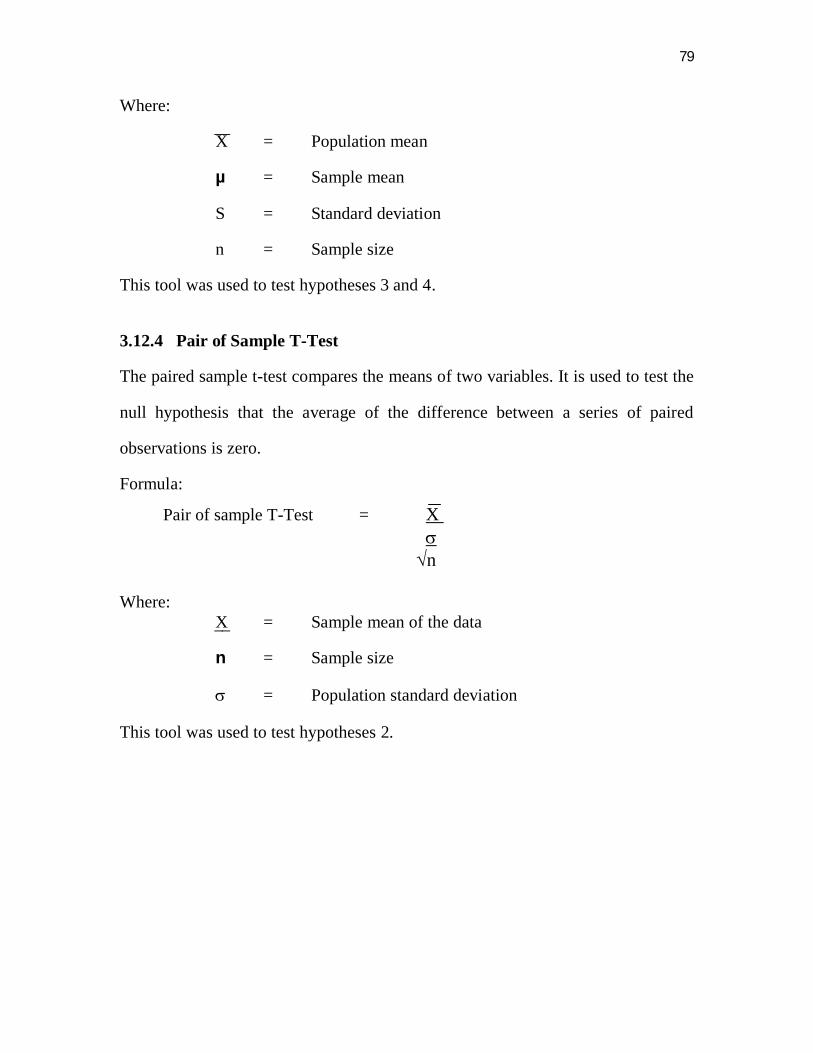
79
Where:
X = Population mean
µ = Sample mean
S = Standard deviation
n = Sample size
This tool was used to test hypotheses 3 and 4.
3.12.4 Pair of Sample T-Test
The paired sample t-test compares the means of two variables. It is used to test the
null hypothesis that the average of the difference between a series of paired
observations is zero.
Formula:
Pair of sample T-Test = X n Where: X = Sample mean of the data
n = Sample size
= Population standard deviation
This tool was used to test hypotheses 2.
__
__
80
REFERENCES
Asika, N. (2001), Research Methodology in Behavioral Sciences, Lagos,
Longman. Eboh, E. C. (1998), Social and Economic Research. Principles and Methods,
Lagos. Academic Publications and Development Limited. Fruends, J. E. and Williams F. J. (1979), Modern Business Statistics London;
Pitman Publishing Limited. Fubara, B. A. and Mguni B. S. (2005), Research Methods in Management, Port-
Harcourt: Pearl Publishers. Ikeagwu, E. K. (1998), Ground Work of Research Methods and Procedures,
Enugu: Institute for Development Studies. Nzelibe C. G. and IIogu, G. C. (1996), Fundamentals of Research Methods,
Enugu: Optimal International Limited. Onwumere, J. U. J. (2009), Business and Economic. Research Methods, Enugu:
Vougasen Limited. Onwura, E. A. (1998) Introduction to Academic Research Methods, Enugu:
Gostak Printing and Publishing Co. Limited.
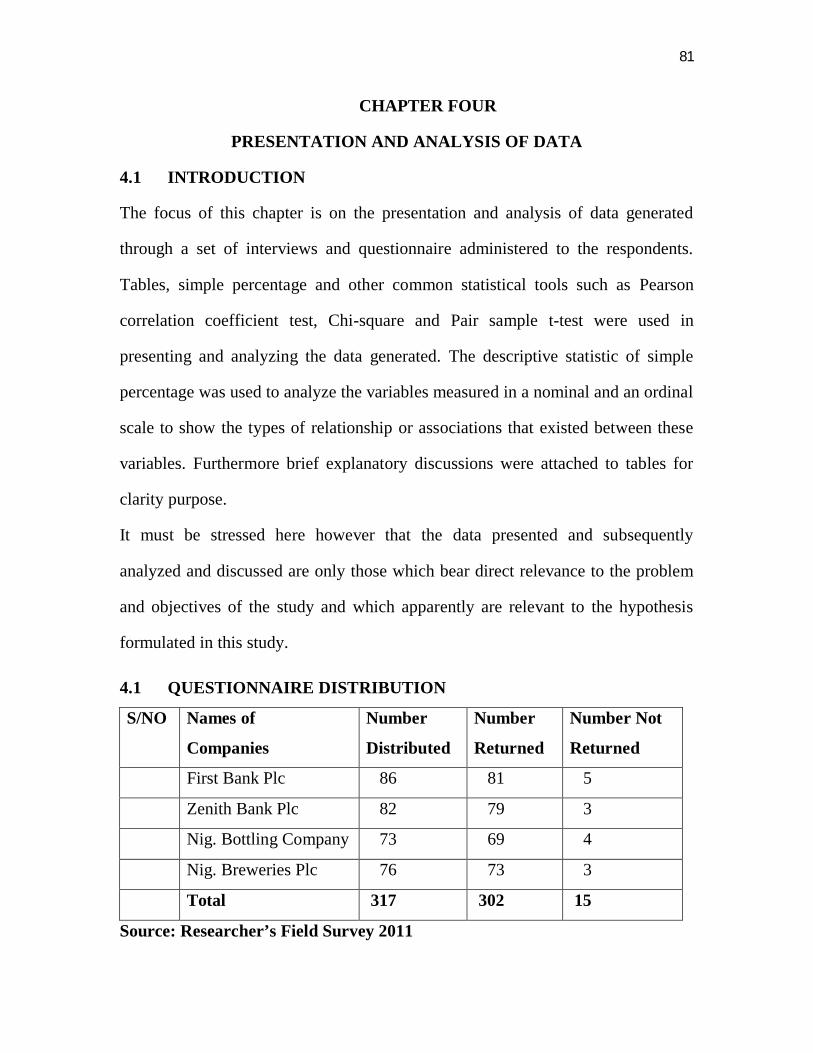
81
CHAPTER FOUR
PRESENTATION AND ANALYSIS OF DATA
4.1 INTRODUCTION
The focus of this chapter is on the presentation and analysis of data generated
through a set of interviews and questionnaire administered to the respondents.
Tables, simple percentage and other common statistical tools such as Pearson
correlation coefficient test, Chi-square and Pair sample t-test were used in
presenting and analyzing the data generated. The descriptive statistic of simple
percentage was used to analyze the variables measured in a nominal and an ordinal
scale to show the types of relationship or associations that existed between these
variables. Furthermore brief explanatory discussions were attached to tables for
clarity purpose.
It must be stressed here however that the data presented and subsequently
analyzed and discussed are only those which bear direct relevance to the problem
and objectives of the study and which apparently are relevant to the hypothesis
formulated in this study.
4.1 QUESTIONNAIRE DISTRIBUTION
S/NO Names of
Companies
Number
Distributed
Number
Returned
Number Not
Returned
First Bank Plc 86 81 5
Zenith Bank Plc 82 79 3
Nig. Bottling Company 73 69 4
Nig. Breweries Plc 76 73 3
Total 317 302 15
Source: Researcher’s Field Survey 2011
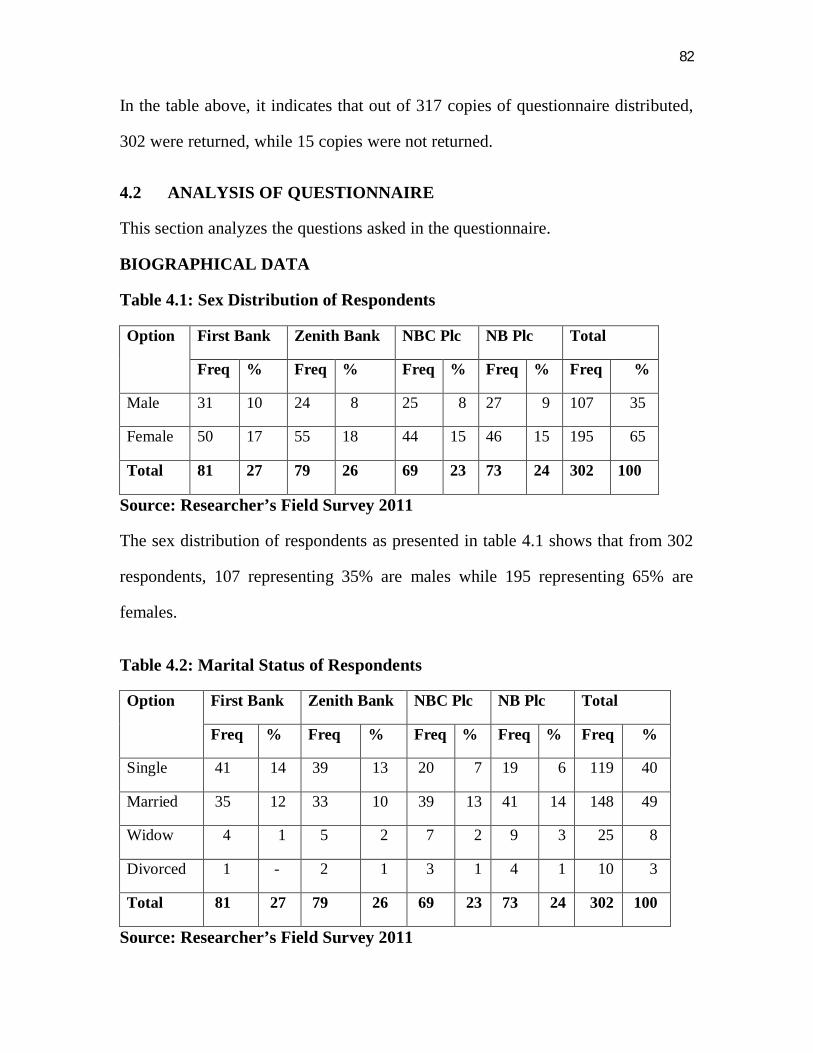
82
In the table above, it indicates that out of 317 copies of questionnaire distributed,
302 were returned, while 15 copies were not returned.
4.2 ANALYSIS OF QUESTIONNAIRE
This section analyzes the questions asked in the questionnaire.
BIOGRAPHICAL DATA
Table 4.1: Sex Distribution of Respondents
Option First Bank Zenith Bank NBC Plc NB Plc Total
Freq % Freq % Freq % Freq % Freq %
Male 31 10 24 8 25 8 27 9 107 35
Female 50 17 55 18 44 15 46 15 195 65
Total 81 27 79 26 69 23 73 24 302 100
Source: Researcher’s Field Survey 2011
The sex distribution of respondents as presented in table 4.1 shows that from 302
respondents, 107 representing 35% are males while 195 representing 65% are
females.
Table 4.2: Marital Status of Respondents
Option First Bank Zenith Bank NBC Plc NB Plc Total
Freq % Freq % Freq % Freq % Freq %
Single 41 14 39 13 20 7 19 6 119 40
Married 35 12 33 10 39 13 41 14 148 49
Widow 4 1 5 2 7 2 9 3 25 8
Divorced 1 - 2 1 3 1 4 1 10 3
Total 81 27 79 26 69 23 73 24 302 100
Source: Researcher’s Field Survey 2011
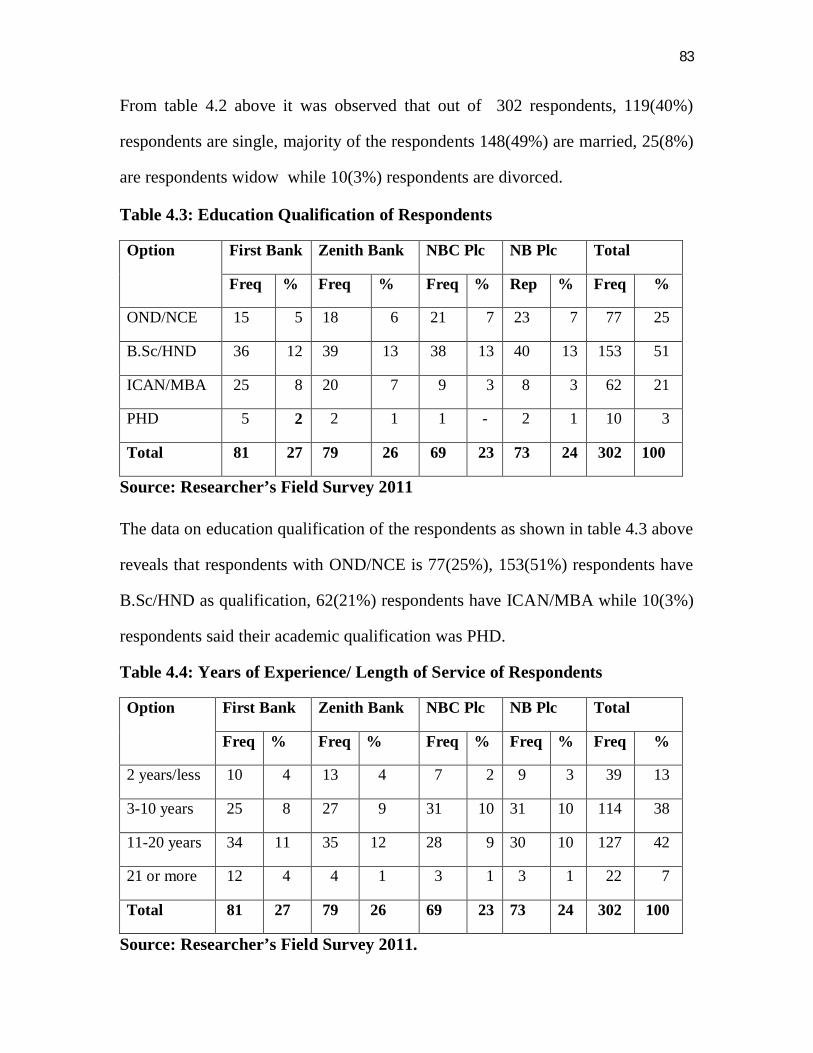
83
From table 4.2 above it was observed that out of 302 respondents, 119(40%)
respondents are single, majority of the respondents 148(49%) are married, 25(8%)
are respondents widow while 10(3%) respondents are divorced.
Table 4.3: Education Qualification of Respondents
Option First Bank Zenith Bank NBC Plc NB Plc Total
Freq % Freq % Freq % Rep % Freq %
OND/NCE 15 5 18 6 21 7 23 7 77 25
B.Sc/HND 36 12 39 13 38 13 40 13 153 51
ICAN/MBA 25 8 20 7 9 3 8 3 62 21
PHD 5 2 2 1 1 - 2 1 10 3
Total 81 27 79 26 69 23 73 24 302 100
Source: Researcher’s Field Survey 2011
The data on education qualification of the respondents as shown in table 4.3 above
reveals that respondents with OND/NCE is 77(25%), 153(51%) respondents have
B.Sc/HND as qualification, 62(21%) respondents have ICAN/MBA while 10(3%)
respondents said their academic qualification was PHD.
Table 4.4: Years of Experience/ Length of Service of Respondents
Option First Bank Zenith Bank NBC Plc NB Plc Total
Freq % Freq % Freq % Freq % Freq %
2 years/less 10 4 13 4 7 2 9 3 39 13
3-10 years 25 8 27 9 31 10 31 10 114 38
11-20 years 34 11 35 12 28 9 30 10 127 42
21 or more 12 4 4 1 3 1 3 1 22 7
Total 81 27 79 26 69 23 73 24 302 100
Source: Researcher’s Field Survey 2011.
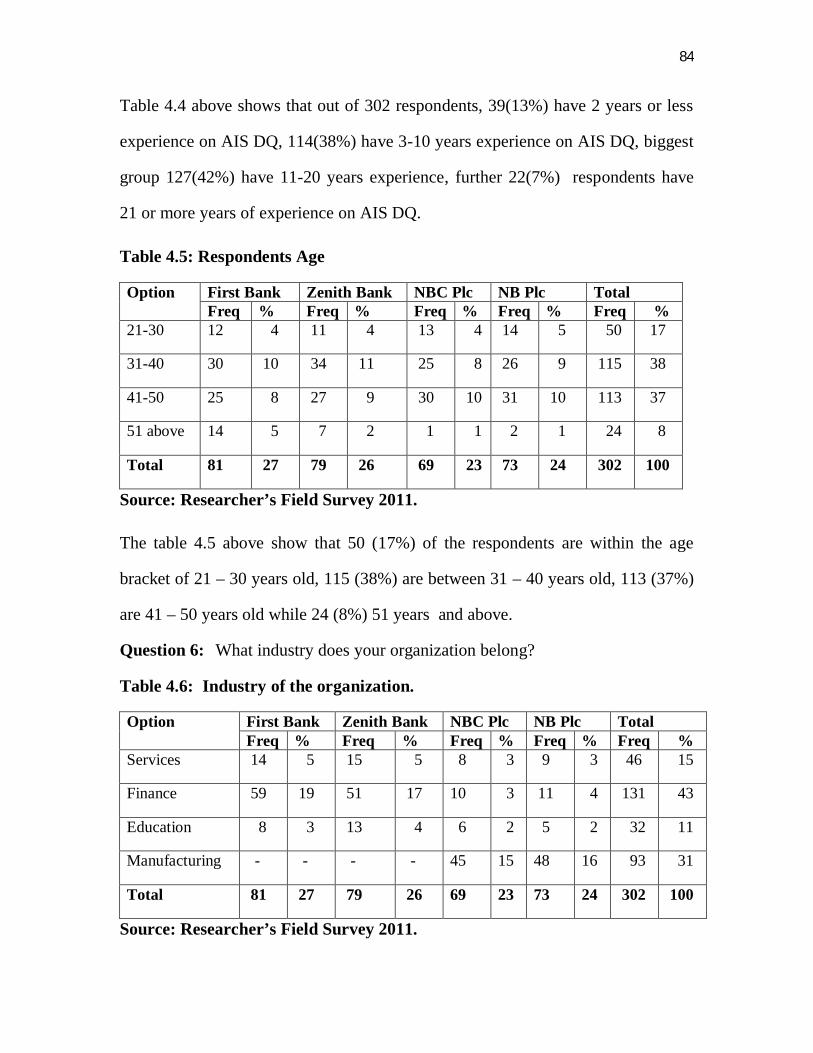
84
Table 4.4 above shows that out of 302 respondents, 39(13%) have 2 years or less
experience on AIS DQ, 114(38%) have 3-10 years experience on AIS DQ, biggest
group 127(42%) have 11-20 years experience, further 22(7%) respondents have
21 or more years of experience on AIS DQ.
Table 4.5: Respondents Age
Option First Bank Zenith Bank NBC Plc NB Plc Total Freq % Freq % Freq % Freq % Freq %
21-30 12 4 11 4 13 4 14 5 50 17
31-40 30 10 34 11 25 8 26 9 115 38
41-50 25 8 27 9 30 10 31 10 113 37
51 above 14 5 7 2 1 1 2 1 24 8
Total 81 27 79 26 69 23 73 24 302 100
Source: Researcher’s Field Survey 2011.
The table 4.5 above show that 50 (17%) of the respondents are within the age
bracket of 21 – 30 years old, 115 (38%) are between 31 – 40 years old, 113 (37%)
are 41 – 50 years old while 24 (8%) 51 years and above.
Question 6: What industry does your organization belong?
Table 4.6: Industry of the organization.
Option First Bank Zenith Bank NBC Plc NB Plc Total Freq % Freq % Freq % Freq % Freq %
Services 14 5 15 5 8 3 9 3 46 15
Finance 59 19 51 17 10 3 11 4 131 43
Education 8 3 13 4 6 2 5 2 32 11
Manufacturing - - - - 45 15 48 16 93 31
Total 81 27 79 26 69 23 73 24 302 100
Source: Researcher’s Field Survey 2011.
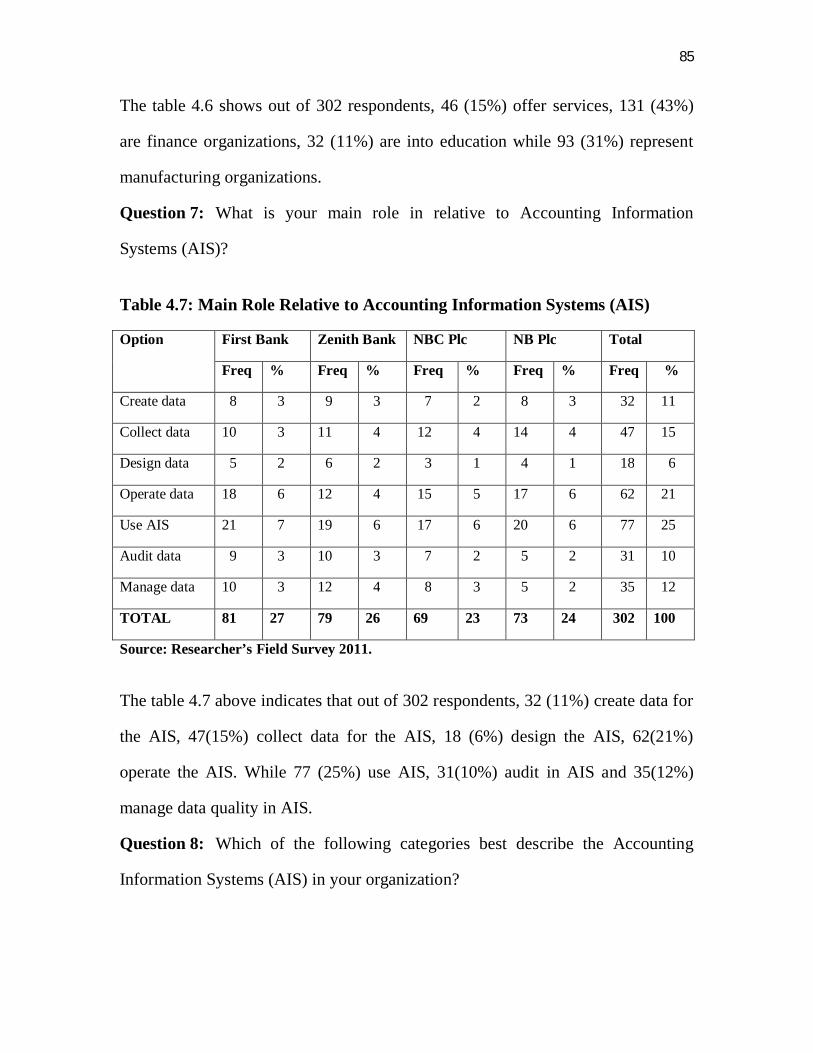
85
The table 4.6 shows out of 302 respondents, 46 (15%) offer services, 131 (43%)
are finance organizations, 32 (11%) are into education while 93 (31%) represent
manufacturing organizations.
Question 7: What is your main role in relative to Accounting Information
Systems (AIS)?
Table 4.7: Main Role Relative to Accounting Information Systems (AIS)
Option First Bank Zenith Bank NBC Plc NB Plc Total
Freq % Freq % Freq % Freq % Freq %
Create data 8 3 9 3 7 2 8 3 32 11
Collect data 10 3 11 4 12 4 14 4 47 15
Design data 5 2 6 2 3 1 4 1 18 6
Operate data 18 6 12 4 15 5 17 6 62 21
Use AIS 21 7 19 6 17 6 20 6 77 25
Audit data 9 3 10 3 7 2 5 2 31 10
Manage data 10 3 12 4 8 3 5 2 35 12
TOTAL 81 27 79 26 69 23 73 24 302 100
Source: Researcher’s Field Survey 2011.
The table 4.7 above indicates that out of 302 respondents, 32 (11%) create data for
the AIS, 47(15%) collect data for the AIS, 18 (6%) design the AIS, 62(21%)
operate the AIS. While 77 (25%) use AIS, 31(10%) audit in AIS and 35(12%)
manage data quality in AIS.
Question 8: Which of the following categories best describe the Accounting
Information Systems (AIS) in your organization?
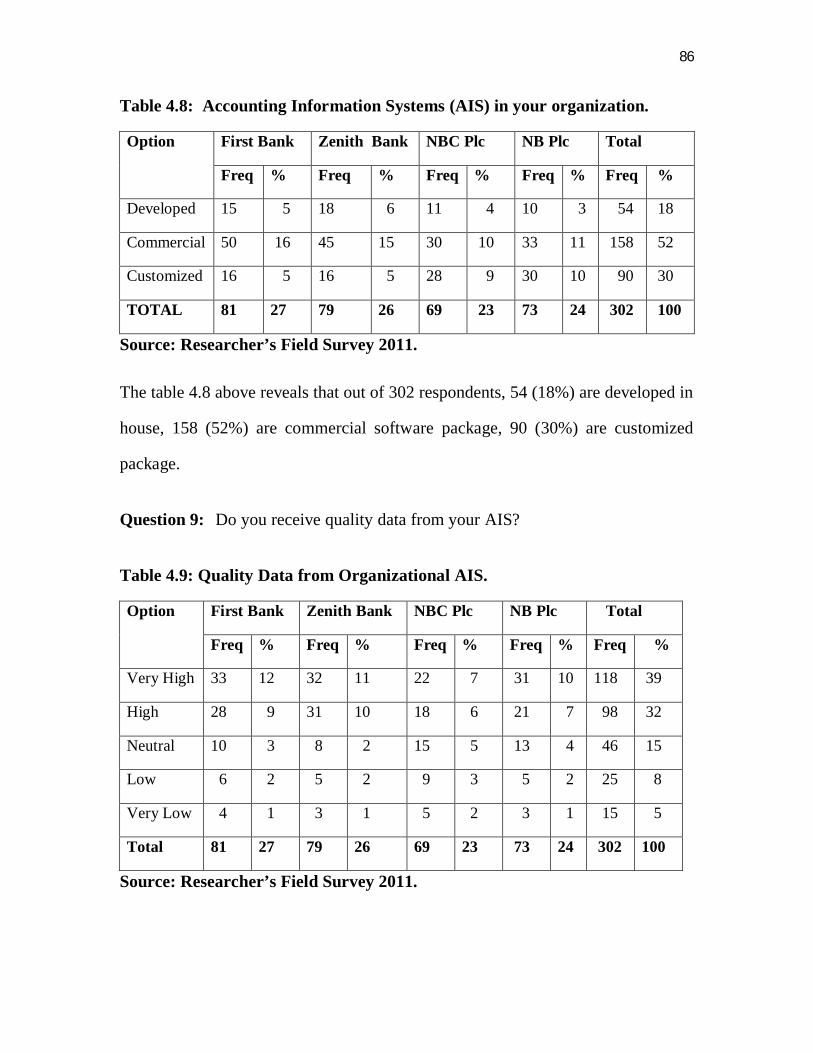
86
Table 4.8: Accounting Information Systems (AIS) in your organization.
Option First Bank Zenith Bank NBC Plc NB Plc Total
Freq % Freq % Freq % Freq % Freq %
Developed 15 5 18 6 11 4 10 3 54 18
Commercial 50 16 45 15 30 10 33 11 158 52
Customized 16 5 16 5 28 9 30 10 90 30
TOTAL 81 27 79 26 69 23 73 24 302 100
Source: Researcher’s Field Survey 2011.
The table 4.8 above reveals that out of 302 respondents, 54 (18%) are developed in
house, 158 (52%) are commercial software package, 90 (30%) are customized
package.
Question 9: Do you receive quality data from your AIS?
Table 4.9: Quality Data from Organizational AIS.
Option First Bank Zenith Bank NBC Plc NB Plc Total
Freq % Freq % Freq % Freq % Freq %
Very High 33 12 32 11 22 7 31 10 118 39
High 28 9 31 10 18 6 21 7 98 32
Neutral 10 3 8 2 15 5 13 4 46 15
Low 6 2 5 2 9 3 5 2 25 8
Very Low 4 1 3 1 5 2 3 1 15 5
Total 81 27 79 26 69 23 73 24 302 100
Source: Researcher’s Field Survey 2011.
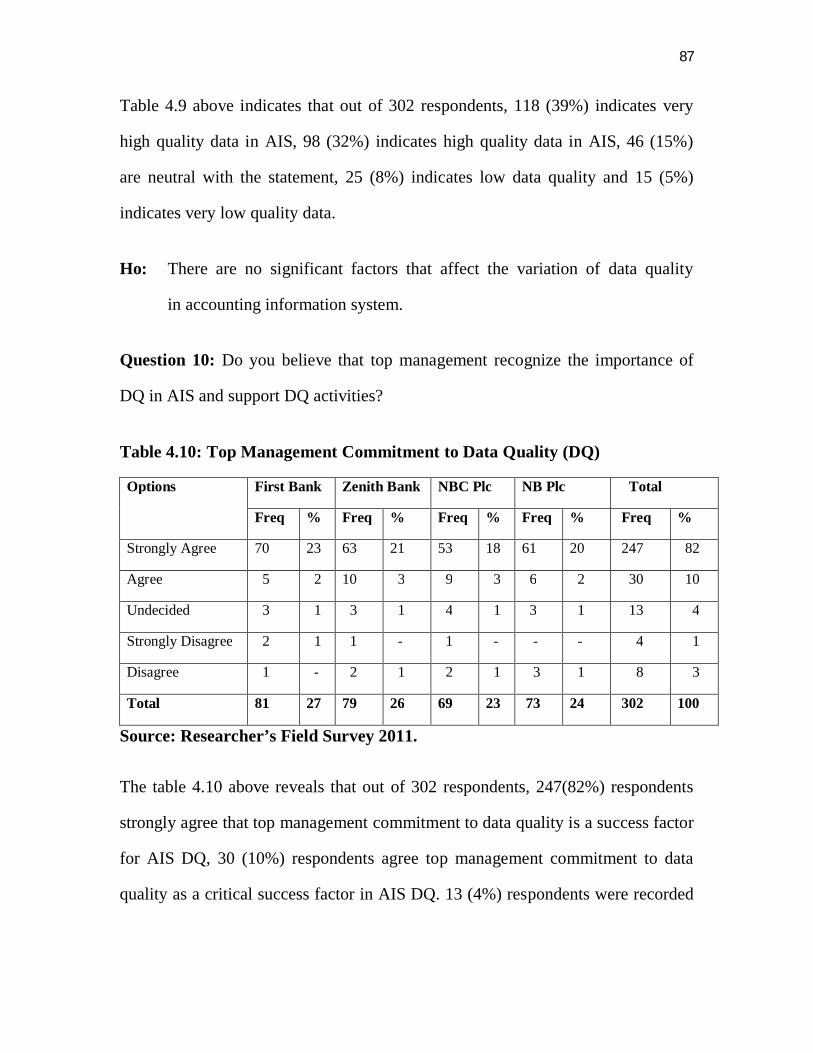
87
Table 4.9 above indicates that out of 302 respondents, 118 (39%) indicates very
high quality data in AIS, 98 (32%) indicates high quality data in AIS, 46 (15%)
are neutral with the statement, 25 (8%) indicates low data quality and 15 (5%)
indicates very low quality data.
Ho: There are no significant factors that affect the variation of data quality
in accounting information system.
Question 10: Do you believe that top management recognize the importance of
DQ in AIS and support DQ activities?
Table 4.10: Top Management Commitment to Data Quality (DQ)
Options First Bank Zenith Bank NBC Plc NB Plc Total
Freq % Freq % Freq % Freq % Freq %
Strongly Agree 70 23 63 21 53 18 61 20 247 82
Agree 5 2 10 3 9 3 6 2 30 10
Undecided 3 1 3 1 4 1 3 1 13 4
Strongly Disagree 2 1 1 - 1 - - - 4 1
Disagree 1 - 2 1 2 1 3 1 8 3
Total 81 27 79 26 69 23 73 24 302 100
Source: Researcher’s Field Survey 2011.
The table 4.10 above reveals that out of 302 respondents, 247(82%) respondents
strongly agree that top management commitment to data quality is a success factor
for AIS DQ, 30 (10%) respondents agree top management commitment to data
quality as a critical success factor in AIS DQ. 13 (4%) respondents were recorded
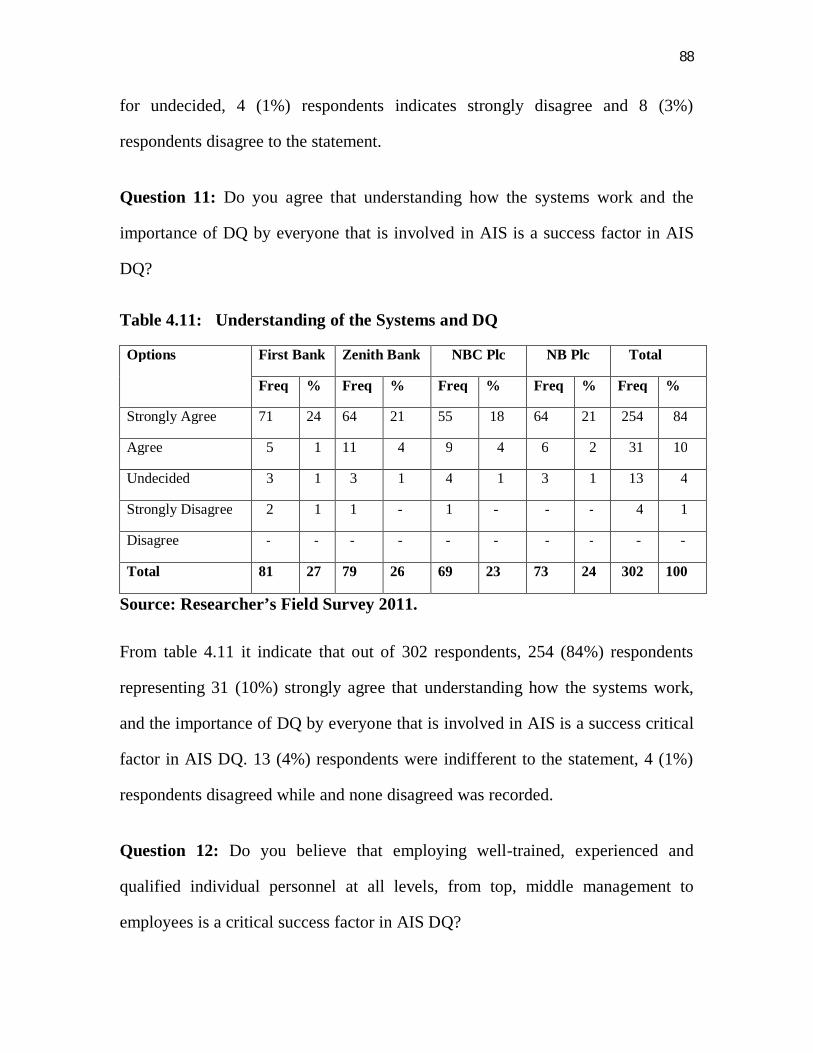
88
for undecided, 4 (1%) respondents indicates strongly disagree and 8 (3%)
respondents disagree to the statement.
Question 11: Do you agree that understanding how the systems work and the
importance of DQ by everyone that is involved in AIS is a success factor in AIS
DQ?
Table 4.11: Understanding of the Systems and DQ
Options First Bank Zenith Bank NBC Plc NB Plc Total
Freq % Freq % Freq % Freq % Freq %
Strongly Agree 71 24 64 21 55 18 64 21 254 84
Agree 5 1 11 4 9 4 6 2 31 10
Undecided 3 1 3 1 4 1 3 1 13 4
Strongly Disagree 2 1 1 - 1 - - - 4 1
Disagree - - - - - - - - - -
Total 81 27 79 26 69 23 73 24 302 100
Source: Researcher’s Field Survey 2011.
From table 4.11 it indicate that out of 302 respondents, 254 (84%) respondents
representing 31 (10%) strongly agree that understanding how the systems work,
and the importance of DQ by everyone that is involved in AIS is a success critical
factor in AIS DQ. 13 (4%) respondents were indifferent to the statement, 4 (1%)
respondents disagreed while and none disagreed was recorded.
Question 12: Do you believe that employing well-trained, experienced and
qualified individual personnel at all levels, from top, middle management to
employees is a critical success factor in AIS DQ?
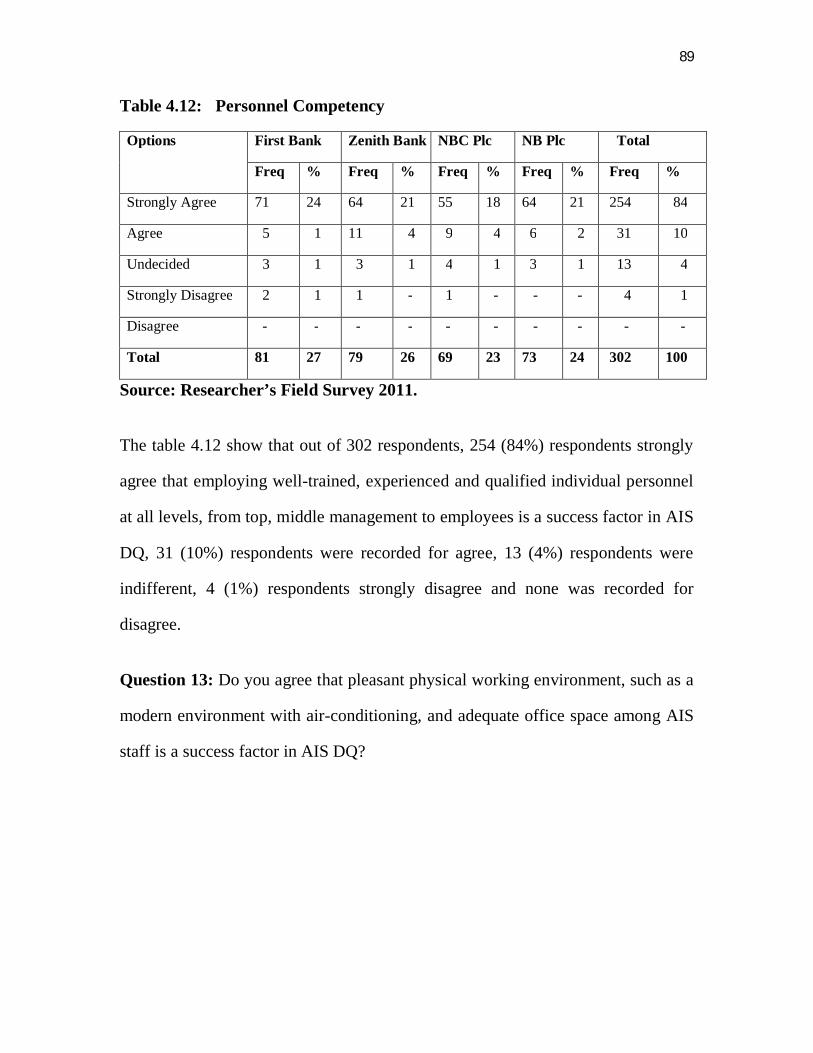
89
Table 4.12: Personnel Competency
Options First Bank Zenith Bank NBC Plc NB Plc Total
Freq % Freq % Freq % Freq % Freq %
Strongly Agree 71 24 64 21 55 18 64 21 254 84
Agree 5 1 11 4 9 4 6 2 31 10
Undecided 3 1 3 1 4 1 3 1 13 4
Strongly Disagree 2 1 1 - 1 - - - 4 1
Disagree - - - - - - - - - -
Total 81 27 79 26 69 23 73 24 302 100
Source: Researcher’s Field Survey 2011.
The table 4.12 show that out of 302 respondents, 254 (84%) respondents strongly
agree that employing well-trained, experienced and qualified individual personnel
at all levels, from top, middle management to employees is a success factor in AIS
DQ, 31 (10%) respondents were recorded for agree, 13 (4%) respondents were
indifferent, 4 (1%) respondents strongly disagree and none was recorded for
disagree.
Question 13: Do you agree that pleasant physical working environment, such as a
modern environment with air-conditioning, and adequate office space among AIS
staff is a success factor in AIS DQ?
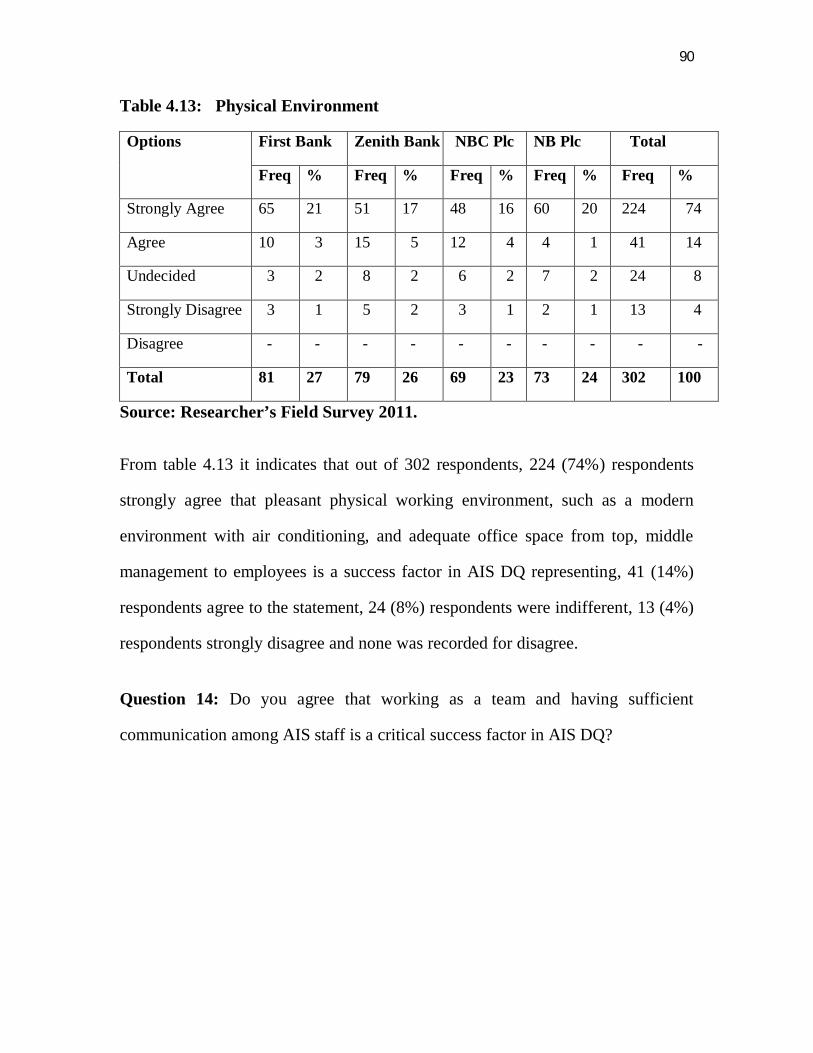
90
Table 4.13: Physical Environment
Options First Bank Zenith Bank NBC Plc NB Plc Total
Freq % Freq % Freq % Freq % Freq %
Strongly Agree 65 21 51 17 48 16 60 20 224 74
Agree 10 3 15 5 12 4 4 1 41 14
Undecided 3 2 8 2 6 2 7 2 24 8
Strongly Disagree 3 1 5 2 3 1 2 1 13 4
Disagree - - - - - - - - - -
Total 81 27 79 26 69 23 73 24 302 100
Source: Researcher’s Field Survey 2011.
From table 4.13 it indicates that out of 302 respondents, 224 (74%) respondents
strongly agree that pleasant physical working environment, such as a modern
environment with air conditioning, and adequate office space from top, middle
management to employees is a success factor in AIS DQ representing, 41 (14%)
respondents agree to the statement, 24 (8%) respondents were indifferent, 13 (4%)
respondents strongly disagree and none was recorded for disagree.
Question 14: Do you agree that working as a team and having sufficient
communication among AIS staff is a critical success factor in AIS DQ?
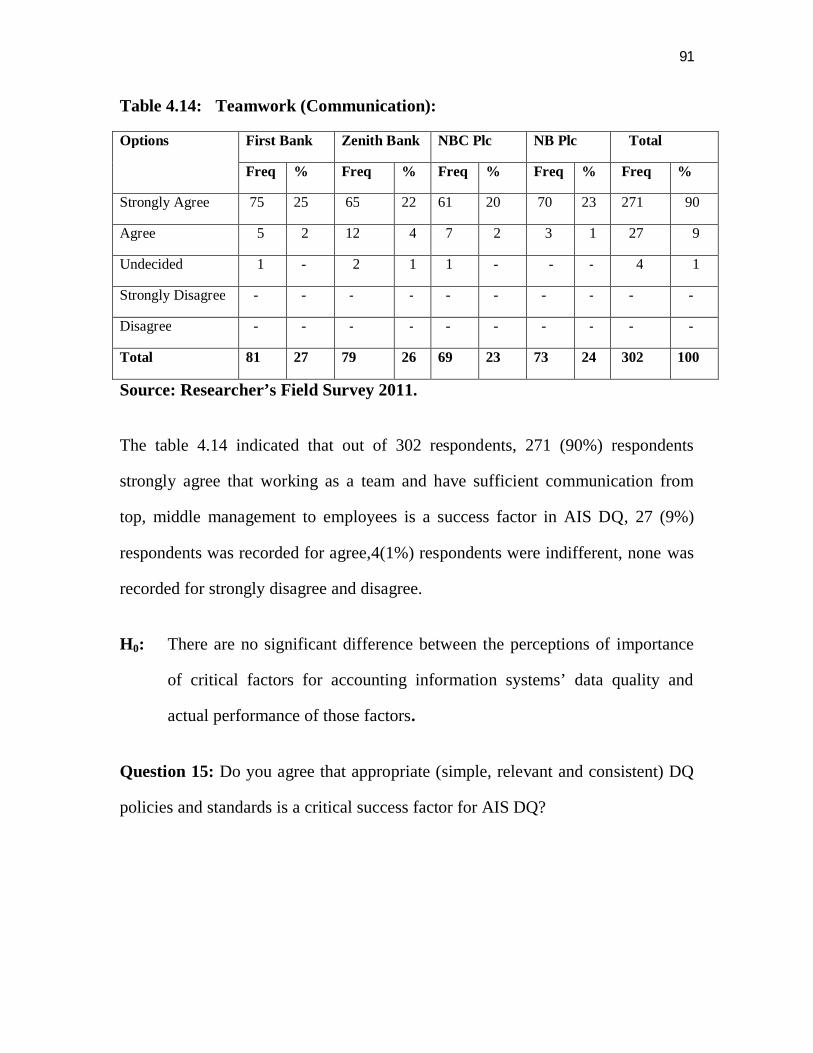
91
Table 4.14: Teamwork (Communication):
Options First Bank Zenith Bank NBC Plc NB Plc Total
Freq % Freq % Freq % Freq % Freq %
Strongly Agree 75 25 65 22 61 20 70 23 271 90
Agree 5 2 12 4 7 2 3 1 27 9
Undecided 1 - 2 1 1 - - - 4 1
Strongly Disagree - - - - - - - - - -
Disagree - - - - - - - - - -
Total 81 27 79 26 69 23 73 24 302 100
Source: Researcher’s Field Survey 2011.
The table 4.14 indicated that out of 302 respondents, 271 (90%) respondents
strongly agree that working as a team and have sufficient communication from
top, middle management to employees is a success factor in AIS DQ, 27 (9%)
respondents was recorded for agree,4(1%) respondents were indifferent, none was
recorded for strongly disagree and disagree.
H0: There are no significant difference between the perceptions of importance
of critical factors for accounting information systems’ data quality and
actual performance of those factors.
Question 15: Do you agree that appropriate (simple, relevant and consistent) DQ
policies and standards is a critical success factor for AIS DQ?
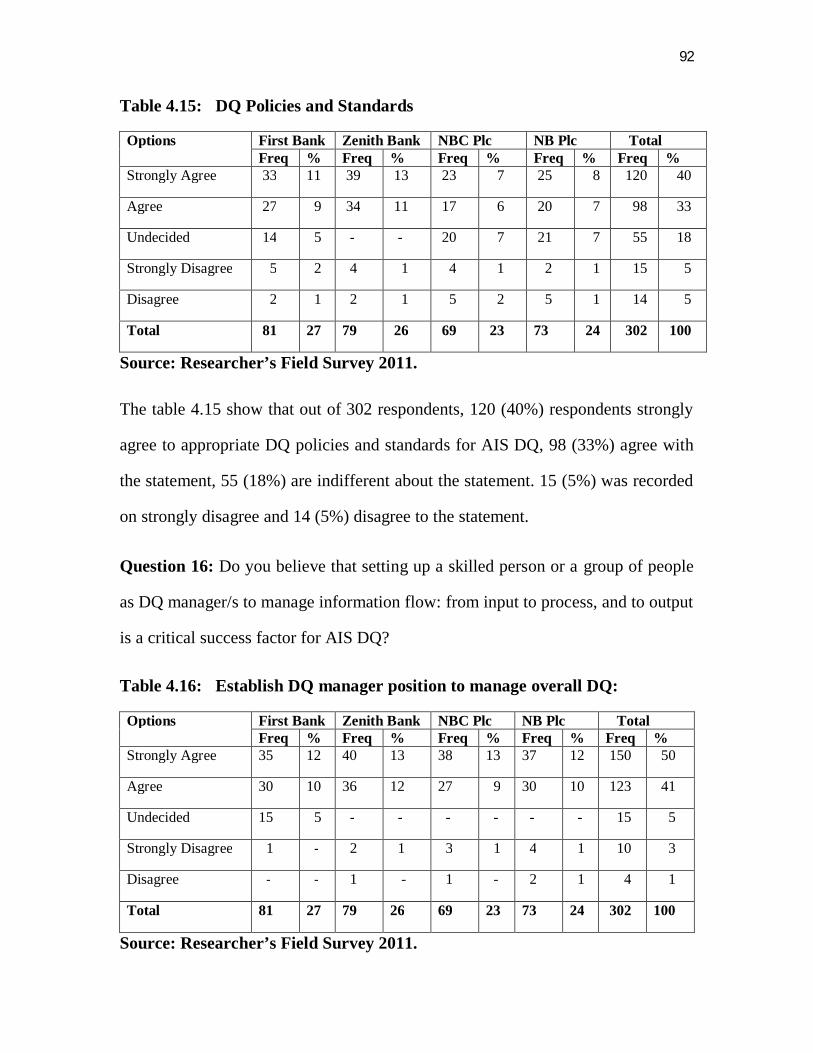
92
Table 4.15: DQ Policies and Standards
Options First Bank Zenith Bank NBC Plc NB Plc Total Freq % Freq % Freq % Freq % Freq %
Strongly Agree 33 11 39 13 23 7 25 8 120 40
Agree 27 9 34 11 17 6 20 7 98 33
Undecided 14 5 - - 20 7 21 7 55 18
Strongly Disagree 5 2 4 1 4 1 2 1 15 5
Disagree 2 1 2 1 5 2 5 1 14 5
Total 81 27 79 26 69 23 73 24 302 100
Source: Researcher’s Field Survey 2011.
The table 4.15 show that out of 302 respondents, 120 (40%) respondents strongly
agree to appropriate DQ policies and standards for AIS DQ, 98 (33%) agree with
the statement, 55 (18%) are indifferent about the statement. 15 (5%) was recorded
on strongly disagree and 14 (5%) disagree to the statement.
Question 16: Do you believe that setting up a skilled person or a group of people
as DQ manager/s to manage information flow: from input to process, and to output
is a critical success factor for AIS DQ?
Table 4.16: Establish DQ manager position to manage overall DQ:
Options First Bank Zenith Bank NBC Plc NB Plc Total Freq % Freq % Freq % Freq % Freq %
Strongly Agree 35 12 40 13 38 13 37 12 150 50
Agree 30 10 36 12 27 9 30 10 123 41
Undecided 15 5 - - - - - - 15 5
Strongly Disagree 1 - 2 1 3 1 4 1 10 3
Disagree - - 1 - 1 - 2 1 4 1
Total 81 27 79 26 69 23 73 24 302 100
Source: Researcher’s Field Survey 2011.
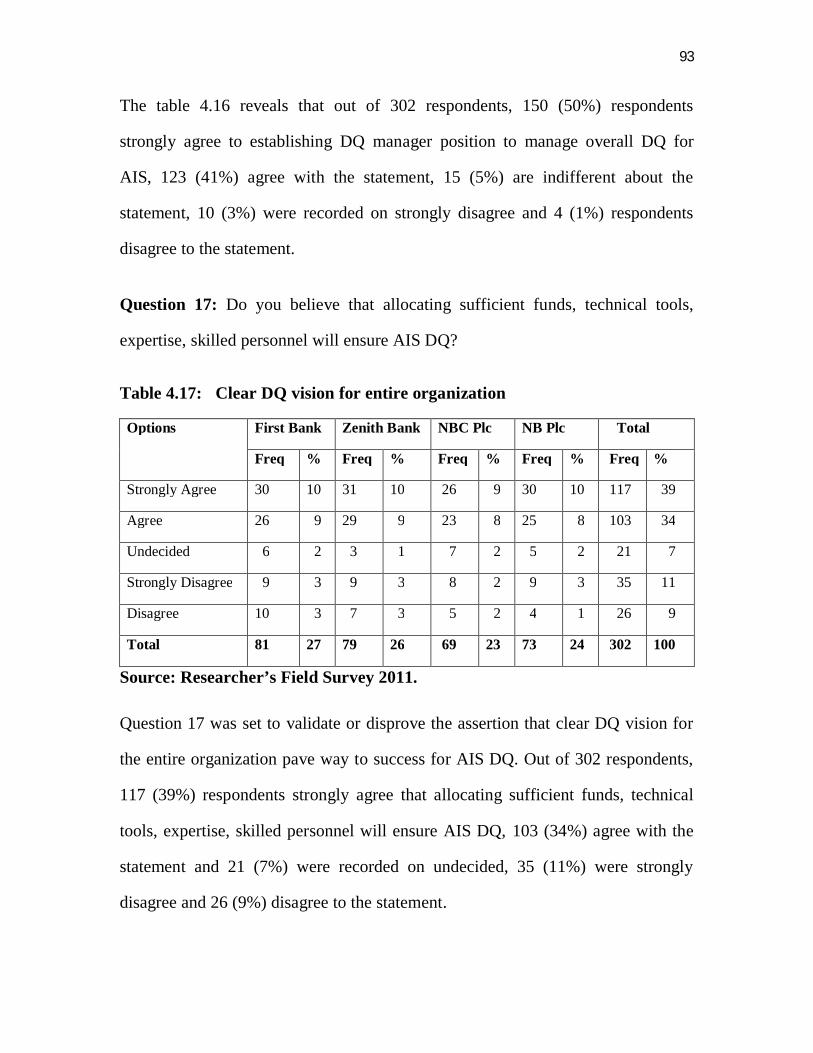
93
The table 4.16 reveals that out of 302 respondents, 150 (50%) respondents
strongly agree to establishing DQ manager position to manage overall DQ for
AIS, 123 (41%) agree with the statement, 15 (5%) are indifferent about the
statement, 10 (3%) were recorded on strongly disagree and 4 (1%) respondents
disagree to the statement.
Question 17: Do you believe that allocating sufficient funds, technical tools,
expertise, skilled personnel will ensure AIS DQ?
Table 4.17: Clear DQ vision for entire organization
Options First Bank Zenith Bank NBC Plc NB Plc Total
Freq % Freq % Freq % Freq % Freq %
Strongly Agree 30 10 31 10 26 9 30 10 117 39
Agree 26 9 29 9 23 8 25 8 103 34
Undecided 6 2 3 1 7 2 5 2 21 7
Strongly Disagree 9 3 9 3 8 2 9 3 35 11
Disagree 10 3 7 3 5 2 4 1 26 9
Total 81 27 79 26 69 23 73 24 302 100
Source: Researcher’s Field Survey 2011.
Question 17 was set to validate or disprove the assertion that clear DQ vision for
the entire organization pave way to success for AIS DQ. Out of 302 respondents,
117 (39%) respondents strongly agree that allocating sufficient funds, technical
tools, expertise, skilled personnel will ensure AIS DQ, 103 (34%) agree with the
statement and 21 (7%) were recorded on undecided, 35 (11%) were strongly
disagree and 26 (9%) disagree to the statement.
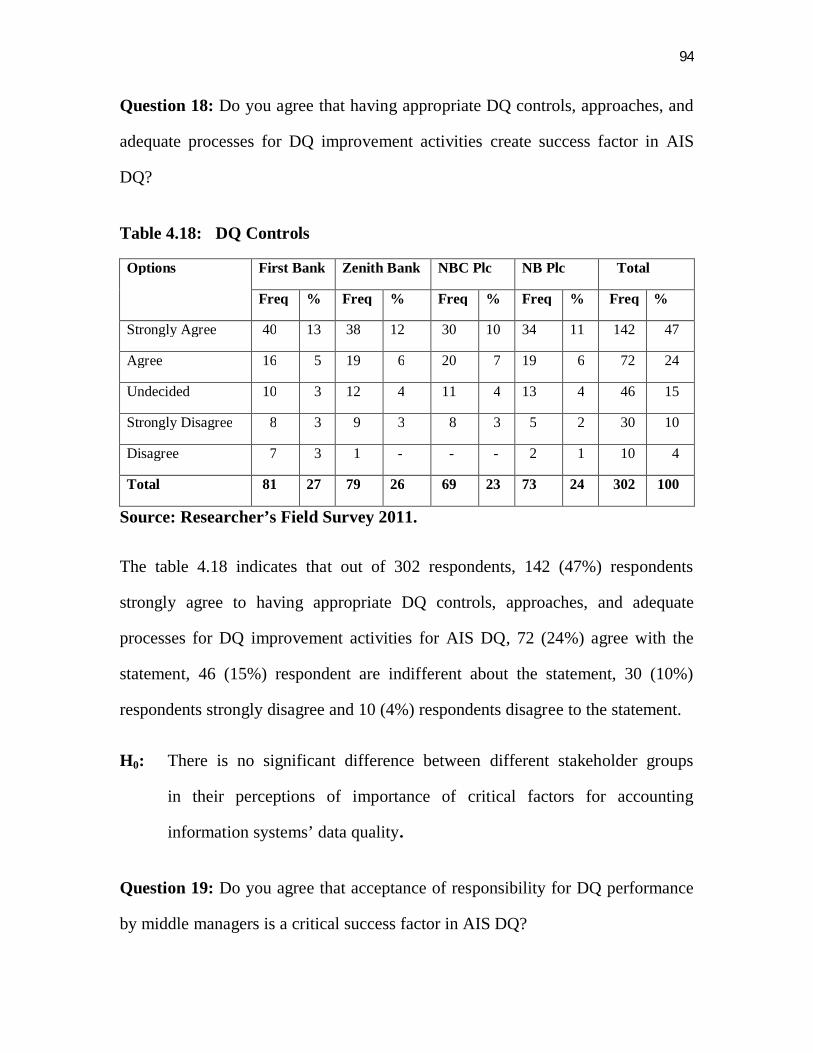
94
Question 18: Do you agree that having appropriate DQ controls, approaches, and
adequate processes for DQ improvement activities create success factor in AIS
DQ?
Table 4.18: DQ Controls
Options First Bank Zenith Bank NBC Plc NB Plc Total
Freq % Freq % Freq % Freq % Freq %
Strongly Agree 40 13 38 12 30 10 34 11 142 47
Agree 16 5 19 6 20 7 19 6 72 24
Undecided 10 3 12 4 11 4 13 4 46 15
Strongly Disagree 8 3 9 3 8 3 5 2 30 10
Disagree 7 3 1 - - - 2 1 10 4
Total 81 27 79 26 69 23 73 24 302 100
Source: Researcher’s Field Survey 2011.
The table 4.18 indicates that out of 302 respondents, 142 (47%) respondents
strongly agree to having appropriate DQ controls, approaches, and adequate
processes for DQ improvement activities for AIS DQ, 72 (24%) agree with the
statement, 46 (15%) respondent are indifferent about the statement, 30 (10%)
respondents strongly disagree and 10 (4%) respondents disagree to the statement.
H0: There is no significant difference between different stakeholder groups
in their perceptions of importance of critical factors for accounting
information systems’ data quality.
Question 19: Do you agree that acceptance of responsibility for DQ performance
by middle managers is a critical success factor in AIS DQ?
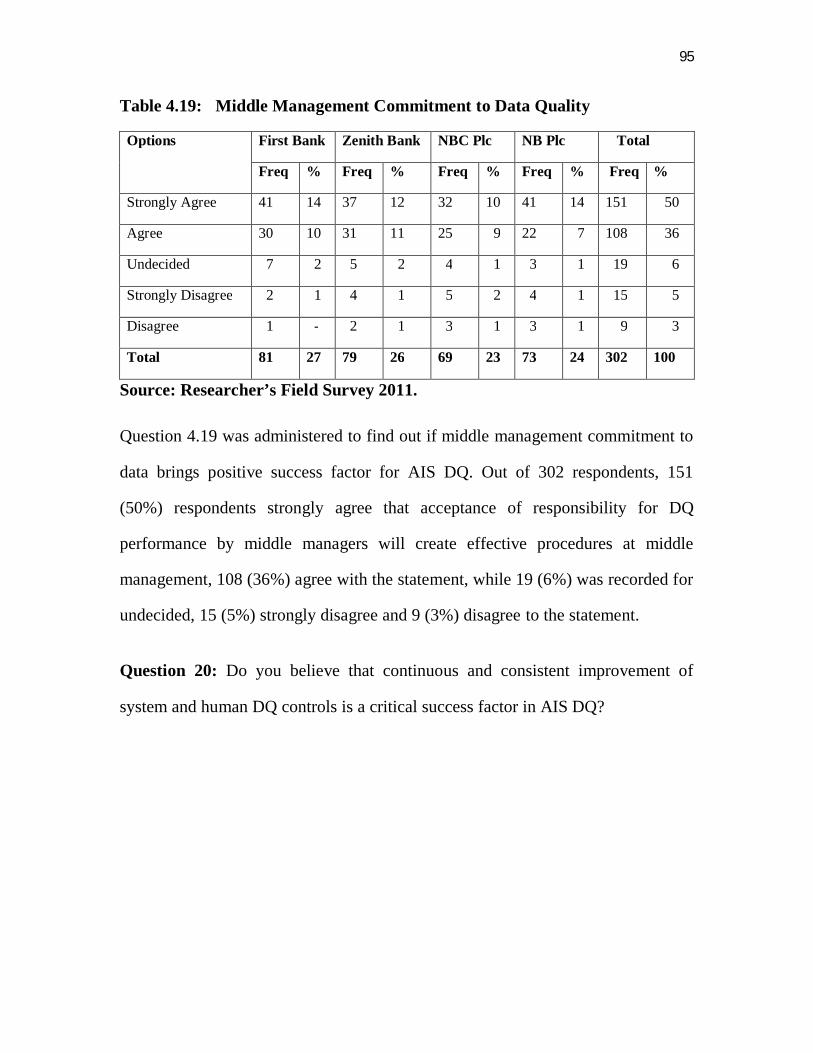
95
Table 4.19: Middle Management Commitment to Data Quality
Options First Bank Zenith Bank NBC Plc NB Plc Total
Freq % Freq % Freq % Freq % Freq %
Strongly Agree 41 14 37 12 32 10 41 14 151 50
Agree 30 10 31 11 25 9 22 7 108 36
Undecided 7 2 5 2 4 1 3 1 19 6
Strongly Disagree 2 1 4 1 5 2 4 1 15 5
Disagree 1 - 2 1 3 1 3 1 9 3
Total 81 27 79 26 69 23 73 24 302 100
Source: Researcher’s Field Survey 2011.
Question 4.19 was administered to find out if middle management commitment to
data brings positive success factor for AIS DQ. Out of 302 respondents, 151
(50%) respondents strongly agree that acceptance of responsibility for DQ
performance by middle managers will create effective procedures at middle
management, 108 (36%) agree with the statement, while 19 (6%) was recorded for
undecided, 15 (5%) strongly disagree and 9 (3%) disagree to the statement.
Question 20: Do you believe that continuous and consistent improvement of
system and human DQ controls is a critical success factor in AIS DQ?
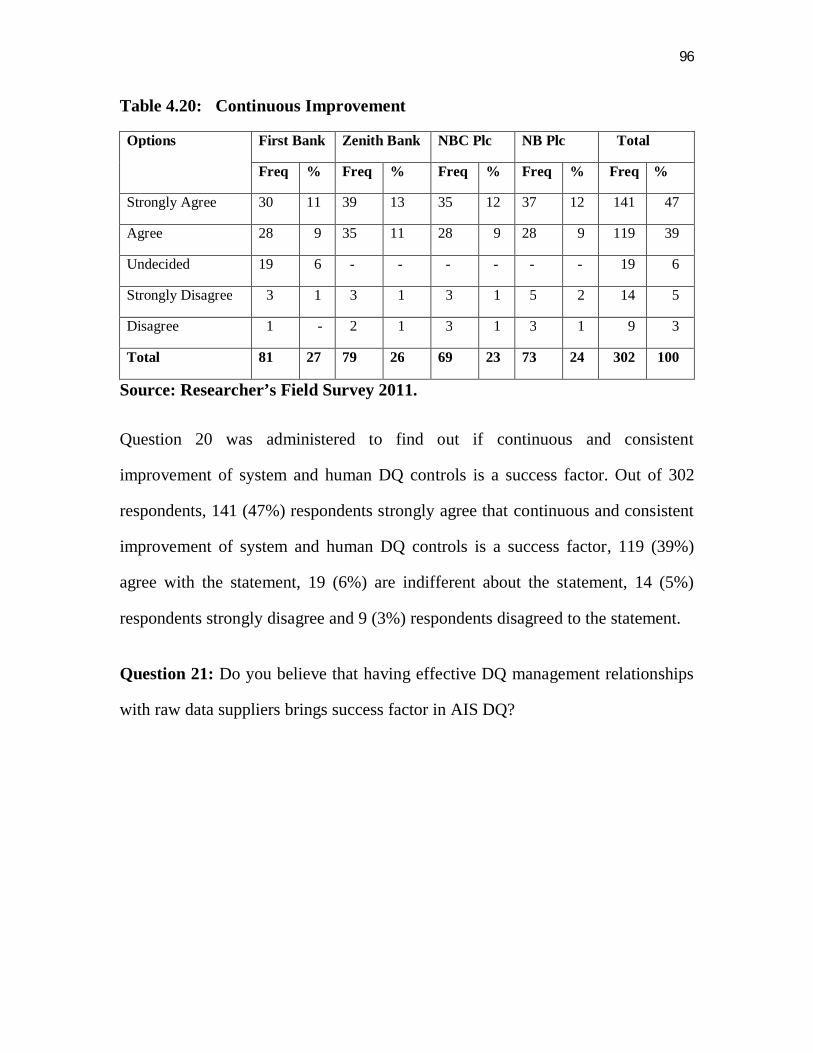
96
Table 4.20: Continuous Improvement
Options First Bank Zenith Bank NBC Plc NB Plc Total
Freq % Freq % Freq % Freq % Freq %
Strongly Agree 30 11 39 13 35 12 37 12 141 47
Agree 28 9 35 11 28 9 28 9 119 39
Undecided 19 6 - - - - - - 19 6
Strongly Disagree 3 1 3 1 3 1 5 2 14 5
Disagree 1 - 2 1 3 1 3 1 9 3
Total 81 27 79 26 69 23 73 24 302 100
Source: Researcher’s Field Survey 2011.
Question 20 was administered to find out if continuous and consistent
improvement of system and human DQ controls is a success factor. Out of 302
respondents, 141 (47%) respondents strongly agree that continuous and consistent
improvement of system and human DQ controls is a success factor, 119 (39%)
agree with the statement, 19 (6%) are indifferent about the statement, 14 (5%)
respondents strongly disagree and 9 (3%) respondents disagreed to the statement.
Question 21: Do you believe that having effective DQ management relationships
with raw data suppliers brings success factor in AIS DQ?
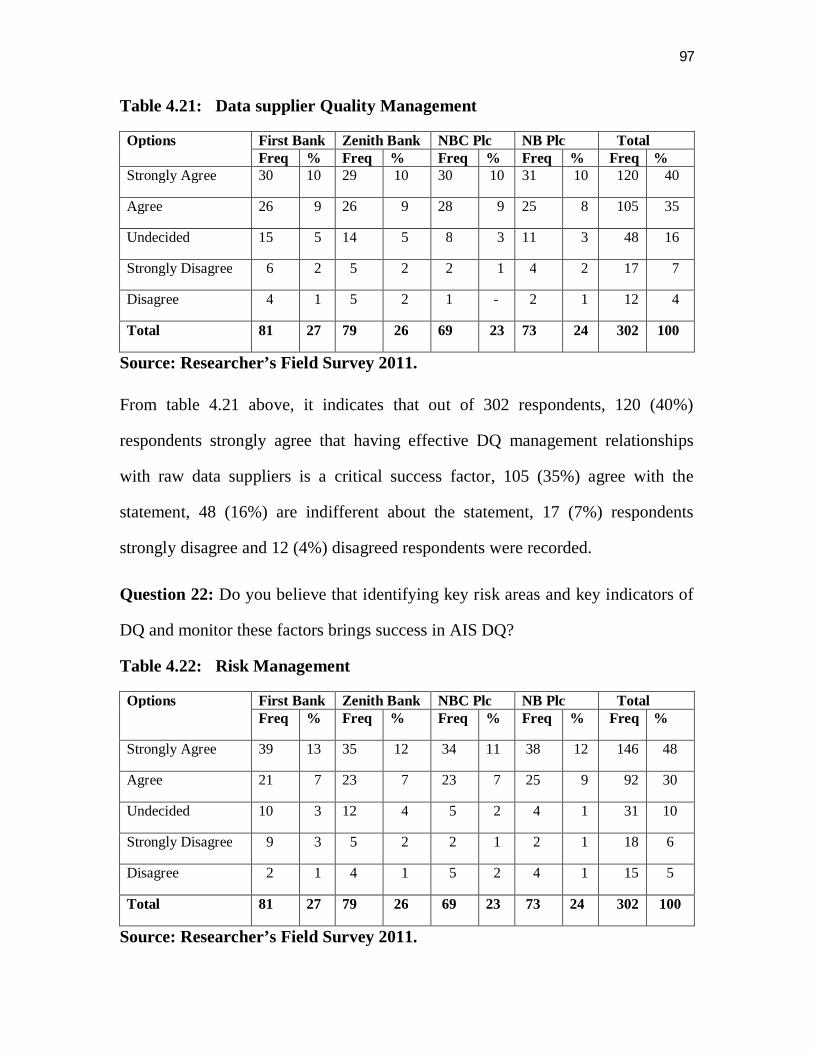
97
Table 4.21: Data supplier Quality Management
Options First Bank Zenith Bank NBC Plc NB Plc Total Freq % Freq % Freq % Freq % Freq %
Strongly Agree 30 10 29 10 30 10 31 10 120 40
Agree 26 9 26 9 28 9 25 8 105 35
Undecided 15 5 14 5 8 3 11 3 48 16
Strongly Disagree 6 2 5 2 2 1 4 2 17 7
Disagree 4 1 5 2 1 - 2 1 12 4
Total 81 27 79 26 69 23 73 24 302 100
Source: Researcher’s Field Survey 2011.
From table 4.21 above, it indicates that out of 302 respondents, 120 (40%)
respondents strongly agree that having effective DQ management relationships
with raw data suppliers is a critical success factor, 105 (35%) agree with the
statement, 48 (16%) are indifferent about the statement, 17 (7%) respondents
strongly disagree and 12 (4%) disagreed respondents were recorded.
Question 22: Do you believe that identifying key risk areas and key indicators of
DQ and monitor these factors brings success in AIS DQ?
Table 4.22: Risk Management
Options First Bank Zenith Bank NBC Plc NB Plc Total Freq % Freq % Freq % Freq % Freq %
Strongly Agree 39 13 35 12 34 11 38 12 146 48
Agree 21 7 23 7 23 7 25 9 92 30
Undecided 10 3 12 4 5 2 4 1 31 10
Strongly Disagree 9 3 5 2 2 1 2 1 18 6
Disagree 2 1 4 1 5 2 4 1 15 5
Total 81 27 79 26 69 23 73 24 302 100
Source: Researcher’s Field Survey 2011.
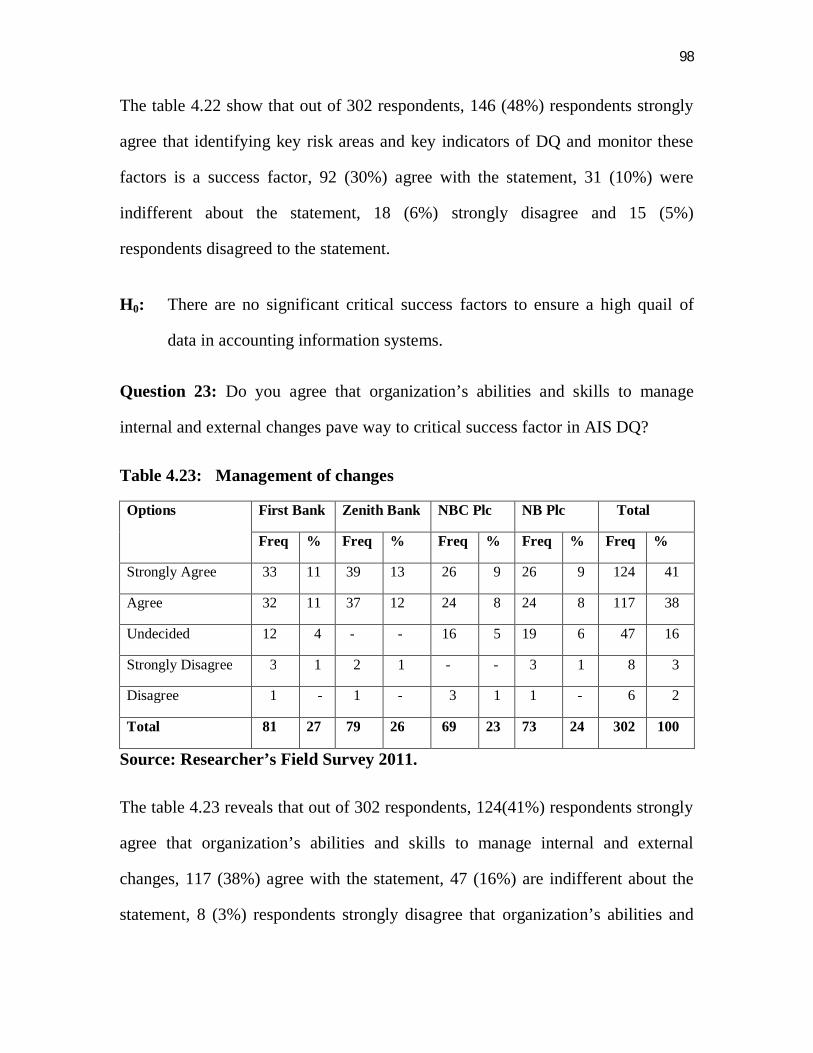
98
The table 4.22 show that out of 302 respondents, 146 (48%) respondents strongly
agree that identifying key risk areas and key indicators of DQ and monitor these
factors is a success factor, 92 (30%) agree with the statement, 31 (10%) were
indifferent about the statement, 18 (6%) strongly disagree and 15 (5%)
respondents disagreed to the statement.
H0: There are no significant critical success factors to ensure a high quail of
data in accounting information systems.
Question 23: Do you agree that organization’s abilities and skills to manage
internal and external changes pave way to critical success factor in AIS DQ?
Table 4.23: Management of changes
Options First Bank Zenith Bank NBC Plc NB Plc Total
Freq % Freq % Freq % Freq % Freq %
Strongly Agree 33 11 39 13 26 9 26 9 124 41
Agree 32 11 37 12 24 8 24 8 117 38
Undecided 12 4 - - 16 5 19 6 47 16
Strongly Disagree 3 1 2 1 - - 3 1 8 3
Disagree 1 - 1 - 3 1 1 - 6 2
Total 81 27 79 26 69 23 73 24 302 100
Source: Researcher’s Field Survey 2011.
The table 4.23 reveals that out of 302 respondents, 124(41%) respondents strongly
agree that organization’s abilities and skills to manage internal and external
changes, 117 (38%) agree with the statement, 47 (16%) are indifferent about the
statement, 8 (3%) respondents strongly disagree that organization’s abilities and
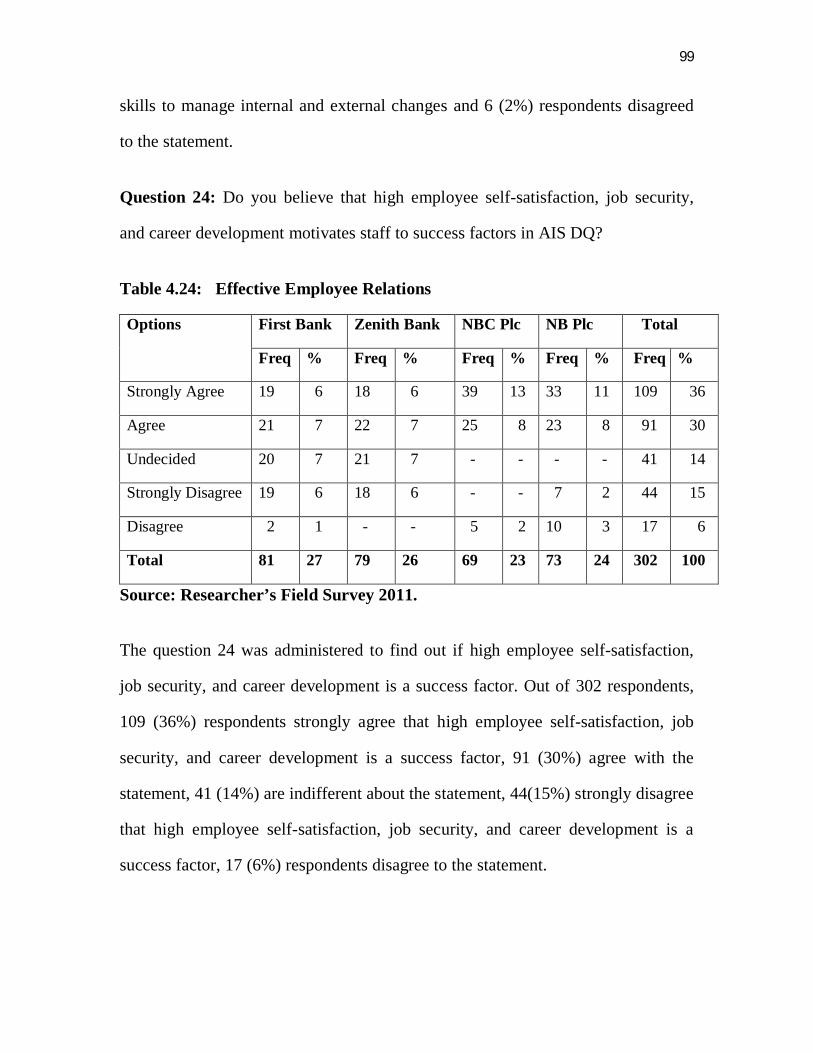
99
skills to manage internal and external changes and 6 (2%) respondents disagreed
to the statement.
Question 24: Do you believe that high employee self-satisfaction, job security,
and career development motivates staff to success factors in AIS DQ?
Table 4.24: Effective Employee Relations
Options First Bank Zenith Bank NBC Plc NB Plc Total
Freq % Freq % Freq % Freq % Freq %
Strongly Agree 19 6 18 6 39 13 33 11 109 36
Agree 21 7 22 7 25 8 23 8 91 30
Undecided 20 7 21 7 - - - - 41 14
Strongly Disagree 19 6 18 6 - - 7 2 44 15
Disagree 2 1 - - 5 2 10 3 17 6
Total 81 27 79 26 69 23 73 24 302 100
Source: Researcher’s Field Survey 2011.
The question 24 was administered to find out if high employee self-satisfaction,
job security, and career development is a success factor. Out of 302 respondents,
109 (36%) respondents strongly agree that high employee self-satisfaction, job
security, and career development is a success factor, 91 (30%) agree with the
statement, 41 (14%) are indifferent about the statement, 44(15%) strongly disagree
that high employee self-satisfaction, job security, and career development is a
success factor, 17 (6%) respondents disagree to the statement.
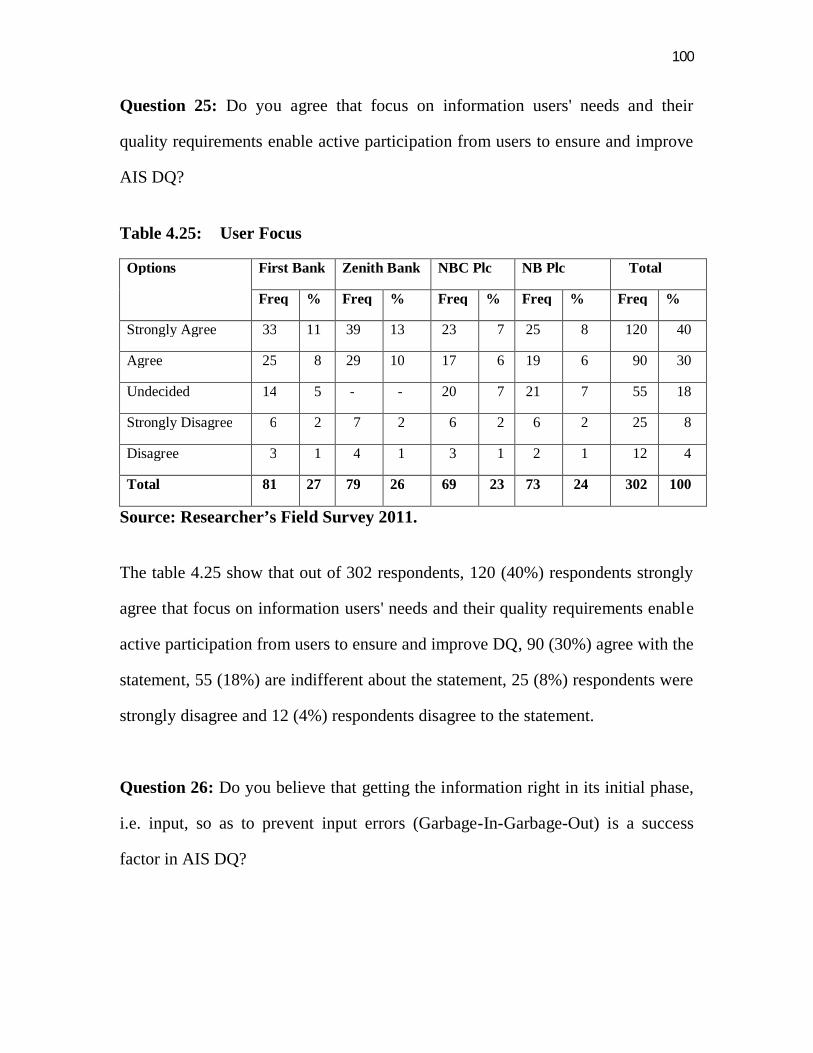
100
Question 25: Do you agree that focus on information users' needs and their
quality requirements enable active participation from users to ensure and improve
AIS DQ?
Table 4.25: User Focus
Options First Bank Zenith Bank NBC Plc NB Plc Total
Freq % Freq % Freq % Freq % Freq %
Strongly Agree 33 11 39 13 23 7 25 8 120 40
Agree 25 8 29 10 17 6 19 6 90 30
Undecided 14 5 - - 20 7 21 7 55 18
Strongly Disagree 6 2 7 2 6 2 6 2 25 8
Disagree 3 1 4 1 3 1 2 1 12 4
Total 81 27 79 26 69 23 73 24 302 100
Source: Researcher’s Field Survey 2011.
The table 4.25 show that out of 302 respondents, 120 (40%) respondents strongly
agree that focus on information users' needs and their quality requirements enable
active participation from users to ensure and improve DQ, 90 (30%) agree with the
statement, 55 (18%) are indifferent about the statement, 25 (8%) respondents were
strongly disagree and 12 (4%) respondents disagree to the statement.
Question 26: Do you believe that getting the information right in its initial phase,
i.e. input, so as to prevent input errors (Garbage-In-Garbage-Out) is a success
factor in AIS DQ?
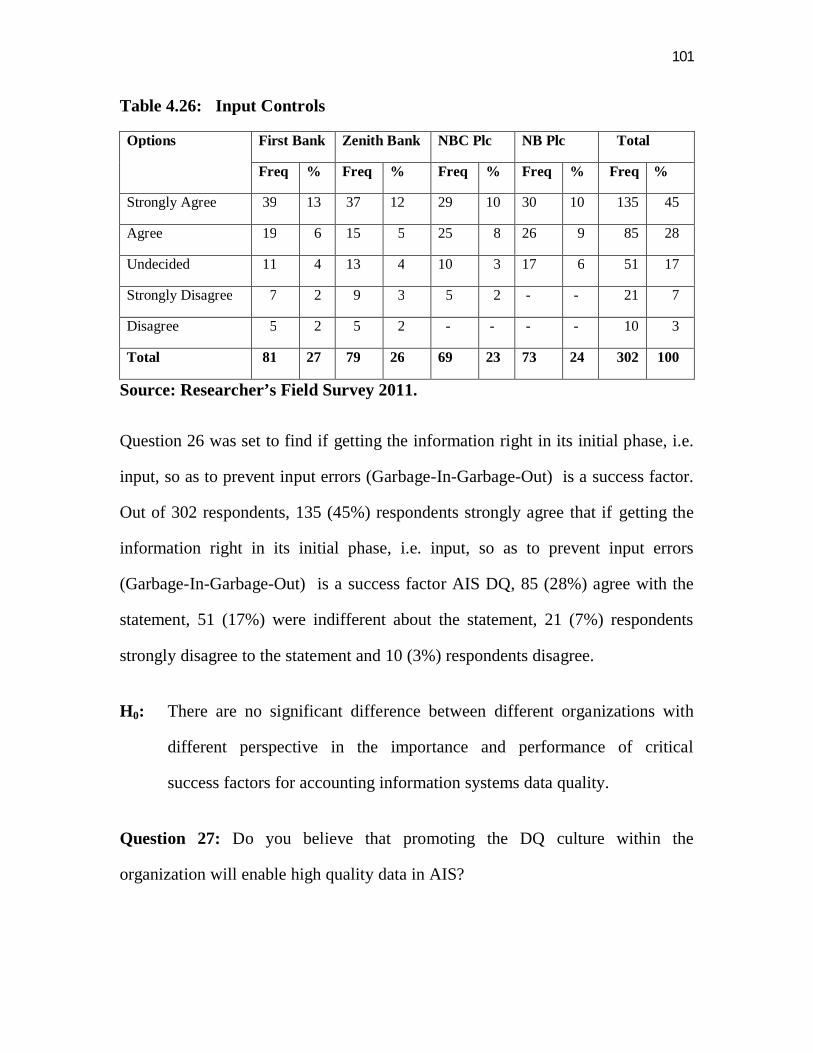
101
Table 4.26: Input Controls
Options First Bank Zenith Bank NBC Plc NB Plc Total
Freq % Freq % Freq % Freq % Freq %
Strongly Agree 39 13 37 12 29 10 30 10 135 45
Agree 19 6 15 5 25 8 26 9 85 28
Undecided 11 4 13 4 10 3 17 6 51 17
Strongly Disagree 7 2 9 3 5 2 - - 21 7
Disagree 5 2 5 2 - - - - 10 3
Total 81 27 79 26 69 23 73 24 302 100
Source: Researcher’s Field Survey 2011.
Question 26 was set to find if getting the information right in its initial phase, i.e.
input, so as to prevent input errors (Garbage-In-Garbage-Out) is a success factor.
Out of 302 respondents, 135 (45%) respondents strongly agree that if getting the
information right in its initial phase, i.e. input, so as to prevent input errors
(Garbage-In-Garbage-Out) is a success factor AIS DQ, 85 (28%) agree with the
statement, 51 (17%) were indifferent about the statement, 21 (7%) respondents
strongly disagree to the statement and 10 (3%) respondents disagree.
H0: There are no significant difference between different organizations with
different perspective in the importance and performance of critical
success factors for accounting information systems data quality.
Question 27: Do you believe that promoting the DQ culture within the
organization will enable high quality data in AIS?
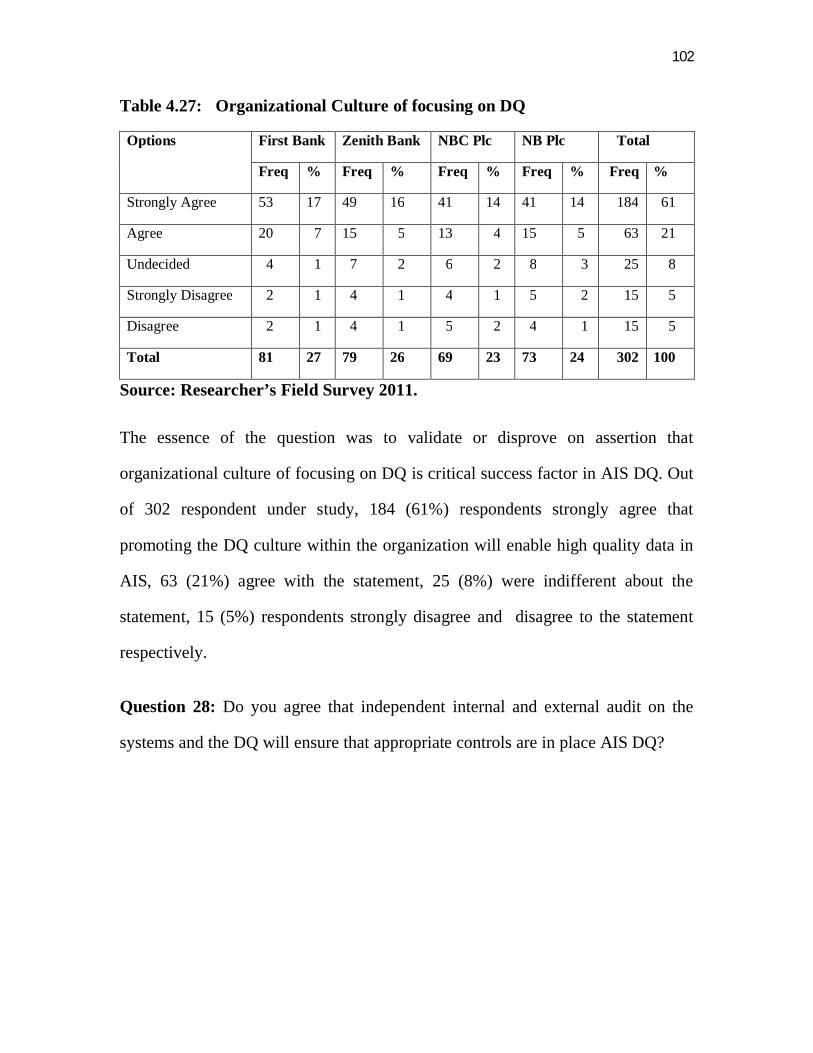
102
Table 4.27: Organizational Culture of focusing on DQ
Options First Bank Zenith Bank NBC Plc NB Plc Total
Freq % Freq % Freq % Freq % Freq %
Strongly Agree 53 17 49 16 41 14 41 14 184 61
Agree 20 7 15 5 13 4 15 5 63 21
Undecided 4 1 7 2 6 2 8 3 25 8
Strongly Disagree 2 1 4 1 4 1 5 2 15 5
Disagree 2 1 4 1 5 2 4 1 15 5
Total 81 27 79 26 69 23 73 24 302 100
Source: Researcher’s Field Survey 2011.
The essence of the question was to validate or disprove on assertion that
organizational culture of focusing on DQ is critical success factor in AIS DQ. Out
of 302 respondent under study, 184 (61%) respondents strongly agree that
promoting the DQ culture within the organization will enable high quality data in
AIS, 63 (21%) agree with the statement, 25 (8%) were indifferent about the
statement, 15 (5%) respondents strongly disagree and disagree to the statement
respectively.
Question 28: Do you agree that independent internal and external audit on the
systems and the DQ will ensure that appropriate controls are in place AIS DQ?
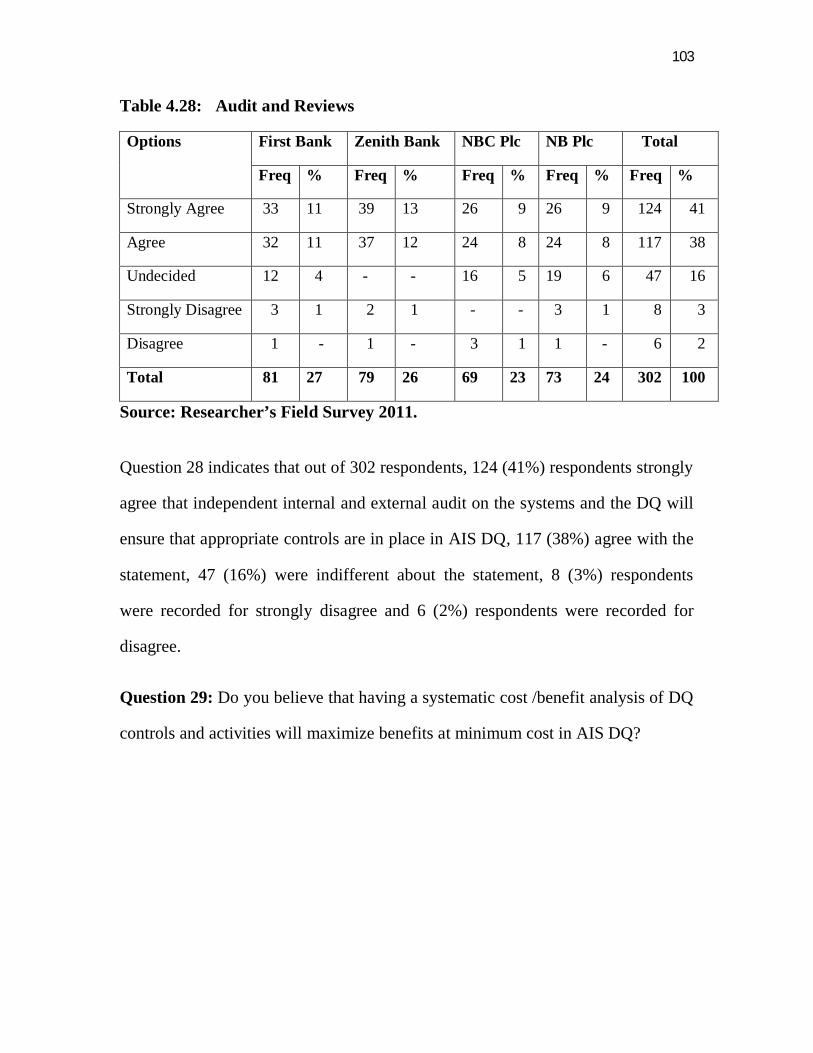
103
Table 4.28: Audit and Reviews
Options First Bank Zenith Bank NBC Plc NB Plc Total
Freq % Freq % Freq % Freq % Freq %
Strongly Agree 33 11 39 13 26 9 26 9 124 41
Agree 32 11 37 12 24 8 24 8 117 38
Undecided 12 4 - - 16 5 19 6 47 16
Strongly Disagree 3 1 2 1 - - 3 1 8 3
Disagree 1 - 1 - 3 1 1 - 6 2
Total 81 27 79 26 69 23 73 24 302 100
Source: Researcher’s Field Survey 2011.
Question 28 indicates that out of 302 respondents, 124 (41%) respondents strongly
agree that independent internal and external audit on the systems and the DQ will
ensure that appropriate controls are in place in AIS DQ, 117 (38%) agree with the
statement, 47 (16%) were indifferent about the statement, 8 (3%) respondents
were recorded for strongly disagree and 6 (2%) respondents were recorded for
disagree.
Question 29: Do you believe that having a systematic cost /benefit analysis of DQ
controls and activities will maximize benefits at minimum cost in AIS DQ?
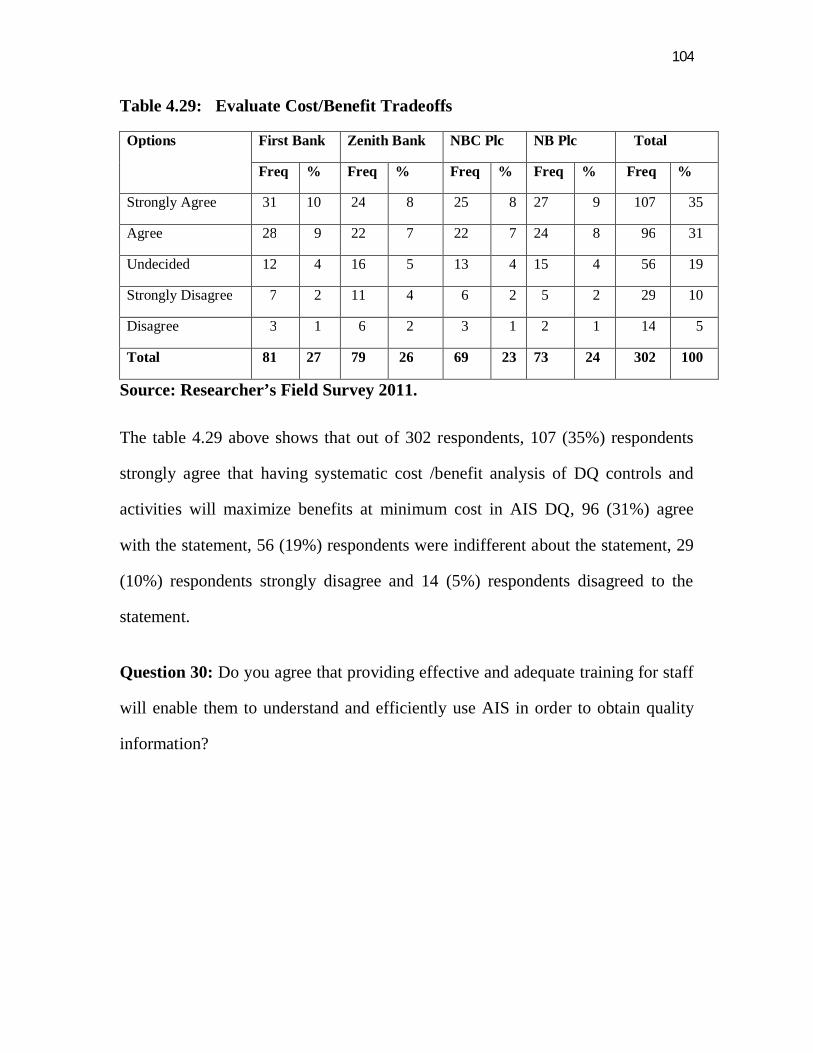
104
Table 4.29: Evaluate Cost/Benefit Tradeoffs
Options First Bank Zenith Bank NBC Plc NB Plc Total
Freq % Freq % Freq % Freq % Freq %
Strongly Agree 31 10 24 8 25 8 27 9 107 35
Agree 28 9 22 7 22 7 24 8 96 31
Undecided 12 4 16 5 13 4 15 4 56 19
Strongly Disagree 7 2 11 4 6 2 5 2 29 10
Disagree 3 1 6 2 3 1 2 1 14 5
Total 81 27 79 26 69 23 73 24 302 100
Source: Researcher’s Field Survey 2011.
The table 4.29 above shows that out of 302 respondents, 107 (35%) respondents
strongly agree that having systematic cost /benefit analysis of DQ controls and
activities will maximize benefits at minimum cost in AIS DQ, 96 (31%) agree
with the statement, 56 (19%) respondents were indifferent about the statement, 29
(10%) respondents strongly disagree and 14 (5%) respondents disagreed to the
statement.
Question 30: Do you agree that providing effective and adequate training for staff
will enable them to understand and efficiently use AIS in order to obtain quality
information?
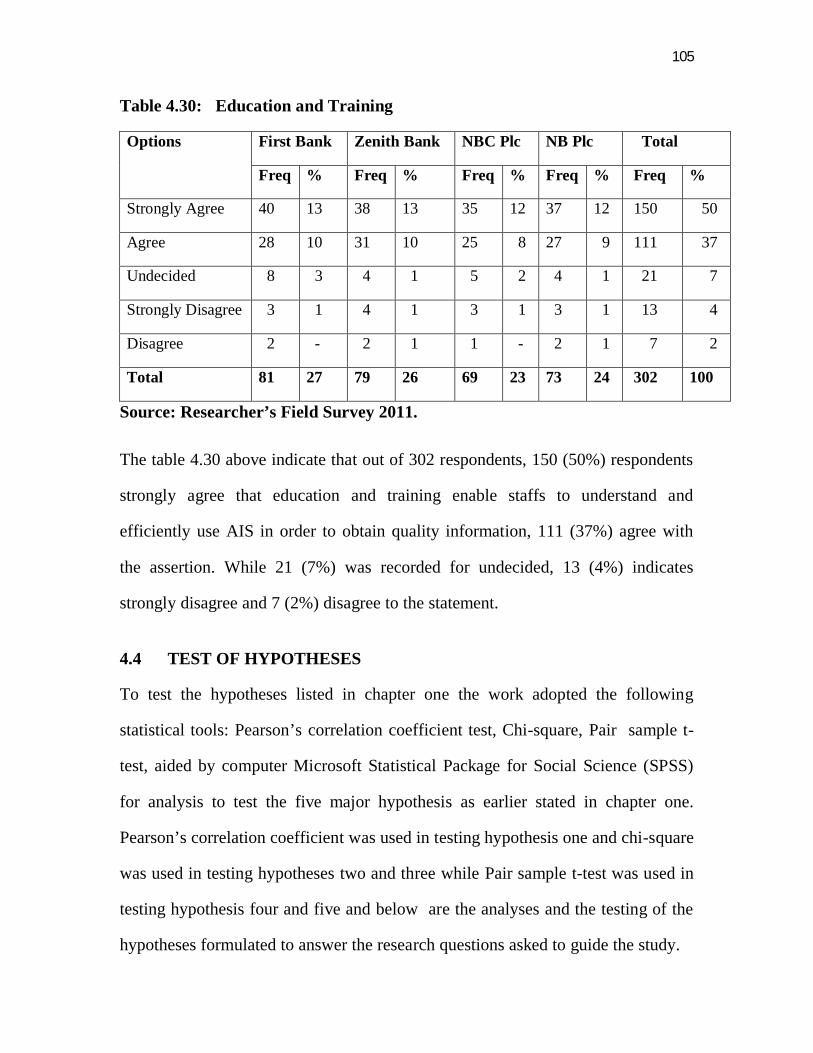
105
Table 4.30: Education and Training
Options First Bank Zenith Bank NBC Plc NB Plc Total
Freq % Freq % Freq % Freq % Freq %
Strongly Agree 40 13 38 13 35 12 37 12 150 50
Agree 28 10 31 10 25 8 27 9 111 37
Undecided 8 3 4 1 5 2 4 1 21 7
Strongly Disagree 3 1 4 1 3 1 3 1 13 4
Disagree 2 - 2 1 1 - 2 1 7 2
Total 81 27 79 26 69 23 73 24 302 100
Source: Researcher’s Field Survey 2011.
The table 4.30 above indicate that out of 302 respondents, 150 (50%) respondents
strongly agree that education and training enable staffs to understand and
efficiently use AIS in order to obtain quality information, 111 (37%) agree with
the assertion. While 21 (7%) was recorded for undecided, 13 (4%) indicates
strongly disagree and 7 (2%) disagree to the statement.
4.4 TEST OF HYPOTHESES
To test the hypotheses listed in chapter one the work adopted the following
statistical tools: Pearson’s correlation coefficient test, Chi-square, Pair sample t-
test, aided by computer Microsoft Statistical Package for Social Science (SPSS)
for analysis to test the five major hypothesis as earlier stated in chapter one.
Pearson’s correlation coefficient was used in testing hypothesis one and chi-square
was used in testing hypotheses two and three while Pair sample t-test was used in
testing hypothesis four and five and below are the analyses and the testing of the
hypotheses formulated to answer the research questions asked to guide the study.
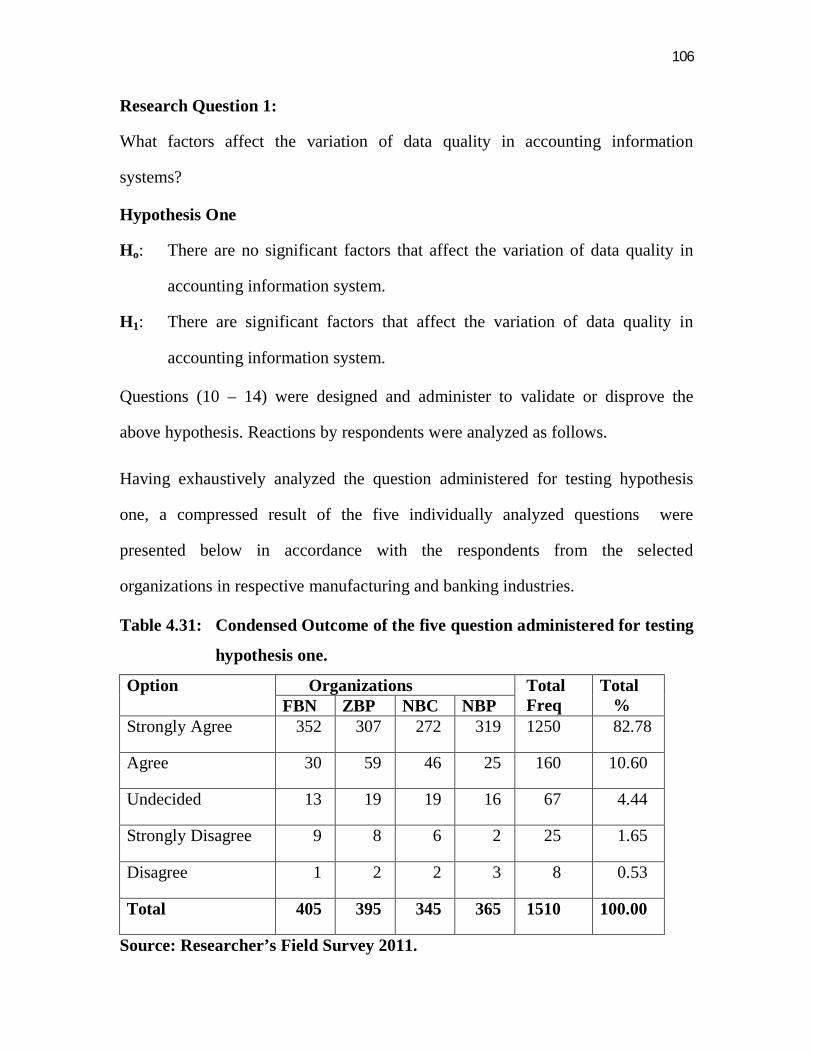
106
Research Question 1:
What factors affect the variation of data quality in accounting information
systems?
Hypothesis One
Ho: There are no significant factors that affect the variation of data quality in
accounting information system.
H1: There are significant factors that affect the variation of data quality in
accounting information system.
Questions (10 – 14) were designed and administer to validate or disprove the
above hypothesis. Reactions by respondents were analyzed as follows.
Having exhaustively analyzed the question administered for testing hypothesis
one, a compressed result of the five individually analyzed questions were
presented below in accordance with the respondents from the selected
organizations in respective manufacturing and banking industries.
Table 4.31: Condensed Outcome of the five question administered for testing
hypothesis one.
Option Organizations Total Freq
Total % FBN ZBP NBC NBP
Strongly Agree 352 307 272 319 1250 82.78
Agree 30 59 46 25 160 10.60
Undecided 13 19 19 16 67 4.44
Strongly Disagree 9 8 6 2 25 1.65
Disagree 1 2 2 3 8 0.53
Total 405 395 345 365 1510 100.00
Source: Researcher’s Field Survey 2011.
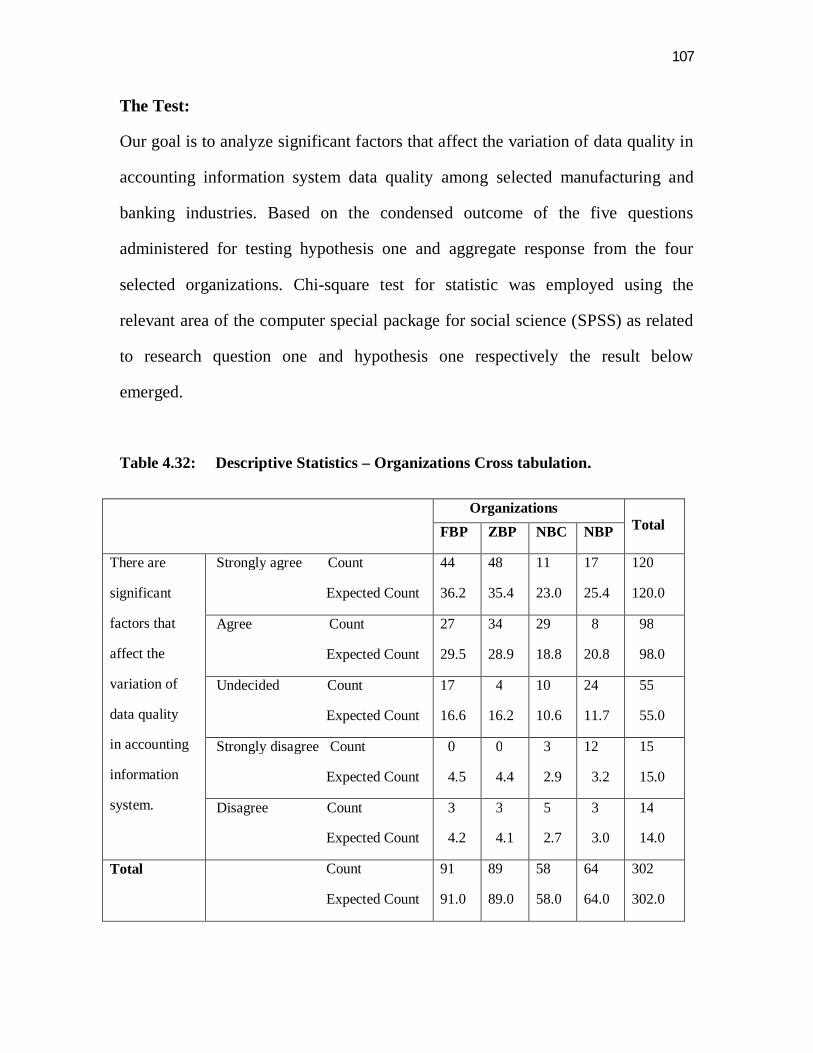
107
The Test:
Our goal is to analyze significant factors that affect the variation of data quality in
accounting information system data quality among selected manufacturing and
banking industries. Based on the condensed outcome of the five questions
administered for testing hypothesis one and aggregate response from the four
selected organizations. Chi-square test for statistic was employed using the
relevant area of the computer special package for social science (SPSS) as related
to research question one and hypothesis one respectively the result below
emerged.
Table 4.32: Descriptive Statistics – Organizations Cross tabulation.
Organizations Total FBP ZBP NBC NBP
There are
significant
factors that
affect the
variation of
data quality
in accounting
information
system.
Strongly agree Count
Expected Count
44
36.2
48
35.4
11
23.0
17
25.4
120
120.0
Agree Count
Expected Count
27
29.5
34
28.9
29
18.8
8
20.8
98
98.0
Undecided Count
Expected Count
17
16.6
4
16.2
10
10.6
24
11.7
55
55.0
Strongly disagree Count
Expected Count
0
4.5
0
4.4
3
2.9
12
3.2
15
15.0
Disagree Count
Expected Count
3
4.2
3
4.1
5
2.7
3
3.0
14
14.0
Total Count
Expected Count
91
91.0
89
89.0
58
58.0
64
64.0
302
302.0
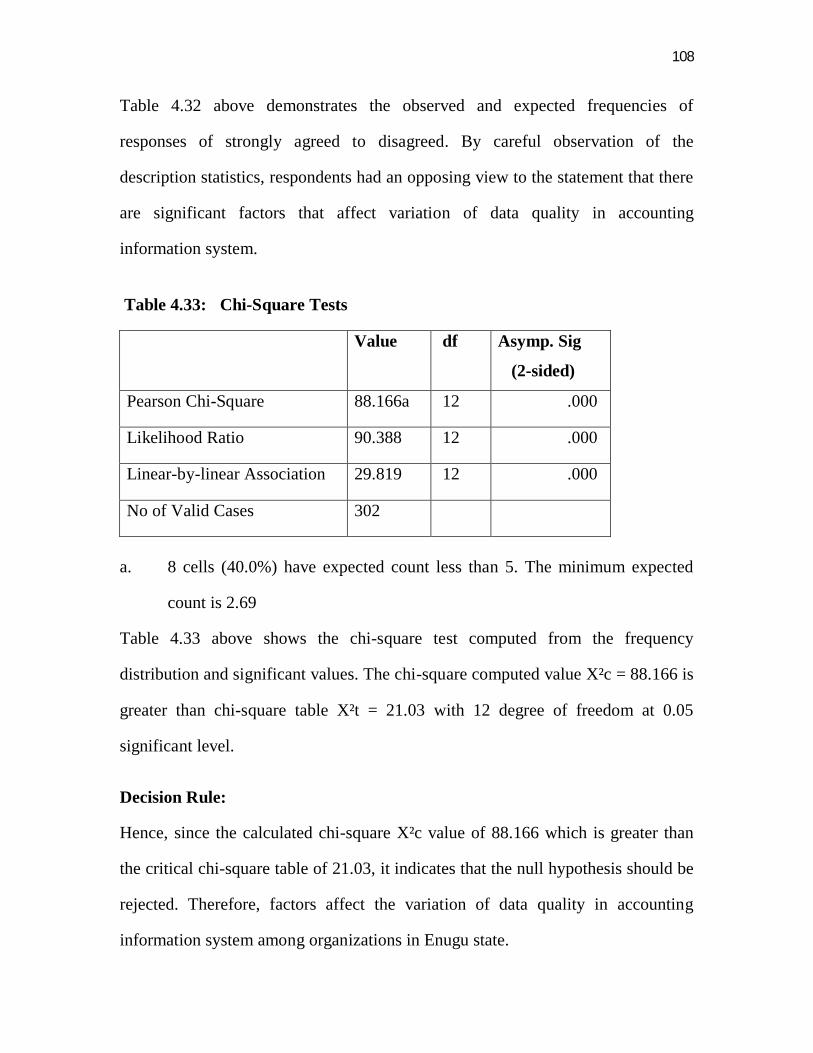
108
Table 4.32 above demonstrates the observed and expected frequencies of
responses of strongly agreed to disagreed. By careful observation of the
description statistics, respondents had an opposing view to the statement that there
are significant factors that affect variation of data quality in accounting
information system.
Table 4.33: Chi-Square Tests
Value df Asymp. Sig
(2-sided)
Pearson Chi-Square 88.166a 12 .000
Likelihood Ratio 90.388 12 .000
Linear-by-linear Association 29.819 12 .000
No of Valid Cases 302
a. 8 cells (40.0%) have expected count less than 5. The minimum expected
count is 2.69
Table 4.33 above shows the chi-square test computed from the frequency
distribution and significant values. The chi-square computed value X²c = 88.166 is
greater than chi-square table X²t = 21.03 with 12 degree of freedom at 0.05
significant level.
Decision Rule:
Hence, since the calculated chi-square X²c value of 88.166 which is greater than
the critical chi-square table of 21.03, it indicates that the null hypothesis should be
rejected. Therefore, factors affect the variation of data quality in accounting
information system among organizations in Enugu state.
109
Research Question 2:
Are there any variations with regard to the perceptions of importance of those
factors that affect data quality in accounting information systems?
Hypothesis Two
H0: There is no significant difference between the perceptions of importance of
critical factors for accounting information systems’ data quality, and actual
performance of those factors.
H1: There is a significant difference between the perceptions of importance of
critical factors for accounting information systems’ data quality, and actual
performance of those factors.
Questions (15 – 18) were considered relevant for the testing the validity of the
above hypothesis. The analysis of the various responses were compressed result of
four individually analyzed questions presented below in accordance with the
category of respondents and organizations respectively.
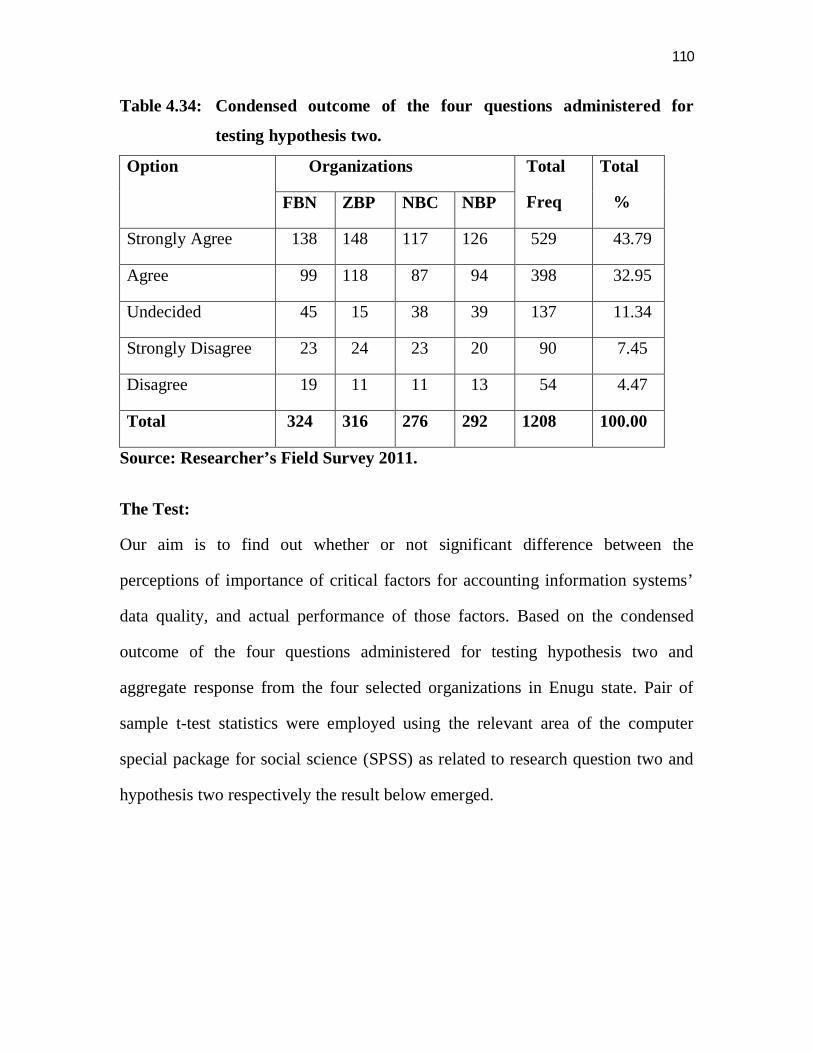
110
Table 4.34: Condensed outcome of the four questions administered for
testing hypothesis two.
Option Organizations Total
Freq
Total
% FBN ZBP NBC NBP
Strongly Agree 138 148 117 126 529 43.79
Agree 99 118 87 94 398 32.95
Undecided 45 15 38 39 137 11.34
Strongly Disagree 23 24 23 20 90 7.45
Disagree 19 11 11 13 54 4.47
Total 324 316 276 292 1208 100.00
Source: Researcher’s Field Survey 2011.
The Test:
Our aim is to find out whether or not significant difference between the
perceptions of importance of critical factors for accounting information systems’
data quality, and actual performance of those factors. Based on the condensed
outcome of the four questions administered for testing hypothesis two and
aggregate response from the four selected organizations in Enugu state. Pair of
sample t-test statistics were employed using the relevant area of the computer
special package for social science (SPSS) as related to research question two and
hypothesis two respectively the result below emerged.
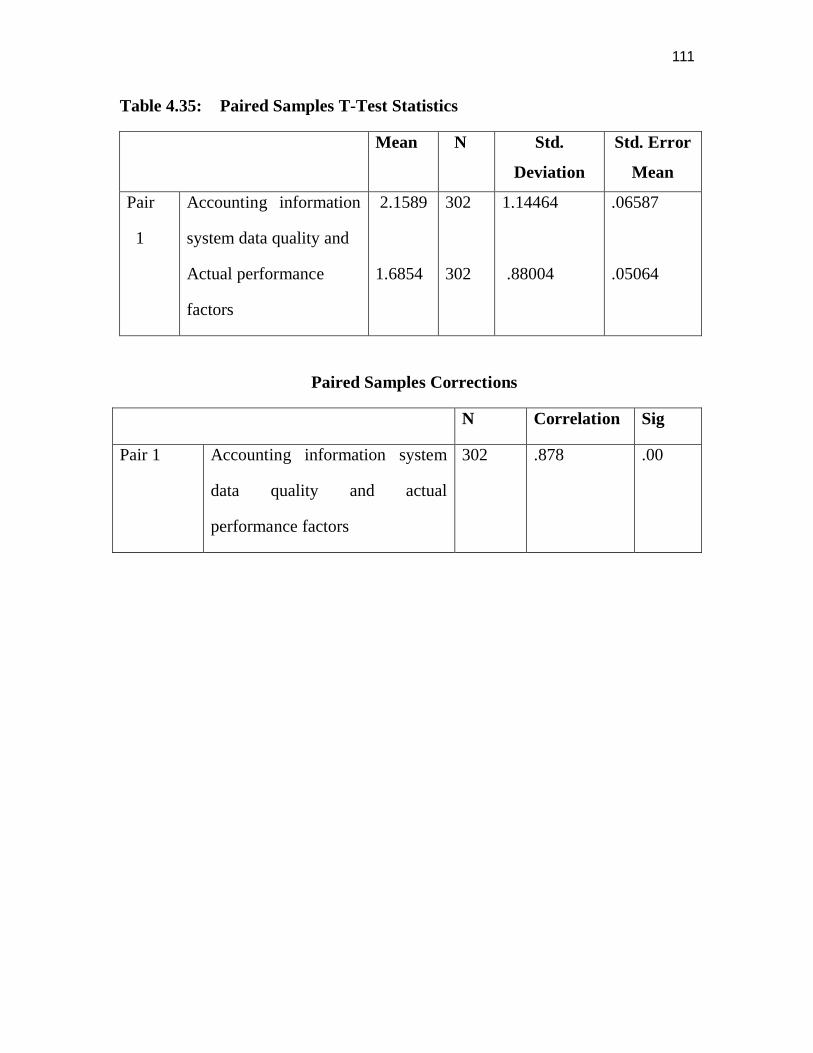
111
Table 4.35: Paired Samples T-Test Statistics
Mean N Std.
Deviation
Std. Error
Mean
Pair
1
Accounting information
system data quality and
Actual performance
factors
2.1589
1.6854
302
302
1.14464
.88004
.06587
.05064
Paired Samples Corrections
N Correlation Sig
Pair 1 Accounting information system
data quality and actual
performance factors
302 .878 .00
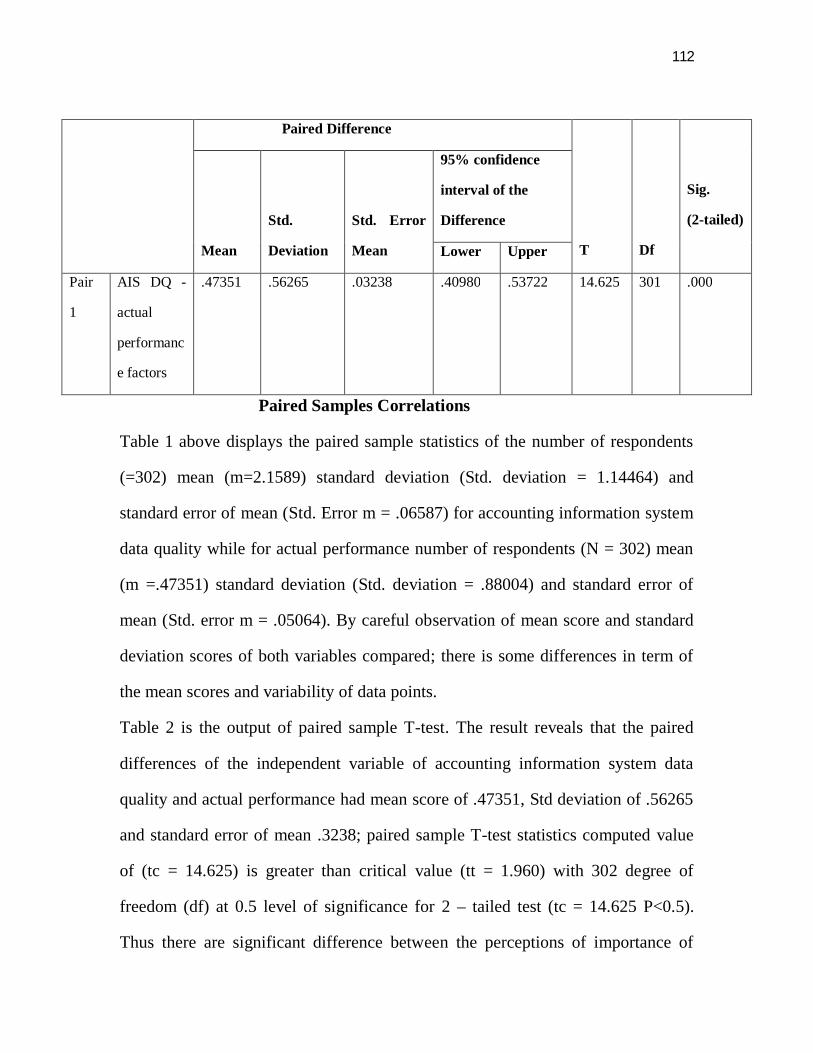
112
Paired Samples Correlations
Table 1 above displays the paired sample statistics of the number of respondents
(=302) mean (m=2.1589) standard deviation (Std. deviation = 1.14464) and
standard error of mean (Std. Error m = .06587) for accounting information system
data quality while for actual performance number of respondents (N = 302) mean
(m =.47351) standard deviation (Std. deviation = .88004) and standard error of
mean (Std. error m = .05064). By careful observation of mean score and standard
deviation scores of both variables compared; there is some differences in term of
the mean scores and variability of data points.
Table 2 is the output of paired sample T-test. The result reveals that the paired
differences of the independent variable of accounting information system data
quality and actual performance had mean score of .47351, Std deviation of .56265
and standard error of mean .3238; paired sample T-test statistics computed value
of (tc = 14.625) is greater than critical value (tt = 1.960) with 302 degree of
freedom (df) at 0.5 level of significance for 2 – tailed test (tc = 14.625 P<0.5).
Thus there are significant difference between the perceptions of importance of
Paired Difference
T
Df
Sig.
(2-tailed)
Mean
Std.
Deviation
Std. Error
Mean
95% confidence
interval of the
Difference
Lower Upper
Pair
1
AIS DQ -
actual
performanc
e factors
.47351 .56265 .03238 .40980 .53722 14.625 301 .000
113
critical factors for accounting information systems’ data quality, and actual
performance of those factors.
Research Question 3:
What are the perceptions of stakeholder groups in importance of critical factors for
accounting information systems?
Hypothesis Three
H0: There is no significant difference between different stakeholder groups in
their perceptions of importance of critical factors for accounting
information systems’ data quality.
H1: There is a significant difference between different stakeholder groups in
their perceptions of importance of critical factors for accounting
information systems’ data quality.
Having exhaustively analyzed the questions administered for testing hypothesis
three, a compressed result of the four individually analyzed questions (19-22) were
presented below.
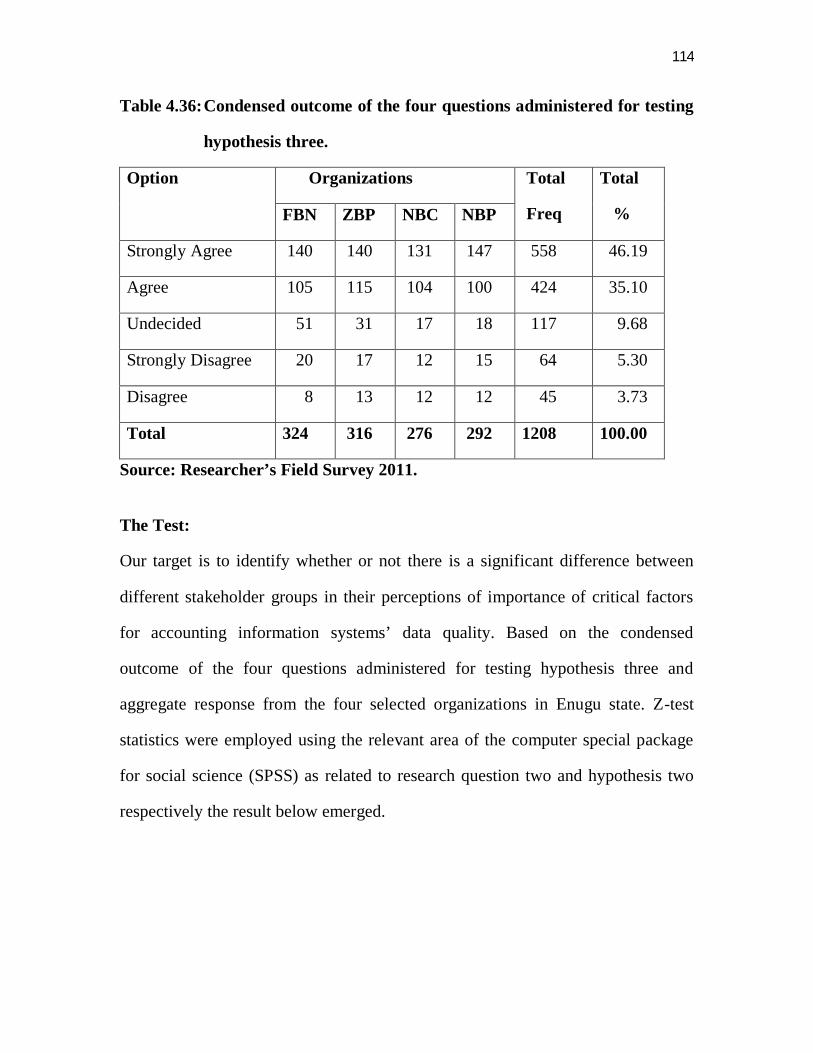
114
Table 4.36: Condensed outcome of the four questions administered for testing
hypothesis three.
Option Organizations Total
Freq
Total
% FBN ZBP NBC NBP
Strongly Agree 140 140 131 147 558 46.19
Agree 105 115 104 100 424 35.10
Undecided 51 31 17 18 117 9.68
Strongly Disagree 20 17 12 15 64 5.30
Disagree 8 13 12 12 45 3.73
Total 324 316 276 292 1208 100.00
Source: Researcher’s Field Survey 2011.
The Test:
Our target is to identify whether or not there is a significant difference between
different stakeholder groups in their perceptions of importance of critical factors
for accounting information systems’ data quality. Based on the condensed
outcome of the four questions administered for testing hypothesis three and
aggregate response from the four selected organizations in Enugu state. Z-test
statistics were employed using the relevant area of the computer special package
for social science (SPSS) as related to research question two and hypothesis two
respectively the result below emerged.
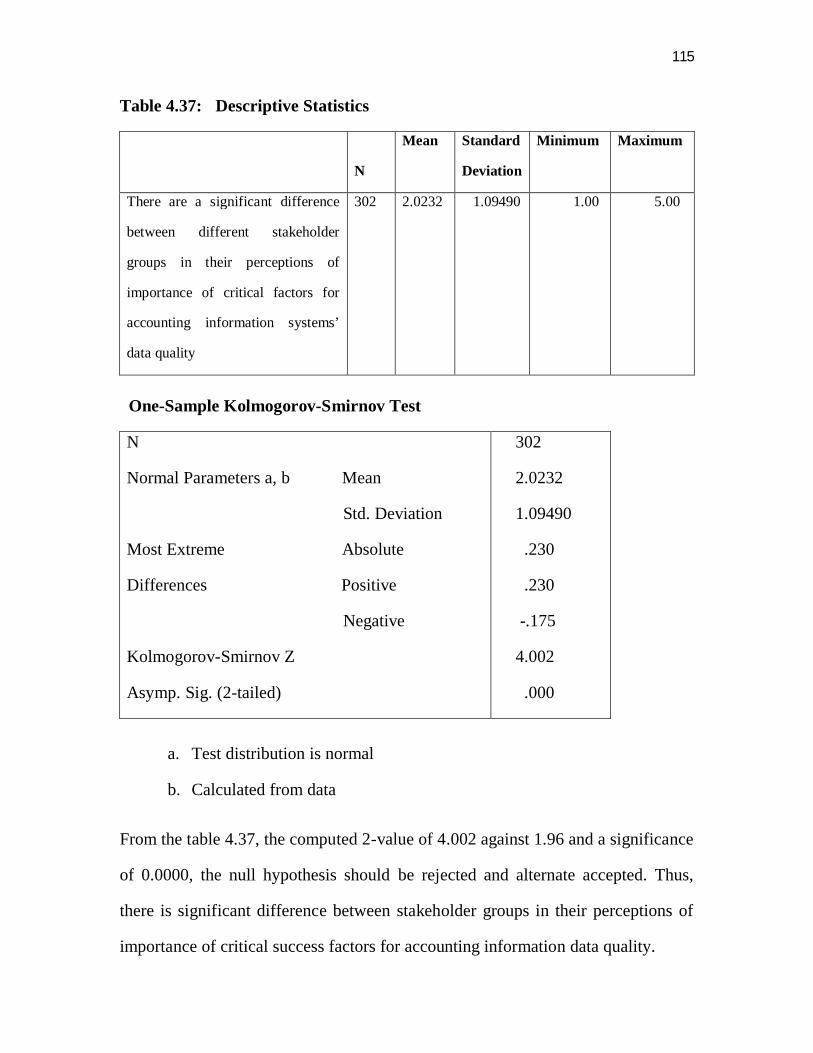
115
Table 4.37: Descriptive Statistics
N
Mean Standard
Deviation
Minimum Maximum
There are a significant difference
between different stakeholder
groups in their perceptions of
importance of critical factors for
accounting information systems’
data quality
302 2.0232 1.09490 1.00 5.00
One-Sample Kolmogorov-Smirnov Test
N
Normal Parameters a, b Mean
Std. Deviation
Most Extreme Absolute
Differences Positive
Negative
Kolmogorov-Smirnov Z
Asymp. Sig. (2-tailed)
302
2.0232
1.09490
.230
.230
-.175
4.002
.000
a. Test distribution is normal
b. Calculated from data
From the table 4.37, the computed 2-value of 4.002 against 1.96 and a significance
of 0.0000, the null hypothesis should be rejected and alternate accepted. Thus,
there is significant difference between stakeholder groups in their perceptions of
importance of critical success factors for accounting information data quality.
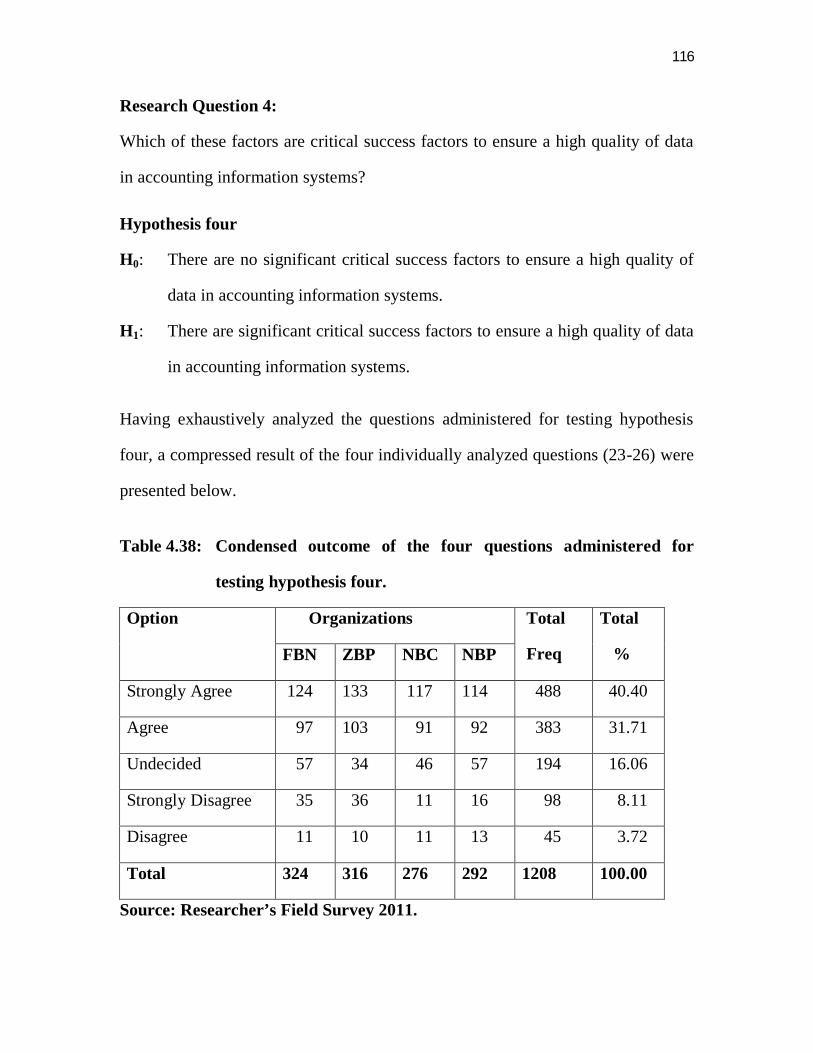
116
Research Question 4:
Which of these factors are critical success factors to ensure a high quality of data
in accounting information systems?
Hypothesis four
H0: There are no significant critical success factors to ensure a high quality of
data in accounting information systems.
H1: There are significant critical success factors to ensure a high quality of data
in accounting information systems.
Having exhaustively analyzed the questions administered for testing hypothesis
four, a compressed result of the four individually analyzed questions (23-26) were
presented below.
Table 4.38: Condensed outcome of the four questions administered for
testing hypothesis four.
Option Organizations Total
Freq
Total
% FBN ZBP NBC NBP
Strongly Agree 124 133 117 114 488 40.40
Agree 97 103 91 92 383 31.71
Undecided 57 34 46 57 194 16.06
Strongly Disagree 35 36 11 16 98 8.11
Disagree 11 10 11 13 45 3.72
Total 324 316 276 292 1208 100.00
Source: Researcher’s Field Survey 2011.
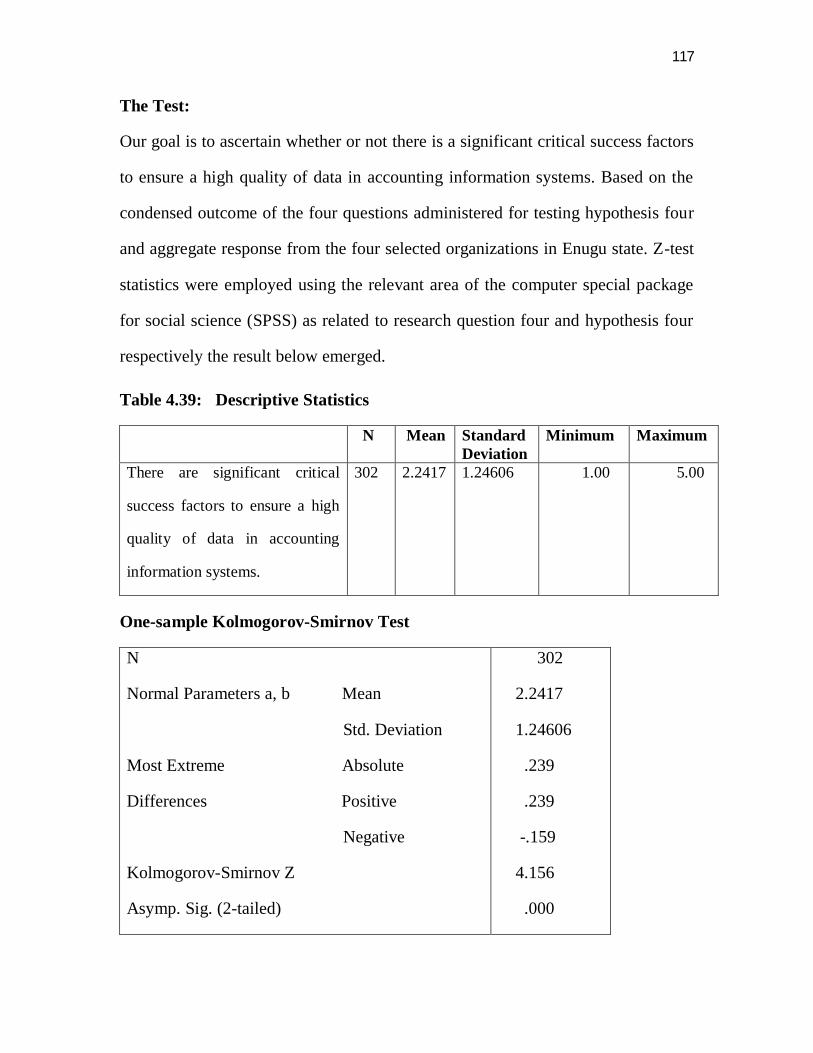
117
The Test:
Our goal is to ascertain whether or not there is a significant critical success factors
to ensure a high quality of data in accounting information systems. Based on the
condensed outcome of the four questions administered for testing hypothesis four
and aggregate response from the four selected organizations in Enugu state. Z-test
statistics were employed using the relevant area of the computer special package
for social science (SPSS) as related to research question four and hypothesis four
respectively the result below emerged.
Table 4.39: Descriptive Statistics
N Mean Standard Deviation
Minimum Maximum
There are significant critical
success factors to ensure a high
quality of data in accounting
information systems.
302 2.2417 1.24606 1.00 5.00
One-sample Kolmogorov-Smirnov Test
N
Normal Parameters a, b Mean
Std. Deviation
Most Extreme Absolute
Differences Positive
Negative
Kolmogorov-Smirnov Z
Asymp. Sig. (2-tailed)
302
2.2417
1.24606
.239
.239
-.159
4.156
.000
118
a. Test distribution is Normal.
b. Calculated from data.
From the table 4.39, the computed Z-value of 4.156 against 1.96 and a
significance of 0.000, the null hypothesis should be rejected and alternate
accepted. Thus, there are significant critical success factors to ensure a high
quality of data in accounting information systems among organizations in Enugu
state.
Research Question 5:
What are organizations perspective in the importance and performance of critical
success factors for accounting information system data quality?
Hypothesis Five
H0: Different organizations have the same perspective in the importance and
performance of critical success factors for accounting information systems
data quality.
H1: Difference between have different perspectives in the importance and
performance of critical success factors for accounting information systems
data quality.
Having exhaustively analyzed the questions administered for testing hypothesis
four, a compressed result of the four individually analyzed questions (27-30) were
presented below.

119
Table 4.40: Condensed outcome of the four questions administered for
testing hypothesis five.
Option Organizations Total
Freq
Total
% FBN ZBP NBC NBP
Strongly Agree 157 150 127 131 565 46.77
Agree 108 105 84 90 387 32.04
Undecided 36 27 40 46 149 12.33
Strongly Disagree 15 21 13 16 65 5.38
Disagree 8 13 12 9 42 3.48
Total 324 316 276 292 1208 100.00
Source: Researcher’s Field Survey 2011.
The Test:
Our goal is to determine whether or not different organizations have different
perspectives in the importance and performance of critical success factors for
accounting information systems data quality. Based on the condensed outcome of
the four questions administered for testing hypothesis five and aggregate response
from the four selected organizations in Enugu state. Chi-square and T-test
statistics were employed using the relevant area of the computer special package
for social science (SPSS) as related to research question five and hypothesis five
respectively the result below emerged.
Organizations
Total
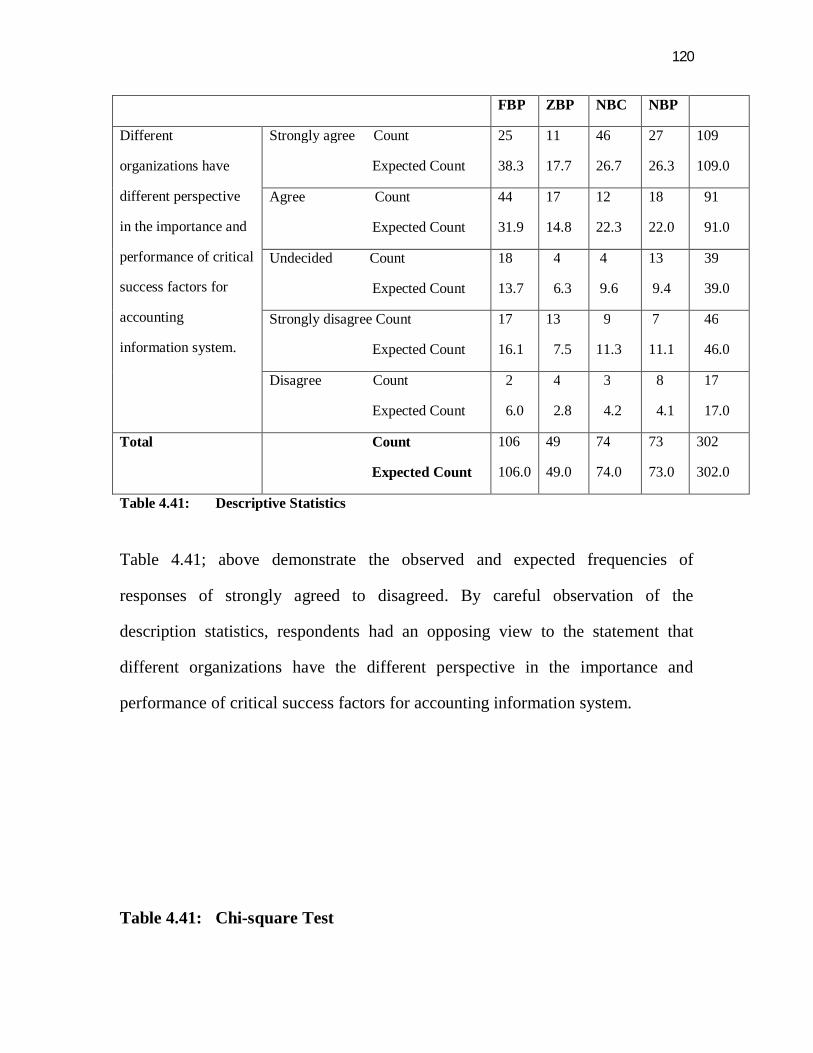
120
Table 4.41: Descriptive Statistics
Table 4.41; above demonstrate the observed and expected frequencies of
responses of strongly agreed to disagreed. By careful observation of the
description statistics, respondents had an opposing view to the statement that
different organizations have the different perspective in the importance and
performance of critical success factors for accounting information system.
Table 4.41: Chi-square Test
FBP ZBP NBC NBP
Different
organizations have
different perspective
in the importance and
performance of critical
success factors for
accounting
information system.
Strongly agree Count
Expected Count
25
38.3
11
17.7
46
26.7
27
26.3
109
109.0
Agree Count
Expected Count
44
31.9
17
14.8
12
22.3
18
22.0
91
91.0
Undecided Count
Expected Count
18
13.7
4
6.3
4
9.6
13
9.4
39
39.0
Strongly disagree Count
Expected Count
17
16.1
13
7.5
9
11.3
7
11.1
46
46.0
Disagree Count
Expected Count
2
6.0
4
2.8
3
4.2
8
4.1
17
17.0
Total Count
Expected Count
106
106.0
49
49.0
74
74.0
73
73.0
302
302.0
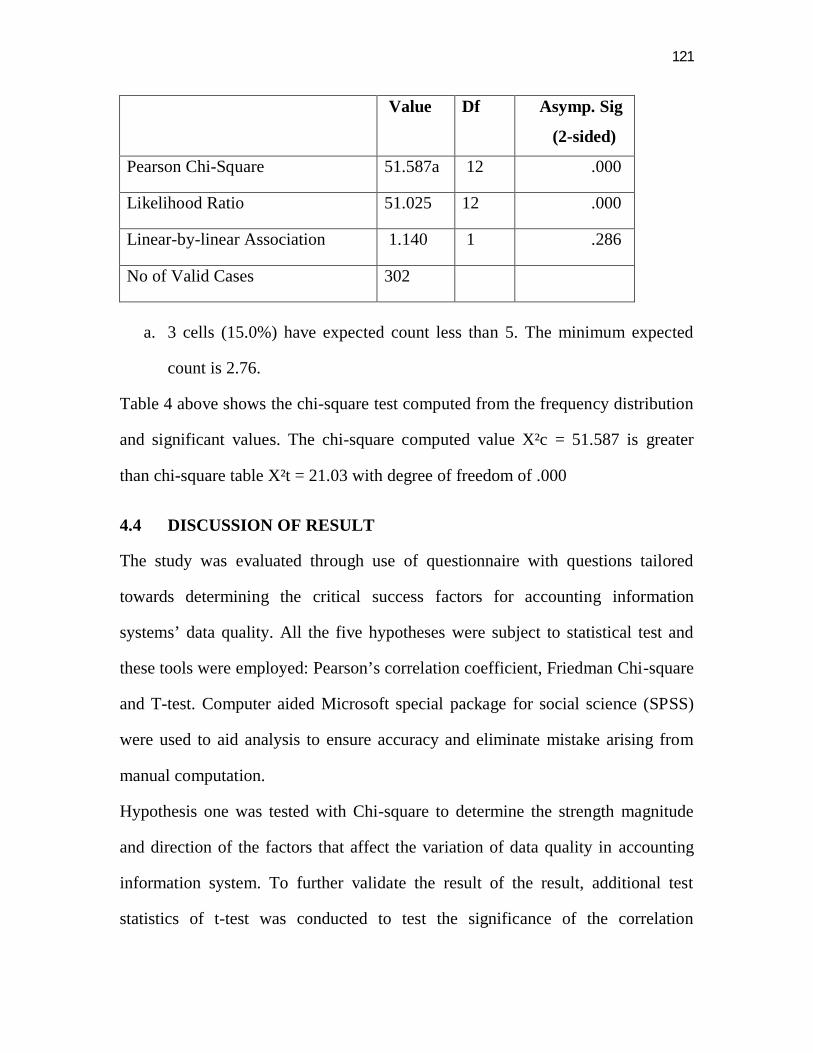
121
Value Df Asymp. Sig
(2-sided)
Pearson Chi-Square 51.587a 12 .000
Likelihood Ratio 51.025 12 .000
Linear-by-linear Association 1.140 1 .286
No of Valid Cases 302
a. 3 cells (15.0%) have expected count less than 5. The minimum expected
count is 2.76.
Table 4 above shows the chi-square test computed from the frequency distribution
and significant values. The chi-square computed value X²c = 51.587 is greater
than chi-square table X²t = 21.03 with degree of freedom of .000
4.4 DISCUSSION OF RESULT
The study was evaluated through use of questionnaire with questions tailored
towards determining the critical success factors for accounting information
systems’ data quality. All the five hypotheses were subject to statistical test and
these tools were employed: Pearson’s correlation coefficient, Friedman Chi-square
and T-test. Computer aided Microsoft special package for social science (SPSS)
were used to aid analysis to ensure accuracy and eliminate mistake arising from
manual computation.
Hypothesis one was tested with Chi-square to determine the strength magnitude
and direction of the factors that affect the variation of data quality in accounting
information system. To further validate the result of the result, additional test
statistics of t-test was conducted to test the significance of the correlation
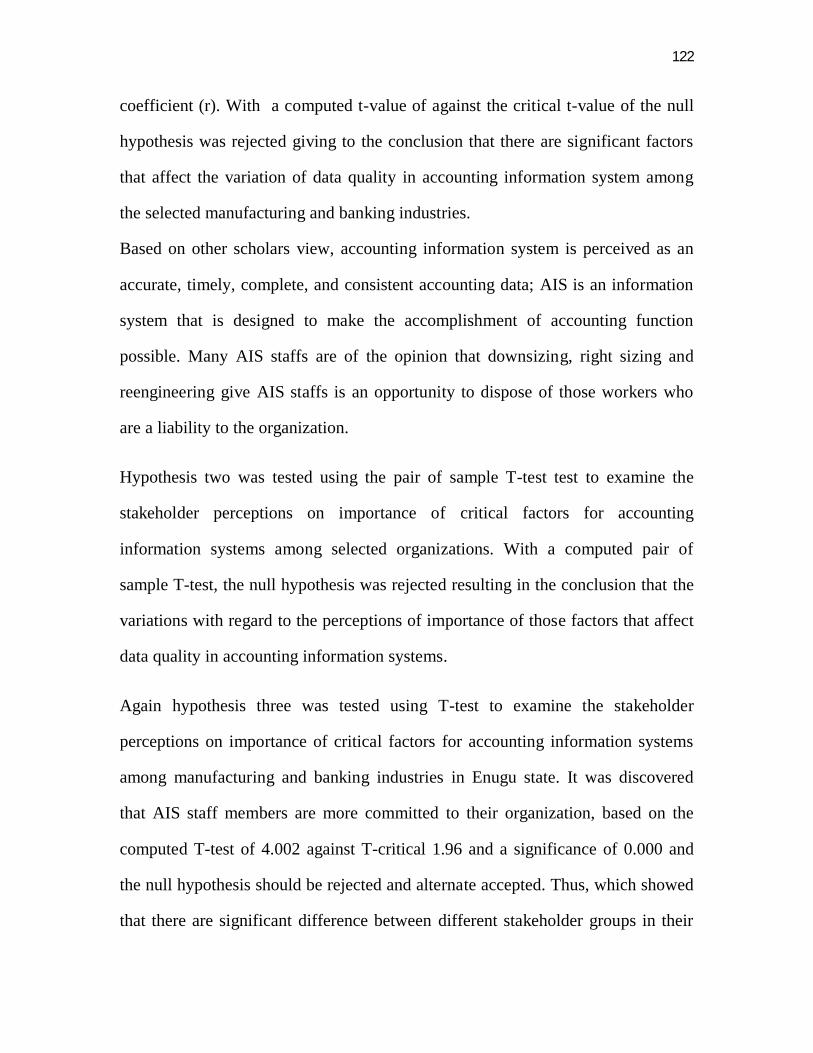
122
coefficient (r). With a computed t-value of against the critical t-value of the null
hypothesis was rejected giving to the conclusion that there are significant factors
that affect the variation of data quality in accounting information system among
the selected manufacturing and banking industries.
Based on other scholars view, accounting information system is perceived as an
accurate, timely, complete, and consistent accounting data; AIS is an information
system that is designed to make the accomplishment of accounting function
possible. Many AIS staffs are of the opinion that downsizing, right sizing and
reengineering give AIS staffs is an opportunity to dispose of those workers who
are a liability to the organization.
Hypothesis two was tested using the pair of sample T-test test to examine the
stakeholder perceptions on importance of critical factors for accounting
information systems among selected organizations. With a computed pair of
sample T-test, the null hypothesis was rejected resulting in the conclusion that the
variations with regard to the perceptions of importance of those factors that affect
data quality in accounting information systems.
Again hypothesis three was tested using T-test to examine the stakeholder
perceptions on importance of critical factors for accounting information systems
among manufacturing and banking industries in Enugu state. It was discovered
that AIS staff members are more committed to their organization, based on the
computed T-test of 4.002 against T-critical 1.96 and a significance of 0.000 and
the null hypothesis should be rejected and alternate accepted. Thus, which showed
that there are significant difference between different stakeholder groups in their
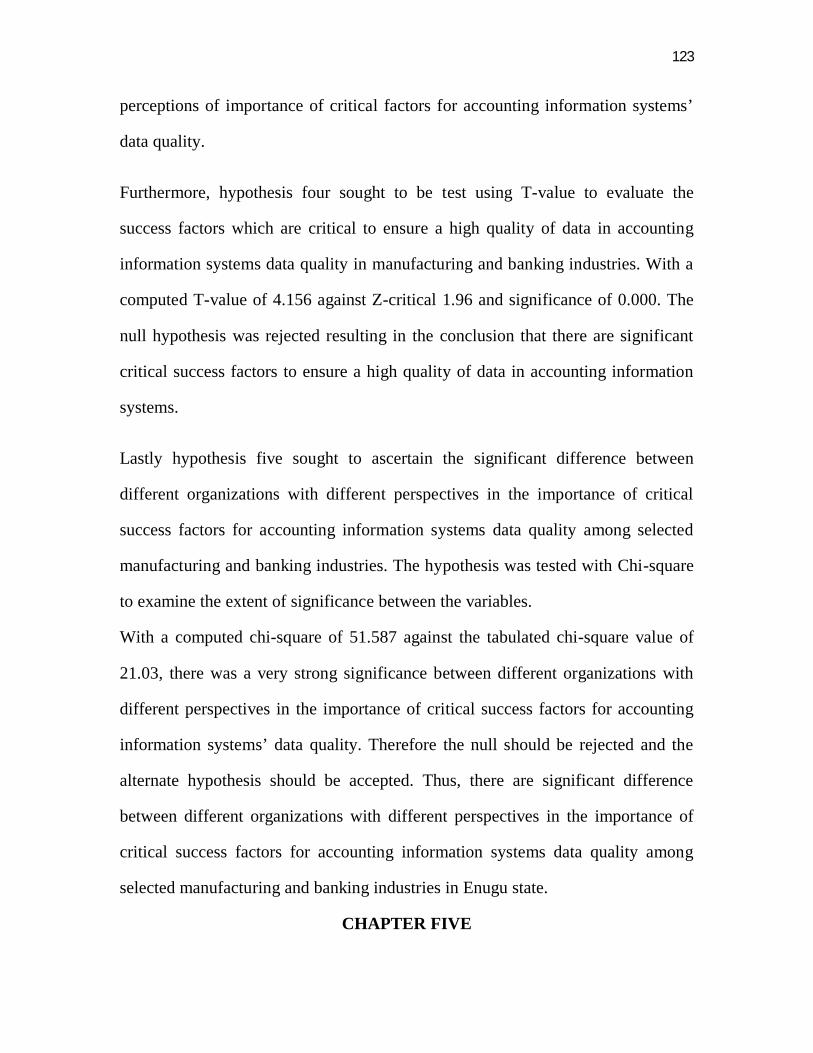
123
perceptions of importance of critical factors for accounting information systems’
data quality.
Furthermore, hypothesis four sought to be test using T-value to evaluate the
success factors which are critical to ensure a high quality of data in accounting
information systems data quality in manufacturing and banking industries. With a
computed T-value of 4.156 against Z-critical 1.96 and significance of 0.000. The
null hypothesis was rejected resulting in the conclusion that there are significant
critical success factors to ensure a high quality of data in accounting information
systems.
Lastly hypothesis five sought to ascertain the significant difference between
different organizations with different perspectives in the importance of critical
success factors for accounting information systems data quality among selected
manufacturing and banking industries. The hypothesis was tested with Chi-square
to examine the extent of significance between the variables.
With a computed chi-square of 51.587 against the tabulated chi-square value of
21.03, there was a very strong significance between different organizations with
different perspectives in the importance of critical success factors for accounting
information systems’ data quality. Therefore the null should be rejected and the
alternate hypothesis should be accepted. Thus, there are significant difference
between different organizations with different perspectives in the importance of
critical success factors for accounting information systems data quality among
selected manufacturing and banking industries in Enugu state.
CHAPTER FIVE
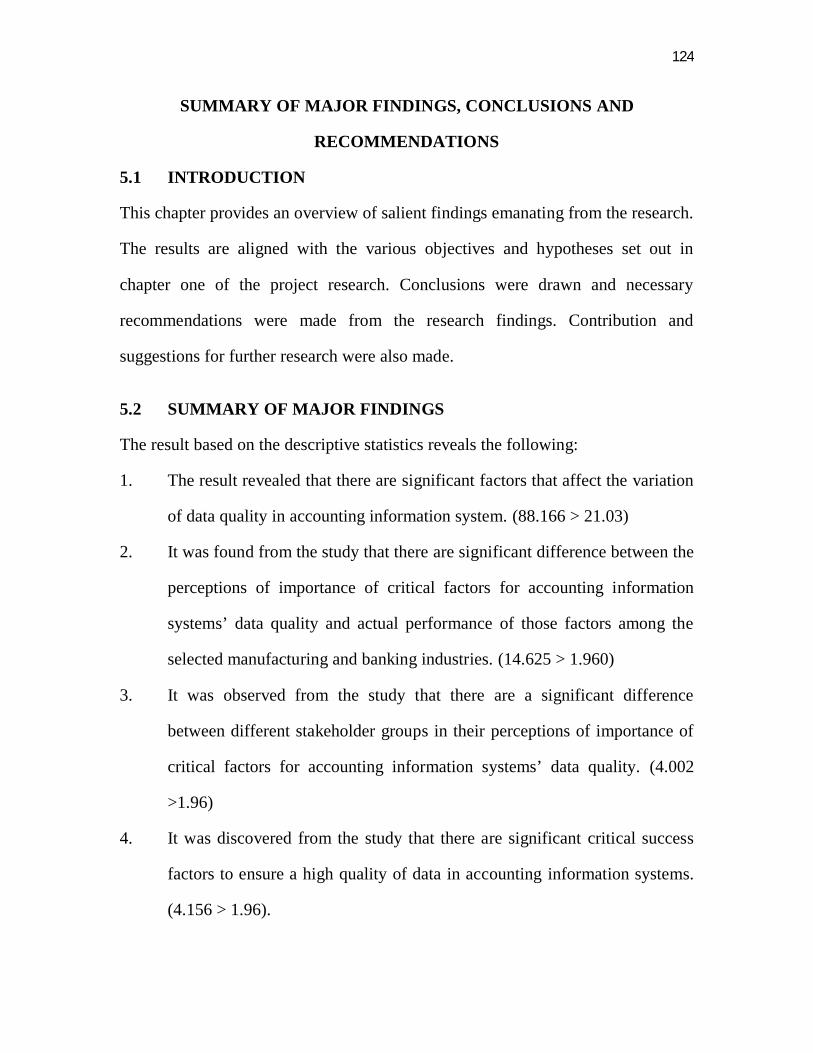
124
SUMMARY OF MAJOR FINDINGS, CONCLUSIONS AND
RECOMMENDATIONS
5.1 INTRODUCTION
This chapter provides an overview of salient findings emanating from the research.
The results are aligned with the various objectives and hypotheses set out in
chapter one of the project research. Conclusions were drawn and necessary
recommendations were made from the research findings. Contribution and
suggestions for further research were also made.
5.2 SUMMARY OF MAJOR FINDINGS
The result based on the descriptive statistics reveals the following:
1. The result revealed that there are significant factors that affect the variation
of data quality in accounting information system. (88.166 > 21.03)
2. It was found from the study that there are significant difference between the
perceptions of importance of critical factors for accounting information
systems’ data quality and actual performance of those factors among the
selected manufacturing and banking industries. (14.625 > 1.960)
3. It was observed from the study that there are a significant difference
between different stakeholder groups in their perceptions of importance of
critical factors for accounting information systems’ data quality. (4.002
>1.96)
4. It was discovered from the study that there are significant critical success
factors to ensure a high quality of data in accounting information systems.
(4.156 > 1.96).
125
5. It was further observed that different organizations have different
perspectives in the importance and performance of critical success factors
for accounting information systems data quality. (51.587 >21.03).
5.3 CONCLUSION
On the basis of research findings the following conclusions were made:
The study concluded that AIS staff of organizations in Enugu state cherish top
management commitment, nature of accounting information systems, input
controls, personnel competency, teamwork and middle management commitment
to data quality as critical success factors in accounting information system data
quality.
This study also indicate that the surveyed manufacturing and banking
organizations were aware of the importance and the performance of the critical
success factors that impact on data quality of accounting information systems.
Comparing to their consideration of the importance of the factors, actual
performance of these factors is not up to the satisfactory level.
In brief, this research has provided an understanding of the importance of critical
success factors for data quality in accounting information systems. That is, data
quality management is crucial for the successful implementation of accounting
information systems. The critical factors identified by the study can serve
practitioners in accounting and IT fields as well as management as a useful guide
to data quality management activities, and improvement efforts.
126
High-level data quality management practice is one of the keys to success for
many organizations. Specification of the critical success factors of DQ
management in AIS can permit managers to obtain a better understanding of
accounting information system data quality management practices. If
organizations focus on those critical success factors, they may be able to evaluate
the perception of data quality management in their organizations’ AIS, and ensure
the quality of the accounting information. In addition, they will be able to identify
those areas of AIS data quality management where improvements should be made,
and improve overall data quality in the future.
Furthermore, the findings of the study would help organizations to focus on
important factors to obtain better benefit from less effort. Top management, IT and
accounting professionals should be able to gain the better understanding of
accounting information systems data quality.
5.4 RECOMMENDATIONS
Based on the findings the following recommendations were made:
1. Authorities need to develop strategies to recruit AIS staffs who have great
commitment and passion for AIS DQ. Part of interview could be subjecting
AIS staffs to practical work to ascertain if highly skilled and their passion
for the AIS DQ.
2. The management authorities should demonstrate their preparedness to show
concern in attending to AIS staffs related problems and support data quality
activities. This will give them confidence to remain and be committed.
127
3. Accountancy professional bodies should set strong and nation minded team
of supervisors who will not be settled at the management table to visit the
organizations and monitor the activities of AIS staff from time to time.
4. Stakeholders of the systems and data quality controls need to work together
as a team and having sufficient communication between different
departments and within departments and between different professionals to
ensure the data quality in AIS.
5. Management should upgrade the salary scale of AIS staffs so that the
profession will be attractive for quality and competent personnel with
working environment more friendly and conducive for maximum
productivity.
6. Government should enact laws to ensure that there are standards for
accounting information data quality which must be met for effectiveness
and efficiency among organizations.
7. In order to have a successful accounting information systems
implementation, organizations should pay attentions to both systems and
organizational factors.
5.5 CONTRIBUTION TO KNOWLEDGE
The following contributions to knowledge were made:
The result of this research has provided basis for better understanding of the
critical success factors for accounting information data quality but other variables
have been mentioned which contribute to the achievement of this work, but
without mentioning passion this work will have a gap. Management should adopt
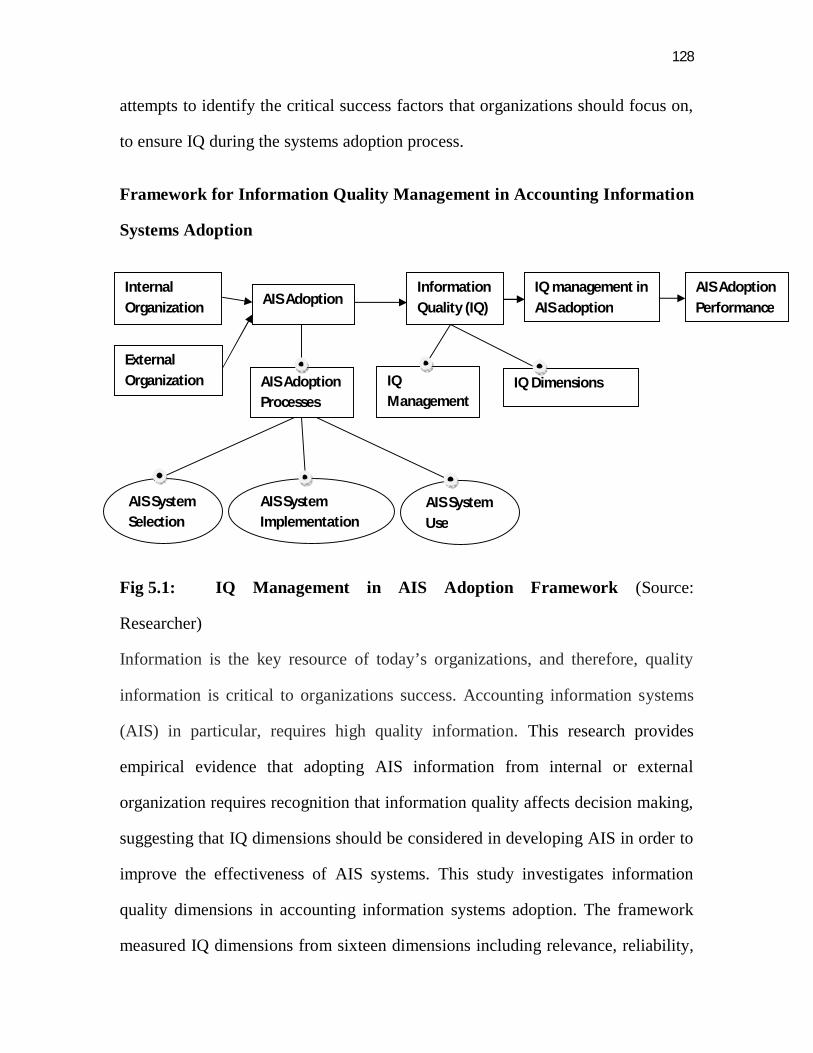
128
attempts to identify the critical success factors that organizations should focus on,
to ensure IQ during the systems adoption process.
Framework for Information Quality Management in Accounting Information
Systems Adoption
Fig 5.1: IQ Management in AIS Adoption Framework (Source:
Researcher)
Information is the key resource of today’s organizations, and therefore, quality
information is critical to organizations success. Accounting information systems
(AIS) in particular, requires high quality information. This research provides
empirical evidence that adopting AIS information from internal or external
organization requires recognition that information quality affects decision making,
suggesting that IQ dimensions should be considered in developing AIS in order to
improve the effectiveness of AIS systems. This study investigates information
quality dimensions in accounting information systems adoption. The framework
measured IQ dimensions from sixteen dimensions including relevance, reliability,
Internal Organization
AIS Adoption
AIS Adoption Processes
IQ Management
IQ Dimensions
Information Quality (IQ)
IQ management in AIS adoption
AIS Adoption Performance
External Organization
AIS System Selection
AIS System Implementation
AIS System Use
129
comparability, understandability, availability, effectiveness, efficiency,
confidentiality, accessibility, integrity, compliance, accuracy, objectivity, security,
completeness, and timeliness for adopting AIS. The overall results indicate that IQ
dimensions have a positive relationship with AIS adoption processes. The
evidence in this study suggests that an IQ criterion promotes AIS adoption process
performance. Furthermore, IQ dimensions play a vital role in the process of AIS
adoption. This evidence suggests that organizations should obtain knowledge of
appropriate information quality dimensions for accounting information systems
adoption to improve work performance as well as help organizations to make
profits.
5.6 SUGGESTED AREAS FOR FUTURE RESEARCH
Firstly, replication of this study in other non-profit organizations including both
non-governmental organizations and government organizations like parastatals
may give interesting insights into national practice. It can not only advance the
literature but also provide a useful benchmark for real-national practice, as
organizations nowadays need to become more competitive in order to survive in a
more open international trading environment.
Secondly, research into building the relationship between the performance of
critical factors and business output is needed. This research focused on identifying
the critical factors. Further research that links the performance of those factors to
business output can provide a wider picture of the issues and aid towards building
an understanding of cause-effect relationships between different variables in data
quality management area. The measurement of the business output could be the
130
overall level of quality achieved as well as financial data such as return on
investment.
Thirdly, a longitudinal experiment may be useful to further test the theory built in
this study. This would be to investigate whether continuous improvement effort on
data quality management can lead to better business performance. If there are any
variations on performance, an attempt could be made to develop the measurement
of how much those variations are caused by improvement activities.
Future studies can do cross-country surveys to address more issues in this field. In
addition, it will be better to expand the sample with more respondents from
different industries to enhance the empirical study. Also, future studies can focus
on connecting other fields to critical success factors, such as organization’s size
and respondent’s job level.
131
BIBLIOGRAPHY
Anthony, R. S. et al, (2005) Accounting Text and Cases, Irwin. Asika, N. (2001), Research Methodology in Behavioral Sciences, Lagos, Longman. Avison, D. and Myers, M. D. (2002), “Qualitative Research in Information Systems, A Reader,” SAGE Publications. Black, S. A. and Porter, L. J. 1996, 'Identification of the Critical Factors of TQM',
Decision Sciences, vol. 27, pp. 1-21. Bovee, M. (2004), 'Empirical Validation of the Structure of an Information Quality Model,' International Conference on Information Quality. Bowen, P. (1993), “Managing Data Quality Accounting Information Systems”: A
Stochastic Clearing System Approach, Unpublished PhD dissertation, University of Tennessee.
Choe, J. M. (2004), "The Relationships among Management Accounting Information, Organizational Learning and Production Performance," Journal of Strategic Information Systems 13, 61-85. Eboh, E. C. (1998), Social and Economic Research. Principles and Methods,
Lagos. Academic Publications and Development Limited. English, L. P. 2009, Improving Data Warehouse and Business Information Quality: Methods for Reducing Costs and Increasing Profits, John Wiley and Sons.
Evans, J. R. and Lindsay, W. M. 1996, The Management and Control of Quality, 3rd edition, West Publishing Company, St. Paul, MN.
Fedorowicz, J. and Lee, Y. W. (1998), “Accounting Information Quality:
Reconciling Hierarchical and Dimensional Contexts”, in Proceedings of 1998 Association of Information Systems (AIS) Conference.
Fruends, J. E. and Williams F. J. (1979), Modern Business Statistics London;
Pitman Publishing Limited. Fubara, B. A. and Mguni B. S. (2005), Research Methods in Management, Port-
Harcourt: Pearl Publishers.
132
Hall, J. A. 1998, Accounting information Systems, 2nd ed, South-Western College Publishing.
Huang, H.-T., Lee, Y. W. and Wang, R. Y. 1999, Quality Information and
Knowledge, Prentice Hall, New Jersey. Ikeagwu, E. K. (1998), Ground Work of Research Methods and Procedures,
Enugu: Institute for Development Studies. Johnson, J. R., etal (1981), 'Characteristics of Errors in Accounts Receivable and
Inventory Audits', The Accounting Review, vol. 56, No. 2, pp. 270-293. Kahn, B. K., Strong, D. M. and Wang, R. Y. 2002, 'Information Quality
Benchmarks: Product and Service Performance', Communications of the ACM, Vol. 45, No. 4ve.
Kaplan, D., and Krishnan, R (1998), “Assessing Data Quality in Accounting
Information Systems”, Communications of the ACM, Vol. 41, No. 2, pp. 72-78.
Klein, B. D. (1998), “Data Quality in the Practice of Consumer Product
Management: Evidence from the Field”, Data Quality, Vol. 4, No. 1. Kovac, R., Lee, Y. W. and Pipino, L. L. 1997, 'Total Data Quality Management:
The Case of IRI', in Proceeding of the 1997 Conference on Information Quality, pp. 63- 79
Lai, K.-H., Weerakoon, T. S. and Cheng, T. C. E. 2002, 'The State of Quality Management Implementation: A Cross-sectional Study of Quality-oriented Companies in Hong Kong', Total Quality Management, Vol. 13, No. 1, pp. 29-38. Management Accounting and Integrated Information Systems: A Literature Review, International Journal of Accounting Information Systems 8, 40-68. Motwani, J. 2001, 'Measuring Critical Factors of TQM', Measuring Business
Excellence, Vol. 5, No. 2, pp. 27-30. Nicolaou, A. I. (2000). "A Contingency Model of Perceived Effectiveness in Accounting Information Systems Organizational Coordination and Control Effects," International Journal of Accounting Information Systems 1, 91-105.
133
Nzelibe C. G. and IIogu, G. C. (1996), Fundamentals of Research Methods, Enugu: Optimal International Limited.
Onwumere, J. U. J. (2009), Business and Economic. Research Methods, Enugu:
Vougasen Limited. Onwura, E. A. (1998) Introduction to Academic Research Methods, Enugu:
Gostak Printing and Publishing Co. Limited. Orlikowski, W. J. and Baroudi, J. J. (1991), "Studying Information Technology in Organizations: Research Approaches and Assumptions," Information Systems Research 2, 1-28. Redman, T. C. (1992), Data Quality: Management and Technology, Bantam
Books, New York. Redman, T. C. (1998), 'The Impact of Poor Data Quality on the Typical
Enterprise', Communications of the ACM, Vol. 41, No. 2. Romney, M. B. and Steinbart, P. J. (2009), 'Accounting Information Systems,' (Pearson Prentice Hall). Segev, A. and Wang, R. 2001, 'Data Quality Challenges in Enabling eBusiness Transformation', in Proceedings of the Sixth International Conference on Information Quality, pp. 77-82. Shanks, G. and Darke, P. 1998, 'Understanding Data Quality in Data Warehousing: A Semiotic Approach', in Proceeding of the 1998 Conference on Information Quality, Boston, Massachusetts. Strong, D. M., (1997), 'Data Quality in Context', Communications of the ACM,
Vol. 40, No. 5, pp. 103-110. Strong, D. M., Lee, Y. W. and Wang, R. Y. 1997, 'Data Quality in Context',
Communications of the ACM, Vol. 40, No. 5, pp. 103-110. Wang, R. Y., Storey, V. C. and Firth, C. P. 1995, 'A Framework for Analysis of Data Quality Research', IEEE Transactions on Knowledge and Data Engineering, Vol. 7, No. 4, pp. 623-639. Wang, R. Y. and Strong, D. M. 1996, 'Beyond Accuracy: What Data Quality
Means to Data Consumers', Journal of Management Information Systems, Vol. 12, No. 4, pp. 5-34.

134
Wang, R. Y. and Strong, D. M.( 2006), 'Beyond Accuracy: What Data Quality Means to Data Consumers', Journal of Management Information Systems, Vol. 12, No. 4, pp. 5-34.
Yusof, S. M. and Aspinwall, E. 1999, 'Critical Success Factors for Total Quality
Management Implementation in Small and Medium Enterprises', Total Quality Management, p. 803.
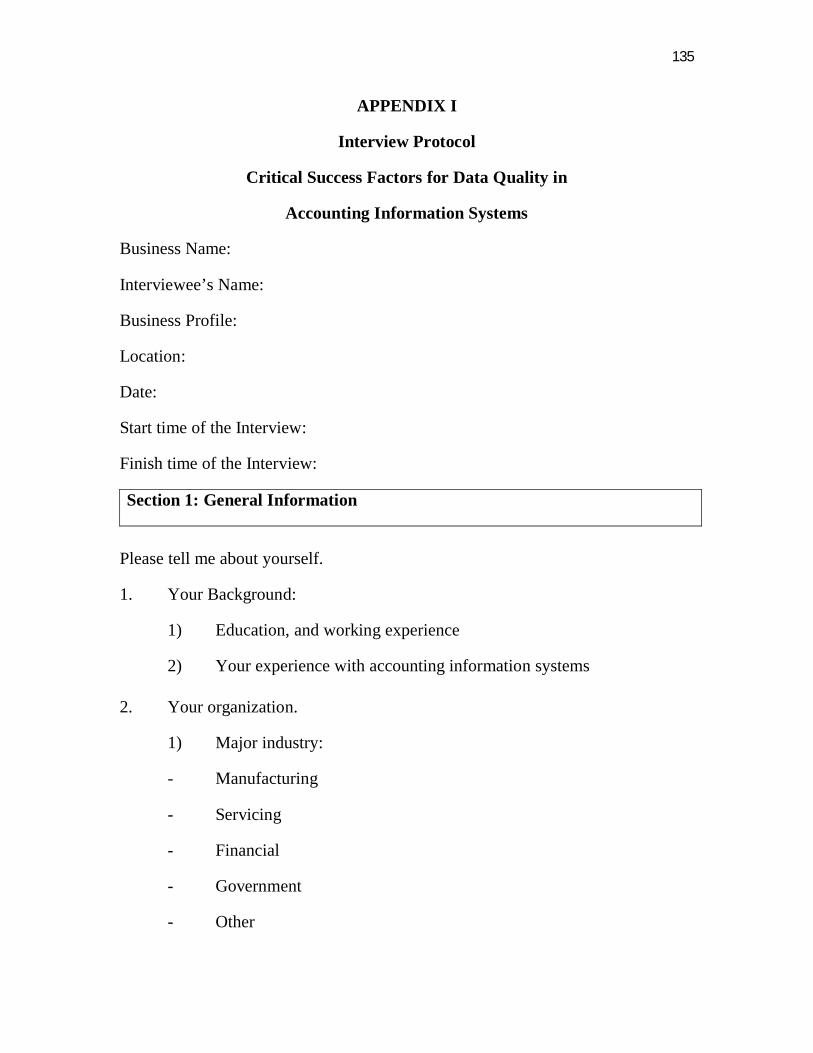
135
APPENDIX I
Interview Protocol
Critical Success Factors for Data Quality in
Accounting Information Systems
Business Name:
Interviewee’s Name:
Business Profile:
Location:
Date:
Start time of the Interview:
Finish time of the Interview:
Section 1: General Information
Please tell me about yourself.
1. Your Background:
1) Education, and working experience
2) Your experience with accounting information systems
2. Your organization.
1) Major industry:
- Manufacturing
- Servicing
- Financial
- Government
- Other
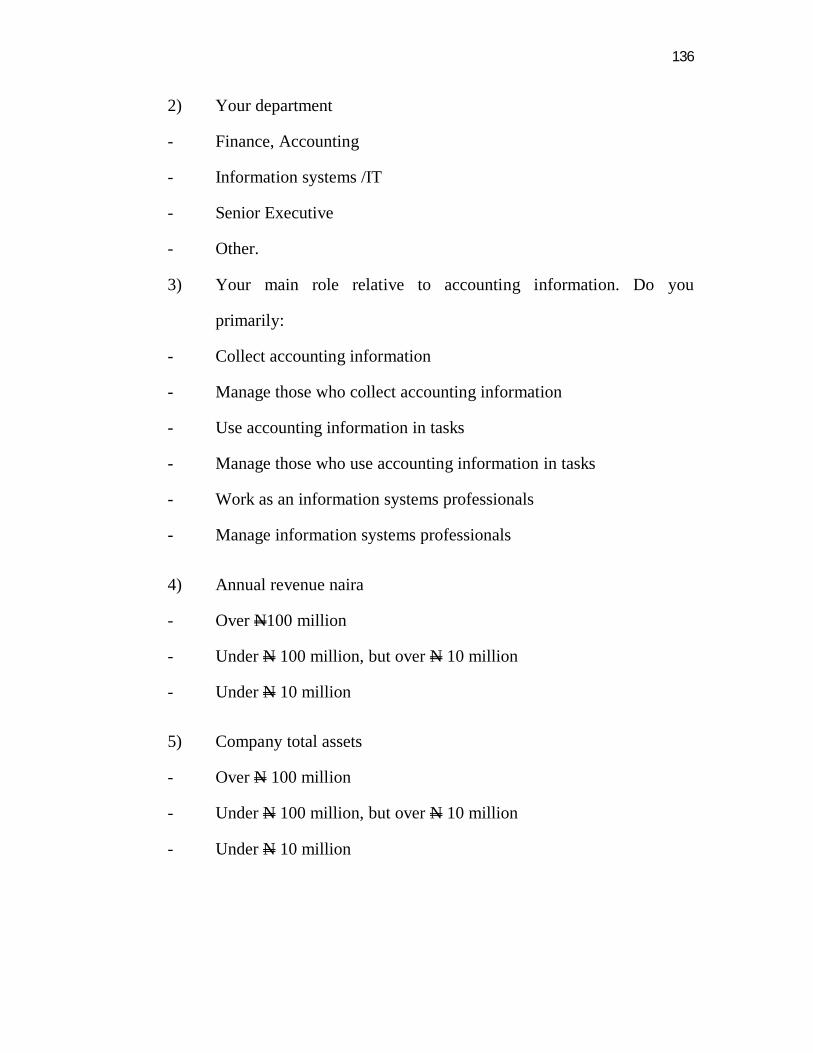
136
2) Your department
- Finance, Accounting
- Information systems /IT
- Senior Executive
- Other.
3) Your main role relative to accounting information. Do you
primarily:
- Collect accounting information
- Manage those who collect accounting information
- Use accounting information in tasks
- Manage those who use accounting information in tasks
- Work as an information systems professionals
- Manage information systems professionals
4) Annual revenue naira
- Over N100 million
- Under N 100 million, but over N 10 million
- Under N 10 million
5) Company total assets
- Over N 100 million
- Under N 100 million, but over N 10 million
- Under N 10 million
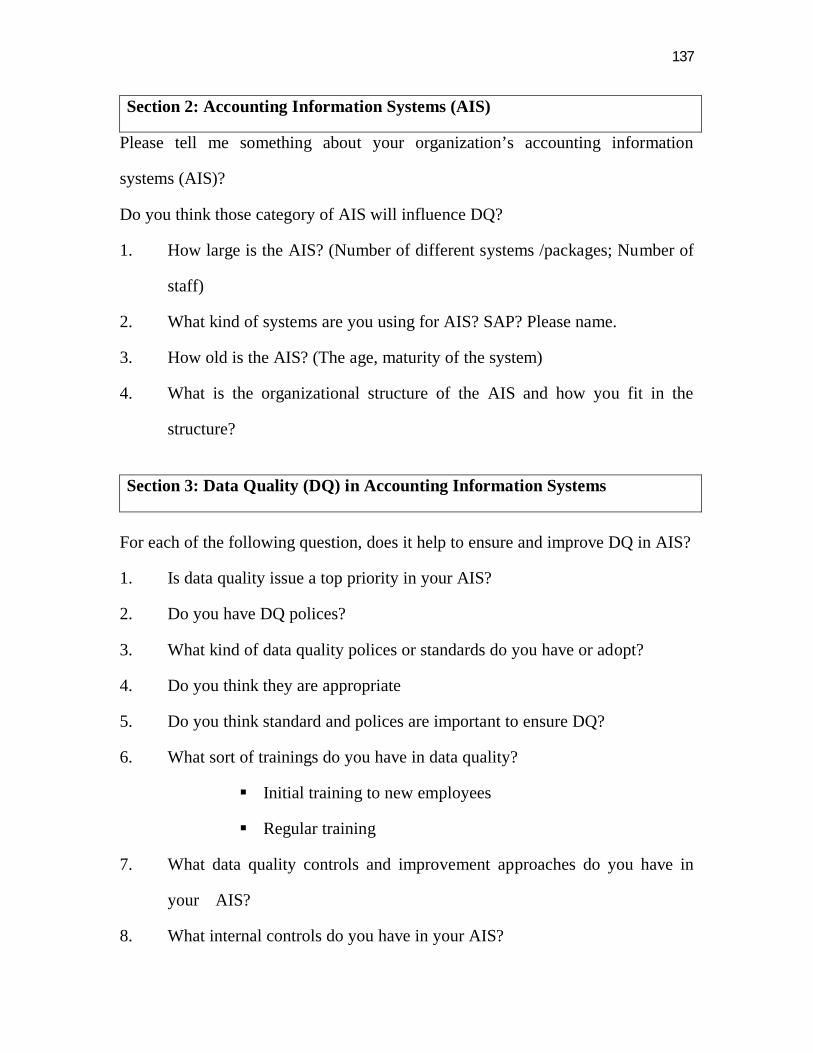
137
Section 2: Accounting Information Systems (AIS)
Please tell me something about your organization’s accounting information
systems (AIS)?
Do you think those category of AIS will influence DQ?
1. How large is the AIS? (Number of different systems /packages; Number of
staff)
2. What kind of systems are you using for AIS? SAP? Please name.
3. How old is the AIS? (The age, maturity of the system)
4. What is the organizational structure of the AIS and how you fit in the
structure?
Section 3: Data Quality (DQ) in Accounting Information Systems
For each of the following question, does it help to ensure and improve DQ in AIS?
1. Is data quality issue a top priority in your AIS?
2. Do you have DQ polices?
3. What kind of data quality polices or standards do you have or adopt?
4. Do you think they are appropriate
5. Do you think standard and polices are important to ensure DQ?
6. What sort of trainings do you have in data quality?
Initial training to new employees
Regular training
7. What data quality controls and improvement approaches do you have in
your AIS?
8. What internal controls do you have in your AIS?
138
9. What input controls do you have in your AIS?
10 What is the role of audit and review in relation to AIS?
Internal
External
11. What sort of data quality performance evaluation and rewards do you have
in your AIS?
12. What employee/ personnel relations do you have in data quality area?
Section 4: Factors
What factors do you think may influence the data quality in accounting
information system?
1. Does your organization allocate enough funds, technical tools, experts,
skilled personnel available for ensuring data quality in AIS?
2. Do you have data quality manager or similar roles to ensure the quality of
the (accounting) information?
If yes, how can he/she help to improve DQ?
If no, do you think it will help to have one;
or do you think it is not necessary or impossible?
3. How the top management’s role in relation to data quality issues in AIS
will impact on DQ?
4. Who are the information suppliers of your AIS? Will information supplier
quality management influence the DQ in AIS?
5. Who are the customers of your AIS? Will the different requirements from
different customers influence the DQ in AIS?
139
6. How does your organization manage change? (Technology, regulation,
economy, marking changes)
Do you think skills to manage change can help to improve DQ?
7. Are there any external factors that you think may influence DQ in AIS?
8. Does your organization evaluate cost / benefit tradeoffs of DQ in AIS? Are
there any incentives for DQ?
If yes, does it help to improve DQ?
Section 5: Critical Success Factors
We have defined some factors that might impact on data quality of accounting
information systems. Which of these factors do you think are critical success
factors? Would you be able to give a mark for each of these factors on a ten -
point scale, 10 as very critical, 1 as not important at all?
1. Top management’s commitment to DQ.
2. Appropriate (simple, relevant and consistent) data quality policies and
standards and its implementation.
3. Role of data quality
4. Role of data quality manager.
5. Training.
6. Organizational: Structure
: Culture.
7. Nature of the AIS.
8. Data quality (control and improvement activities) approaches and processes
9. Customer focus –user involvement.
140
10. Employee/personnel relations (employee’s responsibility to DQ).
11. External factors.
12. Information supplier quality management.
13. Performance evaluation and rewards (responsibility for DQ).
14. Manage change
15. Evaluate cost/benefit tradeoffs
16. Audit (internal and external) and reviews
17. Internal controls (systems, process), such as: access control and security
and segregation of duties
18. Input control.
19. Understanding of the systems and DQ (importance, improvement)
20. Teamwork (between different departments and within departments)
(communication)
21. Continuous improvement
Do you think these factors are appropriate? Why, why not?
Which of these factors do you think are critical success factors?
Are there other factors that you think may be important but were not included in
this list?
Conclusion:
Is there anything I have not asked that you feel is important when discussing
critical success factors of data quality in accounting information systems?
Is there anyone else that you would recommend talking to in relation to AIS DQ?
With hindsight what would you have done differently?
141
Would you like some of the feedback from this research regarding to your
organization’s DQ issues or the findings of the research?
If you would like, we will supply a copy of what we believe you told us, and how
we have interpreted what you said, so that you can correct the impressions that we
have taken from your responses. We will also provide you with factors suggested
by other respondents, you could then comment on the responses of others and
accept or reject factors.
Thank you very much for your precious time and your valuable help!
142
APPENDIX 11 Survey Questionnaires
Department of Accountancy, Faculty of Business Administration, School of Postgraduate Studies, University of Nigeria, Enugu Campus. August 8, 2011.
………………
……………....
………………
Dear Sir/Madam,
RESEARCH QUESTIONNAIRE ON “CRITICAL SUCCESS FACTORS
FOR ACCOUNTING INFORMATION SYSTEMS DATA QUALITY
I am a postgraduate student in the above named department and institution, presently carrying out a research work on the critical success factors for accounting information systems data quality.
This questionnaire is design in the completion of above named project research in partial fulfillment of the requirement for the award of a master degree of business administration in Accountancy. I assure you that the information given will be treated with utmost confidentiality and will be used strictly for academic purpose.
Therefore I solicit your patient and brevity in answering these questions and will be grateful if you could assist me in this direction. I hereby attach the questionnaire for your completion.
Thanks for your anticipated co-operation.
Yours faithfully,
……….………………. Ukah, Chibueze Kalu.
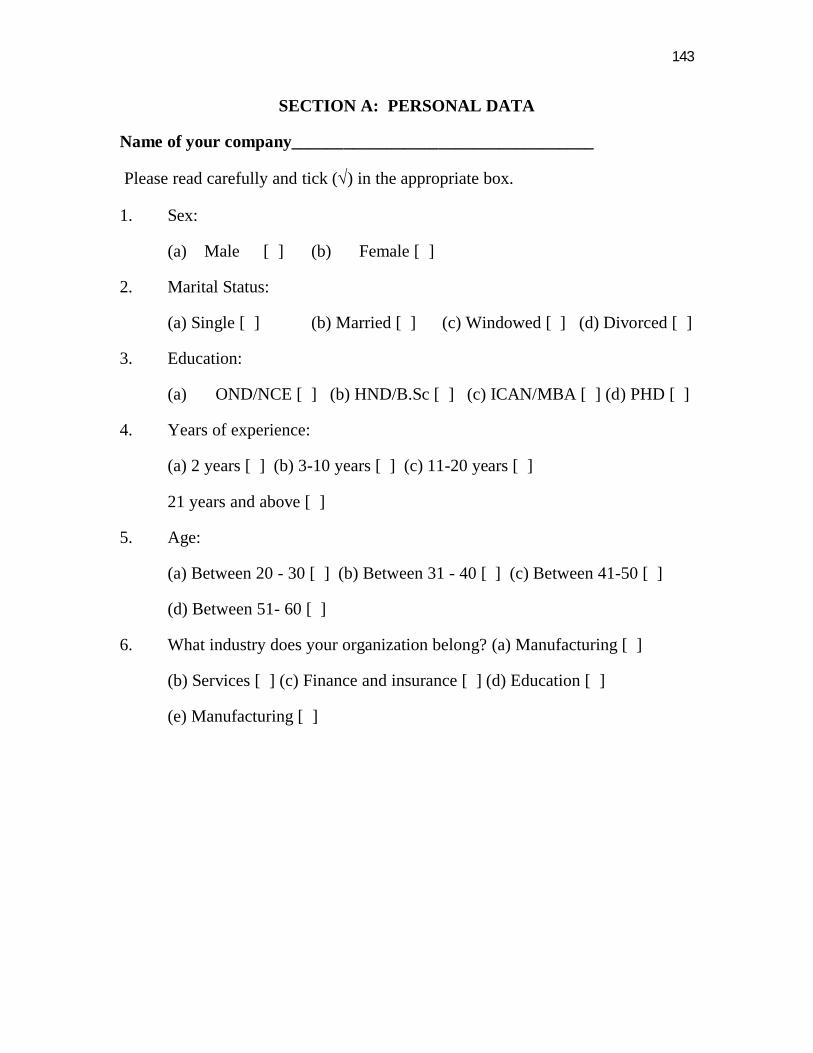
143
SECTION A: PERSONAL DATA
Name of your company___________________________________
Please read carefully and tick () in the appropriate box.
1. Sex:
(a) Male [ ] (b) Female [ ]
2. Marital Status:
(a) Single [ ] (b) Married [ ] (c) Windowed [ ] (d) Divorced [ ]
3. Education:
(a) OND/NCE [ ] (b) HND/B.Sc [ ] (c) ICAN/MBA [ ] (d) PHD [ ]
4. Years of experience:
(a) 2 years [ ] (b) 3-10 years [ ] (c) 11-20 years [ ]
21 years and above [ ]
5. Age:
(a) Between 20 - 30 [ ] (b) Between 31 - 40 [ ] (c) Between 41-50 [ ]
(d) Between 51- 60 [ ]
6. What industry does your organization belong? (a) Manufacturing [ ]
(b) Services [ ] (c) Finance and insurance [ ] (d) Education [ ]
(e) Manufacturing [ ]
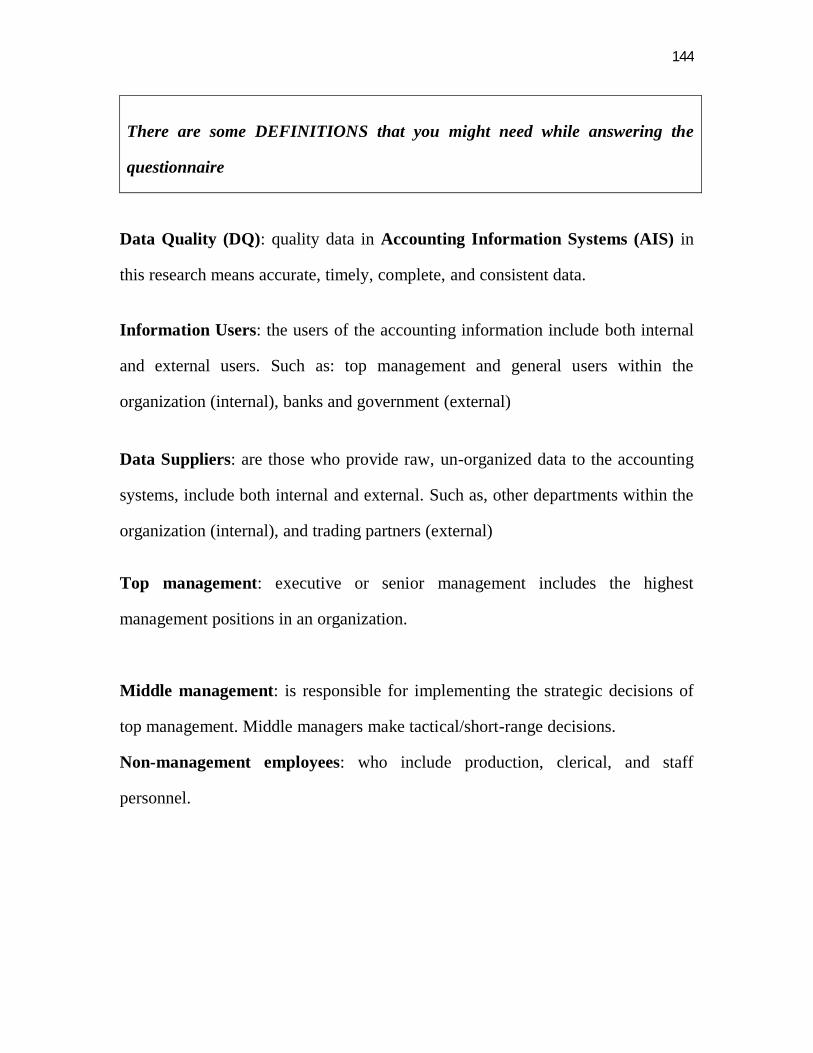
144
There are some DEFINITIONS that you might need while answering the
questionnaire
Data Quality (DQ): quality data in Accounting Information Systems (AIS) in
this research means accurate, timely, complete, and consistent data.
Information Users: the users of the accounting information include both internal
and external users. Such as: top management and general users within the
organization (internal), banks and government (external)
Data Suppliers: are those who provide raw, un-organized data to the accounting
systems, include both internal and external. Such as, other departments within the
organization (internal), and trading partners (external)
Top management: executive or senior management includes the highest
management positions in an organization.
Middle management: is responsible for implementing the strategic decisions of
top management. Middle managers make tactical/short-range decisions.
Non-management employees: who include production, clerical, and staff
personnel.
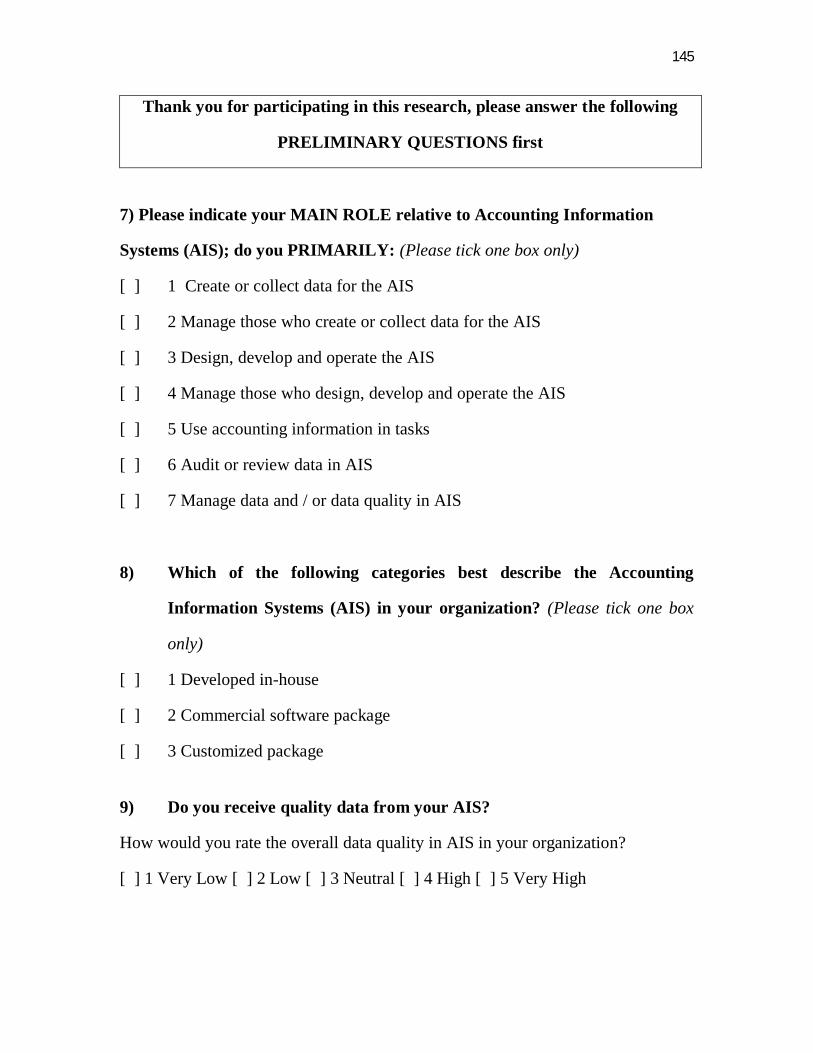
145
Thank you for participating in this research, please answer the following
PRELIMINARY QUESTIONS first
7) Please indicate your MAIN ROLE relative to Accounting Information
Systems (AIS); do you PRIMARILY: (Please tick one box only)
[ ] 1 Create or collect data for the AIS
[ ] 2 Manage those who create or collect data for the AIS
[ ] 3 Design, develop and operate the AIS
[ ] 4 Manage those who design, develop and operate the AIS
[ ] 5 Use accounting information in tasks
[ ] 6 Audit or review data in AIS
[ ] 7 Manage data and / or data quality in AIS
8) Which of the following categories best describe the Accounting
Information Systems (AIS) in your organization? (Please tick one box
only)
[ ] 1 Developed in-house
[ ] 2 Commercial software package
[ ] 3 Customized package
9) Do you receive quality data from your AIS?
How would you rate the overall data quality in AIS in your organization?
[ ] 1 Very Low [ ] 2 Low [ ] 3 Neutral [ ] 4 High [ ] 5 Very High
146
Section B: CRITICAL SUCCESS FACTORS FOR ACCOUNTING
INFORMATION SYSTEMS
DATA QUALITY
NOTE: Please rate the importance of each factor in ensuring Data Quality (DQ)
in Accounting Information Systems (AIS) from your perceptions, opinions and
rate the actual performance (achievement) on each of those factors by your
organization. The Option to select are in the following scale. Please indicate your
view by circling the number which most closely matches your opinion in the table
below.
1. - Not important (NI)
2. - Little importance (LI)
3. - Average importance (AI)
4. - Very important (VI)
5. - Extremely (E)
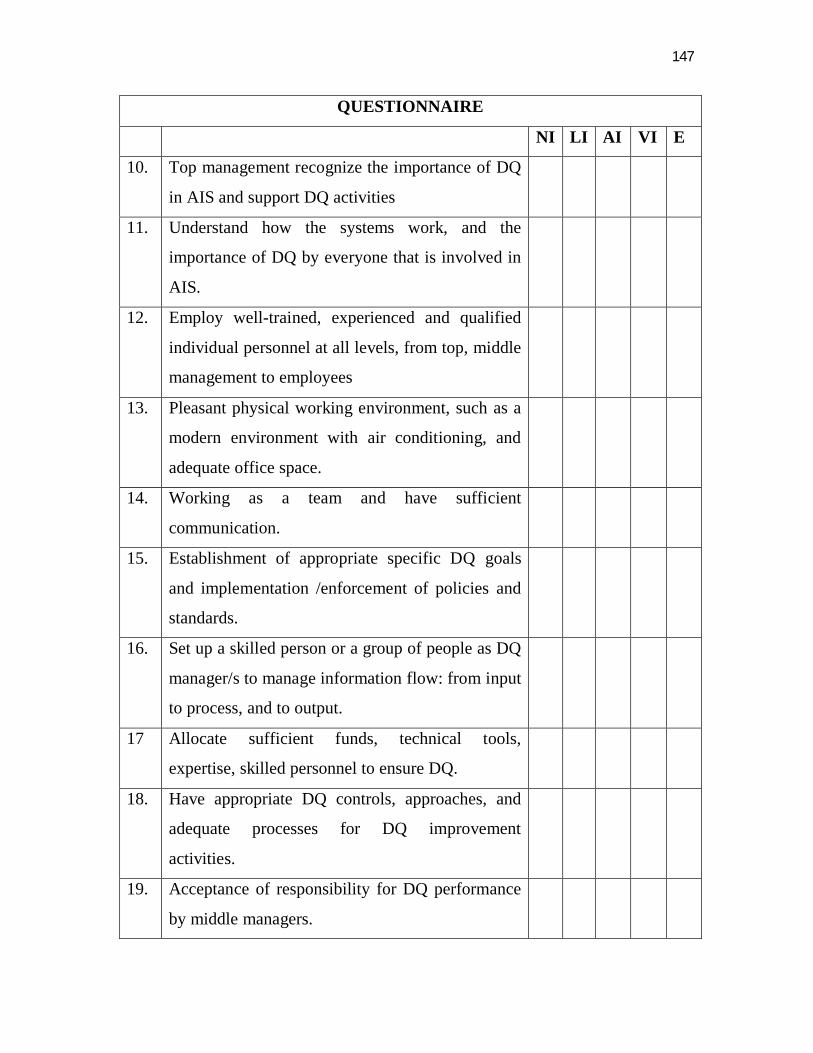
147
QUESTIONNAIRE
NI LI AI VI E
10. Top management recognize the importance of DQ
in AIS and support DQ activities
11. Understand how the systems work, and the
importance of DQ by everyone that is involved in
AIS.
12. Employ well-trained, experienced and qualified
individual personnel at all levels, from top, middle
management to employees
13. Pleasant physical working environment, such as a
modern environment with air conditioning, and
adequate office space.
14. Working as a team and have sufficient
communication.
15. Establishment of appropriate specific DQ goals
and implementation /enforcement of policies and
standards.
16. Set up a skilled person or a group of people as DQ
manager/s to manage information flow: from input
to process, and to output.
17 Allocate sufficient funds, technical tools,
expertise, skilled personnel to ensure DQ.
18. Have appropriate DQ controls, approaches, and
adequate processes for DQ improvement
activities.
19. Acceptance of responsibility for DQ performance
by middle managers.
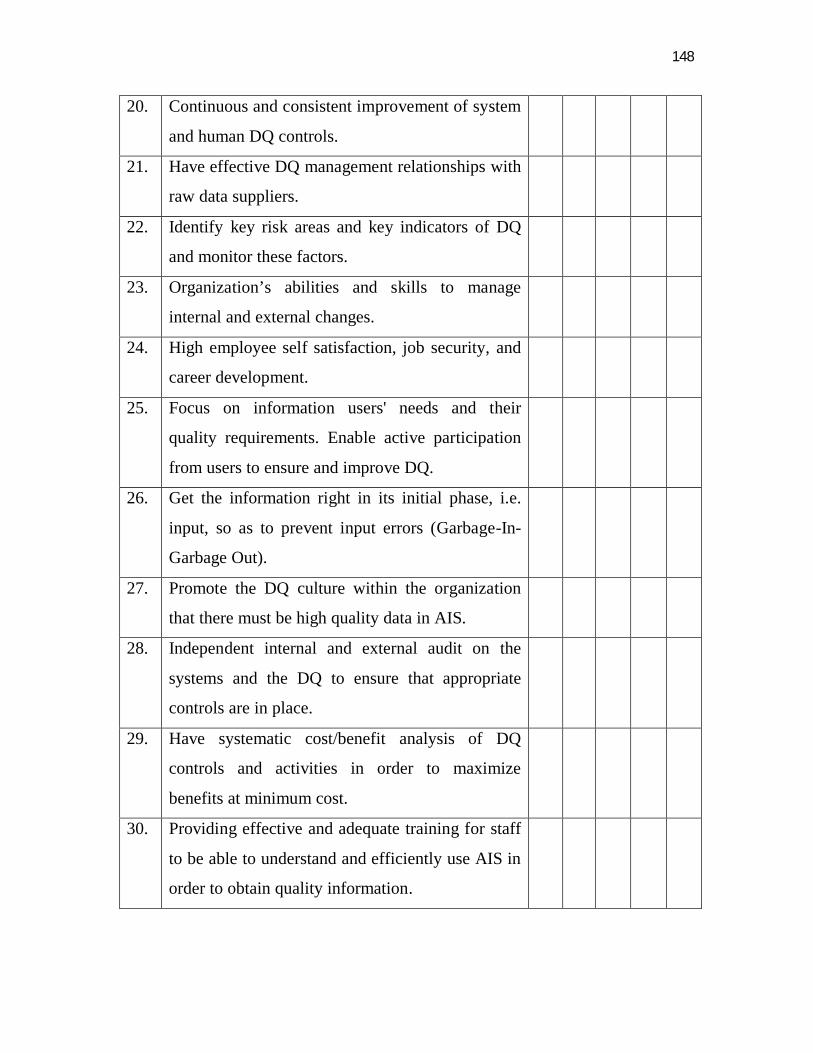
148
20. Continuous and consistent improvement of system
and human DQ controls.
21. Have effective DQ management relationships with
raw data suppliers.
22. Identify key risk areas and key indicators of DQ
and monitor these factors.
23. Organization’s abilities and skills to manage
internal and external changes.
24. High employee self satisfaction, job security, and
career development.
25. Focus on information users' needs and their
quality requirements. Enable active participation
from users to ensure and improve DQ.
26. Get the information right in its initial phase, i.e.
input, so as to prevent input errors (Garbage-In-
Garbage Out).
27. Promote the DQ culture within the organization
that there must be high quality data in AIS.
28. Independent internal and external audit on the
systems and the DQ to ensure that appropriate
controls are in place.
29. Have systematic cost/benefit analysis of DQ
controls and activities in order to maximize
benefits at minimum cost.
30. Providing effective and adequate training for staff
to be able to understand and efficiently use AIS in
order to obtain quality information.