Critical influence of alumina content on the low ...ematweb.cmi.ua.ac.be/emat/pdf/2089.pdf ·...
10
Available online at www.sciencedirect.com ScienceDirect Journal of the European Ceramic Society 35 (2015) 741–750 Critical influence of alumina content on the low temperature degradation of 2–3 mol% yttria-stabilized TZP for dental restorations F. Zhang a,∗ , K. Vanmeensel a , M. Inokoshi b , M. Batuk c , J. Hadermann c , B. Van Meerbeek b , I. Naert b , J. Vleugels a a Department of Materials Engineering, KU Leuven, Kasteelpark Arenberg, 44, B-3001 Heverlee, Belgium b KU Leuven BIOMAT, Department of Oral Health Sciences, KU Leuven & Dentistry, University Hospitals Leuven, Kapucijnenvoer, 7, blok a, B-3000 Leuven, Belgium c Electron Microscopy for Materials Research (EMAT), University of Antwerp, Groenenborgerlaan 171, B-2020 Antwerp, Belgium Received 23 April 2014; received in revised form 4 September 2014; accepted 9 September 2014 Available online 27 September 2014 Abstract The influence of 0.25, 2 and 5 wt.% alumina addition on the mechanical properties and low temperature degradation (LTD) of 3, 2.5 and 2 mol% yttria-stabilized TZP ceramics was investigated. The amount of alumina addition was observed to have a crucial impact on the degradation of Y-TZP ceramics. Independent on the yttria stabilizer content, 0.25 wt.% alumina had a higher degradation retarding effect to Y-TZP ceramics than 2 and 5 wt.% of alumina addition, which had a comparable effect. The apparent activation energy for the degradation process was increased by adding alumina, but it was the same for 0.25–5 wt.% alumina doped 3Y-TZP ceramics. For Y-TZPs containing a small amount of alumina addition, only the segregated Al 3+ at the grain boundaries of the zirconia grains was effective to retard the degradation of Y-TZPs. The secondary phase Al 2 O 3 grains increased the degradation kinetics, which might be attributed to the residual stresses. © 2014 Elsevier Ltd. All rights reserved. Keywords: Y-TZP; Degradation; Amount of alumina 1. Introduction The market sales of zirconia ceramics for dental applica- tion increases steadily every year. 1,2 Yttria stabilized tetragonal zirconia polycrystals (Y-TZP) is prevalent in prosthetic den- tistry for the fabrication of crowns and fixed partial dentures 2 because of the extraordinary mechanical properties, biocompat- ibility and aesthetic potential of the white colour with natural translucency. 1–3 The high strength and toughness of zirconia are attributed to the stress-induced phase transformation of the metastable tetragonal grains to the monoclinic structure (t–m transformation) around a propagating crack. 3,4 However, Y-TZP ceramics have a problem of low temperature degra- dation (LTD). 5 LTD is a process where the spontaneous t–m ∗ Corresponding author. Tel.:+32 16 37 77 38; fax: +32 16 32 19 90. E-mail addresses: [email protected], [email protected] (F. Zhang). transformation is unintentionally initiated and accelerated by water penetration in the temperature range of 20–300 ◦ C. 6,7 A large number of yttria-stabilized zirconia femoral heads failed in a very short time in 2001 due to the LTD problem. 8 Therefore, it is important to assess the degradation behaviour of dental Y-TZP biomaterials and develop stable materials with- out compromising on their excellent properties. In the field of dental restoration, 3Y-TZP powders (Tosoh TZ- 3Y-E) which contain 0.25 wt.% alumina addition are widely used and 0.25 wt.% alumina was added to improve the degradation resistance. 9 The strategy of adding a small amount of alumina to increase the degradation resistance of Y-TZP ceramics has been known for a long time. 10–12 However, it is not clear why 0.25 wt.% alumina was added in the frequently used Tosoh TZ- 3Y-E powder. Although the degradation resistance of 3Y-TZPs was reported to decrease as the amount of alumina decreased from 0.25, 0.15, 0.05 to 0 wt.%, 13 it is not clear whether adding more than 0.25 wt.% alumina might result in a higher degrada- tion resistance. Different results were reported about the amount http://dx.doi.org/10.1016/j.jeurceramsoc.2014.09.018 0955-2219/© 2014 Elsevier Ltd. All rights reserved.
-
Upload
truongtuyen -
Category
Documents
-
view
214 -
download
0
Transcript of Critical influence of alumina content on the low ...ematweb.cmi.ua.ac.be/emat/pdf/2089.pdf ·...

A
TyY
aiAt©
K
1
tztbitat(Yd
(
h0
Available online at www.sciencedirect.com
ScienceDirect
Journal of the European Ceramic Society 35 (2015) 741–750
Critical influence of alumina content on the low temperature degradationof 2–3 mol% yttria-stabilized TZP for dental restorations
F. Zhang a,∗, K. Vanmeensel a, M. Inokoshi b, M. Batuk c, J. Hadermann c, B. Van Meerbeek b,I. Naert b, J. Vleugels a
a Department of Materials Engineering, KU Leuven, Kasteelpark Arenberg, 44, B-3001 Heverlee, Belgiumb KU Leuven BIOMAT, Department of Oral Health Sciences, KU Leuven & Dentistry, University Hospitals Leuven, Kapucijnenvoer, 7, blok a,
B-3000 Leuven, Belgiumc Electron Microscopy for Materials Research (EMAT), University of Antwerp, Groenenborgerlaan 171, B-2020 Antwerp, Belgium
Received 23 April 2014; received in revised form 4 September 2014; accepted 9 September 2014Available online 27 September 2014
bstract
he influence of 0.25, 2 and 5 wt.% alumina addition on the mechanical properties and low temperature degradation (LTD) of 3, 2.5 and 2 mol%ttria-stabilized TZP ceramics was investigated. The amount of alumina addition was observed to have a crucial impact on the degradation of-TZP ceramics.Independent on the yttria stabilizer content, 0.25 wt.% alumina had a higher degradation retarding effect to Y-TZP ceramics than 2 and 5 wt.% of
lumina addition, which had a comparable effect. The apparent activation energy for the degradation process was increased by adding alumina, butt was the same for 0.25–5 wt.% alumina doped 3Y-TZP ceramics. For Y-TZPs containing a small amount of alumina addition, only the segregated
l3+ at the grain boundaries of the zirconia grains was effective to retard the degradation of Y-TZPs. The secondary phase Al2O3 grains increasedhe degradation kinetics, which might be attributed to the residual stresses. 2014 Elsevier Ltd. All rights reserved.
twli
oo
3ar
eywords: Y-TZP; Degradation; Amount of alumina
. Introduction
The market sales of zirconia ceramics for dental applica-ion increases steadily every year.1,2 Yttria stabilized tetragonalirconia polycrystals (Y-TZP) is prevalent in prosthetic den-istry for the fabrication of crowns and fixed partial dentures2
ecause of the extraordinary mechanical properties, biocompat-bility and aesthetic potential of the white colour with naturalranslucency.1–3 The high strength and toughness of zirconiare attributed to the stress-induced phase transformation ofhe metastable tetragonal grains to the monoclinic structure
3,4
t–m transformation) around a propagating crack. However,-TZP ceramics have a problem of low temperature degra-ation (LTD).5 LTD is a process where the spontaneous t–m∗ Corresponding author. Tel.:+32 16 37 77 38; fax: +32 16 32 19 90.E-mail addresses: [email protected], [email protected]
F. Zhang).
tb03wfmt
ttp://dx.doi.org/10.1016/j.jeurceramsoc.2014.09.018955-2219/© 2014 Elsevier Ltd. All rights reserved.
ransformation is unintentionally initiated and accelerated byater penetration in the temperature range of 20–300 ◦C.6,7 A
arge number of yttria-stabilized zirconia femoral heads failedn a very short time in 2001 due to the LTD problem.8
Therefore, it is important to assess the degradation behaviourf dental Y-TZP biomaterials and develop stable materials with-ut compromising on their excellent properties.
In the field of dental restoration, 3Y-TZP powders (Tosoh TZ-Y-E) which contain 0.25 wt.% alumina addition are widely usednd 0.25 wt.% alumina was added to improve the degradationesistance.9 The strategy of adding a small amount of aluminao increase the degradation resistance of Y-TZP ceramics haseen known for a long time.10–12 However, it is not clear why.25 wt.% alumina was added in the frequently used Tosoh TZ-Y-E powder. Although the degradation resistance of 3Y-TZPs
as reported to decrease as the amount of alumina decreasedrom 0.25, 0.15, 0.05 to 0 wt.%,13 it is not clear whether addingore than 0.25 wt.% alumina might result in a higher degrada-
ion resistance. Different results were reported about the amount

7 ean C
oostAtara
wdccofa
bytt3
i5Ta
2
2
2gaimAsGBt2i3ep
pird3u
2
awgagE(ssgomd6tawenbeZ
(owVeau
3aw
V
o
2
s1wm
42 F. Zhang et al. / Journal of the Europ
f alumina addition for controlling the hydrothermal degradationf Y-TZP ceramics. Masaki et al. reported that high purity ZrO2tarting powder was needed to inhibit the transformation,14 buthey also claimed that the effect of additives like TiO2, Fe2O3 andl2O3 depends on their amount.14,15 Tsubakino et al. showed
hat the t–m transformation can be limited to the surface layer bydding 1.2 to 12 wt.% Al2O3,16 but 3 to 5 vol.% Al2O3 was alsoeported to suppress the hydrothermal degradation of 2Y-TZPnd 3Y-TZP ceramics.11
Furthermore, the amount of alumina addition has to beell controlled for the application of Y-TZP ceramics inental restorations, since it can significantly reduce the translu-ency of 3Y-TZP ceramics.13,17,18 Nowadays, many dentalompanies are lowering the amount of alumina addition inrder to make high translucent dental zirconia.13,19,20 There-ore, it is necessary to assess the crucial amount of aluminaddition.
In addition, according to the phase diagram, zirconia cane stabilized as TZP ceramic with 2–3.5 mol% Y2O3
5,21 andttria-coated powder based 3Y-TZP was recently reportedo have a higher hydrothermal stability and higher frac-ure toughness, compared to co-precipitated powder basedY-TZP.22,23
Therefore, the purpose of this work was to investigate thenfluence of different amount of alumina addition (0.25, 2 and
wt.%) on the mechanical properties and LTD behaviour of Y-ZP ceramics, stabilized with 2, 2.5 and 3 mol% yttria processedccording to the yttrium nitrate coating route.
. Materials and methods
.1. Sample preparation
0.25, 2 and 5 wt.% alumina were, respectively, added to, 2.5 and 3 mol% yttria coated ZrO2 powder to investi-ate the influence of the alumina addition as compared tolumina-free samples. According to the reported nitrate coat-ng technique,22 the starting powders were prepared from pure
onoclinic ZrO2 nanopowder (grade TZ-0, Tosoh, Japan),l(NO3)3·9H2O (Aldrich Chemical Company) and Y(NO3)3
olution which was obtained by dissolving Y2O3 (99.9%, Acros,eel, Belgium) in warm nitric acid (65%, Sigma-Aldrich,ornem, Belgium). Powder mixtures were first mixed in a mul-
idirectional mixer (Turbula type T2C, Basel, Switzerland) for4 h in ethanol using 5 mm Y-TZP milling balls. The result-ng mixtures were then dried and calcined in air at 800 ◦C for0 min. A second multidirectional mixing was performed inthanol for 48 h to break the hard agglomerates in the calcinedowder.
The TZP specimens were obtained through cold isostaticressing (CIP) at 300 MPa and subsequent pressureless sinter-ng in air at 1450–1550 ◦C for 2 h. The nomenclature of the
esulting experimental alumina-free, 0.25, 2 and 5 wt.% aluminaoped 3Y-TZP used throughout the text is 3Y–0Al, 3Y–0.25Al,Y–2Al and 3Y–5Al, respectively. The same nomenclature wassed for the 2.5Y-TZP and 2Y-TZP.iwta
eramic Society 35 (2015) 741–750
.2. Density and mechanical property measurements
The density of the sintered ceramics was measured in ethanolccording to the Archimedes principle. The sintered samplesere cut into 3 mm thick specimens and mirror polished using arit diamond disk first, refined with 3 �m diamond suspensionnd finalized by colloidal silica. The microstructure was investi-ated by scanning electron microscopy (SEM, XL-30FEG, FEI,indhoven, The Netherlands) on polished and thermally etched
1250 ◦C for 25 min in air) cross-sections. The average grainize was measured on SEM micrographs using IMAGE-PROoftware according to the linear intercept method. The reportedrain sizes were the as-measured values, without any correction,btained from at least 1000 gr. Scanning transmission electronicroscopy (STEM) images, elemental mapping and energy-
ispersive spectroscopy (EDS) were performed with a FEI Titan0-300 “cubed” transmission electron microscope to examinehe distribution of Y3+, Al3+ and Zr4+ around the grain bound-ries. Electron transparent samples were prepared by ion-millingith an Ion Slicer (EM-09100IS, Jeol, Japan). The transmission
lectron microscope was operated at 200 kV and a high mag-ification having a mapping resolution below 0.19 nm. 5–7 groundaries in each specimen were analyzed. The quantitativelemental mapping was acquired to calculate the Y3+, Al3+ andr4+ concentration profile using ESPRIT 1.9 software.
The Vickers hardness was measured on a hardness testerModel FV-700, Future-Tech Corp., Tokyo, Japan) with a loadf 9.8 N and a dwell time of 10 s. The indentation toughnessas evaluated from the radial crack pattern accompanying theickers indentations and calculated according to the Anstisquation.24 The reported values are the mean and standard devi-tion of 10 indentations. An E-modulus value of 210 GPa wassed to calculate the fracture toughness of all ceramics.
Phase identification was done by X-ray diffraction (XRD,003-TT, Seifert, Ahrensburg, Germany) using Cu-K� radiationt 40 kV and 40 mA. The volume fraction of monoclinic phaseas calculated according to the formula of Toraya et al. [25]:
m = 1.311(I−111m + I111
m
)1.311
(I−111m + I111
m
) + I101t
(1)
Monoclinic ZrO2 was hardly detected on the polished surfacef all Y-TZPs.
.3. Degradation test and characterization
For low temperature degradation (LTD) testing, double-ide mirror polished specimens were autoclaved in steam at34 ◦C and 0.2 MPa up to 40 h. At predefined times, the testas interrupted to measure the surface t–m transformation byeans of XRD. XRD patterns were recorded on both pol-
◦ ◦
shed surfaces of each specimen in the 27 ≤ 2θ ≤ 33 rangeith a scan step of 2 s/step and a scan size of 0.02◦, andhe volume fraction of monoclinic phase was also calculatedccording to the formula of Toraya et al. [25]. The surface

ean C
tfi
wec
oaFs1owMbA
b
wTet
iatw1
iuwtstamcmgTt
V
ms
3
3
0tdmdgsecogg
pcn2wstt(oobwb
aTsts
tabAr3wYds
3p
F. Zhang et al. / Journal of the Europ
ransformation curves as a function of degradation time weretted by the Mehl–Avrami–Johnson (MAJ) model26:
Vm
Vms= 1 − exp
(−(bt)n)
(2)
ith Vms, the m-ZrO2 saturation level and b and n, the param-ters describing the effective t–m transformation and spatialharacteristics of the crystallization process, respectively.6,12
The apparent activation energy for the surface transformationf 3Y-TZPs during hydrothermal degradation was calculatedccording to the method proposed by Chevalier et al. [26].or these samples, accelerated aging tests were performed inteam at four different temperature (160 ◦C, 145 ◦C, 134 ◦C and10 ◦C), the surface t–m transformation was measured by meansf the above mentioned XRD procedure till the sample surfacesere saturated with monoclinic zirconia. The b parameter ofAJ equation was temperature dependent. At any temperature
elow the “nose” temperature of transformation, it follows therrhenius equation:
= b0 exp
(−Q
RT
)(3)
here b0 is a material constant, R is the universal gas constant, is the absolute temperature and Q is the apparent activationnergy of phase transformation during hydrothermal degrada-ion.
The “nose” temperature for the transformation of 3Y-TZPss higher than 250 ◦C, and it is independent on the aluminaddition.27 Therefore, the apparent activation energies for theransformation of 3Y-TZPs during hydrothermal degradationere obtained from the slope of the Arrhenius plot, ln(b) vs./T.
The in-depth t–m transformation profile was measured on pol-shed cross-sections of 40 h hydrothermally treated specimenssing micro-Raman spectroscopy (Senterra, Bruker, Germany)ith a 532 nm wavelength laser focused through a 100× objec-
ive (lateral resolution ≤1 �m). Line scans perpendicular to theurface were performed from the surface edge. Raman spec-ra were recorded from 45 to 1500 cm−1 in a step of 1 �mnd the spectra integration time was 20 s with three successiveeasurements per point. The integrated intensities (I) of the
haracteristic bands of the tetragonal (142 and 256 cm−1) andonoclinic (179 and 190 cm−1) phase was quantified with back-
round subtracted spectra using OPUS spectroscopy software.he monoclinic phase content (Vm) was calculated according to
he formula reported by Clarke and Adar28:
m =(I179m + I190
m
)(I179m + I190
m
) + 0.97(I142t + I256
t
) (4)
After 40 h hydrothermal treatment, the depth of the transfor-ation zone was also investigated on polished cross-sections by
canning electron microscopy (SEM).
p
o
eramic Society 35 (2015) 741–750 743
. Results
.1. Influence of alumina amount on the microstructure
The microstructures of 2, 2.5 and 3Y-TZPs doped with 0,.25, 2 or 5 wt.% alumina sintered at 1550 ◦C are representa-ively compared in Fig. 1. The alumina phase could be easilyifferentiated from the zirconia matrix by its dark contrast. Alu-ina grains were scarcely observed in the 0.25 wt.% alumina
oped TZPs, but easily found at the grain boundary of zirconiarains in the 2 and 5 wt.% alumina doped TZPs. Grain size mea-urements (Table 1) revealed that 0.25 wt.% alumina additionnhanced ZrO2 grain growth when compared to alumina-freeeramics, independent on the yttria content. A higher amountf alumina addition however did not further enhance the grainrowth, but on the contrary resulted in a smaller average zirconiarain size compared to the 0.25 wt.% alumina doped equivalents.
A higher amount of apparent porosity, probably due to grainull out during polishing, was observed in the 2.5 and 2Y-TZPeramics compared to 3Y-TZP. The average grain size of zirconiaon-linearly increased with decreasing yttria content from 3 to
mol%, and the increment was higher when the yttria contentas decreased from 2.5 to 2 mol% (see Table 1). Furthermore, a
urface uplift, as shown in the inset of Fig. 1(c2), associated tohe onset of spontaneous tetragonal to monoclinic zirconia phaseransformation was observed for 2Y-TZPs sintered at 1550 ◦CFig. 1(c1)–(c4)). The typical triangular shape reliefs, indicativef martensitic transformation, were clearly visible, independentn the alumina content. The self-transformation was triggeredy the thermal etching process, since no clear monoclinic peakas observed in the XRD patterns of all polished Y-TZP gradesefore thermal etching.
At a sintering temperature of 1450 and 1500 ◦C, aluminaddition and yttria content influenced the microstructures of Y-ZPs in a similar way as when sintered at 1550 ◦C, but the grainizes of zirconia and alumina were smaller and the t–m self-ransformation was not observed in 2Y-TZP ceramics at lowerintering temperature.
Fig. 2(a) shows STEM images and corresponding Al elemen-al maps obtained by EDS-STEM measurements on 3Y–0.25Alnd 3Y–5Al. Al3+ clearly segregated at the zirconia grainoundary in both 3Y–0.25Al and 3Y–5Al, and the quantitativel-concentration profiles across the grain boundary in Fig. 2(b)
evealed that the amount of segregated Al3+ in 3Y–5Al andY–0.25Al was comparable. Note that Al3+ was co-segregatedith Y3+ at the zirconia grain boundary, but the segregation of3+ did not have significant difference in samples doped withifferent amount of alumina, so the segregation of Y3+ was nothown here.
.2. Influence of alumina amount on the mechanicalroperties
The density, Vickers hardness, fracture toughness and t-ZrO2hase transformability of all Y-TZPs are summarized in Table 1.
Doping with 0.25, 2 or 5 wt.% alumina, not only the additionf alumina but also the amount of alumina addition, did not result

744 F. Zhang et al. / Journal of the European Ceramic Society 35 (2015) 741–750
Fig. 1. SEM images of the Y-TZP ceramics sintered at 1550 ◦C as a function of the alumina and yttria content.
Table 1Grain size and mechanical properties of the Y-TZPs sintered for 2 h at 1450 ◦C, as a function of the Al2O3 and yttria content.
Ceramic grade Grain size (nm) Density (g/cm3) Hardness (kg/mm2) Toughness (MPa·m1/2)
3Y–0Al 211 ± 99 6.02 1304 ± 5 4.1 ± 0.13Y–0.25Al 225 ± 110 6.03 1315 ± 8 4.0 ± 0.23Y–2Al 217 ± 106 5.97 1392 ± 17 3.9 ± 0.13Y–5Al 214 ± 115 5.87 1403 ± 17 4.2 ± 0.22.5Y–0Al 230 ± 102 6.05 1269 ± 14 5.1 ± 0.12.5Y–0.25Al 246 ± 126 5.96 1218 ± 5 4.9 ± 0.22.5Y–2Al 231 ± 94 5.94 1269 ± 14 4.9 ± 0.12.5Y–5Al 230 ± 96 5.91 1218 ± 5 5.1 ± 0.32Y–0Al 292 ± 130 6.03 1239 ± 7 8.6 ± 0.32Y–0.25Al 313 ± 139 5.94 1198 ± 7 8.3 ± 0.42Y–2Al 307 ± 156 5.91 1181 ± 10 8.8 ± 0.32Y–5Al 291 ± 135 5.89 1203 ± 9 7.4 ± 0.3

F. Zhang et al. / Journal of the European Ceramic Society 35 (2015) 741–750 745
Fig. 2. STEM images of the grain boundaries and corresponding Al elemental maps in
profiles across the grain boundaries in 3Y–0.25Al and 3Y–5Al (b).
Fg
iiwddp
ttoea4(a2fw
tiF
3Y
3
Xht
aYdfdcfy
pdclf2aoaifdegradation retarding effect than 2 and 5 wt.% alumina.
ig. 3. The fracture toughness of Y-TZPs as a function of the average ZrO2
rain size.
n a significant variation in the fracture toughness and hardnessn the 2, 2.5 and 3Y-TZP systems. The density slightly decreasedith increasing alumina content because of the lower intrinsicensity of alumina, but all ceramics could be considered as fullyense since only pull out porosity could be observed on theolished cross-sections by means of SEM in Fig. 1.
Plotting the fracture toughness of all Y-TZPs as a function ofhe average ZrO2 grain size, as shown in Fig. 3, clearly revealshat alumina addition did not influence the fracture toughnessf all Y-TZPs. The yttria content was a crucial factor influ-ncing the fracture toughness of Y-TZP. Independent on thelumina addition, the fracture toughness of 3Y-TZPs was about.2 MPa·m1/2, which was slightly lower than that of 2.5Y-TZPsabout 5 MPa·m1/2). The fracture toughness of 2Y-TZPs wasbout 8.0 MPa·m1/2 and considerably higher than for 3Y- and
Y-TZPs, in agreement with the much higher t-ZrO2 phase trans-ormability of 2Y-TZPs. The high transformability of 2Y-TZPas also reflected in the microstructure, since the spontaneoustT
3Y–0.25Al and 3Y–5Al sintered at 1550 ◦C (a), and quantitative Al-distribution
–m phase transformation could be triggered by thermal etch-ng on the surface of all 2Y-TZPs sintered at 1550 ◦C (seeig. 1(c1)–(c4)).
.3. Influence of alumina amount on the degradation of-TZPs
.3.1. Surface degradationThe surface monoclinic zirconia content, as measured by
RD, as a function of the degradation time at 134 ◦C ofydrothermal treatment is shown in Fig. 4 for all ceramics sin-ered at 1450 ◦C and 1550 ◦C.
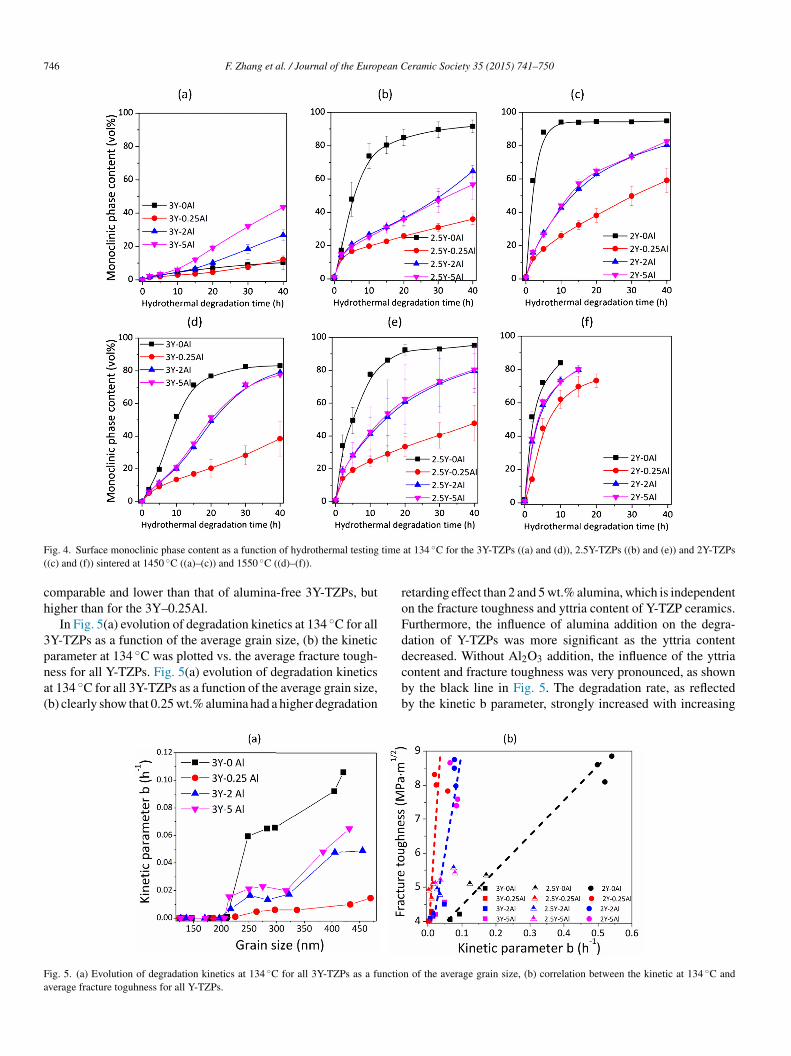
The addition of alumina and the amount of alumina added had significant influence on the surface transformation of all the-TZPs. 0.25 wt.% alumina addition retarded the hydrothermalegradation of all ceramic grades when compared to the Al2O3-ree ceramics. However, adding more alumina (2 and 5 wt.%)id not further retard the degradation of the Y-TZPs. On theontrary, 2 and 5 wt.% alumina-doped Y-TZPs always degradedaster than 0.25 wt.% alumina doped Y-TZP, independent on thettria content and sintering temperature.
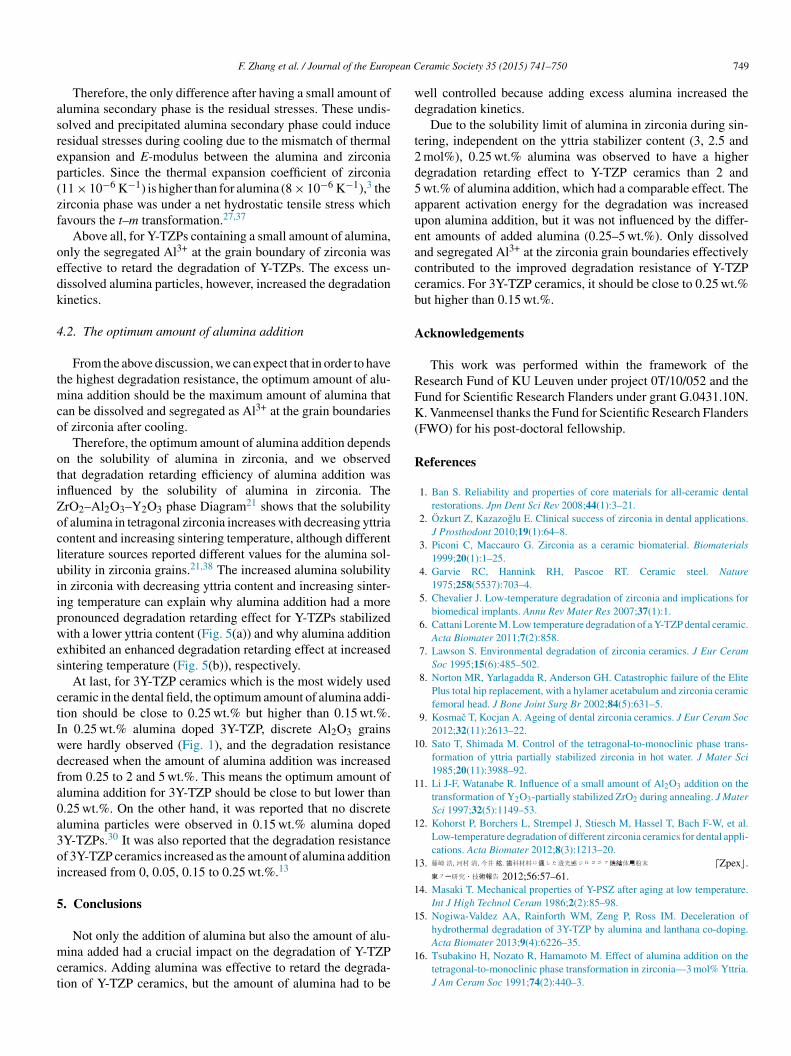
In order to comprehensively show our results, the kineticarameter (b) of the surface transformation for all Y-TZPs waseduced by MAJ fitting since all the surface transformationurves followed a sigmoidal behavior. Fig. 5(a) shows the evo-ution of the degradation kinetics at 134 ◦C for 3Y-TZPs as aunction of the average grain size. Below an average grain size of10 nm, all 3Y-TZPs had a very slow surface transformation with
b value close to zero, and the b values were nearly independentn the alumina addition and the amount of alumina addition. At
grain size above 210 nm, the degradation rate increased withncreasing grain size and alumina addition slowed down the sur-ace degradation of 3Y-TZPs. 0.25 wt.% alumina had a higher
Furthermore, the 0.25 wt.% alumina added 3Y-TZP showedhe lowest grain size dependency of the degradation rate.he grain size dependency of the 3Y–2Al and 3Y-5Al was
746 F. Zhang et al. / Journal of the European Ceramic Society 35 (2015) 741–750
F time
(
ch
3pna(
roFdd
Fa
ig. 4. Surface monoclinic phase content as a function of hydrothermal testing(c) and (f)) sintered at 1450 ◦C ((a)–(c)) and 1550 ◦C ((d)–(f)).
omparable and lower than that of alumina-free 3Y-TZPs, butigher than for the 3Y–0.25Al.
In Fig. 5(a) evolution of degradation kinetics at 134 ◦C for allY-TZPs as a function of the average grain size, (b) the kineticarameter at 134 ◦C was plotted vs. the average fracture tough-
ess for all Y-TZPs. Fig. 5(a) evolution of degradation kineticst 134 ◦C for all 3Y-TZPs as a function of the average grain size,b) clearly show that 0.25 wt.% alumina had a higher degradationcbb
ig. 5. (a) Evolution of degradation kinetics at 134 ◦C for all 3Y-TZPs as a functioverage fracture toguhness for all Y-TZPs.
at 134 ◦C for the 3Y-TZPs ((a) and (d)), 2.5Y-TZPs ((b) and (e)) and 2Y-TZPs
etarding effect than 2 and 5 wt.% alumina, which is independentn the fracture toughness and yttria content of Y-TZP ceramics.urthermore, the influence of alumina addition on the degra-ation of Y-TZPs was more significant as the yttria contentecreased. Without Al O addition, the influence of the yttria
2 3ontent and fracture toughness was very pronounced, as showny the black line in Fig. 5. The degradation rate, as reflectedy the kinetic b parameter, strongly increased with increasingn of the average grain size, (b) correlation between the kinetic at 134 ◦C and

ean C
fdctwiew
3d
itotrdtwdatfifFt3dahb0
3d
ctTcRaotF
aanAataZoo
atdlitttmh
4
micttmtd
ddrpoIdtsp
4b
mbgwgtbatetTat
F. Zhang et al. / Journal of the Europ
racture toughness and decreasing yttria content. The degra-ation rate of the 2 and 5 wt.% Al2O3 doped ceramics wasomparable and substantially less influenced by, as illustrated byhe dashed blue line in Fig. 5, but the degradation rate increasedith increasing fracture toughness, i.e. lower yttria content. As
llustrated by the red line, the degradation rate was least depend-nt on the fracture toughness and yttria content when the Y-TZPas doped with 0.25 wt.% Al2O3.
.3.2. The apparent activation energy during hydrothermalegradation
The value of the apparent activation energy provides insightnto the mechanism of the transformation during degradation, sohe apparent activation energy for the t–m phase transformationf all 3Y-TZPs sintered at 1550 ◦C was calculated accordingo the method proposed by Chevalier et al. [26] Fig. 6(a) rep-esentatively shows the content of m-ZrO2 as a function ofegradation time at different temperature of the hydrothermalreatment. The same transformation saturation level of (Vms)as obtained for samples with identical composition that wereegraded at different temperatures. The saturation level was 83nd 81 vol.% for alumina and alumina-doped 3Y-TZPs, respec-ively. The value of the kinetic parameter b was deduced by MAJtting, and a linear relation between ln(b) and 1/T was obtainedor all alumina-free and alumina-doped 3Y-TZPs, as shown inig. 6(b). According to the Arrehenius equation of Eq. (3),
he apparent activation energy for the surface transformation ofY–0Al, 3Y–0.25Al, 3Y–2Al and 3Y–5Al during hydrothermalegradation was calculated to be 98 ± 0.6, 109 ± 2.2, 107 ± 1.5nd 105 ± 0.9 kJ/mol, respectively. The activation energy forydrothermal degradation was increased by alumina additionut it was independent on the alumina content ranging between.25 and 5 wt.%.
.3.3. Transformation depth after hydrothermalegradation
Since only the transformation up to a depth of about 8 �man be measured by XRD, the transformation propagation insidehe bulk material, which determines the final deterioration of Y-ZPs, was assessed by measuring the monoclinic ZrO2 phaseontent as a function of depth below the surface by micro-aman spectroscopy on polished cross-sections of 3Y-TZPsfter 40 h of hydrothermally degradation at 134 ◦C. The resultn the 3Y-TZPs sintered at 1550 ◦C is shown in Fig. 7(a) andhe corresponding cross-sectional SEM images are shown inig. 7(b).
Fig. 7(a) shows that the monoclinic zirconia content profilest the transformation front are the same for the alumina-freend alumina-doped 3Y-TZPs. However, alumina addition sig-ificantly decreased the depth of transformation propagation.fter 40 h of ageing, the transformation front penetrated up to
depth of 16 �m in 3Y–0Al of which the top 12 �m was fullyransformed. The transformation front was observed at a depth of
bout 12 and 10 �m in 3Y–5Al and 3Y–2Al, respectively. The m-rO2 saturation plateau was not reached in 3Y–0.25Al after 40 hf hydrothermal degradation and the onset of transformationnly reached up to a depth of 4 �m.tapY
eramic Society 35 (2015) 741–750 747
The hydrothermally degraded region appeared as a layer with large amount of intergranular fracture and grain pull-out inhe SEM images (Fig. 7(b)), allowing to easily distinguish theegraded and pristine region by a distinct border which corre-ated well with the sharp drop from the saturated plateau to zeron the depth transformation profiles (Fig. 7(a)), The thickness ofhe degraded zone, as measured by SEM after 40 h of ageing, forhe 5, 2, 0.25 and 0 wt.% alumina doped ceramics was measuredo be 9, 8, 2 and 15 �m, respectively. This confirmed the resultseasured by micro-Raman spectroscopy that 0.25 wt.% alumina
ad the highest degradation retarding effect to 3Y-TZPs.
. Discussion
In this work, we reported that not only the addition of alu-ina but also the amount of alumina addition has a crucial
mpact on the degradation of Y-TZP ceramics. Our results areonsistent with previous investigations confirming that the addi-ion of a small amount of alumina can significantly retardhe degradation of Y-TZPs7,12,16,27 without compromising the
echanical properties.23,27,29 On the other hand, we observedhat the amount of alumina addition had a crucial impact on theegradation of Y-TZPs.
Although the alumina addition is effective to retard the degra-ation of Y-TZP ceramics, higher amounts of alumina additionid not show any further improvement. 0.5 wt.% alumina waseported not to further improve the degradation resistance com-ared to a 0.1 wt.% Al2O3 doped 3Y-TZP.15 In our work, we evenbserved that adding excess alumina resulted in a negative effect.ndependent on the yttria content, the 2 and 5 wt.% aluminaoped Y-TZPs had a substantially lower degradation resistancehan 0.25 wt.% alumina doped Y-TZPs. This was reflected in theurface t–m transformation (Figs. 4–6) and the transformationropagation in the sub-surface region (Fig. 7).
.1. Higher amount of alumina addition did not meanetter effect
The degradation retarding effect of a small amount of alu-ina addition was attributed to the segregated Al3+ at the grain
oundary of zirconia.30,31 We also observed that Al3+ was homo-eneously segregated at the grain boundary of zirconia over aidth of 5 nm in alumina-doped samples without forming anylass phase (Fig. 2). Furthermore, in this work, we observed thathe apparent activation energy for the degradation was increasedy the alumina addition (Fig. 6), indicating that the mechanismssociated with the water-induced transformation was altered byhe segregated Al3+ at the ZrO2 grain boundary. Nogiwa-Valdezt al. showed that the segregated Al3+ fundamentally changed the–m transformation from nucleation-driven to growth-driven.15
herefore, the key point for the degradation retarding effect bylumina addition is the Al3+ segregation to the grain boundary ofhe zirconia grains. Segregated Al3+, which has a lower valence
4+
han Zr , could produce oxygen vacancies at the grain bound-ry of zirconia and balance the charge during the degradationrocess. The grain boundary is important for the degradation of-TZPs because it is believed to be the initiation point for the t–m
748 F. Zhang et al. / Journal of the European Ceramic Society 35 (2015) 741–750
F at difo
tp
ag
oSgciawpeagtt
dt
1dao
daacodabt
Fd
ig. 6. (a) Surface monoclinic phase content as a function of degradation time
f lnb vs. 1/T for all 3Y-TZPs sintered at 1550 ◦C (r2 > 99%).
ransformation and also the preferred path for transformation toropagate into the material during degradation.32–34
However, the solubility of alumina in zirconia is very limitednd only a limited amount of Al3+ can be segregated at the ZrO2rain boundary.
Quantitative EDS analysis (Fig. 2(b)) showed that the amountf segregated Al3+ in 3Y–5Al was similar as in 3Y–0.25Al. TheEM microstructures (Fig. 1) revealed the presence of Al2O3rains at the grain boundaries in the 2 and 5 wt.% alumina dopederamics, whereas discrete Al2O3 grains were hardly observedn the 0.25 wt.% alumina doped Y-TZPs. Therefore, in the 2nd 5 wt.% alumina doped Y-TZPs, the alumina solubility limitas exceeded and the excess alumina precipitated as a secondaryhase at the triple points of the zirconia grains after cooling. Thexcess discrete Al2O3 grains present at the grain boundaries had
grain boundary pinning effect, which resulted in a smaller ZrO2rain size of the 2 and 5 wt.% alumina doped grades compared
o the 0.25 wt % doped ceramics (Table 1). Besides, we knowhat the grain size of ZrO2 are not responsible for the lowerrh
ig. 7. (a) Monoclinic ZrO2 profiles acquired by Raman micro spectroscopy on croegradation at 134 ◦C. (b) The corresponding cross-sectional SEM images.
ferent temperatures for 3Y–0.25Al sintered at 1550 ◦C. (b) The Arrhenius plot
egradation resistance of 2 and 5 wt.% alumina doped Y-TZPshan for 0.25 wt.% alumina doped Y-TZP.
What’s more, an apparent activation energy of roughly06 kJ/mol was obtained for the degradation of all alumina-oped 3Y-TZPs, independent on the amount of 0.25–5 wt.%lumina addition. This means the physico-chemical mechanismf the transformation is the same for all alumina-doped Y-TZPs.
Furthermore, the effect of alumina addition retarding theegradation kinetics was claimed to be because of the decreasedrea of zirconia exposed to the water and the increased amount oflumina should result in a higher degradation resistance to TZPeramics.27,35 This explanation might be true when the amountf alumina addition is high,12,27,35,36 but it cannot explain theegradation kinetics in this study for Y-TZPs containing a smallmount of alumina. The area of zirconia exposed to water shoulde smaller as the alumina fraction was increased from 0.25 wt.%o 2 and 5 wt.%, but 0.25 wt.% alumina had a higher degradation
etarding effect than 2 and 5 wt.% of alumina addition, whichad a comparable effect.ss-sectioned 3Y-TZPs sintered for 2 h at 1550 ◦C after 40 h of hydrothermally
ean C
asrep(zf
oedk
4
tmco
otiZocluiipwes
ctIwdfa0a3oi
5
mct
wd
t2d5aueaccb
A
RFK(
R
1
1
1
1
1
1
F. Zhang et al. / Journal of the Europ
Therefore, the only difference after having a small amount oflumina secondary phase is the residual stresses. These undis-olved and precipitated alumina secondary phase could induceesidual stresses during cooling due to the mismatch of thermalxpansion and E-modulus between the alumina and zirconiaarticles. Since the thermal expansion coefficient of zirconia11 × 10−6 K−1) is higher than for alumina (8 × 10⁻⁶ K−1),3 theirconia phase was under a net hydrostatic tensile stress whichavours the t–m transformation.27,37
Above all, for Y-TZPs containing a small amount of alumina,nly the segregated Al3+ at the grain boundary of zirconia wasffective to retard the degradation of Y-TZPs. The excess un-issolved alumina particles, however, increased the degradationinetics.
.2. The optimum amount of alumina addition
From the above discussion, we can expect that in order to havehe highest degradation resistance, the optimum amount of alu-
ina addition should be the maximum amount of alumina thatan be dissolved and segregated as Al3+ at the grain boundariesf zirconia after cooling.
Therefore, the optimum amount of alumina addition dependsn the solubility of alumina in zirconia, and we observedhat degradation retarding efficiency of alumina addition wasnfluenced by the solubility of alumina in zirconia. TherO2–Al2O3–Y2O3 phase Diagram21 shows that the solubilityf alumina in tetragonal zirconia increases with decreasing yttriaontent and increasing sintering temperature, although differentiterature sources reported different values for the alumina sol-bility in zirconia grains.21,38 The increased alumina solubilityn zirconia with decreasing yttria content and increasing sinter-ng temperature can explain why alumina addition had a moreronounced degradation retarding effect for Y-TZPs stabilizedith a lower yttria content (Fig. 5(a)) and why alumina addition
xhibited an enhanced degradation retarding effect at increasedintering temperature (Fig. 5(b)), respectively.
At last, for 3Y-TZP ceramics which is the most widely usederamic in the dental field, the optimum amount of alumina addi-ion should be close to 0.25 wt.% but higher than 0.15 wt.%.n 0.25 wt.% alumina doped 3Y-TZP, discrete Al2O3 grainsere hardly observed (Fig. 1), and the degradation resistanceecreased when the amount of alumina addition was increasedrom 0.25 to 2 and 5 wt.%. This means the optimum amount oflumina addition for 3Y-TZP should be close to but lower than.25 wt.%. On the other hand, it was reported that no discretelumina particles were observed in 0.15 wt.% alumina dopedY-TZPs.30 It was also reported that the degradation resistancef 3Y-TZP ceramics increased as the amount of alumina additionncreased from 0, 0.05, 0.15 to 0.25 wt.%.13
. Conclusions
Not only the addition of alumina but also the amount of alu-ina added had a crucial impact on the degradation of Y-TZP
eramics. Adding alumina was effective to retard the degrada-ion of Y-TZP ceramics, but the amount of alumina had to be
1
eramic Society 35 (2015) 741–750 749
ell controlled because adding excess alumina increased theegradation kinetics.
Due to the solubility limit of alumina in zirconia during sin-ering, independent on the yttria stabilizer content (3, 2.5 and
mol%), 0.25 wt.% alumina was observed to have a higheregradation retarding effect to Y-TZP ceramics than 2 and
wt.% of alumina addition, which had a comparable effect. Thepparent activation energy for the degradation was increasedpon alumina addition, but it was not influenced by the differ-nt amounts of added alumina (0.25–5 wt.%). Only dissolvednd segregated Al3+ at the zirconia grain boundaries effectivelyontributed to the improved degradation resistance of Y-TZPeramics. For 3Y-TZP ceramics, it should be close to 0.25 wt.%ut higher than 0.15 wt.%.
cknowledgements
This work was performed within the framework of theesearch Fund of KU Leuven under project 0T/10/052 and theund for Scientific Research Flanders under grant G.0431.10N.. Vanmeensel thanks the Fund for Scientific Research Flanders
FWO) for his post-doctoral fellowship.
eferences
1. Ban S. Reliability and properties of core materials for all-ceramic dentalrestorations. Jpn Dent Sci Rev 2008;44(1):3–21.
2. Özkurt Z, Kazazoglu E. Clinical success of zirconia in dental applications.J Prosthodont 2010;19(1):64–8.
3. Piconi C, Maccauro G. Zirconia as a ceramic biomaterial. Biomaterials1999;20(1):1–25.
4. Garvie RC, Hannink RH, Pascoe RT. Ceramic steel. Nature1975;258(5537):703–4.
5. Chevalier J. Low-temperature degradation of zirconia and implications forbiomedical implants. Annu Rev Mater Res 2007;37(1):1.
6. Cattani Lorente M. Low temperature degradation of a Y-TZP dental ceramic.Acta Biomater 2011;7(2):858.
7. Lawson S. Environmental degradation of zirconia ceramics. J Eur CeramSoc 1995;15(6):485–502.
8. Norton MR, Yarlagadda R, Anderson GH. Catastrophic failure of the ElitePlus total hip replacement, with a hylamer acetabulum and zirconia ceramicfemoral head. J Bone Joint Surg Br 2002;84(5):631–5.
9. Kosmac T, Kocjan A. Ageing of dental zirconia ceramics. J Eur Ceram Soc2012;32(11):2613–22.
0. Sato T, Shimada M. Control of the tetragonal-to-monoclinic phase trans-formation of yttria partially stabilized zirconia in hot water. J Mater Sci1985;20(11):3988–92.
1. Li J-F, Watanabe R. Influence of a small amount of Al2O3 addition on thetransformation of Y2O3-partially stabilized ZrO2 during annealing. J MaterSci 1997;32(5):1149–53.
2. Kohorst P, Borchers L, Strempel J, Stiesch M, Hassel T, Bach F-W, et al.Low-temperature degradation of different zirconia ceramics for dental appli-cations. Acta Biomater 2012;8(3):1213–20.
3. �Zpex�.2012;56:57–61.
4. Masaki T. Mechanical properties of Y-PSZ after aging at low temperature.Int J High Technol Ceram 1986;2(2):85–98.
5. Nogiwa-Valdez AA, Rainforth WM, Zeng P, Ross IM. Deceleration ofhydrothermal degradation of 3Y-TZP by alumina and lanthana co-doping.
Acta Biomater 2013;9(4):6226–35.6. Tsubakino H, Nozato R, Hamamoto M. Effect of alumina addition on thetetragonal-to-monoclinic phase transformation in zirconia—3 mol% Yttria.J Am Ceram Soc 1991;74(2):440–3.

7 ean C
1
1
1
2
2
2
2
2
2
2
2
2
2
3
3
3
3
3
3
3
3
2006;27(10):2186–92.
50 F. Zhang et al. / Journal of the Europ
7. Suzuki T, Yoshihara K, Kawai T, Murakami H, Hattori M, Ban S. Translu-cency of dental zirconia. J Jpn Soc Dent Mater Devices 2013;32(2):92.
8. Liao Y. Influence of alumina addition on the optical property ofzirconia/alumina composite dental ceramics. J Wuhan Univ Technol2011;26(4):690.
9. Schechner G, Hauptmann H, Dittmann RK, Schnagl HR. Dental ceramicarticle, process of production and use thereof. Patent US20130341812 A1,2013.
0. Wang F, Takahashi H, Iwasaki N. Translucency of dental ceramics withdifferent thicknesses. J Prosthet Dent 2013;110(1):14–20.
1. Olga F, Fritz A. Assessment of thermodynamic parameters in the systemZrO2–Y2O3–Al2O3. Z Metallk Mater Res Adv Tech 2004;95:27–39.
2. Vleugels J, Yuan ZX, Van der Biest O. Mechanical properties ofY2O3/Al2O3-coated Y-TZP ceramics. J Eur Ceram Soc 2002;22:873–81.
3. Zhang F, Vanmeensel K, Inokoshi M, Batuk M, Hadermann J, Van Meer-beek B, et al. 3Y-TZP ceramics with improved hydrothermal degradationresistance and fracture toughness. J Eur Ceram Soc 2014;34(10):2453–63.
4. Anstis GR, Chantikul P, Lawn BR, Marshall DB. A critical evaluation ofindentation techniques for measuring fracture toughness: I, Direct crackmeasurements. J Am Ceram Soc 1981;64(9):533–8.
5. Toraya H, Yoshimura M, Somiya S. Calibration curve for quantitative anal-ysis of the monoclinic-tetragonal ZrO2 system by X-ray diffraction. J AmCeram Soc 1984;67(6):C-119–21.
6. Chevalier J, Cales B, Drouin JM. Low-temperature aging of Y-TZP ceramics.J Am Ceram Soc 1999;82(8), 2150-4.
7. Chevalier J, Gremillard L, Virkar AV, Clarke DR. The tetragonal-monoclinictransformation in zirconia: lessons learned and future trends. J Am Ceram
Soc 2009;92(9):1901–20.8. Clarke DR, Adar F. Measurement of the crystallographically transformedzone produced by fracture in ceramics containing tetragonal zirconia. J AmCeram Soc 1982;65(6):284–8.
3
eramic Society 35 (2015) 741–750
9. Tsubakino H, Sonoda K, Nozato R. Martensite transformation behaviourduring isothermal ageing in partially stabilized zirconia with and withoutalumina addition. J Mater Sci Lett 1993;12(3):196–8.
0. Ross IM, Rainforth WM, McComb DW, Scott AJ, Brydson R. The role oftrace additions of alumina to yttria-tetragonal zirconia polycrystals (Y-TZP).Scr Mater 2001;45(6):653–60.
1. Ross IM, Rainforth WM, Scott AJ, Brown AP, Brydson R, McComb DW.Electron energy-loss spectroscopy (EELS) studies of an yttria stabilizedTZP ceramic. J Eur Ceram Soc 2004;24(7):2023–9.
2. Lee R-R, Heuer AH. In situ martensitic transformation in a ternaryMgO–Y2O3–ZrO2 alloy: I, Transformation in tetragonal ZrO2 grains. J AmCeram Soc 1988;71(8):694–700.
3. Mecartney ML, Rühle M. In situ transmission electron microscopy obser-vations of the monoclinic to tetragonal phase transformation in tetragonalZrO2. Acta Metall 1989;37(7):1859–63.
4. Chevalier J. What future for zirconia as a biomaterial? Biomaterials2006;27(4):535–43.
5. Pecharromán C, Bartolomé JF, Requena J, Moya JS, Deville S, ChevalierJ, et al. Percolative mechanism of aging in zirconia-containing ceramics formedical applications. Adv Mater 2003;15(6):507–11.
6. Gutknecht D, Chevalier J, Garnier V, Fantozzi G. Key role ofprocessing to avoid low temperature ageing in alumina zirconia com-posites for orthopaedic application. J Eur Ceram Soc 2007;27(2–3):1547–52.
7. Deville S, Chevalier J, Gremillard L. Influence of surface finish and residualstresses on the ageing sensitivity of biomedical grade zirconia. Biomaterials
8. Stough MA, Hellmann JR. Solid solubility and precipitation in asingle-crystal alumina–zirconia system. J Am Ceram Soc 2002;85(12):2895–902.