Critical Examination of C-130 Programmed Depot Maintenance ...
36
AU/ACSC/0301/97-03 CRITICAL EXAMINATION OF C-130 PROGRAMMED DEPOT MAINTENANCE (PDM) INDUCTION METHODOLOGY: DETERMINING PDM INTERVALS A Research Paper Presented To The Research Department Air Command and Staff College In Partial Fulfillment of the Graduation Requirements of ACSC by Maj. John A. Daniels March 1997
-
Upload
phamkhuong -
Category
Documents
-
view
221 -
download
1
Transcript of Critical Examination of C-130 Programmed Depot Maintenance ...

AU/ACSC/0301/97-03
CRITICAL EXAMINATION OF C-130 PROGRAMMED
DEPOT MAINTENANCE (PDM) INDUCTION
METHODOLOGY: DETERMINING PDM INTERVALS
A Research Paper
Presented To
The Research Department
Air Command and Staff College
In Partial Fulfillment of the Graduation Requirements of ACSC
by
Maj. John A. Daniels
March 1997
Report Documentation Page
Report Date 01MAR1997
Report Type N/A
Dates Covered (from... to) -
Title and Subtitle Critical Examination of C-130 Programmed DepotMaintenance (PDM) Induction Methodology:Determining PDM Intervals
Contract Number
Grant Number
Program Element Number
Author(s) Daniels, John A.
Project Number
Task Number
Work Unit Number
Performing Organization Name(s) and Address(es) Air Command and Staff College Maxwell AFB, Al 36112
Performing Organization Report Number
Sponsoring/Monitoring Agency Name(s) and Address(es)
Sponsor/Monitor’s Acronym(s)
Sponsor/Monitor’s Report Number(s)
Distribution/Availability Statement Approved for public release, distribution unlimited
Supplementary Notes The original document contains color images.
Abstract
Subject Terms
Report Classification unclassified
Classification of this page unclassified
Classification of Abstract unclassified
Limitation of Abstract UU
Number of Pages 35

ii
Disclaimer
The views expressed in this academic research paper are those of the author and do
not reflect the official policy or position of the US government or the Department of
Defense.

iii
Contents
Page
DISCLAIMER.....................................................................................................................ii
LIST OF ILLUSTRATIONS.............................................................................................. iv
LIST OF TABLES .............................................................................................................. v
PREFACE .......................................................................................................................... vi
ABSTRACT......................................................................................................................vii
INTRODUCTION............................................................................................................... 1
THE C-130 FLEET ............................................................................................................. 3
CURRENT METHOD FOR DETERMINING PDM INTERVALS.................................. 5
ALTERNATIVE APPROACH TO DETERMINING PDM INTERVALS ....................... 8Primary Factors That Affect PDM Intervals................................................................... 9PDM Interval Model Development .............................................................................. 14Applying the PDM Interval Model to the C-130 Service Life Data Base.................... 16Defining the “Non-Dimensional” PDM Interval in Time (Months) ............................ 18Managed Risk versus Risk Avoidance—Refining the PDM Interval Model............... 20Advantages of the PDM Interval Model....................................................................... 22
SUMMARY ...................................................................................................................... 23Recommendations for Senior USAF Leaders .............................................................. 23
APPENDIX A: MODIFIED C-130 SERVICE LIFE DATA BASE................................ 25
BIBLIOGRAPHY ............................................................................................................. 27

iv
Illustrations
Page
Figure 1. Number of C-130H Aircraft vs. “Non-Dimensional” PDM Interval................ 17
Figure 2. “Non-Dimensional” PDM Interval vs. Time (in months)................................. 19
Figure 3. Proposed PDM Intervals (in months) vs. Number of C-130H Aircraft ............ 20
Figure 4. Proposed PDM Interval Model ......................................................................... 21

v
Tables
Page
Table 1. USAF Summary of C-130 Aircraft by Operator .................................................. 4
Table 2. Current C-130 PDM Intervals .............................................................................. 6
Table 3. C-130H Fleet Aircraft Age................................................................................... 9
Table 4. C-130H Fleet Aircraft Total Flying Hours......................................................... 10
Table 5. C-130H Fleet Flying Hours per Year ................................................................. 10
Table 6. C-130H Fleet Mission Lifetime Severity Factor ................................................ 11
Table 7. Summary of C-130H Bases, Corrosion Factors, and MAJCOMs...................... 13
Table 8. First Ten Rows of Modified C-130 Service Life Data Base.............................. 25
vi
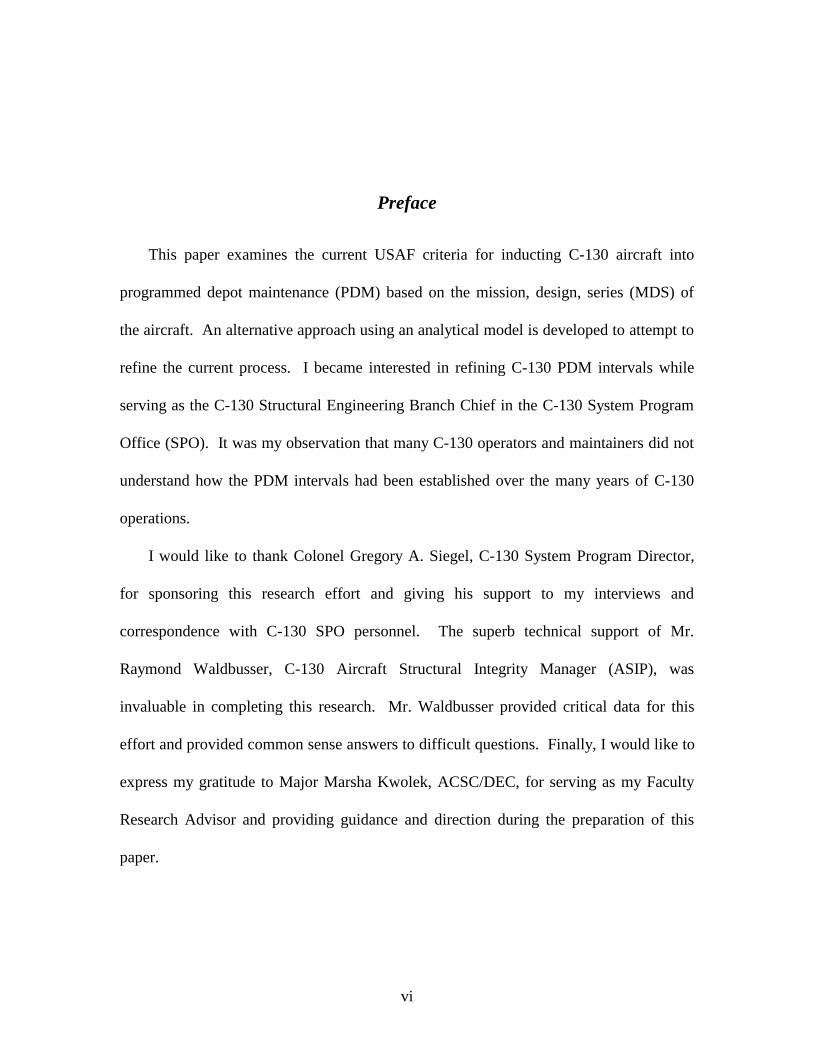
Preface
This paper examines the current USAF criteria for inducting C-130 aircraft into
programmed depot maintenance (PDM) based on the mission, design, series (MDS) of
the aircraft. An alternative approach using an analytical model is developed to attempt to
refine the current process. I became interested in refining C-130 PDM intervals while
serving as the C-130 Structural Engineering Branch Chief in the C-130 System Program
Office (SPO). It was my observation that many C-130 operators and maintainers did not
understand how the PDM intervals had been established over the many years of C-130
operations.
I would like to thank Colonel Gregory A. Siegel, C-130 System Program Director,
for sponsoring this research effort and giving his support to my interviews and
correspondence with C-130 SPO personnel. The superb technical support of Mr.
Raymond Waldbusser, C-130 Aircraft Structural Integrity Manager (ASIP), was
invaluable in completing this research. Mr. Waldbusser provided critical data for this
effort and provided common sense answers to difficult questions. Finally, I would like to
express my gratitude to Major Marsha Kwolek, ACSC/DEC, for serving as my Faculty
Research Advisor and providing guidance and direction during the preparation of this
paper.

vii
AU/ACSC/0301/97-03
Abstract
The current USAF process for establishing intervals between C-130 PDM does not
account for the wide range of aircraft variables within each aircraft MDS. This paper
develops an analytical model, based on five unique aircraft variables, to provide C-130
maintainers with a prediction tool to forecast when a C-130 aircraft requires PDM. These
five variables include: aircraft age, total flying hours, average yearly flying hours, mission
profile (expressed as a severity factor), and operating location of the aircraft. Interviews
with C-130 SPO personnel, combined with use of the C-130 Service Life Data Base,
provided the required data to develop the C-130 PDM interval model.
The C-130 PDM interval model developed in this paper allows maintainers and
operators to predict the optimum time between C-130 PDM activities. It eliminates the
requirement to base PDM intervals on aircraft MDS. As a result, there is a potential for
significant savings by deferring PDM for a portion of the C-130 fleet. Finally, the PDM
interval model developed in this paper may be applicable for other DOD aircraft which
use aircraft MDS as the determinant of PDM intervals.
1
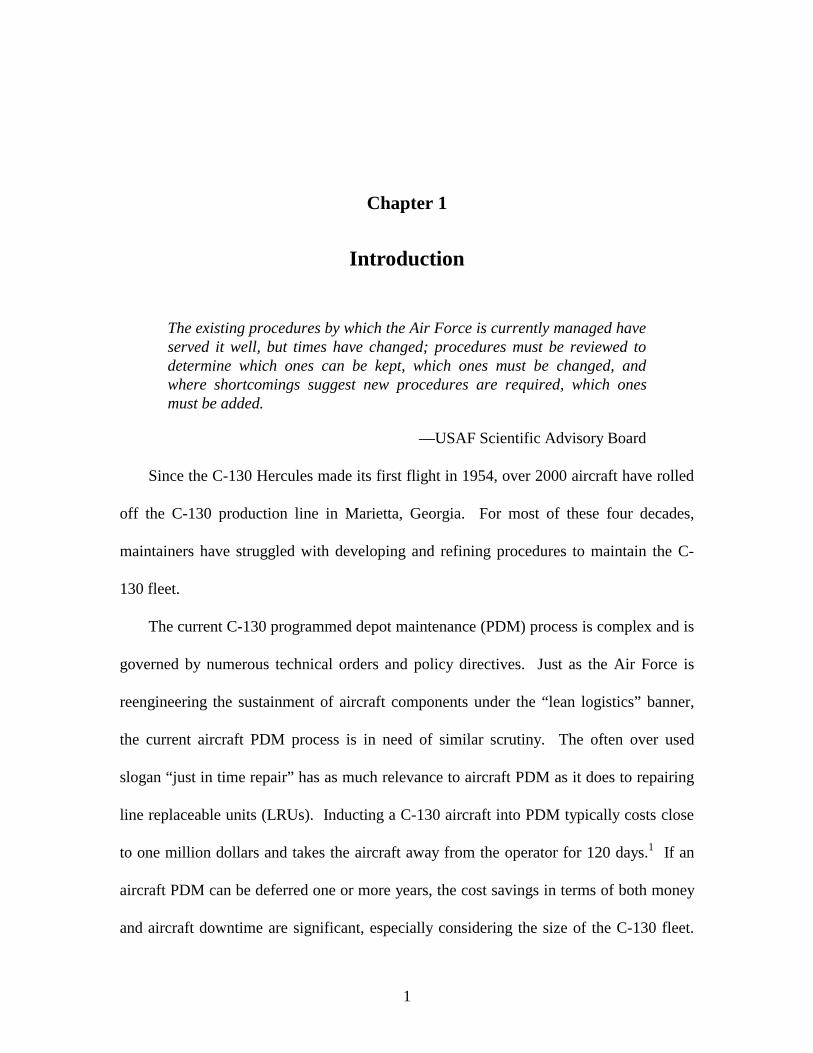
Chapter 1
Introduction
The existing procedures by which the Air Force is currently managed haveserved it well, but times have changed; procedures must be reviewed todetermine which ones can be kept, which ones must be changed, andwhere shortcomings suggest new procedures are required, which onesmust be added.
—USAF Scientific Advisory Board
Since the C-130 Hercules made its first flight in 1954, over 2000 aircraft have rolled
off the C-130 production line in Marietta, Georgia. For most of these four decades,
maintainers have struggled with developing and refining procedures to maintain the C-
130 fleet.
The current C-130 programmed depot maintenance (PDM) process is complex and is
governed by numerous technical orders and policy directives. Just as the Air Force is
reengineering the sustainment of aircraft components under the “lean logistics” banner,
the current aircraft PDM process is in need of similar scrutiny. The often over used
slogan “just in time repair” has as much relevance to aircraft PDM as it does to repairing
line replaceable units (LRUs). Inducting a C-130 aircraft into PDM typically costs close
to one million dollars and takes the aircraft away from the operator for 120 days.1 If an
aircraft PDM can be deferred one or more years, the cost savings in terms of both money
and aircraft downtime are significant, especially considering the size of the C-130 fleet.
2
Therefore, an analytical model which predicts when a C-130 aircraft requires PDM is a
worthy endeavor.
The purpose of this paper is to develop an analytical model to provide C-130
maintainers with a tool to predict the time between PDM activities. The time between
PDM is referred to as the PDM interval. A detailed discussion of the composition of the
C-130 fleet and the current method of determining PDM intervals will provide the
background necessary to develop the proposed C-130 PDM interval model.
Notes
1C-130 System Program Office, 16 October 1996 Interview. Aircraft StructuralIntegrity Manager, WR-ALC/LBR.
3
Chapter 2
The C-130 Fleet
The [C-130] Hercules genealogist soon learns that some of the boughs ofthe C-130 tree are about to break with the weight of the number ofvariants that have proliferated since the birth of mama and papa back inBurbank [California].
—C-130 The Hercules
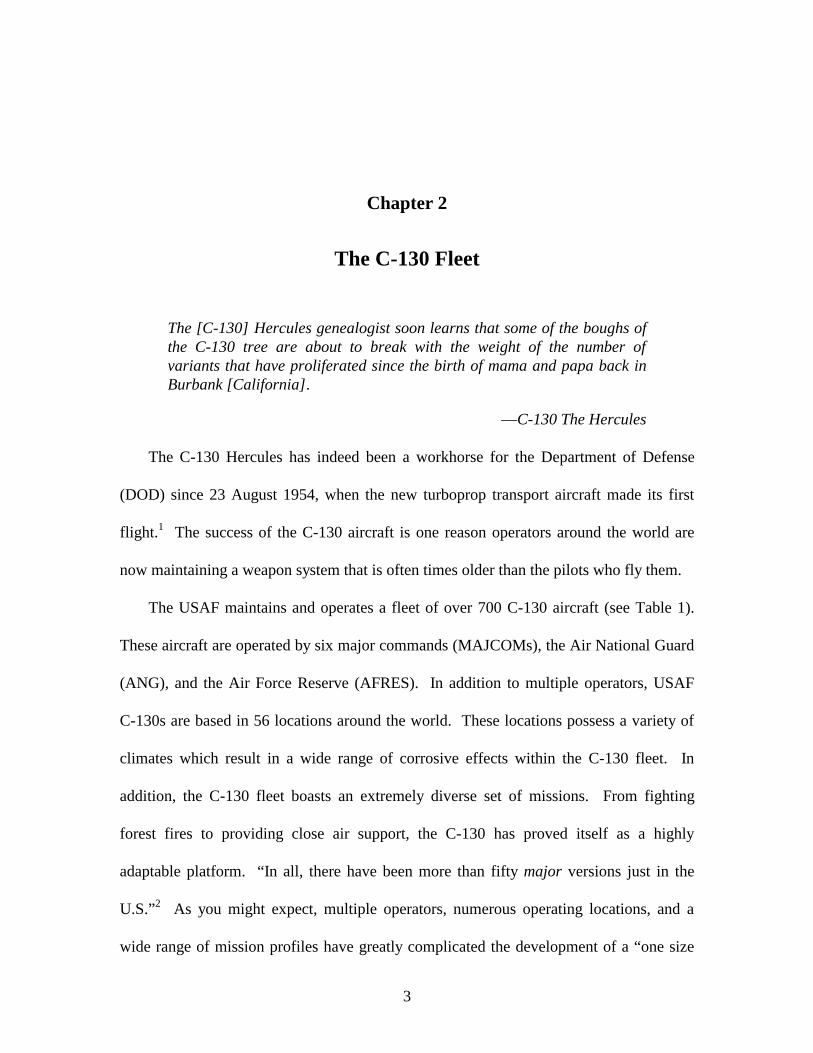
The C-130 Hercules has indeed been a workhorse for the Department of Defense
(DOD) since 23 August 1954, when the new turboprop transport aircraft made its first
flight.1 The success of the C-130 aircraft is one reason operators around the world are
now maintaining a weapon system that is often times older than the pilots who fly them.
The USAF maintains and operates a fleet of over 700 C-130 aircraft (see Table 1).
These aircraft are operated by six major commands (MAJCOMs), the Air National Guard
(ANG), and the Air Force Reserve (AFRES). In addition to multiple operators, USAF
C-130s are based in 56 locations around the world. These locations possess a variety of
climates which result in a wide range of corrosive effects within the C-130 fleet. In
addition, the C-130 fleet boasts an extremely diverse set of missions. From fighting
forest fires to providing close air support, the C-130 has proved itself as a highly
adaptable platform. “In all, there have been more than fifty major versions just in the
U.S.”2 As you might expect, multiple operators, numerous operating locations, and a
wide range of mission profiles have greatly complicated the development of a “one size
4
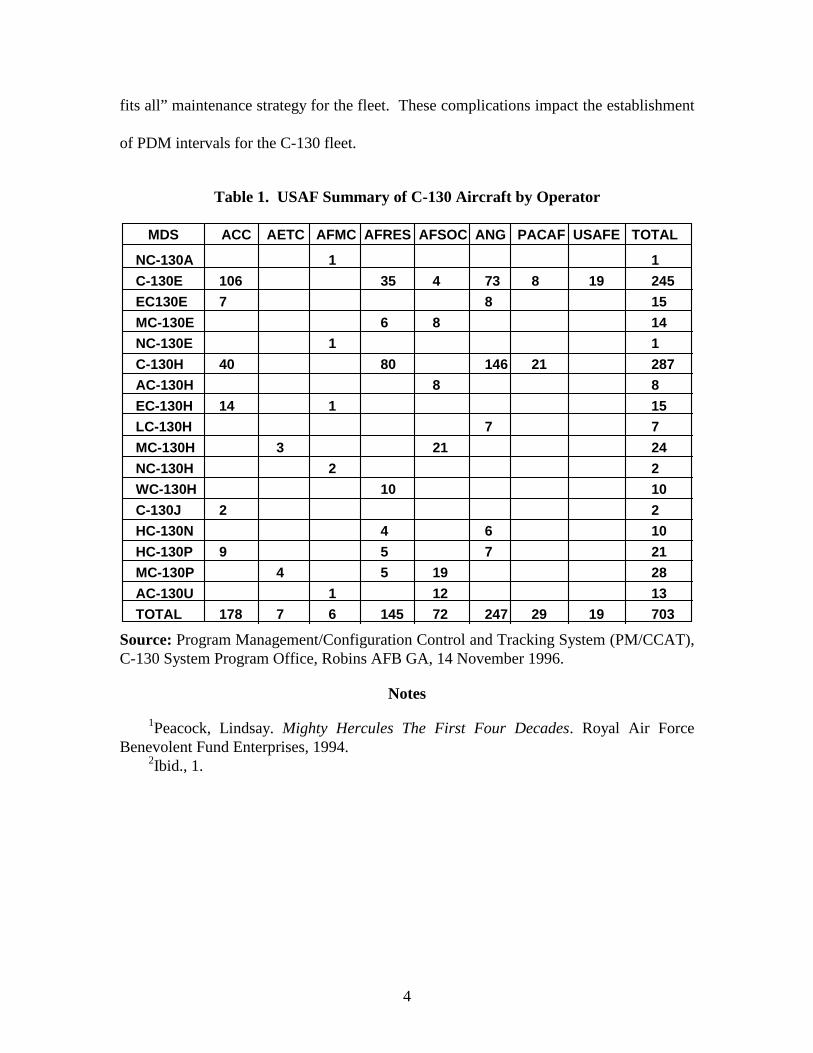
fits all” maintenance strategy for the fleet. These complications impact the establishment
of PDM intervals for the C-130 fleet.
Table 1. USAF Summary of C-130 Aircraft by Operator
MDS ACC AETC AFMC AFRES AFSOC ANG PACAF USAFE TOTAL
NC-130A 1 1
C-130E 106 35 4 73 8 19 245
EC130E 7 8 15
MC-130E 6 8 14
NC-130E 1 1
C-130H 40 80 146 21 287
AC-130H 8 8
EC-130H 14 1 15
LC-130H 7 7
MC-130H 3 21 24
NC-130H 2 2
WC-130H 10 10
C-130J 2 2
HC-130N 4 6 10
HC-130P 9 5 7 21
MC-130P 4 5 19 28
AC-130U 1 12 13
TOTAL 178 7 6 145 72 247 29 19 703
Source: Program Management/Configuration Control and Tracking System (PM/CCAT),C-130 System Program Office, Robins AFB GA, 14 November 1996.
Notes
1Peacock, Lindsay. Mighty Hercules The First Four Decades. Royal Air ForceBenevolent Fund Enterprises, 1994.
2Ibid., 1.
5
Chapter 3
Current Method for Determining PDM Intervals
The maintenance engineering objective is to assure that the best, most timely, andmost economical means, consistent with mission requirements, are used to satisfyall approved requirements.
—Depot Maintenance of Aerospace Vehicles and Training Equipment
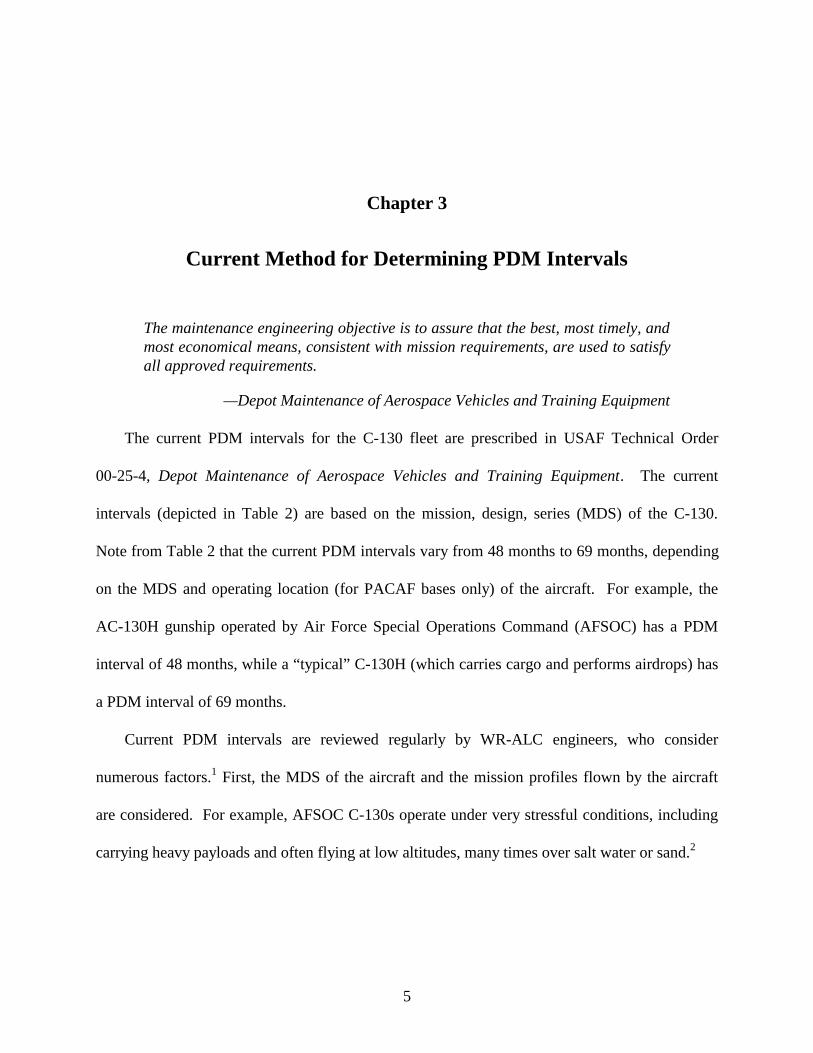
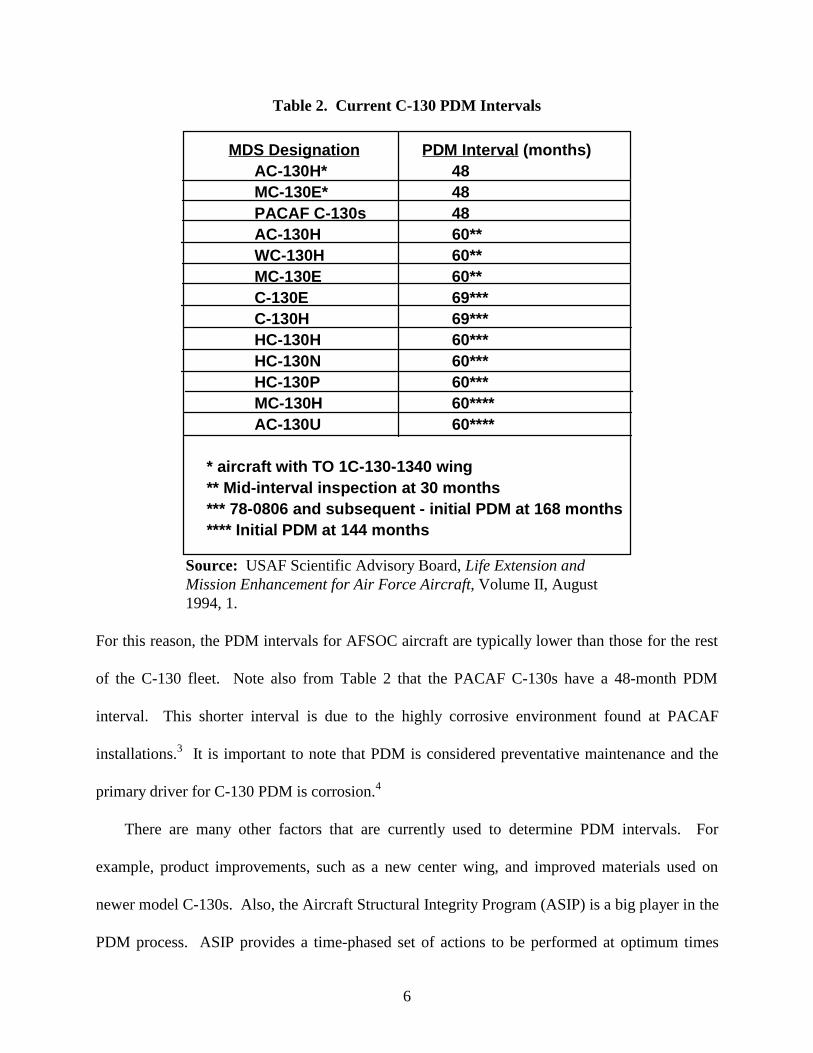
The current PDM intervals for the C-130 fleet are prescribed in USAF Technical Order
00-25-4, Depot Maintenance of Aerospace Vehicles and Training Equipment. The current
intervals (depicted in Table 2) are based on the mission, design, series (MDS) of the C-130.
Note from Table 2 that the current PDM intervals vary from 48 months to 69 months, depending
on the MDS and operating location (for PACAF bases only) of the aircraft. For example, the
AC-130H gunship operated by Air Force Special Operations Command (AFSOC) has a PDM
interval of 48 months, while a “typical” C-130H (which carries cargo and performs airdrops) has
a PDM interval of 69 months.
Current PDM intervals are reviewed regularly by WR-ALC engineers, who consider
numerous factors.1 First, the MDS of the aircraft and the mission profiles flown by the aircraft
are considered. For example, AFSOC C-130s operate under very stressful conditions, including
carrying heavy payloads and often flying at low altitudes, many times over salt water or sand.2
6
Table 2. Current C-130 PDM Intervals
MDS Designation PDM Interval (months)AC-130H* 48MC-130E* 48PACAF C-130s 48AC-130H 60**WC-130H 60**MC-130E 60**C-130E 69***C-130H 69***HC-130H 60***HC-130N 60***HC-130P 60***MC-130H 60****AC-130U 60****
* aircraft with TO 1C-130-1340 wing** Mid-interval inspection at 30 months *** 78-0806 and subsequent - initial PDM at 168 months**** Initial PDM at 144 months
Source: USAF Scientific Advisory Board, Life Extension andMission Enhancement for Air Force Aircraft, Volume II, August1994, 1.
For this reason, the PDM intervals for AFSOC aircraft are typically lower than those for the rest
of the C-130 fleet. Note also from Table 2 that the PACAF C-130s have a 48-month PDM
interval. This shorter interval is due to the highly corrosive environment found at PACAF
installations.3 It is important to note that PDM is considered preventative maintenance and the
primary driver for C-130 PDM is corrosion.4
There are many other factors that are currently used to determine PDM intervals. For
example, product improvements, such as a new center wing, and improved materials used on
newer model C-130s. Also, the Aircraft Structural Integrity Program (ASIP) is a big player in the
PDM process. ASIP provides a time-phased set of actions to be performed at optimum times

7
during the life cycle of the weapon system to ensure the structural integrity and service life of the
aircraft.5 ASIP is primarily concerned with fatigue cracking of the aircraft structure, not
corrosion. Another factor in determining PDM intervals is the analytical condition inspection
(ACI). ACIs are used to systematically disassemble and inspect a representative sample of
aircraft to find deficiencies in the aircraft structure. An additional factor used to adjust PDM
intervals is the controlled interval inspection (CIE). CIEs look at a representative number of
aircraft to decide if the PDM interval can be extended.
In conjunction with the aircraft manufacturer (Lockheed-Martin), the C-130 SPO is also
developing the aircraft corrosion tracking system (ACTS). The ultimate goal of ACTS is to be
able to predict where on the aircraft corrosion will occur.6 In addition, the corrosion and repair
recording (CARR) program is used to feed data into ACTS. Dobbins AFB is now using ACTS,
as is the Baltimore ANG. Other units are currently sending their corrosion-related data to the
C-130 SPO, pending worldwide implementation of ACTS and CARR. Finally, discrepancies
found during PDM are evaluated for their effect on PDM intervals.
As you can see, the C-130 SPO currently generates a great deal of PDM-related data that
affects PDM intervals. However, integrating this data into a cohesive, understandable PDM
interval predictor is very difficult.
Notes
1Jackson, Capt Dee J. and Kramer, Capt Edward R. Letter Report Review of Air Force DepotInduction Frequencies, Air Force Logistics Management Agency, June 1994.
2USAF Scientific Advisory Board, Life Extension and Mission Enhancement for Air ForceAircraft, Volume II, August 1994.
3Ibid., 3.4Ibid.5Ibid., 1.6Ibid., 3.
8
Chapter 4
Alternative Approach to Determining PDM Intervals
The real challenge is not to put a new idea into the military mind but to put theold one out.
—Sir Basil Liddell Hart
As discussed in some detail in the preceding chapter, a lot of effort has gone into
determining the current C-130 PDM intervals. But is the current method of establishing PDM
intervals, based on the MDS of the aircraft, the optimum criterion? Is there a viable alternative
approach to establishing PDM intervals based on the “uniqueness” of each C-130 aircraft (even
among those with the same MDS). The purpose of this chapter is to determine if an analytical
model can be developed to facilitate “just in time PDM” for the C-130 fleet. If one considers the
analogy of maintaining an automobile, is it reasonable to assume that all Pontiac Firebird owners
should overhaul their engines and paint their cars after a specified time interval? Perhaps not, so
let us develop a systematic process to determine PDM intervals.
In order to develop a C-130 PDM interval model, we need to consider the primary factors
that affect PDM intervals. For simplicity, let us assume the primary variables which affect the
PDM interval for a specific aircraft are: aircraft age, flying hour total, average yearly flying
hours, mission profile, and operating location of the aircraft. Bear in mind the variables selected
here are not as important as the methodology used to develop the PDM interval model. One
advantage of developing a model is that C-130 maintainers and operators can tailor the model
9
based on the factors they believe are most important. They may decide other factors may be
equally important (e.g. maintenance practices, number of landings, etc.). To further simplify this
analysis, I will consider the 291 C-130H model aircraft only. Recall from Chapter 3, TO 00-25-4
specifies the PDM interval for C-130H aircraft to be 69 months (with the exception of PACAF
C-130H aircraft, which have a PDM interval of 48 months).
Primary Factors That Affect PDM Intervals
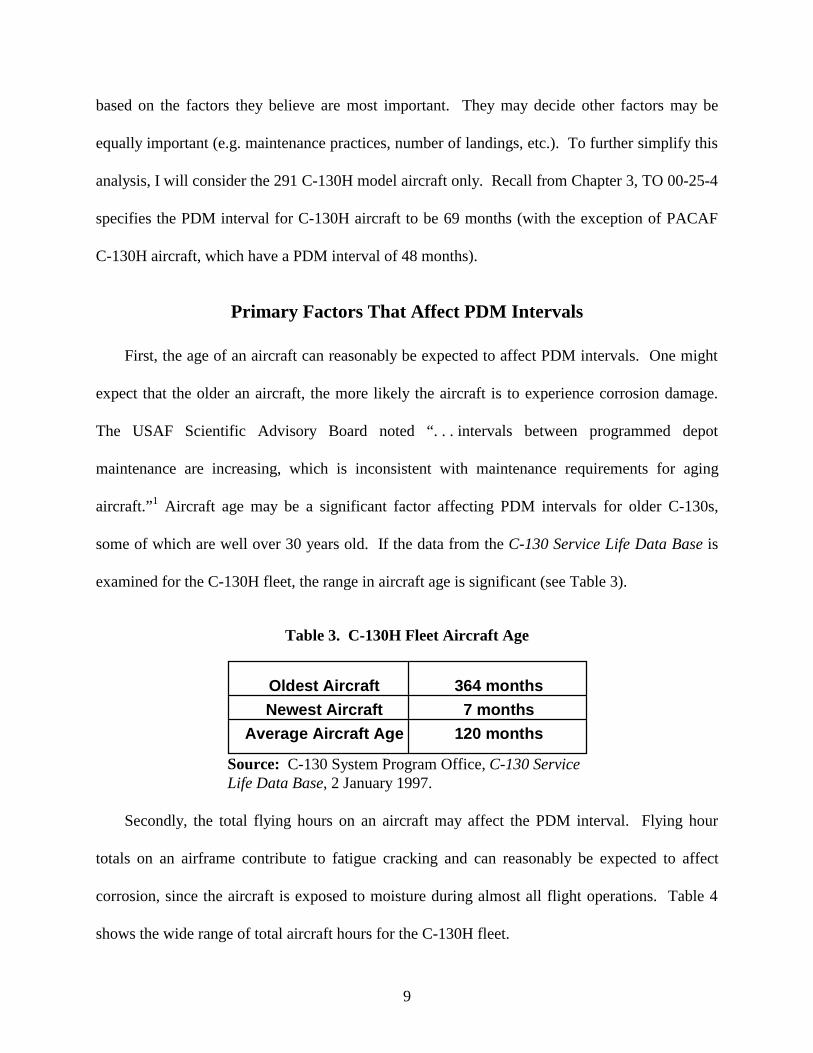
First, the age of an aircraft can reasonably be expected to affect PDM intervals. One might
expect that the older an aircraft, the more likely the aircraft is to experience corrosion damage.
The USAF Scientific Advisory Board noted “. . . intervals between programmed depot
maintenance are increasing, which is inconsistent with maintenance requirements for aging
aircraft.”1 Aircraft age may be a significant factor affecting PDM intervals for older C-130s,
some of which are well over 30 years old. If the data from the C-130 Service Life Data Base is
examined for the C-130H fleet, the range in aircraft age is significant (see Table 3).
Table 3. C-130H Fleet Aircraft Age
Oldest Aircraft
Newest Aircraft
Average Aircraft Age
364 months
7 months
120 months
Source: C-130 System Program Office, C-130 ServiceLife Data Base, 2 January 1997.
Secondly, the total flying hours on an aircraft may affect the PDM interval. Flying hour
totals on an airframe contribute to fatigue cracking and can reasonably be expected to affect
corrosion, since the aircraft is exposed to moisture during almost all flight operations. Table 4
shows the wide range of total aircraft hours for the C-130H fleet.

10
Table 4. C-130H Fleet Aircraft Total Flying Hours
High Time Aircraft
Low Time Aircraft
Average Aircraft Time
15,600 hours
20 hours
5,200 hours
Source: C-130 System Program Office, C-130 ServiceLife Data Base, 2 January 1997.
Thirdly, the number of hours flown per year may affect the PDM interval for the same
reasons mentioned in the above paragraph. Aircraft which fly much more frequently than other
aircraft may require more frequent PDM intervals. Obviously, this factor impacts the total flying
hours. Table 5 depicts data for the C-130H fleet in terms of number of flying hours per year.
Table 5. C-130H Fleet Flying Hours per Year
High Yearly Hours
Low Yearly Hours
Average Yearly Hours
687 hours
268 hours
482 hours
Source: C-130 System Program Office, C-130 ServiceLife Data Base, 2 January 1997.
Fourthly, the mission profile flown by each aircraft will affect the PDM interval. For every
USAF C-130, the C-130 SPO has calculated the “severity factor.” This factor is used to quantify
the airframe stresses experienced by the aircraft. This data is critical to the USAF ASIP (see
Chapter 3 for ASIP description). “The severity factor is an indication of how the mission profile
has affected the crack growth rates in the center wing lower surface panels ... in general, the
higher the severity factor, the more severely the aircraft has been used (e.g. more high speed,
low level flight at higher gross weight).”2 Each C-130 aircraft is assigned a severity factor and
tracked in the C-130 Service Life Data Base maintained by the ASIP Manager in the C-130 SPO.
These severity factors are calculated from service life data (documented on AFTO Form 151A)

11
provided by the operating locations and are updated on a monthly basis. It is important to note
that an aircraft with a severity factor twice that of another aircraft “has a center wing lower
surface crack growth rate twice that of the aircraft with the lesser severity factor.”3
Table 6. C-130H Fleet Mission Lifetime Severity Factor
High Severity Factor
Low Severity Factor
Average Severity Factor
7.68
.09
1.94
Source: C-130 System Program Office, 2 January 1997Correspondence with Aircraft Structural IntegrityProgram (ASIP) Manager, WR-ALC/LBR, 2.
Finally, the operating location will affect the PDM interval. An aircraft based at Davis-
Monthan in Arizona would not be expected to experience the same rate of corrosion as an aircraft
based in Japan or Hawaii. According to the USAF Scientific Advisory Board, “corrosion is one
of the most expensive maintenance issues for the Air Force.”4 Corrosion severity factors have
been established for most USAF operating locations. The higher the corrosion severity factor,
the more likely corrosion will occur. As one would expect, these factors vary widely depending
upon the geographic location of the base (e.g. proximity to salt water), and other environmental
factors such as industrial “fallout” from factories. Table 7 depicts the corrosion factors for most
of the C-130H operating locations. Recall from Chapter 3, the PDM interval for PACAF C-130H
aircraft is 48 months (vs 69 months) due to corrosion. However, a close look at Table 7 indicates
several other C-130H operating locations have the same high corrosion factor of “25” found at
Elmendorf AFB (PACAF). When one examines the data from Tables 3 through 7, it is apparent
that there is a wide range in the variables affecting PDM intervals for the C-130H fleet. Given

12
this wide range of data, it may be beneficial to account for these variations and develop our
PDM interval model based on specific aircraft (“just in time PDM”), rather than MDS.

13
Table 7. Summary of C-130H Bases, Corrosion Factors, and MAJCOMs
Location Corrosion Factor MAJCOM
Baltimore 5 ANGChannel Islands 25 ANGCharleston 10 ANGCharlotte * ANGCheyenne 5 ANGDallas 10 ANGDavis Monthan 5 ACCDobbins 10 AFRESDuke Field 25 AFRESDyess 5 ACCEdwards 10 AFMCEglin 25 AFMCElmendorf 25 PACAFHarrisburg * ANGHickam 25 ANGHurlburt 25 AFSOCKadena 25 AFSOCKeesler 25 AFRESKirtland 10 AETCKulis 25 ANGLittle Rock 10 ACC/ANGLouisv ille 10 ANGMansfield 5 ANGMartinsburg 5 ANGMaxwell 10 AFRESMcEntire 10 ANGMildenhall * AFSOCMinneapolis 5 AFRESMitchell 5 AFRESMoffett 25 ANGMoody 10 ACCNashville 20 ANGNew Orleans 25 ANGNiagara 5 AFRESOntario 20 AFMCPatrick 25 ACC/AFRESPeoria * ANGPeterson 10 AFRESPittsburgh 10 AFRESPope 10 ACCPortland 10 AFRESQuonset 25 ANGRamstein * USAFEReno 10 ANGRockwell 10 AFMCSavannah 25 ANGSchenectady 10 ANGSelfridge 5 ANGSt Joseph 10 ANGSt Paul * ANGSuffolk 5 ANGWill Rogers 5 ANGWillow Grove 10 AFRESWilmington 10 ANGYokoto 10 PACAFYoungstown 10 AFRES
* indicates data was not available for these bases
Source: C-130 System Program Office, 15 January 1997Correspondence with Aircraft Structural Integrity Program(ASIP) Manager, WR-ALC/LBR.

14
PDM Interval Model Development
I propose a simple relationship exists between the PDM interval and the five factors
discussed above (aircraft age, flying hour total, average yearly flying hours, mission profile
(stated in terms of severity factor), and operating location of the aircraft). Therefore:
PDM Interval = [F1(wt1) + F2(wt2) + F3(wt3) + F4(wt4) + F5(wt5)] (Eq 1)
Where:
F1 is aircraft age factor; wt1 is importance of F1 to PDM intervalF2 is flying hour total; wt2 is importance of F2 to PDM intervalF3 is average yearly flying hours; wt3 is importance of F3 to PDM intervalF4 is aircraft lifetime severity factor; wt4 is importance of F4 to PDM intervalF5 is corrosion factor of operating location; wt5 is importance of F5 to PDM interval
A close look at Equation 1 and the data shown in Tables 3 through 7 indicates that the data for
the five factors (F1 through F5) must be normalized to make any sense. It would not make sense
to plug 15,600 flight hours (see Table 4) into Equation 1 when you might use a very small
number for severity factor. If we did not normalize the data, the large numbers (like total flight
hours) would dominate our calculations and smaller numbers (like severity factors and corrosion
factors which may be critical to the PDM interval) would not affect the calculated PDM interval.
Therefore, the data (for F1 through F5) in the C-130 Service Life Data Base must be normalized
for each aircraft in the C-130 inventory; this is a very simple task. For example (from Table 4),
for total aircraft flying hours the highest time aircraft has 15,600 flight hours. If we want to
assign a number between 1 and 5 to represent total aircraft flying hours (F2), we simply “band”
the data as follows:
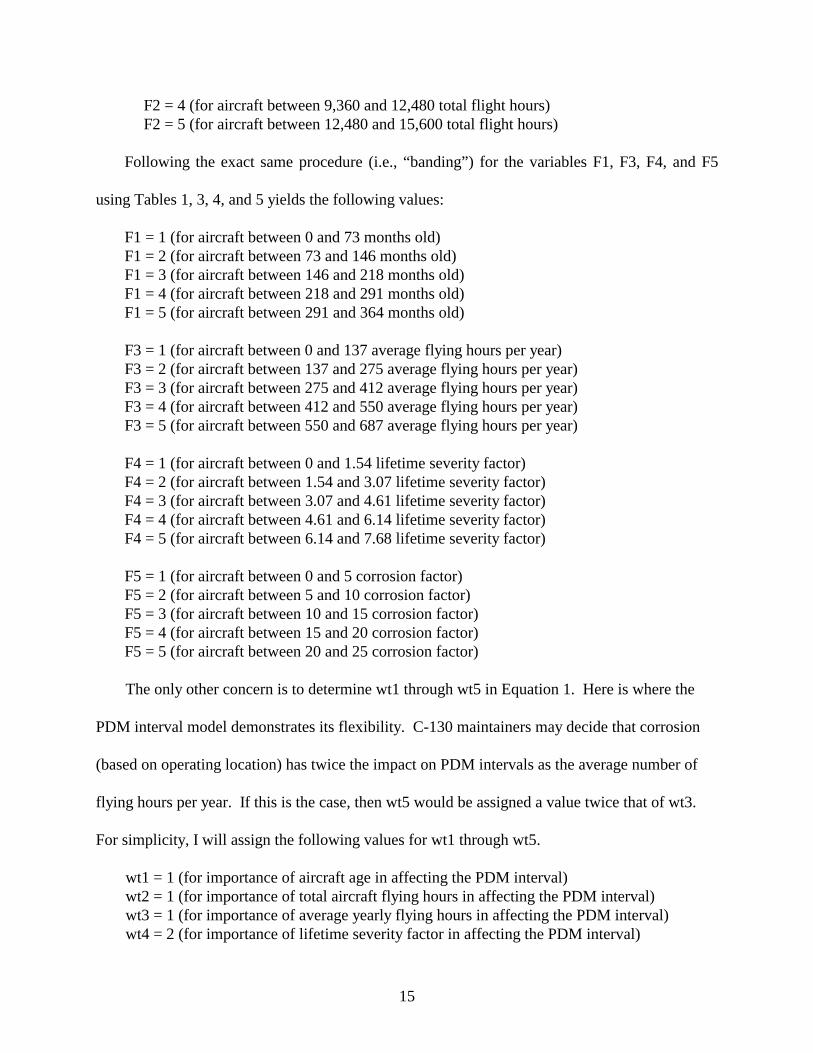
F2 = 1 (for aircraft between 0 and 3,120 total flight hours)F2 = 2 (for aircraft between 3,120 and 6,240 total flight hours)F2 = 3 (for aircraft between 6,240 and 9,360 total flight hours)
15
F2 = 4 (for aircraft between 9,360 and 12,480 total flight hours)F2 = 5 (for aircraft between 12,480 and 15,600 total flight hours)
Following the exact same procedure (i.e., “banding”) for the variables F1, F3, F4, and F5
using Tables 1, 3, 4, and 5 yields the following values:
F1 = 1 (for aircraft between 0 and 73 months old)F1 = 2 (for aircraft between 73 and 146 months old)F1 = 3 (for aircraft between 146 and 218 months old)F1 = 4 (for aircraft between 218 and 291 months old)F1 = 5 (for aircraft between 291 and 364 months old)
F3 = 1 (for aircraft between 0 and 137 average flying hours per year)F3 = 2 (for aircraft between 137 and 275 average flying hours per year)F3 = 3 (for aircraft between 275 and 412 average flying hours per year)F3 = 4 (for aircraft between 412 and 550 average flying hours per year)F3 = 5 (for aircraft between 550 and 687 average flying hours per year)
F4 = 1 (for aircraft between 0 and 1.54 lifetime severity factor)F4 = 2 (for aircraft between 1.54 and 3.07 lifetime severity factor)F4 = 3 (for aircraft between 3.07 and 4.61 lifetime severity factor)F4 = 4 (for aircraft between 4.61 and 6.14 lifetime severity factor)F4 = 5 (for aircraft between 6.14 and 7.68 lifetime severity factor)
F5 = 1 (for aircraft between 0 and 5 corrosion factor)F5 = 2 (for aircraft between 5 and 10 corrosion factor)F5 = 3 (for aircraft between 10 and 15 corrosion factor)F5 = 4 (for aircraft between 15 and 20 corrosion factor)F5 = 5 (for aircraft between 20 and 25 corrosion factor)
The only other concern is to determine wt1 through wt5 in Equation 1. Here is where the
PDM interval model demonstrates its flexibility. C-130 maintainers may decide that corrosion
(based on operating location) has twice the impact on PDM intervals as the average number of
flying hours per year. If this is the case, then wt5 would be assigned a value twice that of wt3.
For simplicity, I will assign the following values for wt1 through wt5.
wt1 = 1 (for importance of aircraft age in affecting the PDM interval)wt2 = 1 (for importance of total aircraft flying hours in affecting the PDM interval)wt3 = 1 (for importance of average yearly flying hours in affecting the PDM interval)wt4 = 2 (for importance of lifetime severity factor in affecting the PDM interval)
16
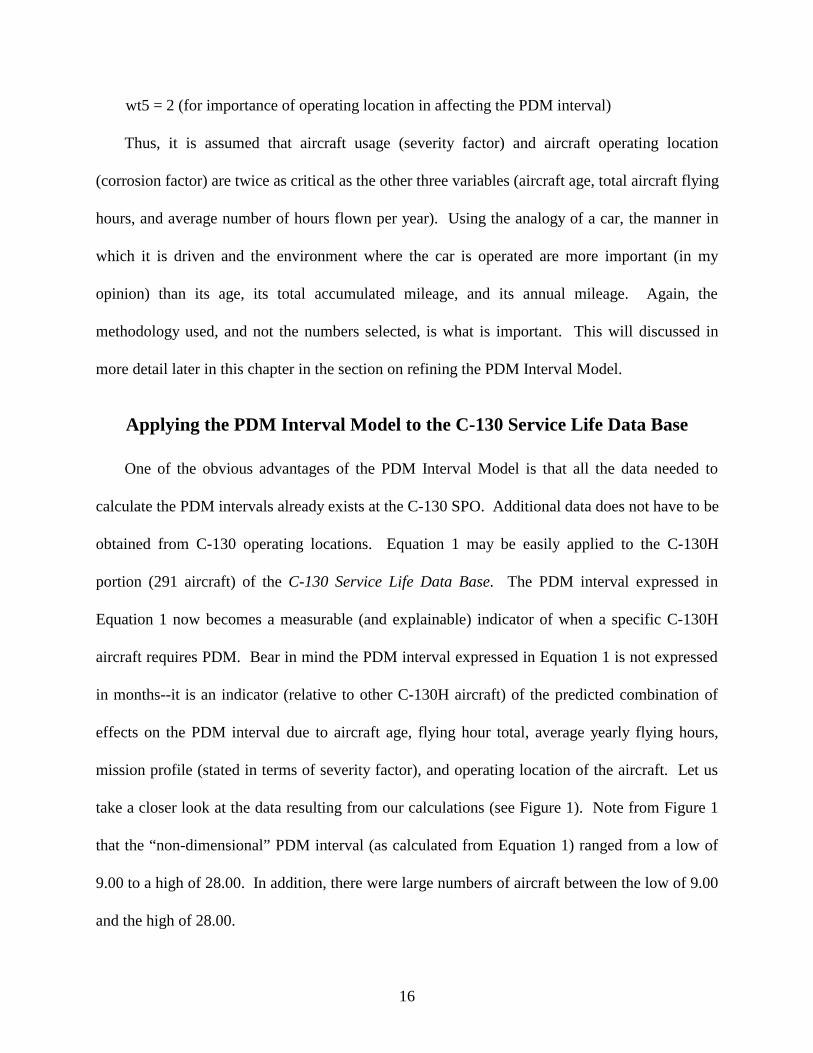
wt5 = 2 (for importance of operating location in affecting the PDM interval)
Thus, it is assumed that aircraft usage (severity factor) and aircraft operating location
(corrosion factor) are twice as critical as the other three variables (aircraft age, total aircraft flying
hours, and average number of hours flown per year). Using the analogy of a car, the manner in
which it is driven and the environment where the car is operated are more important (in my
opinion) than its age, its total accumulated mileage, and its annual mileage. Again, the
methodology used, and not the numbers selected, is what is important. This will discussed in
more detail later in this chapter in the section on refining the PDM Interval Model.
Applying the PDM Interval Model to the C-130 Service Life Data Base
One of the obvious advantages of the PDM Interval Model is that all the data needed to
calculate the PDM intervals already exists at the C-130 SPO. Additional data does not have to be
obtained from C-130 operating locations. Equation 1 may be easily applied to the C-130H
portion (291 aircraft) of the C-130 Service Life Data Base. The PDM interval expressed in
Equation 1 now becomes a measurable (and explainable) indicator of when a specific C-130H
aircraft requires PDM. Bear in mind the PDM interval expressed in Equation 1 is not expressed
in months--it is an indicator (relative to other C-130H aircraft) of the predicted combination of
effects on the PDM interval due to aircraft age, flying hour total, average yearly flying hours,
mission profile (stated in terms of severity factor), and operating location of the aircraft. Let us
take a closer look at the data resulting from our calculations (see Figure 1). Note from Figure 1
that the “non-dimensional” PDM interval (as calculated from Equation 1) ranged from a low of
9.00 to a high of 28.00. In addition, there were large numbers of aircraft between the low of 9.00
and the high of 28.00.

17
0
5
10
15
20
25
30
2 13 23 36 12 46 46 24 15 10 26 4 13 6 5 1 2 4 3
1112
1314
1516
1718
1920
2122
2324
2526
2728
9
Number of C-130H Aircraft
PDM Interval (non-dimensional)
High = 28Low = 9Avg = 16.44
Figure 1. Number of C-130H Aircraft vs. “Non-Dimensional” PDM Interval
Keep in mind that the higher the “non-dimensional” PDM interval the more likely the aircraft is
to require a shorter PDM interval (in terms of time in months). At first glance, this would
indicate (based on our assumptions so far) that for the entire C-130H fleet, a fixed PDM interval
may not be the best practice. Also, of considerable interest is that the four highest “non-
dimensional” PDM intervals (25, 26, 27, and 28) depicted in Figure 1 were calculated for
PACAF aircraft at Elmendorf AFB. This lends some support to the lower PDM interval (of 48
months) specified by TO 00-25-4 for PACAF C-130H aircraft. What needs to be done now to
complete the analysis is to correlate the “non-dimensional” PDM interval depicted in Figure 1
with time (specifically in months).
18
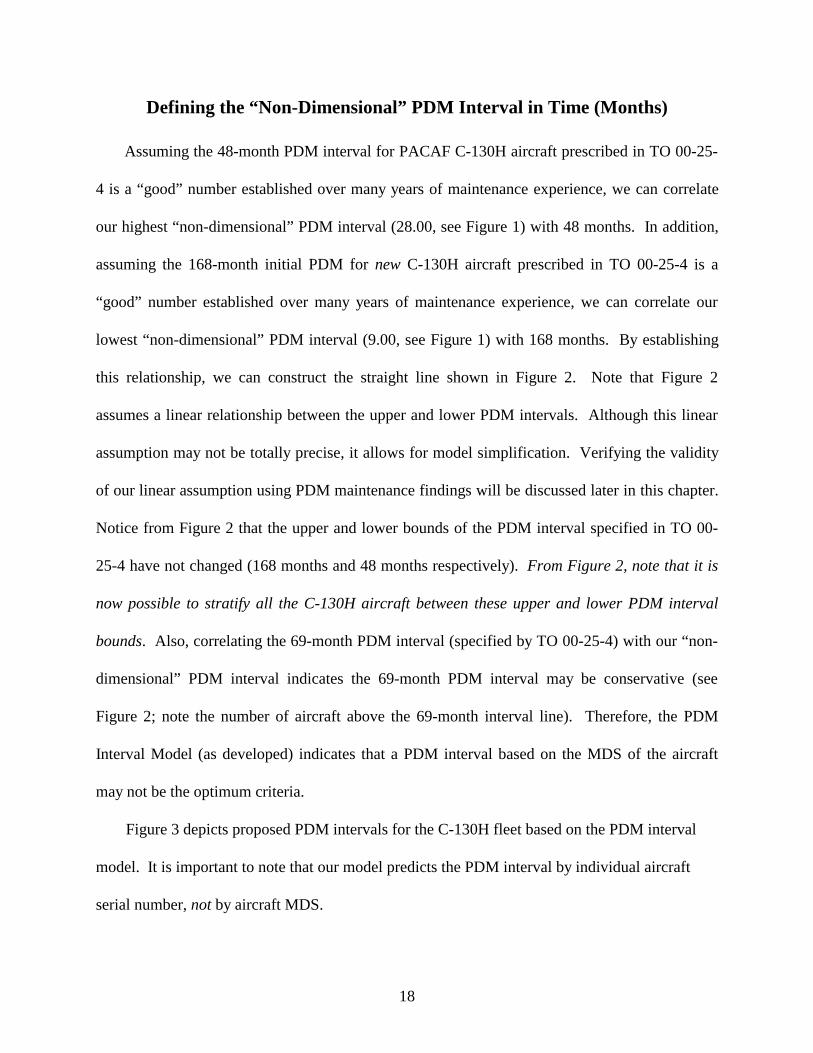
Defining the “Non-Dimensional” PDM Interval in Time (Months)
Assuming the 48-month PDM interval for PACAF C-130H aircraft prescribed in TO 00-25-
4 is a “good” number established over many years of maintenance experience, we can correlate
our highest “non-dimensional” PDM interval (28.00, see Figure 1) with 48 months. In addition,
assuming the 168-month initial PDM for new C-130H aircraft prescribed in TO 00-25-4 is a
“good” number established over many years of maintenance experience, we can correlate our
lowest “non-dimensional” PDM interval (9.00, see Figure 1) with 168 months. By establishing
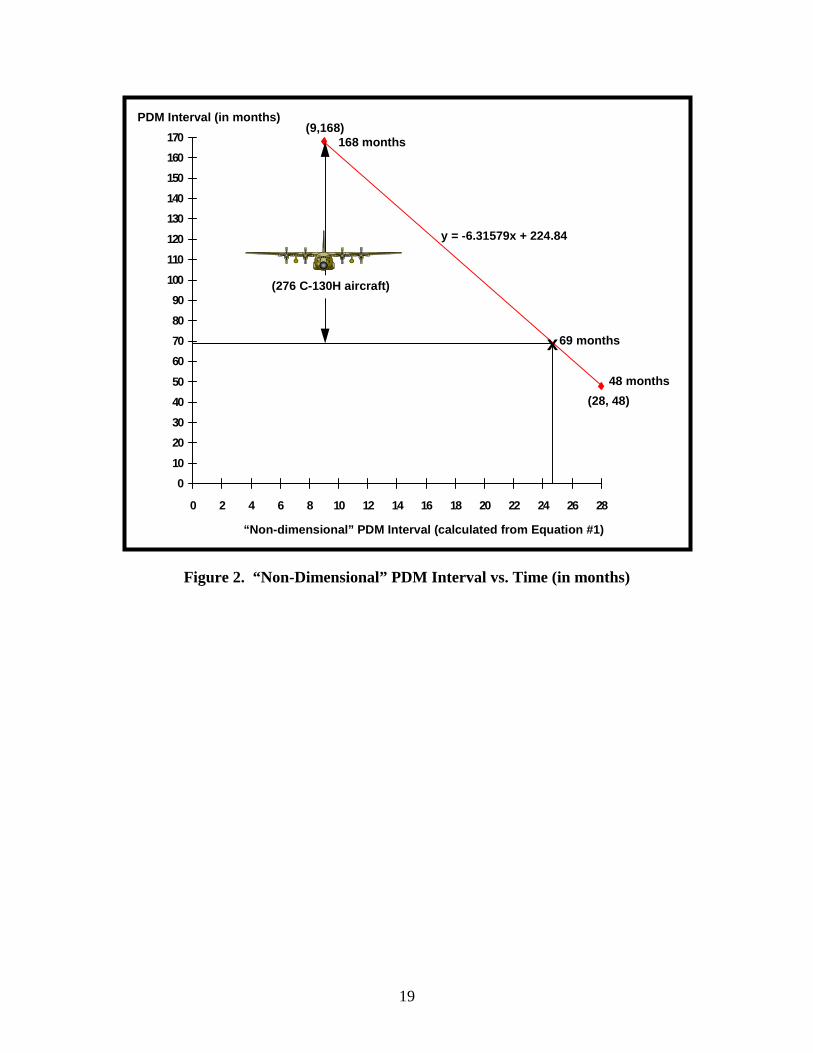
this relationship, we can construct the straight line shown in Figure 2. Note that Figure 2
assumes a linear relationship between the upper and lower PDM intervals. Although this linear
assumption may not be totally precise, it allows for model simplification. Verifying the validity
of our linear assumption using PDM maintenance findings will be discussed later in this chapter.
Notice from Figure 2 that the upper and lower bounds of the PDM interval specified in TO 00-
25-4 have not changed (168 months and 48 months respectively). From Figure 2, note that it is
now possible to stratify all the C-130H aircraft between these upper and lower PDM interval
bounds. Also, correlating the 69-month PDM interval (specified by TO 00-25-4) with our “non-
dimensional” PDM interval indicates the 69-month PDM interval may be conservative (see
Figure 2; note the number of aircraft above the 69-month interval line). Therefore, the PDM
Interval Model (as developed) indicates that a PDM interval based on the MDS of the aircraft
may not be the optimum criteria.
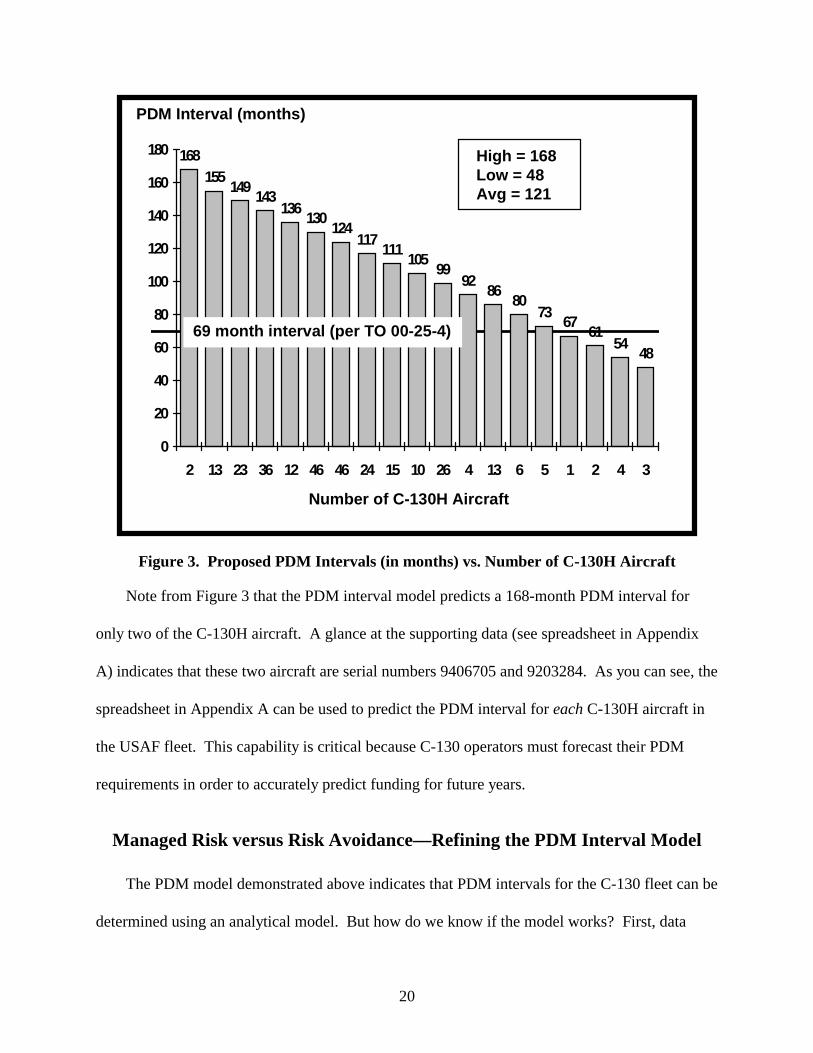
Figure 3 depicts proposed PDM intervals for the C-130H fleet based on the PDM interval
model. It is important to note that our model predicts the PDM interval by individual aircraft
serial number, not by aircraft MDS.
19
0
10
20
30
40
50
60
70
80
90
100
110
120
130
140
150
160
170
0 2 4 6 8 10 12 14 16 18 20 22 24 26 28
(9,168)
(28, 48)
PDM Interval (in months)
“Non-dimensional” PDM Interval (calculated from Equation #1)
x 69 months
48 months
168 months
(276 C-130H aircraft)
y = -6.31579x + 224.84
Figure 2. “Non-Dimensional” PDM Interval vs. Time (in months)
20
0
20
40
60
80
100
120
140
160
180
2 13 23 36 12 46 46 24 15 10 26 4 13 6 5 1 2 4 3
168155
149143
136130
124117
111105
9992
8680
7367
6154
48
Number of C-130H Aircraft
PDM Interval (months)
High = 168Low = 48Avg = 121
69 month interval (per TO 00-25-4)
Figure 3. Proposed PDM Intervals (in months) vs. Number of C-130H Aircraft
Note from Figure 3 that the PDM interval model predicts a 168-month PDM interval for
only two of the C-130H aircraft. A glance at the supporting data (see spreadsheet in Appendix
A) indicates that these two aircraft are serial numbers 9406705 and 9203284. As you can see, the
spreadsheet in Appendix A can be used to predict the PDM interval for each C-130H aircraft in
the USAF fleet. This capability is critical because C-130 operators must forecast their PDM
requirements in order to accurately predict funding for future years.
Managed Risk versus Risk Avoidance—Refining the PDM Interval Model
The PDM model demonstrated above indicates that PDM intervals for the C-130 fleet can be
determined using an analytical model. But how do we know if the model works? First, data
21
must be analyzed for each aircraft undergoing PDM. This data should be analyzed by SPO
engineers to refine the PDM interval model. For example, PDM data may indicate that the
corrosion factor impacts the PDM interval even more that the weighted factor (see Chapter 4,
Equation 1) used in the PDM interval model. If this is the case, the value for “wt5” (see Chapter
4, Equation 1) should be increased and the numbers for PDM intervals should be recalculated. In
addition, data from operational units and ASIP data should also be used to refine the PDM
interval model by adjusting the other factors (as required) used in the PDM interval model.
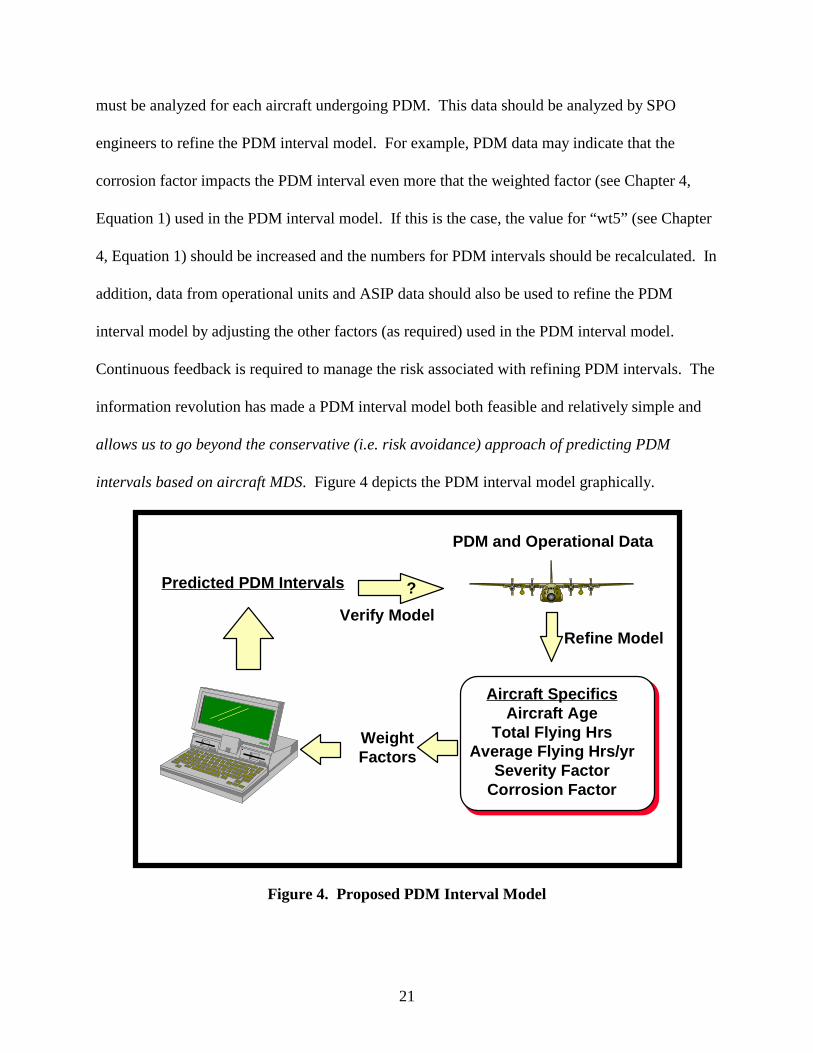
Continuous feedback is required to manage the risk associated with refining PDM intervals. The
information revolution has made a PDM interval model both feasible and relatively simple and
allows us to go beyond the conservative (i.e. risk avoidance) approach of predicting PDM
intervals based on aircraft MDS. Figure 4 depicts the PDM interval model graphically.
Predicted PDM Intervals
Aircraft SpecificsAircraft Age
Total Flying HrsAverage Flying Hrs/yr
Severity FactorCorrosion Factor
WeightFactors
PDM and Operational Data
Verify Model
?
Refine Model
Figure 4. Proposed PDM Interval Model

22
The PDM and operational data depicted in Figure 4 also make it possible to consider expanding
the upper limit of the current PDM interval (168 months). Again, this should only be done if the
data from PDM and ACTS indicate this interval can safely be extended.
Advantages of the PDM Interval Model
There are many advantages in adopting the PDM interval model. The model is flexible and
allows tailoring based on maintenance findings. The model is applicable to the entire C-130 fleet
and may have application to other USAF (and DOD) aircraft currently using MDS as the PDM
interval determinant. The model also has the potential for huge cost savings by deferring PDM
activities. In addition, data required for the PDM interval model is already being collected. The
model also has the potential to improve C-130 fleet management by providing advanced
indications of aircraft with increasing maintenance requirements; these aircraft may be retired or
transferred to less severe operating locations. In addition, ANG and AFRES bases that operate
C-130s purchased in the same year now have a model that allows them to predict which of their
aircraft will require PDM first and to see exactly how PDM intervals are determined (and
adjusted) for their aircraft. Finally, PDM intervals are still predicted in advance to allow
operators time to schedule aircraft downtime and project budgets to cover PDM costs.
Notes
1USAF Scientific Advisory Board, Life Extension and Mission Enhancement for Air ForceAircraft, Volume I, Executive Summary, August 1994.
2C-130 System Program Office, 2 January 1997 Correspondence with Aircraft StructuralIntegrity Program (ASIP) Manager, WR-ALC/LBR.
3Ibid.4Ibid., 1.
23
Chapter 5
Summary
. . . the DOD must recognize the critical importance of widely applyingadvanced information technology . . . this is the direction in which world-class commercial firms are moving, and the DOD must be part of thattransformation.
—Defense Conversion
As discussed in Chapter 3, over the past four decades the C-130 community has done
a superb job maintaining an invaluable asset for the USAF. However, with the advent of
the information revolution, the maintenance community is overdue in taking the next
logical step of implementing “just in time PDM” for the entire C-130 fleet. Predicting the
PDM intervals for specific aircraft is the logical alternative to predicting PDM intervals
based on aircraft MDS. As was shown in Chapter 4, there is a wide range in aircraft
variables within each MDS that should be taken into account--the PDM interval model
makes this possible.
Recommendations for Senior USAF Leaders
1. Consider implementation of the PDM interval model for the C-130 fleet. Inaddition, consider the applicability of the PDM interval model for other USAFaircraft which also base PDM intervals on aircraft MDS. Implementation couldbe done in steps; for example, the PDM interval model could be refined by SPOengineers and used for a portion of the fleet as a “pilot” program.
2. Charter a team to calculate the cost savings associated with implementing thePDM interval model. In my opinion, the deferred PDM costs will be substantial.

24
3. Charter a team to integrate the PDM interval model with other existing systems(e.g., ACTS, ASIP, PDM discrepancies). Supporting data systems should provide“linked” capabilities with common format. In this area, civilian companies with“linked” data systems expertise should be consulted for assistance.
4. Sponsor research on the ability of the PDM interval model to be used to predictfuture PDM maintenance actions (in addition to PDM intervals). The USAFshould not only implement “just in time PDM,” but we should also have “tailoredPDM” based on what predicted maintenance actions should be accomplishedduring PDM. This research could significantly benefit the Aircraft RepairEnhancement Program (AREP) which is attempting to reduce the number of daysan aircraft spends in PDM.
25
Appendix A
Modified C-130 Service Life Data Base
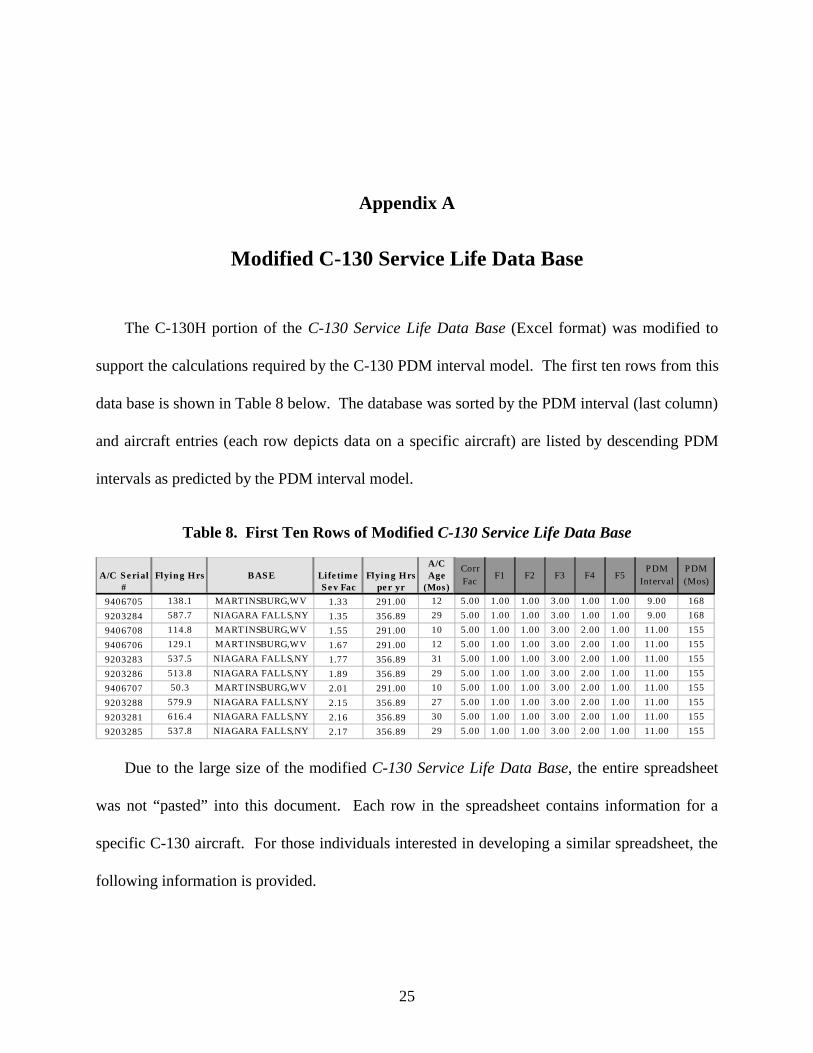
The C-130H portion of the C-130 Service Life Data Base (Excel format) was modified to
support the calculations required by the C-130 PDM interval model. The first ten rows from this
data base is shown in Table 8 below. The database was sorted by the PDM interval (last column)
and aircraft entries (each row depicts data on a specific aircraft) are listed by descending PDM
intervals as predicted by the PDM interval model.
Table 8. First Ten Rows of Modified C-130 Service Life Data Base
A/C Serial #
Flying Hrs BASE Li fe time Sev Fac
Flying Hrs pe r yr
A/C Age
(Mos)
Corr Fac
F1 F2 F3 F4 F5PDM
IntervalPDM (Mos)
9406705 138.1 MART INSBURG,WV 1.33 291.00 12 5.00 1.00 1.00 3.00 1.00 1.00 9.00 168
9203284 587.7 NIAGARA FALLS,NY 1.35 356.89 29 5.00 1.00 1.00 3.00 1.00 1.00 9.00 168
9406708 114.8 MART INSBURG,WV 1.55 291.00 10 5.00 1.00 1.00 3.00 2.00 1.00 11.00 155
9406706 129.1 MART INSBURG,WV 1.67 291.00 12 5.00 1.00 1.00 3.00 2.00 1.00 11.00 155
9203283 537.5 NIAGARA FALLS,NY 1.77 356.89 31 5.00 1.00 1.00 3.00 2.00 1.00 11.00 155
9203286 513.8 NIAGARA FALLS,NY 1.89 356.89 29 5.00 1.00 1.00 3.00 2.00 1.00 11.00 155
9406707 50.3 MART INSBURG,WV 2.01 291.00 10 5.00 1.00 1.00 3.00 2.00 1.00 11.00 155
9203288 579.9 NIAGARA FALLS,NY 2.15 356.89 27 5.00 1.00 1.00 3.00 2.00 1.00 11.00 155
9203281 616.4 NIAGARA FALLS,NY 2.16 356.89 30 5.00 1.00 1.00 3.00 2.00 1.00 11.00 155
9203285 537.8 NIAGARA FALLS,NY 2.17 356.89 29 5.00 1.00 1.00 3.00 2.00 1.00 11.00 155
Due to the large size of the modified C-130 Service Life Data Base, the entire spreadsheet
was not “pasted” into this document. Each row in the spreadsheet contains information for a
specific C-130 aircraft. For those individuals interested in developing a similar spreadsheet, the
following information is provided.
26
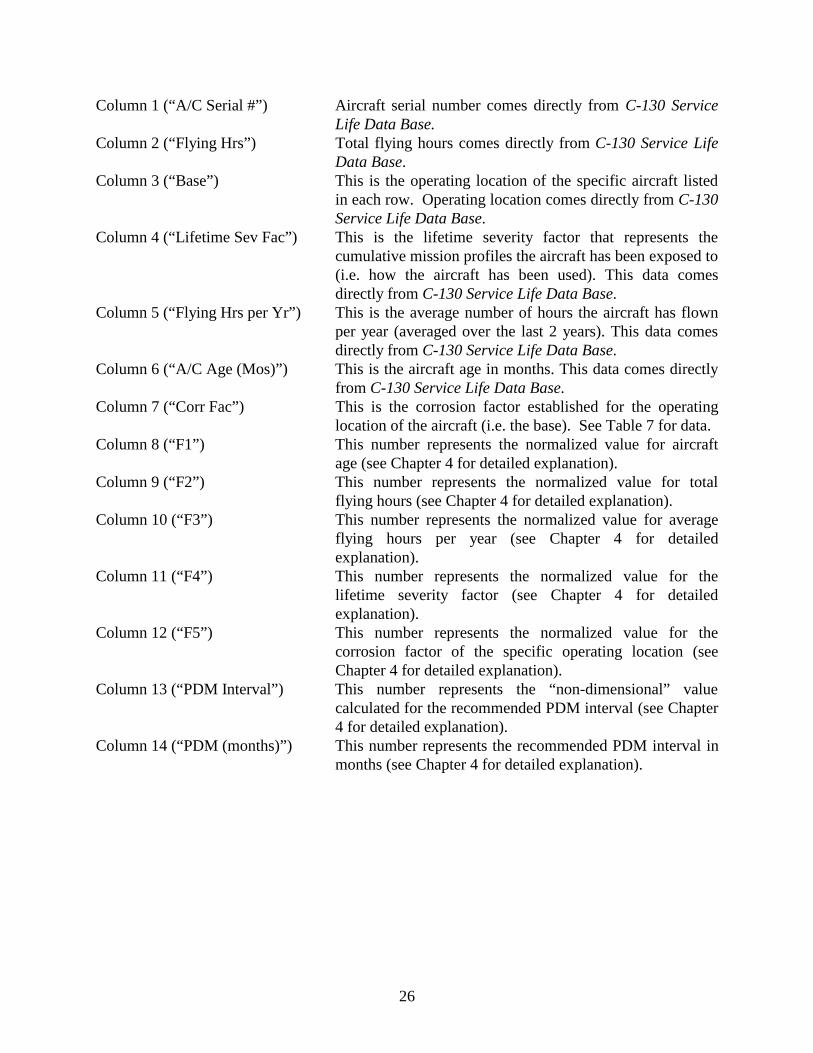
Column 1 (“A/C Serial #”) Aircraft serial number comes directly from C-130 ServiceLife Data Base.
Column 2 (“Flying Hrs”) Total flying hours comes directly from C-130 Service LifeData Base.
Column 3 (“Base”) This is the operating location of the specific aircraft listedin each row. Operating location comes directly from C-130Service Life Data Base.
Column 4 (“Lifetime Sev Fac”) This is the lifetime severity factor that represents thecumulative mission profiles the aircraft has been exposed to(i.e. how the aircraft has been used). This data comesdirectly from C-130 Service Life Data Base.
Column 5 (“Flying Hrs per Yr”) This is the average number of hours the aircraft has flownper year (averaged over the last 2 years). This data comesdirectly from C-130 Service Life Data Base.
Column 6 (“A/C Age (Mos)”) This is the aircraft age in months. This data comes directlyfrom C-130 Service Life Data Base.
Column 7 (“Corr Fac”) This is the corrosion factor established for the operatinglocation of the aircraft (i.e. the base). See Table 7 for data.
Column 8 (“F1”) This number represents the normalized value for aircraftage (see Chapter 4 for detailed explanation).
Column 9 (“F2”) This number represents the normalized value for totalflying hours (see Chapter 4 for detailed explanation).
Column 10 (“F3”) This number represents the normalized value for averageflying hours per year (see Chapter 4 for detailedexplanation).
Column 11 (“F4”) This number represents the normalized value for thelifetime severity factor (see Chapter 4 for detailedexplanation).
Column 12 (“F5”) This number represents the normalized value for thecorrosion factor of the specific operating location (seeChapter 4 for detailed explanation).
Column 13 (“PDM Interval”) This number represents the “non-dimensional” valuecalculated for the recommended PDM interval (see Chapter4 for detailed explanation).
Column 14 (“PDM (months)”) This number represents the recommended PDM interval inmonths (see Chapter 4 for detailed explanation).

27
Bibliography
C-130 System Program Office, 16 Oct 96 Interview. Aircraft Structural Integrity Program (ASIP)Manager, WR-ALC/LBR.
C-130 System Program Office, C-130 Service Life Data Base, 2 January 1997.C-130 System Program Office, 2 January 1997 Correspondence with Aircraft Structural Integrity
Program (ASIP) Manager, WR-ALC/LBR.C-130 System Program Office, 15 January 1997 Correspondence with Aircraft Structural
Integrity Program (ASIP) Manager, WR-ALC/LBR.Gansler, J. S. Defense Conversion, Cambridge, MA: The MIT Press, 1996.Jackson, Capt Dee J. and Kramer, Capt Edward R. Letter Report Review of Air Force Depot
Induction Frequencies, Air Force Logistics Management Agency, June 1994.Morris, M.E. C-130 The Hercules. Novato, CA: Presidio Press, 1989.Peacock, Lindsay. Mighty Hercules The First Four Decades. Royal Air Force Benevolent Fund
Enterprises, 1994.Program Management/Configuration Control and Tracking System (PM/CCAT), C-130 System
Program Office, Robins AFB GA, 14 November 1996.TO 00-25-4, Depot Maintenance of Aerospace Vehicles and Training Equipment, June 1995.USAF Scientific Advisory Board, Life Extension and Mission Enhancement for Air Force
Aircraft, Volume I, Executive Summary, August 1994.USAF Scientific Advisory Board, Life Extension and Mission Enhancement for Air Force
Aircraft, Volume II, Panel Reports, August 1994.
DISTRIBUTION A:
Approved for public release; distribution is unlimited.
Air Command and Staff CollegeMaxwell AFB, Al 36112