Criteria and Tentative Ranking of Ecosystem Services for ... · 0 Criteria and Tentative Ranking of...
32
0 Criteria and Tentative Ranking of Ecosystem Services for Inclusion in Ecosystem Accounting Issues Paper Prepared for the WAVES Project and the UNSD/World Bank/EEA Expert Meeting on Ecosystem Accounting of December 2011 26 January 2012 Lars Hein Wageningen University The Netherlands
Transcript of Criteria and Tentative Ranking of Ecosystem Services for ... · 0 Criteria and Tentative Ranking of...
0
Criteria and Tentative Ranking of
Ecosystem Services for Inclusion in
Ecosystem Accounting
Issues Paper
Prepared for the WAVES Project and the UNSD/World Bank/EEA Expert Meeting on Ecosystem Accounting of December 2011
26 January 2012
Lars Hein Wageningen University
The Netherlands

1

2
Contents
1. Introduction .......................................................................................................................... 4
2. Key considerations in assessing the suitability of ecosystem services for incorporation in SEEA. ......... 5
3. Criteria for assessing the suitability of ecosystem services for incorporation in SEEA ........................ 9
4. Tentative ranking of ecosystem services .................................................................................. 10
5. Conclusions and potential next steps ....................................................................................... 14
References .............................................................................................................................. 18
Annex 1. Survey. Prioritization of Ecosystem Services for Ecosystem Accounting ............................... 20
Annex 2. TEEB and CICES classifications of ecosystem services ...................................................... 27
Annex 3. Land cover units in the GlobCover map. ......................................................................... 29
Annex 4. Illustration of the relation between land cover and ecosystem services supply. .................... 30
Annex 5. Respondents to the Survey .......................................................................................... 31

3

4
1. Introduction
There is an emerging demand for integrating environmental information in economic accounting systems. Several international initiatives have been initiated to address this demand, including the on-going revision of the System of Environmental-Economic Accounts (SEEA) led by the UN Statistics Division, the World Bank-led WAVES Global Partnership and various regional projects like Europe’s “GDP and Beyond”.
One of the key challenges to integrating environmental information in economic accounting systems is accounting for ecosystem services, i.e. the benefits supplied by ecosystems to society. The potential to capitalize on the recent advances in the analysis, modeling and valuation of ecosystem services in support of environmental accounting systems has been widely recognized. For instance, Eurostat (2002) already provided a discussion regarding the incorporation of
environmental and recreational functions in the forest accounts framework (IEEAF), based on results of several pilot studies. Recent work on ecosystem accounts by the EEA (2007, 2010, 2011) describes potential ways to ground monetary accounting adjustments on a firm physical basis, and several recent studies published in the peer-reviewed literature further discuss the principles of ecosystem accounting (e.g. Boyd and Banzhaf, 2007). In spite of the recent advances, both with regards to the development of ecosystem accounting
frameworks and with regards to analyzing ecosystem services, a number of critical questions remain. The various methodological challenges, and the potential next steps towards ecosystem accounting have been the topic of a series of expert meetings with among others Bank staff, EEA, UNSD, and academia. Key issues have been described in UNSD (2011) and include for example (i) proper inclusion of ecosystem services in the overall structure of accounts; (ii) dealing with biodiversity in SEEA; (iii) aggregation and classification of ecosystem services; (iv) translating the surplus-based valuation approaches that have generally been applied in the environmental
economics literature to economic metrics consistent with SNA. A second expert meeting was held 5-7 December in London. In the context of the SEEA Revision Process and the WAVES Project, one of the issues identified to require further clarification is which ecosystem services can most readily be incorporated in accounting systems. The objective of this Issues Paper is therefore to: (i) identify criteria for
analyzing the potential suitability of ecosystem services with regards to incorporation in a system for environmental economic accounting (SEEA); and (ii) provide a general, tentative ranking of ecosystem services versus these criteria. The paper focusses on regulating and cultural services. This Issues Paper is based on a literature survey as well as a pilot survey sent out to a selected group of environmental economists, ecologists and geographers (see Annex 1). The survey served
two purposes: (i) to elicit information on ranking ecosystem services in the context of SEEA from
key experts; and (ii) to test the suitability of the survey to obtain information on ranking and data availability from a wider audience. The survey was sent to 20 experts, and 9 responses were received (see Annex 5). A draft of this Issues Paper was presented in the December Expert meeting in London, and comments and suggestions raised by the experts in this meeting were used to further develop the paper. Finally, the outcomes of the draft paper were discussed with two experts in ecosystem services modeling (Ferdinando Villa and Taylor Ricketts). The inputs received
from all experts is thankfully acknowledged. This Issues Paper first presents a brief review of the main relevant considerations in assessing the suitability of ecosystem services for inclusion in SEEA, followed by a presentation of potential criteria for ranking this suitability. Subsequently, a tentative ranking of ecosystem services is presented as an illustration of how these criteria can be applied.
Note that this document is produced as input into the discussion on SEEA, the paper does
explicitly not intend to provide a ‘definite’ ranking of ecosystem services for inclusion in accounting systems, as further elaborated in Section 5. Moreover, given the differences between countries in terms of ecology, policy priorities and data availability, it is well conceivable that different ecosystem services will be identified as potentially feasible for different countries piloting SEEA.
5
2. Key considerations in assessing the suitability of ecosystem
services for incorporation in SEEA. In order to define criteria for assessing the potential suitability of ecosystem services for inclusion in SEEA, a number of key characteristics of ecosystem services need to be considered. These
include: (i) which categories and types of ecosystem services have been distinguished in the various assessments to date; (ii) how do ecosystem services relate to land use; and (iii) which data are available in terms of the biophysical characteristics and/or values of specific ecosystem services ? These aspects are briefly reviewed below.
Definition of ecosystem service. Several definitions of the concept of ecosystem service have
been formulated. Costanza et al. (1997) referred to: ‘Ecosystem goods (e.g. food) and services (e.g. waste assimilation) represent the benefits human populations derive, directly or indirectly, from ecosystem functions’. MA (2003) defines ’Ecosystem services are the benefits people obtain from ecosystems’. TEEB (2010) states ‘ecosystem services are the direct and indirect contributions of ecosystems to human well-being’, hence replacing benefit by contribution, recognizing that ecosystem services are often provided by a combination of ecological processes and human interventions in the ecosystem. In CICES (Haines-Young and Potschin, 2010), this reasoning is
followed and ecosystem services are defined as ‘the contributions that ecosystems make to human well-being’. This Issue Paper will follow the CICES definition, given the specific purpose of CICES to support the SEEA revision process. Ecosystem services are further, in line with the above studies including CICES interpreted as comprising both ‘goods’ and ‘services’, and to result from the
interaction of ecosystems and human actions.
Classification of ecosystem services. The first classification of ecosystem services may well be published (in Dutch) in a report of the Dutch ministry for Housing and Spatial Planning (Van der Maarel and Dauvellier, 1978). This Report distinguished Production, Regulating, Carrier and Information Functions. The same categories were used in the subsequent, updated and more widely disseminated, publication of De Groot (1992). More recently, the Millennium Ecosystem Assessment (MA, 2003, 2005) distinguished Supporting, Provisioning, Regulating and Cultural
Services, and the TEEB study (2010) added the category of Habitat services while removing the Supporting Services. The CICES study (Haines-Young and Potschin, 2010) built on these preceding studies, and distinguished the three categories of Provisioning, Regulating and Cultural Services. Supporting services and Habitat Services were no longer included as specific classes in the CICES classification. Based on our current understanding of ecosystem services, the CICES classification
of ecosystem service categories is coherent and consistent, and was designed in support of the SEEA revision process, and will therefore be followed in this Issues Paper.
Types of ecosystem services. The CICES classification made a comprehensive analysis of themes, classes, groups and types of ecosystem services. A total of 59 different types of ecosystem services were distinguished in CICES, which compares to 22 ecosystem services in TEEB, 18 services in MA (2003) – excluding supporting services, and 17 in Costanza et al. (1997).
The substantially larger number in CICES is because some services have been split, e.g. commercial and subsistence cropping are now distinguished, and several new services have been added, such as seed dispersal and solar energy provision. Annex 2 presents the list of ecosystem services as distinguished by TEEB (2010) and in CICES (Haines-Young and Potschin, 2010). Note that the CICES paper is a draft, and may be subject to further modifications, also in the context of the SEEA revision process1.
1 For instance, points of discussion may include (i) if recreation and tourism should not feature more
prominently in the classification (as it does in other classifications); (ii) how commercial and subsistence service
provision can be distinguished (from an ecosystem perspective, it is often difficult to draw the boundary
between commercial and subsistence farming); and (iii) why abiotic services unrelated to ecosystems, such as
generating power from solar power plants, are included.

6
The ecosystem service ‘biodiversity / nature conservation’, sometimes also called the habitat service, is a difficult issue. One could argue that biodiversity is internal to ecosystems much akin to supporting services (as in MA, 2003). However, many people also value species diversity and/or the protection of rare species independent of the role of these species in supplying other ecosystem services (Hein, 2010). CICES recognizes the importance of biodiversity conservation through its contribution to the more tangible aspects of wilderness and naturalness. However, as witnessed by the very different way biodiversity is dealt with in recent assessments (MA, TEEB, CICES), this
service is both conceptually and in terms of measurement relatively complex, and it is not further considered in this Issues Paper. The relation between ecosystem services and economic production. Ecosystem services can support economic activity in two main ways, i.e. as final and as intermediate service. Final
ecosystem services directly provide a benefit to people. Part of these final services are already included in economic output such as the commercial supply of wood, crops etc. Another part is not yet reflected in products accounted for in the SNA and needs to be included as additional output. For instance, breakdown and dispersion of pollutants delivers a benefit in terms of reducing costs for waste treatment and in terms of improving air quality and reducing medical costs (Kunzli et al., 2000). Carbon sequestration is a benefit in terms of mitigating future costs related to climate change and may therefore be termed a final ecosystem service (but see e.g. Boyd and Banzhaf,
2007 for a different interpretation of this service). Intermediate ecosystem services are services that support other economic activities (as in the case of pollination supporting agriculture). They share many characteristics with ancillary activities (e.g. cleaning undertaken within a factory) as understood in the SNA. For instance, their output is not intended for use outside the establishment; the outputs are services and not goods; and their value is small compared to the principal or secondary activity of the enterprise. Ancillary activities
could possibly be separately identified to make their contribution to production visible. Note that accounting for final ecosystem services that are not currently included in standard output increases the total value of goods and services produced in an economy, while distinguishing intermediate services as ancillary production does not increase overall GDP (increase in output is offset by an increase in intermediate consumption) but rather leads to revealing the contribution of
these ecosystems to production. The relation between ecosystems, land use and ecosystem services. The UN Convention on Biological Diversity has provided the following definition of an ecosystem: ‘A dynamic complex of plant, animal and micro-organism communities and non-living environment interacting as a
functional unit’ (UN, 1992). Following this concept, ecosystems may lack clearly defined boundaries. However, analysis of ecosystem services, as well as ecosystem modeling requires that the object of the analysis is clearly defined. Therefore, this Issues Paper uses a slightly modified, spatially explicit definition of ecosystems: ‘the individuals, species and populations in a spatially defined area, the interactions among them, and those between the organisms and the abiotic environment’ (Likens, 1992). Often, in the identification of ecosystems, boundaries between ecosystems are drawn on the basis of relative homogeneousness, in terms of components,
processes and structure, and in terms of having strong internal versus external functional relations (Likens, 1992). However, in practice, boundaries between ecosystems may often be gradual and diffuse and the boundary may be difficult to draw based on ecological criteria. In order to spatially analyze ecosystem services, ecosystem services supply can be linked to land cover. Land cover relates to the observable biotic and abiotic configuration of the landscape. A
range of different land cover and biome classifications have been developed2. One of the most
detailed land cover classification systems is CORINE, developed by the European Environment Agency. CORINE covers 35 countries (the EU-27, Bosnia-Herzegovina, Croatia, Former Yugoslav Republic of Macedonia, Kosovo, Liechtenstein, Norway, Serbia, Turkey). It’s land cover product has a resolution of 100 by 100 m, and a minimum unit mapping size of 25 hectares. Three levels of
2 In this Issue Paper, only a brief summary of land cover aspects relevant for prioritization can be presented,
but see for a more detailed analysis of land cover aspects for example (FAO, 2011).

7
land cover classes are distinguished (the first two levels are presented in Table 1). CORINE has
been developed based on a range of different sources, including satellite imagery, thematic maps and aerial photographs. The land cover classification system in CORINE is focused on European land cover types, for instance deserts are classified as a subcategory under ‘Forests and semi-natural areas’ whereas outside of Europe many deserts are natural systems. The distinction of different forest types in CORINE is at Level 3 (not shown in Table 1). There are also a range of products that provide global coverage of land cover. Three examples of
global land cover maps are (i) the UMD (University of Maryland) global land cover map; (ii) GLC2000; and (iii) GlobCover. The UMD has a resolution of 1 km2 and is based on AVHRR satellite data acquired between 1981 and 1994. The JRC GLC2000 is based on images of 2000 and has a resolution of 1 km. The GlobCover project is a collaboration between ESA, FAO, UNEP, JRC, IGBP and GOFC-GOLD and resulted in a global land-cover map for the year 2005, using as main source of data the fine resolution (300 m) mode data from the ENVISAT satellite3. The GLC2000 and
GlobCover maps have been validated and their classification accuracy is known. Land cover maps allow spatial analysis of ecosystem services supply. There are, however, differences in the classes distinguished in land cover maps, and the classes distinguished in ecosystem service valuation studies, as categorized by for instance the TEEB project. In addition, there are several different land cover classification systems (GLC2000 and GLOBCOVER include the same land cover classes, see Annex 3). To illustrate these differences, Table 1 compares the
European CORINE land cover and global UMD land cover units with the TEEB biome classification. Table 1 illustrates that land cover and ecosystem classifications are based on different parameters, but that there is often an important overlap between them. Note that TEEB also has a 2nd classification level (ecosystem level), where for instance different types of forests are distinguished4.
Table 1. Examples of land cover and ecosystem classifications. Note that classes between different
classification systems do not entirely correspond. CORINE Level 1 CORINE Level 2 UMD TEEB Level 1.
1. Artificial surfaces Urban fabric Urban and Built Urban
Industrial, commercial and transport
units
Mine, dump and construction sites
Artificial non-agricultural vegetated areas
2. Agricultural areas Arable land Cropland Cultivated
Permanent crops
Pastures Grassland Grassland and rangeland
Heterogeneous agricultural areas Wooded Grassland
3. Forest and semi-natural
areas
Forests Evergreen Needleleaf Forest Forests
Evergreen Broadleaf Forest
Deciduous Needleleaf Forest
Deciduous Broadleaf Forest
Mixed Forest
Woodland Woodland and shrubland
Shrub and/or herbaceous vegetation
association Closed Shrubland
Open Shrubland Tundra
Open spaces with little or no vegetation Bare Ground Desert
Ice/Rock/Polar
4. Wetlands Inland wetlands Wetlands
Marine wetlands Rivers & Lakes
5. Water bodies Inland water Coastal Systems
Marine Marine/Open oceans
3 See for more information: http://www.gofc-gold.uni-jena.de/sites/globcover.php
4 For example, in the case of forests: (i) tropical rain forest; (ii) tropical dry forest; (iii) temperate rain/evergreen; (iv) temperate deciduous; and (v) boreal/coniferous forest.

8
Linking ecosystem services to land cover first requires identifying a potentially suitable land cover
classification system. In addition to the categories identified in land cover maps, there may be a need to add the categories of Ocean and Atmosphere. Ocean is required to account for fishing and fish harvests, ‘Atmosphere’ needs to be added, in line with other environmental accounting systems, since the atmosphere presents a place where emissions can be disposed of and broken down. Annex 4 presents an illustration of how land cover classes can potentially be linked to ecosystem services supply.
Published studies on ecosystem services supply. The TEEB (2010) study provides an overview of the state-of-the art in ecosystem services analysis and valuation. For the TEEB study, several hundred publications on ecosystem services were screened, and 160 of these were selected (on basis of a number of criteria including quality of the study) and inserted in a database. Many of these studies provided value estimates for more than one service, and a total of 527 value
estimates for specific services were found. Each value point was subsequently linked to a specific biome or ecosystem following the classification presented in Table 1, right hand column. Values were expressed in standardized per hectare values in 2007 International dollars. The value conversions were based on GDP deflators and PPP converters from the World Bank Development Indicators. Figure 1 presents an overview of the value estimates retrieved in the TEEB project in order to provide an idea of data availability on ecosystem services values.
Figure 1. Number of value estimates by biome and by continent (source: TEEB, 2010)
Figure 2. Number of value estimates by ecosystem service (source: TEEB, 2010). For Desert and Polar regions there were a low number of value data points and these were excluded from the TEEB analysis, as were cultivated land and urban areas in TEEB because they are human-dominated systems. In the development of ecosystem accounting methods, it may
need to be considered how these land cover categories can be included, in spite of the lack of data.
9
A recent initiative that is worth mentioning here is GEO BON. The Group on Earth Observations
(GEO) was launched in 2002 and is a voluntary partnership of 73 national governments and 46 participating organizations (Scholes et al., 2008). The GEO members are establishing a Global Earth Observation System of Systems that provides access to data, services, analytical tools, and modeling capabilities through a Web-based GEO Portal (www.geoportal.org). GEOSS has identified nine priority “societal benefit areas” in its first decade including biodiversity. In this context a platform called GEO BON (Group on Earth Observations-Biological Observation Network) was established through which existing information streams from monitoring and observation programs
can be supplemented and organized into a system that produces a more comprehensive view of the status of biological and social systems. GEO BON is structured around eight working groups and one of these working groups focuses on ecosystem services. The work of this ecosystem services working group is ongoing, addressing for instance potential metrics for analyzing ecosystem services.
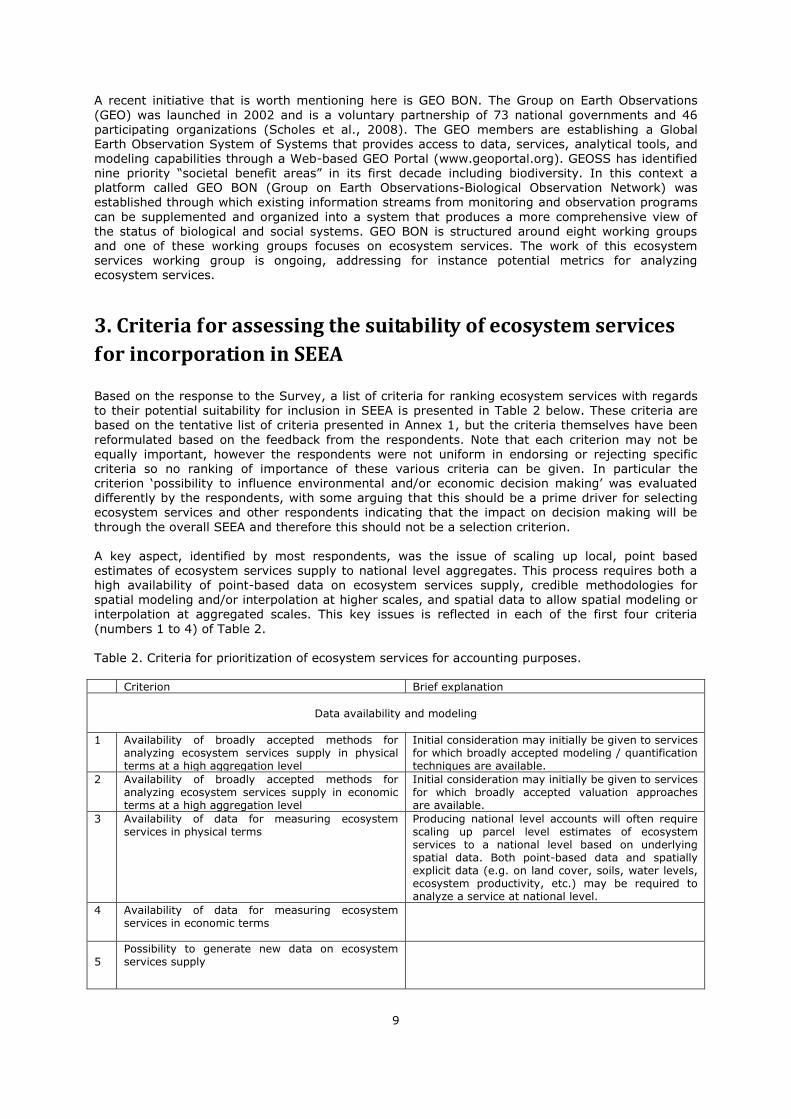
3. Criteria for assessing the suitability of ecosystem services
for incorporation in SEEA Based on the response to the Survey, a list of criteria for ranking ecosystem services with regards to their potential suitability for inclusion in SEEA is presented in Table 2 below. These criteria are based on the tentative list of criteria presented in Annex 1, but the criteria themselves have been
reformulated based on the feedback from the respondents. Note that each criterion may not be equally important, however the respondents were not uniform in endorsing or rejecting specific criteria so no ranking of importance of these various criteria can be given. In particular the criterion ‘possibility to influence environmental and/or economic decision making’ was evaluated
differently by the respondents, with some arguing that this should be a prime driver for selecting ecosystem services and other respondents indicating that the impact on decision making will be
through the overall SEEA and therefore this should not be a selection criterion. A key aspect, identified by most respondents, was the issue of scaling up local, point based estimates of ecosystem services supply to national level aggregates. This process requires both a high availability of point-based data on ecosystem services supply, credible methodologies for spatial modeling and/or interpolation at higher scales, and spatial data to allow spatial modeling or interpolation at aggregated scales. This key issues is reflected in each of the first four criteria
(numbers 1 to 4) of Table 2. Table 2. Criteria for prioritization of ecosystem services for accounting purposes. Criterion Brief explanation
Data availability and modeling
1 Availability of broadly accepted methods for analyzing ecosystem services supply in physical terms at a high aggregation level
Initial consideration may initially be given to services for which broadly accepted modeling / quantification techniques are available.
2 Availability of broadly accepted methods for analyzing ecosystem services supply in economic terms at a high aggregation level
Initial consideration may initially be given to services for which broadly accepted valuation approaches are available.
3 Availability of data for measuring ecosystem services in physical terms
Producing national level accounts will often require scaling up parcel level estimates of ecosystem services to a national level based on underlying spatial data. Both point-based data and spatially explicit data (e.g. on land cover, soils, water levels, ecosystem productivity, etc.) may be required to analyze a service at national level.
4 Availability of data for measuring ecosystem services in economic terms
5
Possibility to generate new data on ecosystem services supply

10
Other criteria
6 Economic importance of the ecosystem service. Initial consideration may be given to those services that generate substantial economic benefits.
7 Possibility to influence environmental and/or economic policy and decision making (decision making context)
Initial consideration may be given to services that can relatively easily be influenced by decision making in order to have maximum relevance for policy making.
8 Sensitivity of the service to changes in the environment, including from anthropogenic stressors.
Initial consideration may be given to services that are sensitive to environmental change / well reflect changes in natural capital stocks.
9 Whether the service is a final or intermediate ecosystem service
Final ecosystem services may be prioritized
4. Tentative ranking of ecosystem services Analysis of the responses to the Survey resulted in a first scoring of the feasibility (considering data availability and the availability of credible modeling approaches) of producing ecosystem accounts. Because data availability and methods for analyzing specific services may differ strongly between ecosystem types, the feasibility of analyzing ecosystem services was analyzed for specific ecosystem types. In line with the scope of the study, only regulating and cultural services were included.
Table 3 and Table 4 below provide an indication of the average response obtained for each service and ecosystem combination. Seven respondents filled in this part of the Survey. The scores given in Tables 3 and 4 represent the average response, with equal weighting to each of the responses. The scoring method of Tables 3 and 4 differs slightly from that of the Survey. The Survey (see Annex 1) asked respondents to score ecosystem services on a scale of ‘--’ (not suitable at all) to ‘++’ (very suitable). However, based on the feedback obtained, to facilitate interpretation of the
results, Tables 3 and 4 are ranked from ‘0’ (not suitable at all); ‘+’ (low suitability); ‘++’ (suitable) to ‘+++’ (very suitable). A value of 0 may also mean that the service is not applicable for a particular ecosystem type. Table 3 presents the perceived feasibility with regards to biophysical quantification of ecosystem services supply at national scales, and Table 4 presents the same with regards to quantification in
economic terms. In general, there is consistency between the two tables, which may partly stem from the notion that economic quantification is only possible if biophysical quantification is feasible
as well. Therefore, for a number of ecosystem services, the scores in Table 4 are lower than those in Table 3. For many services, there was consistency between the respondents on the feasibility of analyzing specific ecosystem services for accounting purposes in relative terms. For instance, carbon
sequestration was perceived to be more feasible than pollination by all respondents, even though the specific scores provided differed between the respondents. Services with less consistency between respondents were, in particular, ‘control of erosion and sedimentation’, and ‘inspiration, spiritual and cognitive benefits’. In addition, most respondents indicated to not be very familiar with data availability for Tundra ecosystems. Table 3. Perceived feasibility of quantifying ecosystem services in different biomes in biophysical
terms. Regulating Service Feasibility (from 0 to +++)
Coastal Wetlands Lakes and
rivers
Forests Woodland and shrubland
Grass and
rangeland
Tundra Cultivated areas
Regulation of air quality through
filtration of air pollutants including particulate matter
0 0 0 ++ + + 0 +
Carbon sequestration 0 + 0 +++ +++ ++ ++ ++
Regulation of hydrological flows
through buffer function of (forest)
0 + + ++ ++ + + +

11
ecosystems
Protection of coastal zones from
floods by coastal ecosystems, for
instance mangroves
+ + 0 ++ + 0 0 0
Control of erosion and sedimentation
+ + 0 ++ + + 0 ++
Maintenance of soil fertility 0 0 0 + + + 0 ++
Pollination 0 0 0 + + + 0 ++
Control of pests and diseases 0 0 0 + 0 0 0 +
Nursery service: regulation of species populations
+ + + + + + 0 0
Cultural services
Recreation and tourism +++ ++ +++ +++ ++ ++ + +
Inspiration, spiritual, cognitive + 0 + + 0 0 0 0
Amenity service (providing an
attractive living environment)
+ + ++ ++ + + 0 0
Table 4. Perceived feasibility of quantifying ecosystem services in different biomes in economic terms. Regulating Service Feasibility (from 0 to +++)
Coastal Wetlands Lakes and
rivers
Forests Woodland and shrubland
Grass and
rangeland
Tundra Cultivated areas
Regulation of air quality through filtration of air pollutants including
particulate matter
0 0 0 + + 0 0 0
Carbon sequestration 0 + 0 +++ +++ ++ + ++
Regulation of hydrological flows through buffer function of (forest)
ecosystems
0 0 + ++ ++ + + +
Protection of coastal zones from
floods by coastal ecosystems, for instance mangroves
+ + 0 ++ + 0 0 0
Control of erosion and
sedimentation
+ + + + ++ + 0 +
Maintenance of soil fertility 0 0 0 + + 0 0 ++
Pollination 0 0 0 + + 0 0 +
Control of pests and diseases 0 0 0 0 0 0 0 +
Nursery service: regulation of
species populations
+ + + + + + 0 0
Cultural services
Recreation and tourism ++ ++ ++ ++ ++ ++ + +
Inspiration, spiritual, cognitive 0 0 0 0 0 0 0 0
Amenity service (providing an
attractive living environment)
++ + ++ + + + + +
Based on the results of the literature review and the outcomes of the Survey among ecosystem
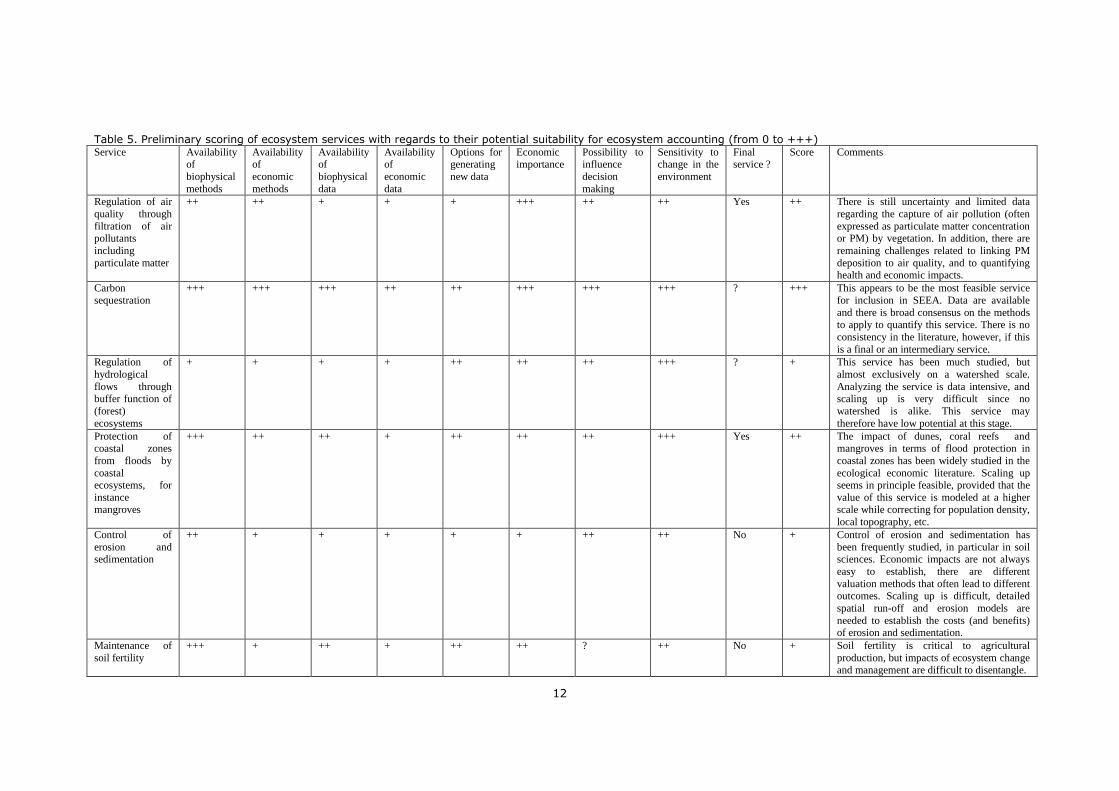
services experts, as expressed in Tables 2 to 4, a preliminary ranking of ecosystem services with regards to potential suitability for inclusion in ecosystem accounts has been conducted. The results are presented in Table 5. Note that given the limited number of respondents to the Survey (9) the scoring of Table 5 is preliminary, and meant as basis for discussion only. Scores are expressed in the range of 0 (potentially low suitability) to +++ (potentially high suitability).
Tables 3 and 4 reflect the scores provided by a small group of experts from different parts of the globe (Annex 5), versus the criteria specified in Section 3 and Annex 1. These criteria reflect therefore a general, tentative matching of criteria and services. Crucially, however, there are likely to be significant differences between individual countries in terms of data availability and policy priority, in addition to differences in ecology. Therefore, different countries may start with
different ecosystem services in developing ecosystem accounts.
12
Table 5. Preliminary scoring of ecosystem services with regards to their potential suitability for ecosystem accounting (from 0 to +++) Service Availability
of
biophysical
methods
Availability of
economic
methods
Availability of
biophysical
data
Availability of
economic
data
Options for generating
new data
Economic importance
Possibility to influence
decision
making
Sensitivity to change in the
environment
Final service ?
Score Comments
Regulation of air
quality through
filtration of air pollutants
including
particulate matter
++ ++ + + + +++ ++ ++ Yes ++ There is still uncertainty and limited data
regarding the capture of air pollution (often
expressed as particulate matter concentration or PM) by vegetation. In addition, there are
remaining challenges related to linking PM
deposition to air quality, and to quantifying health and economic impacts.
Carbon
sequestration
+++ +++ +++ ++ ++ +++ +++ +++ ? +++ This appears to be the most feasible service
for inclusion in SEEA. Data are available
and there is broad consensus on the methods to apply to quantify this service. There is no
consistency in the literature, however, if this
is a final or an intermediary service.
Regulation of
hydrological
flows through buffer function of
(forest)
ecosystems
+ + + + ++ ++ ++ +++ ? + This service has been much studied, but
almost exclusively on a watershed scale.
Analyzing the service is data intensive, and scaling up is very difficult since no
watershed is alike. This service may
therefore have low potential at this stage.
Protection of coastal zones
from floods by
coastal ecosystems, for
instance mangroves
+++ ++ ++ + ++ ++ ++ +++ Yes ++ The impact of dunes, coral reefs and mangroves in terms of flood protection in
coastal zones has been widely studied in the
ecological economic literature. Scaling up seems in principle feasible, provided that the
value of this service is modeled at a higher scale while correcting for population density,
local topography, etc.
Control of
erosion and sedimentation
++ + + + + + ++ ++ No + Control of erosion and sedimentation has
been frequently studied, in particular in soil sciences. Economic impacts are not always
easy to establish, there are different
valuation methods that often lead to different
outcomes. Scaling up is difficult, detailed
spatial run-off and erosion models are
needed to establish the costs (and benefits) of erosion and sedimentation.
Maintenance of
soil fertility
+++ + ++ + ++ ++ ? ++ No + Soil fertility is critical to agricultural
production, but impacts of ecosystem change and management are difficult to disentangle.

13
Pollination ++ ++ + +++ + ++ ? + No + Pollination is well studied in agronomy, but the contribution of ecosystems (e.g. natural
patches in the landscape) to maintaining
natural pollinators is determined at a very local scale, and therefore difficult to scale up
and analyze at aggregated scales
Control of pests and diseases
+ + + + + + ? + No 0 This service also depends on ecosystem configuration and processes at a very local
scale and scaling up is very difficult. In
addition, data are lacking and the contribution of the ecosystem versus the
impact of management is difficult to
disentangle.
Nursery service:
regulation of
species populations
+ + + + + ++ ? ++ No 0 Data are relatively scarce for this service,
and scaling up may be difficult given the
large variations between the nursery service of different ecosystems in terms of species
involved, local population sizes, interannual
variability in populations, etc.
Cultural services
Recreation and
tourism
++ +++ + +++ + +++ + + Yes +++ There are relatively ample data for this
service, in terms of visitor numbers and
value added generated in the tourism sector. A challenge is disentangling the
contributions of recreation facilities (cycling
paths, hotels, restaurants) from ecosystem
contributions (scenery, nature, etc.)
Inspiration,
spiritual,
cognitive
+ 0 0 0 + ? ? ? Yes 0 There is considerable uncertainty on how
this service can be quantified and measured.
Amenity service
(providing an
attractive living environment)
++ ++ + +++ + + + ++ Yes ++ This service can be related to property prices
for which broadly accepted methods and in
many countries relatively ample data are available.
14
5. Conclusions and potential next steps
Including ecosystem services in ecosystem accounts
This first survey (n=9) among experts in the field of ecosystem services showed that, in addition to the provisioning services, the carbon sequestration service is believed to be most feasible in terms of inclusion in an ecosystem accounting system at this point in time. The respondents to the Survey were consistent in indicating this service as most feasible. A particular aspect with this service is that both storage and sequestering carbon provide an ecosystem service, and that these
two aspects are not aligned. A high stock may mean that sequestration is limited because the vegetation is close to its maximum biomass under the ecological conditions pertaining in the particular area. A low stock may mean that there is scope for additional sequestration (e.g. in a recently cut forest with intact soil fertility), but this doesn’t have to be the case (e.g. in a desert). In general, it is recommended to consider both underlying stocks and flows of service in developing ecosystem accounts (see also EEA, 2011), and this seems particularly critical for the carbon capture service. It should be noted however, that although scientific methods and data are
relatively well developed for this service, this does not equally apply to all ecosystems, with relatively much data available for forests, and relatively few data for lakes and coastal systems. It needs to be decided if a first attempt at establishing ecosystem accounts may need to focus on terrestrial systems excluding lakes and rivers5. As one respondent indicated, there may also be data and/or methodological constraints related to analyzing carbon sequestration in degraded forests and in forest/landscape mosaics, which requires further consideration in developing ecosystem accounts.
Tourism and recreation is also believed to be a potentially important service to be addressed in ecosystem accounts. There are relatively ample data and there is a lot of experience with valuing this service. However, most valuation studies in the ecological economics literature have analyzed consumer surplus (often with the travel costs method) for visitors sometimes in combination with benefits for suppliers of recreational services. There is therefore a need to bring value estimates in
line with the economic metrics required for SEEA. A question is if and if so how the benefits to recreationists of being able to access ecosystem sites can be included in SEEA or if only benefits to providers of recreational services can be included in SEEA. In addition, contrary to carbon sequestration, it is unclear for the recreation and tourism service to what extent a spatially explicit, bottom-up approach is required. Tourism and recreation statistics are usually maintained for administrative units (commune, country) only, hence not for ecosystem types. It is therefore difficult to analyze the ecological contribution to this service; tourism and recreation will generally
depend on a mix of ecosystem related (e.g. scenery, biodiversity) and other (infrastructure,
presence of hotels, safety, etc.) factors. Hence, a particular challenge will be to disentangle the contribution of the ecosystem to the provision of this service. Coastal protection may have a high potential for inclusion in ecosystem accounting. A range of valuation studies have analyzed how flood risks decrease as a function of mangrove cover, or the presence of dunes and coral reefs. Other factors that influence this service are wave energy as a
function of storms and local bathymetrics, and the economic use of the coastal zone. Storm occurrence and therefore flood risk may be modeled in a probabilistic manner, on the basis of the occurrence and magnitude of storms in recent decades. Technically, extrapolation of the physical aspect of this service is possible, with spatial modeling factors such as population density and topography of the coastal zone to be taken into account. In terms of economic indicators, a starting point for discussion is perhaps to relate this service to the costs of alternative means of coastal
protection. Note that more literature is available on coastal protection compared to the flood protection service of riverine ecosystems, such as galley forests (TEEB, 2010). Hence, ecosystem
accounting initiatives may initially focus on coastal protection only.
5 Note that in lakes and rivers, sequestration is mainly based on deposition of carbon in sediments and
therefore linked to a combination of (changes in) land use, erosion and run-off patterns, hydrological processes
and water management. The link between land cover and service provision is present but less direct compared
to the link between land cover and carbon sequestration in terrestrial systems.

15
Erosion and sedimentation control is another service that has received much attention in both the scientific literature (in the fields of land management as well as ecosystem services modeling) and in policy assessments. There is however a need to carefully define the service being valued for the purpose of an accounting system. Where land husbandry techniques limit the degree of erosion in a field, the results of applying these techniques are reflected in the present and future yields. Since double counting should be avoided, the question is if this aspect of the erosion control service should be included in an accounting system. There is also an external cost of erosion, i.e.
high sediment loads in rivers may lead to siltation of irrigation or hydropower reservoirs, affect yields in areas where water is used for irrigation, or lead to degradation of coastal ecosystems (in particular coral reefs are vulnerable to sediment loads). However, there is sometimes also a positive externality of erosion: deposition of sediment downslope or in a delta area of a river may have a positive fertilization effect. In addition, there is need to consider that erosion and sediment control are driven by very localized factors, such as slope, soil types, vegetation, shape and
gradient of waterways, etc. Finally, there is need to consider that the often applied USLE model was originally developed for the USA, that its applicability and that of its successors outside the USA is sometime questioned, and that there are therefore not always suitable erosion models available. Hence, analyzing erosion and sedimentation control at a national scale is a data intensive exercise with potentially high uncertainties that would need to be better understood before the service can readily be modeled in the context of ecosystem accounting programs.
The amenity service, for the purpose of the survey described as providing an attractive living environment, involves a range of different aspects (scenery, local recreational opportunities, clean air, cultural heritage) - see TEEB, 2010 and the UK NEA, 2011 for a more comprehensive treatment of amenity services and values. The large majority of research on this service has taken place in OEACD countries, in particular in the US and Western Europe. It is therefore not evident that this service can also be analyzed in developing countries in a relatively straightforward manner, based on current data availability. In addition, in order to avoid double counting, it is important to define
this service, or aspects thereof to be included in a SEEA, in a consistent and narrow manner. Respondents of the survey indicated that this service may have potential for inclusion in SEEA based on data availability and current experiences with analyzing this service in both bio-physical and economic terms. This is further illustrated by the UK NEA, that includes the category of non-market urban greenspace. In the UK NEA, the amenity value is related to the presence of protected areas (National Parks, National Trust land and metropolitan green belt), local environmental
settings (domestic gardens, local green spaces, rivers) and several habitats (such as woodland, farmland and freshwater). The amenity service is reflected in property prices, and can be revealed through hedonic pricing methods. Air filtration depends on air pollution having a health impact on people, and the presence of ecosystems that capture air pollution. A range of studies have shown that forests remove air pollution by means of dry deposition of pollutants to plant surfaces (Beckett et al. 2000, Nowak et
al. 2006). However, there are relatively few studies quantifying the impacts of vegetation on air filtration, and filtration will also occur in non-natural ecosystems (e.g. farmland with trees around the fields) making it relatively complex to pinpoint the contribution of the ecosystem. The removal of particles from ambient air generates an economic benefit, related to increased well-being and reduced sickness due to air pollution, however there is still considerable uncertainty on the magnitude of these health impacts (Kunzli et al. 2000). A significant cause of uncertainty, which is
also highly relevant in the context of ecosystem accounting, pertains to the distance at which forests
influence air quality. For example, a UK study (Willis et al. 2003) assumed that health benefits from air filtration by forests only occur at short distances (<1 km) from the forest. European Commission (2005), however, states that damage assessments of particulate matter pollution need to consider that air pollution (PM) can spread over distances of several hundreds of kilometers from an emission source, which means that it may be reasonable to assume that the impacts of large forests on air quality extends over larger distances than only 1 km from the forest edge. Further clarification of this aspect is required before air filtration services can be included in ecosystem
accounting. In addition, it needs to be considered that the value of this service as revealed with WTP studies often depends on the income levels of the population exposed to air pollution. In developing global standards, a question is how impacts of varying income levels on the values of ecosystem services in national ecosystem accounts should be dealt with. First attempts to model this service at the national scale have been undertaken with the IMAGE model and there is scope to test analyzing this service for national ecosystem accounts in countries with high data availability (mostly temperate countries) and high levels of air pollution.
16
Clearly, these priorities are in addition to the inclusion of relevant provisioning services in
ecosystem accounts. Provisioning were not included in the Survey and this Issues Paper because accounting methods for provisioning services are already well established and (in principle) included in the national accounts. Note, however, that there is one service that has both a provisioning and a regulating character, the water supply service. Water can be supplied for drinking, irrigation and industrial production purposes. Three main sources of water are (i) pumping up groundwater, either from deep aquifers or from shallow wells; (ii) extracting surface water from lakes, rivers or man-made reservoirs; and (iii) desalinization. The last one is arguably
least connected to ecosystem quality: through the desalinization process most pollutants can be removed from the water and through an extension of the pipe used for extracting seawater the supply is relatively independent of coastal water quality. The first two sources, using ground or surface water, however both rely on the storage and supply service of ecosystems. Water pumped up from aquifers or other subsurface groundwater sources is
often of much higher quality (i.e. less polluted) than surface water because of the capacity of ecosystems to breakdown or bind pollutants. Water from rivers, lakes or other reservoirs may be purified by ecosystems, in particular if it has passed through a wetland that has the capacity to break down organic pollutants, and absorb inorganic pollutants. Often, headwaters or complete watersheds important for drinking water production are protected and managed as drinking water extraction area. To date, however, there is as yet no generally applied method for accounting for water resources. Interest in such a method among stakeholders is high, given the widespread
notion that global water resources are increasingly being depleted, and the interest of water companies to include watersheds they are managing or owning for drinking water production purposes in their asset books at a value reflecting their actual benefits provided. In addition, there is a relatively large availability of data on water production and water resources, for instance as gathered by drinking water production companies. Hence, although due to its dual nature not covered in this survey on regulating and cultural services, the water provisioning service including the regulating parts of this service could be considered as a service to be included in ecosystem
accounting. However, there are several caveats. First, there is a need for a clear demarcation of which aspects of this service are considered (infiltration / purification / storage). Second, there is a need to analyze carefully to what degree the selected aspect(s) of this service depends on the ecosystem. Third, there is a need to deal with the high spatial variability of this service, which may mean that it could only be feasible to analyze this service at the national scale for specific countries with high data availability and perhaps a particular scarcity of water.
Based on additional recommendations provided by the respondents to the Survey, in combination with the literature review, a number of general recommendations with regards to next steps to take can be formulated as an input into the overall discussion on developing ecosystem accounting methods:
With regards to physical indicators, there is a need to distinguish stock and flow indicators,
as in the amount of fish stock and the annual harvest of fish stock. A specific case is related to carbon, because both the storage and the sequestration of carbon may represent distinct ecosystem services.
For all services except carbon sequestration, the use of and therefore benefits provided by an ecosystem service also has a spatial dimension. For instance, downstream water users are affected by upstream ecosystem management, coastal protection depends on the land use and population density in the coastal zone, etc. In an accounting structure, there is a
need to disaggregate and disentangle the specific benefits provided by ecosystems in order to measure and record them, and non-overlapping classes are required in an accounting system. Clearly, however, when ecosystem benefits are quantified, it needs to be considered that benefits are provided to users at different spatial scales, that may or may not overlap with the ecosystems scale at which these benefits are generated.
For most services, only point based value estimates are available, and aggregation is
required in order to establish national level indicators. Aggregation is a critically important
element of ecosystem accounting, but methods for aggregation are not yet readily available and need to be further developed. These methods need to combine (i) point based supply or value estimates; (ii) national statistics on indicators relevant to ecosystem services supply (e.g. tourist entries); and (iii) spatial information and modeling in order to account for the spatial diversity of ecosystems and ecosystem services demand. Because information from ecosystem service valuation studies needs to be combined with spatial
data, the number of value estimates per service (Figure 2) does not present the full picture regarding data availability. For each ecosystem service, a different approach to aggregation

17
may be required. Many provisioning and regulating services need to be mapped in order to
obtain value estimates at higher aggregation levels, but other services, such as tourism and recreation, may not necessarily require detailed mapping involving linking specific ecosystem units to service supply, depending on the accounting principles (and in particular the required degree of spatial explicitness in recording ecosystem services supply to be adopted in SEEA).
During the London meeting in December 2011, several of the experts mentioned that some countries may be interested in prioritizing assets (e.g. forest land, wetlands) in addition to
prioritizing ecosystem services. Both the criteria developed in Section 3 and the information provided in Tables 3, 4 and 5 may provide a first basis for discussing how assets can be ranked in the context of SEEA.
A range of different methods for analyzing ecosystem services at higher scales are available (e.g. spatial modeling, spatial regression analysis, geo-statistical interpolation), and the suitability of these methods may well depend on data availability as well as
characteristics of the landscape (large continuous ecosystems versus mosaic landscapes). In terms of economic analysis, a critical aspect is that many valuation studies have studied
the surpluses generated by ecosystem services, whereas accounting requires recording of production based indicators. Aggregation and scaling up surplus indicators is methodologically very complex, however aggregation of production based indicators is consistent with the overall system of national accounting and possibly more straightforward. Nevertheless, this observation implies that there is a need to translate the
ecosystem service value estimates as published in the environmental and ecological economics literature from an indication of surplus to an indication of market based production.
With regards to identifying the most suitable and/or feasible ecosystem services for inclusion in SEEA, an extended survey among experts can assist in obtaining (i) a more comprehensive understanding of criteria for ranking the feasibility of and/or policy interest in including ecosystem services in SEEA; (ii) the scores of ecosystem services versus these
criteria; and (iii) availability of data at country and at an international level that can be used for ecosystem accounting. However, clearly, priorities for ecosystem accounting in specific countries will need to be developed in these countries themselves considering the key interests of policy makers, national ecology, data availability, as well as the international (UNSD) guidelines for SEEA under development. If such a wider survey is pursued, there is a need to further develop the questionnaire based on the feedback
obtained. For instance, as one respondent indicated, there is a need to elicit and indicate if the respondent should answer based on his/her own view or on the basis of an assumed broader view among experts, and to better define suitability in the tables of the questionnaire.
An essential step in developing methods for ecosystem accounting is, clearly, conducting pilot studies focusing on specific countries and/or specific ecosystem services, as currently undertaken in the context of the WAVES project. Lessons from ongoing projects need to be
considered in this processes, such as from the Spanish RECAMAN6 Project focusing on developing spatially explicit green accounting values for Andalucia and from the ERC funded Ecospace project developing bio-physical ecosystem service accounts on the sub-national scale in the Netherlands, Norway and Indonesia. The outcomes of this Issues Paper may provide input in the selection process for ecosystem services that may be considered for further study including in the context of the WAVES project.
6 Renta y Capital de los Montes de Andalucía

18
References
Beckett, K. P., P. H. Freer-Smith, G. Taylor. 2000. Particulate pollution capture by urban trees:
effect of species and windspeed. Global Change Biology 6(8):995-1003.
Boyd, J. and S. Banzhaf (2007). What are ecosystem services? The need for standardized
environmental accounting units. Ecological Economics 63, 616-626.
Costanza, R., R. d’Arge, R.S. de Groot, S. Farber, M. Grasso, B. Hannon, K. Limburg, S. Naeem,
R.V. O'Neill, J. Paruelo, R.G. Raskin, P. Sutton and M. van den Belt (1997) The value of the
world’s ecosystem services and natural capital. Nature 387: 253-260.
De Groot, R.S. (1992) Functions of Nature, Evaluation of nature in environmental planning,
management and decision making. Wolters-Noordhoff, Groningen, the Netherlands.
European Commission. 2005. ExternE- Externalities of energy. Methodology 2005 Update.
European Commission, Brussels, Belgium.
European Environment Agency (2007). Accounting fully for ecosystem services and human
wellbeing, Technical paper, EEA contribution to the “Beyond GDP” conference,
http://www.beyond-gdp.eu/download/bgdp-bp-eea.pdf
European Environment Agency (2010). Approaches to ecosystem valuation at the European
Environment Agency.
European Environment Agency (2011). An experimental Framework for ecosystem capital
accounting in Europe. EEA, Copenhagen.
Eurostat (2002) Accounts for recreational and environmental functions of forests Results of pilot
applications
FAO, 2011. Towards a System of Environmental Economic Accounting for Agriculture (SEEA-AGRI)
Paper prepared for FAO.
Haines-Young, R. and Potschin, M. (2010). Proposal for a common international classification of
ecosystem goods and services (CICES) for integrated environmental and economic accounting.
University of Nottingham. Report to the EEA.
Hamilton, K. (1996). Pollution and Pollution Abatement in the National Accounts, Review of Income
and Wealth 42(1).
Hein, L. (2010). Economics and ecosystems. Efficiency, sustainability and equity in ecosystem
management, Edward Elgar 2010.
Kunzli, N., Kaiser, R., Medina, S., Studnicka, M., Chanel, O., Filiger, P., Herry, M., Horak, F.,
Puybonnieux-Texler, V., Quenet, P., et al. (2000). Public-health impact of outdoor and traffic-
related air pollution: a European assessment. Lancet 356, 795–801.
Likens, G.E. (1992). The ecosystem approach: its use and abuse. Ecology Institute,
Oldendorf/Luhe, Germany.
Millennium Ecosystem Assessment (2003). Ecosystems and human well-being: a framework for
assessment. Report of the conceptual framework working group of the Millennium Ecosystem
Assessment. Island Press, Washington, DC.
Nowak, D. J., D. E. Crane and J. C. Stevens. 2006. Air pollution removal by urban trees and shrubs
in the United States. Urban Forestry Urban Greening 4(6):115-123.
Scholes, R. J., G. M. Mace, W. Turner, G.N. Geller, N. Jürgens, A. Larigauderie, D. Muchoney, B.A.
Walther, H.A. Mooney, 2008. Toward a Global Biodiversity Observing System. Science 321, p
1045.
TEEB (2010). The economics of ecosystems and biodiversity. Mainstreaming the economics of
nature. A synthesis of the approach, conclusions and recommendations of TEEB,
www.teebweb.org

19
UK NEA (2011). UK National Ecosystem Assessment. The UK National Ecosystem Assessment:
Synthesis of the Key Findings. UNEP-WCMC, Cambridge.
UN (1992) Convention Text, Convention on Biological Diversity, United Nations Conference on
Environment and Development, Rio de Janeiro, 1992.
UNSD (2011). Concept Note SEEA Part II Experimental Ecosystem Accounts.
Van der Maarel and Dauvellier (1978). Towards a general ecological model for spatial planning in
the Netherlands. Ministry for Housing and Spatial Planning, The Hague.
Willis, K. G., G. Garrod, R. Scarpa, N. Powe, A. Lovett, I. J. Bateman, N. Hanley, and D. C.
Macmillan. 2003. The social and environmental benefits of forests in Great Britain. Centre for
Research in Environmental Appraisal & Management, University of Newcastle, UK.

20
The World Bank 1818 H Street N.W. (202) 473-1000
INTERNATIONAL BANK FOR RECONSTRUCTION AND DEVELOPMENT Washington, D.C. 20433 Cable Address: INTBAFRAD INTERNATIONAL DEVELOPMENT ASSOCIATION U.S.A. Cable Address: INDEVAS
Annex 1. Survey. Prioritization of Ecosystem Services for
Ecosystem Accounting
SURVEY
Prioritization of Ecosystem Services for Ecosystem Accounting
Lars Hein and Glenn-Marie Lange, Version 4, 20 October 2011
1. Purpose of the Survey
This survey is the first step of a 2-stage process that aims to get the view of key experts
in the fields of i) biophysical/spatial modelling and ii) economic valuation of ecosystem
services about the state of the science for measuring and valuing ecosystem services.
This information will be used to prioritise work on developing accounts for ecosystem
services for the System for Environmental Economic Accounting (SEEA
http://unstats.un.org/unsd/envaccounting/default.asp ). The SEEA is the framework for
integrating information about the environment with national accounts – the most widely
used source of information about the economy, including indicators such as GDP as well
as detailed statistics for analysis such as input-output tables. The survey will feed
directly into both the World Bank coordinated WAVES Programme7 and the SEEA revision
process coordinated by UN Statistics Division.
The 1st stage survey will be distributed among a small group of experts who are
somewhat familiar with the SEEA in order to get initial results and to refine the survey
instrument. The 2nd stage survey based on a refined questionnaire will be distributed to a
broader group of experts, as part of the international consultation process on the SEEA.
The outcome of this first survey will be used in support of an Issues Paper on the
Prioritisation of Ecosystem Services to be presented for discussion at the UNSD/World
Bank/EEA SEEA expert meeting on 5 to 7 December 2011. This Issues Paper will support
discussions on the appropriate next steps towards better accounting for ecosystem
services in the SEEA and, hence, in economic statistics and analysis.
The survey aims to obtain information on two specific questions:
1. Which are the relevant criteria for prioritizing ecosystem services in accounting
systems?
2. For which ecosystem services are the measurement and valuation currently robust
enough so that reasonable estimates of value can be incorporated in national
accounting systems?
7 Wealth Accounting and Valuation of Ecosystem Services (WAVES)—a 5-year program to promote
environmental accounting and extend the accounts for ecosystems and their services, www.worldbank.org/programs/waves

21
The 1st stage survey will provide a preliminary assessment of priorities and
identify where the survey needs to be more detailed
the 2nd stage survey, with more detailed questions, will systematically identify
the particular obstacles to measurement and valuation.
To give a brief example:
Storage of carbon in forests would be a potentially feasible ecosystem service because
methodology for measurement of the volume of carbon stored is largely agreed,
methodology can be implemented on a large scale, across biomes using a small
number of parameters for which data are relatively easily obtained,
measuring carbon is a policy priority, and
there is broad agreement about how to value carbon storage
For other services, scaling up from local/parcel measurements to landscape/regional or
national levels may be problematic because of the site-specific nature of the provision of
ecosystem service and/or its value.
The Survey focuses on Regulating and Cultural Services since accounting methods for
Provisioning Services are already well established and included in the national accounts
(in principle, if not always well measured).
Regulating services are valuable as inputs to the production of goods and services that
directly benefit people (largely the provisioning services and recreation), but are not
explicitly represented in the national accounts, for instance because they have no market
prices. Such services can be termed Intermediate ecosystem services in the framework
of national accounts. Hence, Intermediate ecosystem services are services that support
other economic activities (as in the case of pollination supporting agriculture). They share
many characteristics with ancillary activities (e.g. cleaning undertaken within a factory)
as understood in the System of National Accounting.
Filling in the Survey should not take more than 10 to 15 minutes. We recognize that you
may not be so familiar with all ecosystem services, or services across all biomes, and do
not expect you to attempt to provide an opinion about those with which you are not
familiar.
Participants in the Survey will be acknowledged in the Issues Paper and will receive a
copy of the paper when finalised.

22
2. Criteria for prioritizing ecosystem services’ inclusion in SEEA
In order to facilitate the selection of ecosystem services that should be prioritised in
developing ecosystem accounting methods at a national scale, your view is asked on the
criteria that should be used to identify these potentially suitable ecosystem services. The
table below presents a first proposal for these criteria, pls. modify where required, and
pls. add additional criteria where relevant. Table 1. Potential criteria for selecting priority ecosystem services to be included in SEEA.
Criterion (proposal) Your modification / view / comments:
Opportunities and constraints related to modelling and data
1 Degree of understanding of the
ecological processes underlying the service.
2 Degree of understanding of the impacts on production and consumption generated by the service.
3 Availability of data for measuring ecosystem services
4 Potential to scale up parcel ecosystem estimates to landscape/national level value estimates. E.g., the ability to reliably
describe the provision of services in terms of a small number of parameters
for which data are readily available
Opportunities and constraints related to economic valuation; economic significance and impacts
5 Availability of economic data for valuing ecosystem services
6 Potential to scale up local value estimates to national level value estimates.
7 Economic importance of the ecosystem service.
8 Possibility to influence environmental and/or economic policy and decision
making
YOUR ADDITIONAL CRITERIA: (plus elaboration if required:)
3. Identification of ecosystem services that can most readily be incorporated in
accounting systems
Table 2 and 3 present the regulating and cultural services as distinguished in the TEEB
study. Table 2 focuses on biophysical aspects, Table 3 on economic aspects. Pls. indicate

23
your judgement of the feasibility of accounting for ecosystem services at the national
scale, using the criteria stated in Table 1 in combination with your own criteria.
Table 2 distinguishes between the different biome types (based on the TEEB
classification) in order to elicit if in the selection of priorities for ecosystem accounting it
is also required to consider priority biome types, or combinations of biomes and
ecosystem services8.
Pls. use a ranking system including:
- - not suitable at all
- not suitable
0 may be suitable / no opinion
+ suitable
++ very suitable
Pls. indicate explanatory comments in the column on the right.
8 A number of small modifications of the TEEB classification have been introduced in order to ensure the
consistency of Tables 2 and 3. In particular, the biomes Marine, Urban, Ice/rock/polar and Desert have not
been included because the supply of most of the ecosystem services listed in Tables 2 and 3 is very small
compared to the supply in other biomes. In addition, the description of the ecosystem services in Tables 2 and
3 has in some cases been narrowed down to comprise only the most significant type of benefit provided by the
service, based on a review of the TEEB valuation database. E.g. Tables 2 and 3 only elicit information on the
flood protection service of coastal ecosystems (where most data are available) and not for the flood protection
service of riparian ecosystems (on which very few studies have been conducted).
24
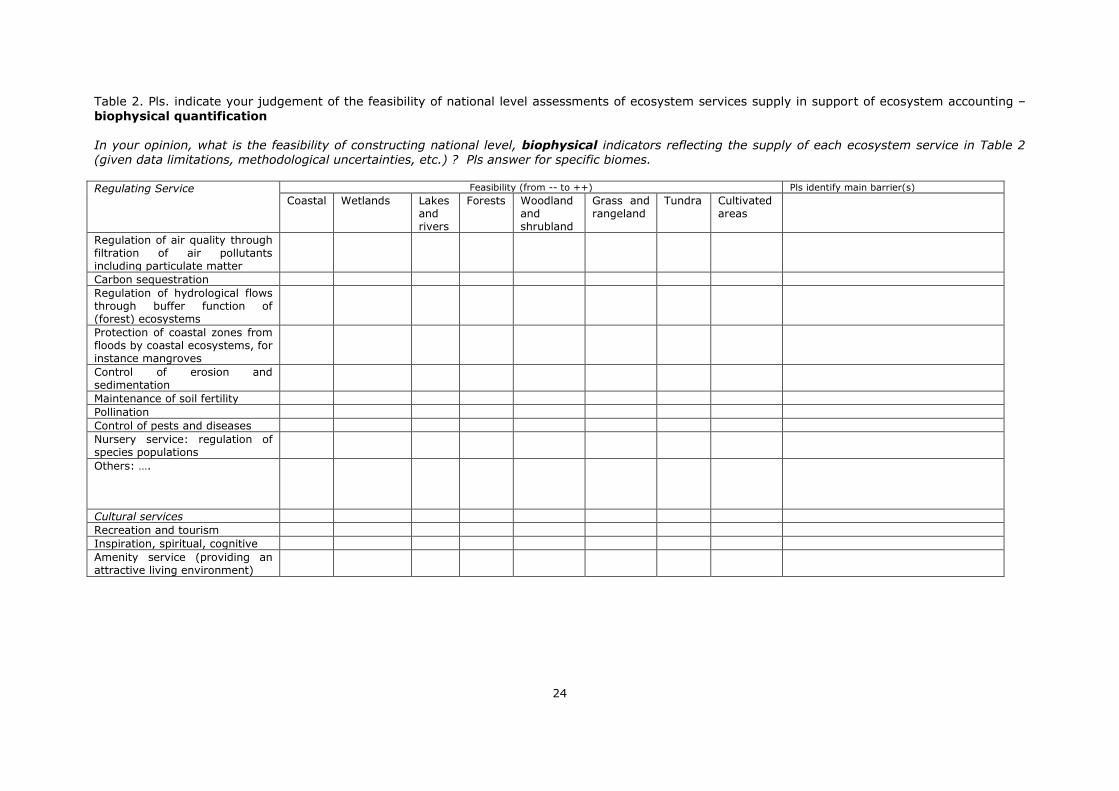
Table 2. Pls. indicate your judgement of the feasibility of national level assessments of ecosystem services supply in support of ecosystem accounting –
biophysical quantification In your opinion, what is the feasibility of constructing national level, biophysical indicators reflecting the supply of each ecosystem service in Table 2 (given data limitations, methodological uncertainties, etc.) ? Pls answer for specific biomes. Regulating Service Feasibility (from -- to ++) Pls identify main barrier(s)
Coastal Wetlands Lakes and rivers
Forests Woodland and shrubland
Grass and rangeland
Tundra Cultivated areas
Regulation of air quality through filtration of air pollutants including particulate matter
Carbon sequestration
Regulation of hydrological flows through buffer function of (forest) ecosystems
Protection of coastal zones from floods by coastal ecosystems, for instance mangroves
Control of erosion and sedimentation
Maintenance of soil fertility
Pollination
Control of pests and diseases
Nursery service: regulation of species populations
Others: ….
Cultural services
Recreation and tourism
Inspiration, spiritual, cognitive
Amenity service (providing an attractive living environment)

25
Table 3. Pls. indicate your judgement of the feasibility of national level assessments of ecosystem services supply in support of ecosystem accounting –
economic valuation In your opinion, what is the feasibility of constructing national level, economic indicators reflecting the supply of each ecosystem service in Table 3 (given data limitations, methodological uncertainties, etc.) Please answer for specificbiomes. Regulating Service Feasibility (from -- to ++) Pls identify main barrier(s)
Coastal Wetlands Lakes and rivers
Forests Woodland and shrubland
Grass and rangeland
Tundra Cultivated areas
Regulation of air quality through filtration of air pollutants including particulate matter
Carbon sequestration
Regulation of hydrological flows through buffer function of (forest) ecosystems
Protection of coastal zones from floods by coastal ecosystems, for instance mangroves
Control of erosion and sedimentation
Maintenance of soil fertility
Pollination
Control of pests and diseases
Nursery service: regulation of species populations
Others: ….
Cultural services
Recreation and tourism
Inspiration, spiritual, cognitive
Amenity service (providing an attractive living environment)

26
4. Any other comments or insights
Finally, pls. share with us any other comments you would like to make, or insights you want to share regarding national level accounting for ecosystem services. In particular, we would be interested in (i) other criteria or insights relevant to the development of an ecosystem accounting system; and (ii) advise on on-going projects that would generate methodological insights or data.
Other comments:
Thank you for your input !

27
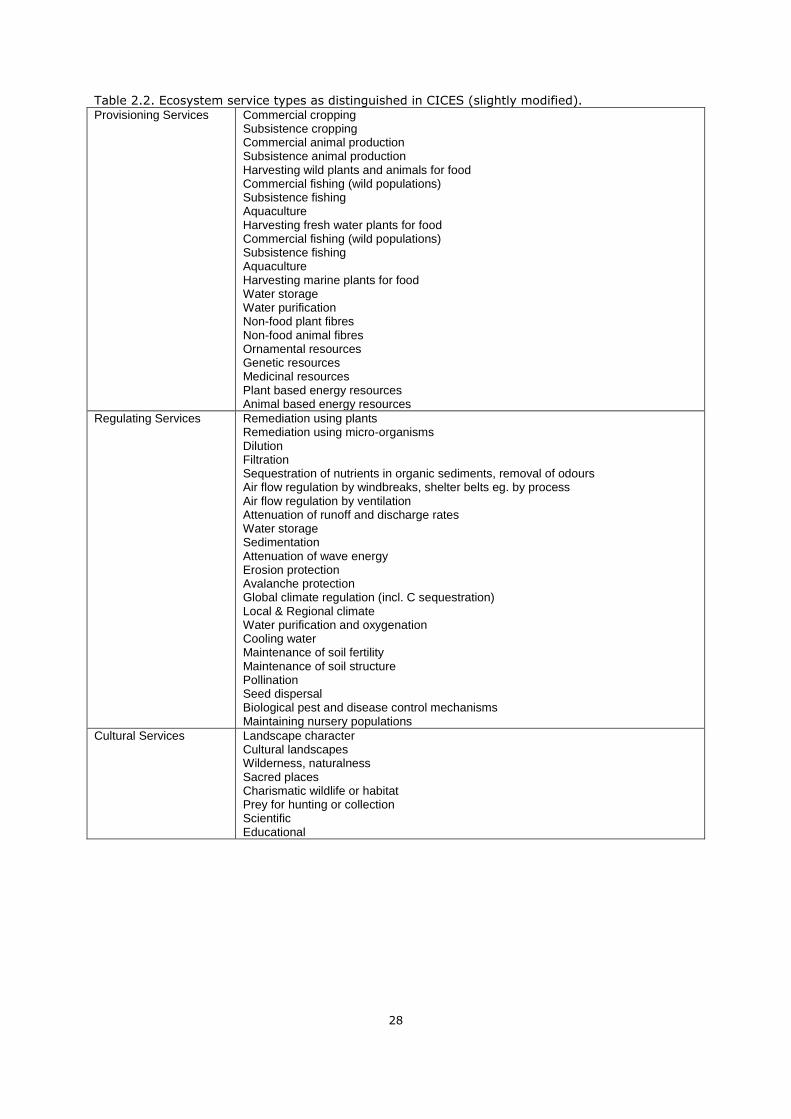
Annex 2. TEEB and CICES classifications of ecosystem services Table 2.1 and 2.2 present the ecosystem services distinguished in TEEB and CICES. Given the focus of this Issues Paper on services related to ecosystems, table 2.2 does not include the abiotic
services included in CICES. Table 2.1 Ecosystem service types as distinguished in TEEB and the total number of value estimates per service included in the TEEB database.
Service # of value estimates
PROVISIONING SERVICES 487
Food (e.g. fish, game, fruit) 201
Water (e.g. for drinking, irrigation, cooling) 51
Raw Materials (e.g. fiber, timber, fuel wood, fodder, fertilizer) 167
Genetic resources (e.g. for crop-improvement and medicinal purposes) 11
Medicinal resources (e.g. biochemical products, models & test-organisms)
38
Ornamental resources (e.g. artisan work, decorative plants, pet animals,
fashion)
7
Provisioning values (general) 12
REGULATING SERVICES 320
Air quality (e.g. capturing (fine)dust, chemicals, etc) 8
Climate (incl. C-sequestration, influence of vegetation on rainfall, etc.) 87
Extreme events (eg. storm protection and flood prevention) 62
Water flows (e.g. natural drainage, irrigation and drought prevention) 10
Waste (especially water purification) 65
Erosion prevention 32
Soil fertility (incl. soil formation) 31
Pollination 9
Biological control (e.g. seed dispersal, pest and disease control) 15
Regulating values (general) 1
HABITAT & SUPPORTING SERVICES 120
Life cycles (incl. nursery service) 19
Genetic diversity (especially in gene pool protection) 101
CULTURAL & AMENITY SERVICES 191
Aesthetic 10
Recreation 165
Inspiration 5
Spiritual experience 2
Cognitive development 9
Cultural values (general) 12
Total: 1251
28
Table 2.2. Ecosystem service types as distinguished in CICES (slightly modified). Provisioning Services Commercial cropping
Subsistence cropping Commercial animal production Subsistence animal production Harvesting wild plants and animals for food Commercial fishing (wild populations) Subsistence fishing Aquaculture Harvesting fresh water plants for food Commercial fishing (wild populations) Subsistence fishing Aquaculture Harvesting marine plants for food Water storage Water purification Non-food plant fibres Non-food animal fibres Ornamental resources Genetic resources Medicinal resources Plant based energy resources Animal based energy resources
Regulating Services Remediation using plants Remediation using micro-organisms Dilution Filtration Sequestration of nutrients in organic sediments, removal of odours Air flow regulation by windbreaks, shelter belts eg. by process Air flow regulation by ventilation Attenuation of runoff and discharge rates Water storage Sedimentation Attenuation of wave energy Erosion protection Avalanche protection Global climate regulation (incl. C sequestration) Local & Regional climate Water purification and oxygenation Cooling water Maintenance of soil fertility Maintenance of soil structure Pollination Seed dispersal Biological pest and disease control mechanisms Maintaining nursery populations
Cultural Services Landscape character Cultural landscapes Wilderness, naturalness Sacred places Charismatic wildlife or habitat Prey for hunting or collection Scientific Educational

29
Annex 3. Land cover units in the GlobCover map.
The Table below presents the 22 units distinguished in the global land cover map of
GlobCover.
II. Value GlobCover global legend
11 Post-flooding or irrigated croplands
14 Rainfed croplands
20 Mosaic Cropland (50-70%) / Vegetation (grassland, shrubland, forest) (20-50%)
30 Mosaic Vegetation (grassland, shrubland, forest) (50-70%) / Cropland (20-50%)
40 Closed to open (>15%) broadleaved evergreen and/or semi-deciduous forest (>5m)
50 Closed (>40%) broadleaved deciduous forest (>5m)
60 Open (15-40%) broadleaved deciduous forest (>5m)
70 Closed (>40%) needleleaved evergreen forest (>5m)
90 Open (15-40%) needleleaved deciduous or evergreen forest (>5m)
100 Closed to open (>15%) mixed broadleaved and needleleaved forest (>5m)
110 Mosaic Forest/Shrubland (50-70%) / Grassland (20-50%)
120 Mosaic Grassland (50-70%) / Forest/Shrubland (20-50%)
130 Closed to open (>15%) shrubland (<5m)
140 Closed to open (>15%) grassland
150 Sparse (>15%) vegetation (woody vegetation, shrubs, grassland)
160 Closed (>40%) broadleaved forest regularly flooded - Fresh water
170 Closed (>40%) broadleaved semi-deciduous and/or evergreen forest regularly flooded -
Saline water
180 Closed to open (>15%) vegetation (grassland, shrubland, woody vegetation) on regularly
flooded or waterlogged soil - Fresh, brackish or saline water
190 Artificial surfaces and associated areas (urban areas >50%)
200 Bare areas
210 Water bodies
220 Permanent snow and ice
Source: GLOBCOVER 2009 Product description and validation report, 18/02/2011, page
19

30
Annex 4. Illustration of the relation between land cover and
ecosystem services supply. The land cover units are loosely based on CORINE, the Table is not comprehensive with regards to ecosystem services. The Table presents an illustration to serve as a basis for discussion only .
Final service Intermediate services
Part of standard output Include as additional output Ancillary production
Land cover
Wo
od
Cro
ps
Oth
er
pro
du
ct
Ca
rbo
n
seq
ues
tra
tio
n
Rec
rea
tio
n
Bre
akd
ow
n/
dis
per
sio
n
of
po
llu
tio
n
Po
llin
ati
on
Hyd
rolo
gic
al
serv
ice
Oth
er
reg
ula
tin
g
serv
ices
Urban land
Agricultural land X X X X X
Forests and semi-
natural land
X X X X X X X
Wetland X X X X X
Inland water bodies X X? X X X
Other terrestrial
land (including
barren land)
X X
Marine X X X
Atmosphere X

31
Annex 5. Respondents to the Survey
David Barton (NINA, Norway)
Ian Bateman (University of East Anglia, UK)
Jim Boyd (Resources for the Future, USA)
Alejandro Caparros (Instituto de Políticas y Bienes Públicos, Spain)
Neville Crossman (Csiro, Australia)
Peter May (Federal Rural University of Rio de Janeiro, Brazil)
David Simpson (EPA, USA)
Roy Haines-Young (Nottingham University, UK)
Louise Willemen (JRC, Italy)