Criteo state-of-mobile-commerce-q4-2015-ppt
27
State of Mobile Commerce Q4 2015 Leading mobile retailers dominate – and the gap is growing
-
Upload
sahiljsharma -
Category
Retail
-
view
70 -
download
0
Transcript of Criteo state-of-mobile-commerce-q4-2015-ppt

State of Mobile Commerce
Q4 2015
Leading mobile retailers dominate – and the gap is growing

Copyright © 2016 Criteo
State of Mobile Commerce Q4 Highlights
Criteo’s analysis of shopping data from Q4 2015 demonstrates that mobile is an established channel for retail transactions in a world where mobile devices are at the center of the connected consumer. As the fifth quarterly Mobile Commerce Report, this is the first report to analyze year-over-year growth in key verticals and devices as retailers shift to people-centric strategies.
• Top retailers see double the growth in mobile share of transactions when compared to the average, and mobile nears parity with desktop transactions.
• Nearly four-in-ten transactions occurred on multiple devices and were completed on a mobile device almost a third of the time.
• Dedicated shopping apps dwarf the mobile web at all points on the path to purchase, from browsing products to the sale itself.
• Japan, UK and South Korea continue to lead the globe in mobile transactions, and smartphones lead tablets in most countries.
These trends and forecasts come from Criteo’s Q4 2015 State of Mobile Commerce Report, based on its unique pool of online shopping data.

Criteo’s analysis of shopping data from Q4 2015 highlights several best practices that retailers can take away from this report.
• Enable your mobile experience to meet the fastest growing audience – smartphones. Smartphones dominate mobile transactions. Make sure that your mobile channels are designed for your largest audience, or better yet, responsive to each individual device and environment.
• Personalize the mobile web shopping experience to convert browsers to buyers. Shoppers browse on their mobile devices 44% of the time, and 53% of the time for the top quartile of companies as ranked by share of mobile transactions. Close the deal with more browsers by eliminating barriers to purchase, such as streamlining the number of clicks and adding/retaining payment options, and highlighting your best, most relevant products for each consumer on your mobile site.
• Take advantage of cross-device identification technology to understand your connected consumers. By using a reliable solution that provides scale and precision, you can link real-time shopping behavior across devices to improve context and relevance. Cross-device transactions accounted for 37% of all transactions in Q4, indicating that shoppers are browsing and buying on multiple devices.
• Decrease barriers to transaction and connect to consumer data to personalize product recommendations in your app. Apps are more than just a showroom, they convert better and have a higher average order value than even desktop.
Key Recommendations for Mobile Commerce
Copyright © 2016 Criteo These recommendations come from Criteo’s Q4 2015 State of Mobile Commerce Report, based on its unique pool of online shopping data.

U.S. Mobile Commerce Trends

Mobile powers tremendous growth across all eCommerce
#1
Copyright © 2016 Criteo
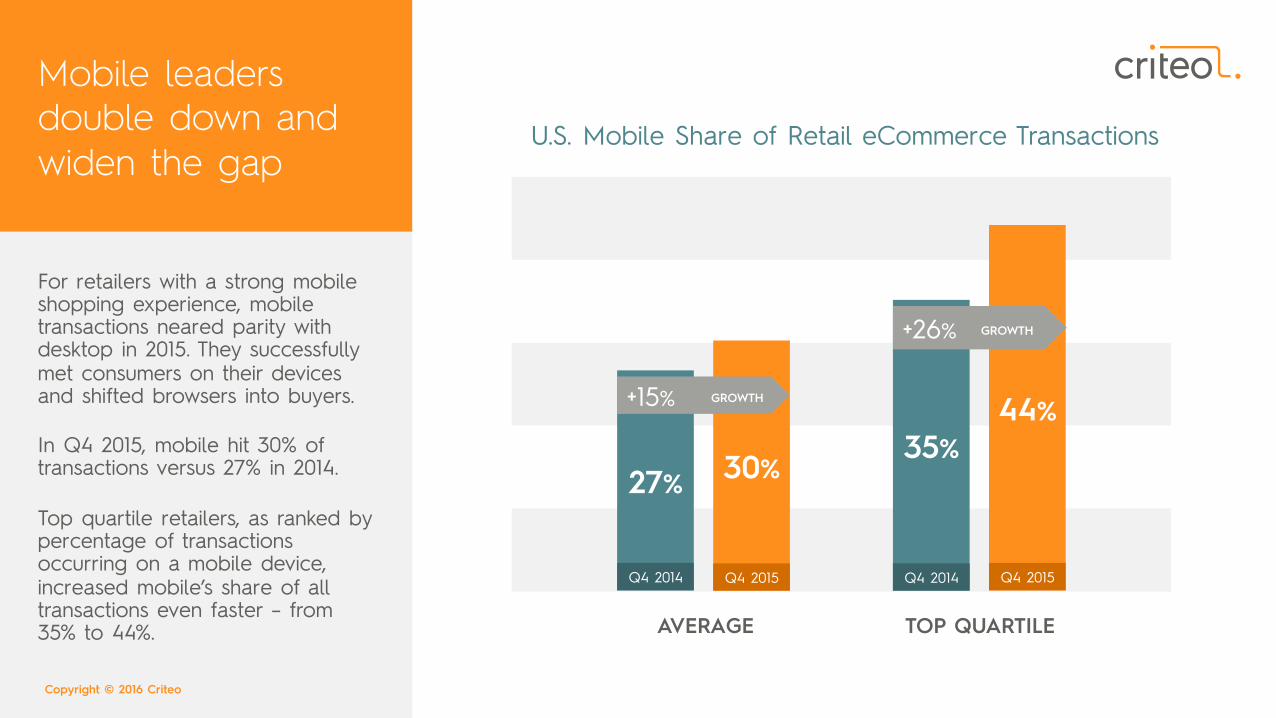
Mobile leaders double down and widen the gap
For retailers with a strong mobile shopping experience, mobile transactions neared parity with desktop in 2015. They successfully met consumers on their devices and shifted browsers into buyers.
In Q4 2015, mobile hit 30% of transactions versus 27% in 2014.
Top quartile retailers, as ranked by percentage of transactions occurring on a mobile device, increased mobile’s share of all transactions even faster – from 35% to 44%.
U.S. Mobile Share of Retail eCommerce Transactions
AVERAGE
30%
44%
27% 35%
+15% GROWTH
+26% GROWTH
Q4 2014 Q4 2015 Q4 2014 Q4 2015
TOP QUARTILE

Copyright © 2016 Criteo
Meet the over-performers: fashion, health and mass merchants
Mobile is becoming an integral part of the shopping experience, particularly for verticals such as fashion and mass merchants.
Health & beauty transactions saw the largest increase in mobile share at 38% year over year, followed by home and mass merchant categories.
U.S. Mobile Share of eCommerce Transactions by Sub-Vertical
0% 10% 20% 30% 40% 50%
30% A
vera
ge
+17%
+24%
+38%
+2%
+25%
Q4 2014 Q4 2015
FASHION & LUXURY
MASS MERCHANTS
HEALTH & BEAUTY
SPORTING GOODS
HOME
YoY
GRO
WTH

Copyright © 2016 Criteo
Smartphones dominate and are poised to grow
Smartphone’s share of mobile transactions grew by more than 15% year over year, now accounting for 60% of all mobile transactions in the U.S.
The combination of better transaction channels, ubiquity, more phone models with big bright screens and fast wireless broadband is giving retailers better options for displaying their goods on mobile devices – ultimately leading to more transactions.
U.S. Retail Mobile Transaction Share, by Device (% total)
TABLET SMARTPHONE
52% 53% 54% 56% 60%
Q4 2014 Q1 2015 Q2 2015 Q3 2015 Q4 2015
YoY GROWTH
+15%

Copyright © 2016 Criteo
Mobile pushed Black Friday to new heights
Holiday online shopping volumes broke records this year, and mobile clocked a significant share throughout the holiday weekend following Thanksgiving in the U.S.
Black Friday mobile commerce share trended higher than the quarterly average at 41%. In fact, there were 18% more mobile transactions on Black Friday than on Cyber Monday.
U.S. Holiday Retail eCommerce Index and Mobile Share of Transactions
MOBILE DESKTOP
AVERAGE BLACK FRIDAY
30%
41%
100
600

Sell to people, not devices
#2

Copyright © 2016 Criteo
Almost four-in-ten transactions involve multiple devices
Nearly four-in-ten transactions occurred across multiple devices or channels in Q4 2015. Within cross-device transactions, mobile accounted for 31% compared to 30% on average.
That means that cross-device purchasers are slightly more likely to use mobile to complete a transaction than the average.
But that doesn’t tell the whole story.
Cross-Device Share of Retail Transactions & Mobile Share of Cross-Device Transactions, Q4 2015
SINGLE-DEVICE TRANSACTIONS
CROSS-DEVICE TRANSACTIONS
37%
CROSS-DEVICE MOBILE TRANSACTIONS
CROSS-DEVICE DESKTOP TRANSACTIONS
Includes consumers matched across multiple devices by a universal ID and/or hashed email.
31%
69%

Copyright © 2016 Criteo
Buyers use multiple devices, are you selling on them?
Criteo found that 37% of desktop transactions occurred after shoppers visited the same retailer’s site on at least one other device or browser before purchasing.
Tablet transactions were the most likely to have multiple devices in the path to purchase, indicating that tablet buyers are most likely browsing on devices like desktops and smartphones before purchasing.
U.S. Cross-Device Share of eCommerce Transactions
63%
Includes consumers matched across multiple devices by a universal ID and/or hashed email.
% of users who used multiple devices in path to purchase
User completed purchase on
43%
TABLET DESKTOP
37%
SMARTPHONE
35%

Copyright © 2016 Criteo
Four-in-ten cross-device desktop transactions include mobile browsing
Desktop still holds the lion’s share of online eCommerce purchases, but mobile is playing an important role in browsing products on retailers’ sites prior to purchase.
Nearly four-in-ten cross-device desktop purchases occurred after shoppers browsed a retailer’s site on at least one mobile device.
Make sure your site is able to display all of your products across any screen to best represent and sell to customers.
Share of Retail Site Cross-Device Visits Prior to Desktop Transactions
Includes consumers matched across multiple devices by a universal ID and/or hashed email.
CROSS-DEVICE DESKTOP
TRANSACTIONS DESKTOP BROWSERS & DEVICES
13%
25%
62%
MOBILE AND DESKTOP
MOBILE ONLY

Copyright © 2016 Criteo
DESKTOP ONLY
52%
31%
16%
MOBILE AND DESKTOP
MOBILE BROWSERS & DEVICES
Half of cross-device mobile transactions are a result of mobile-only browsing
For mobile cross-device transactions, more than half of browsing occurred on mobile browsers and devices only, while another third occurred across both mobile and desktop.
This data shows that a slight majority of mobile cross-device purchases are mobile only, meaning this subset of shoppers never viewed the retailer’s site on a desktop device.
Share of Retail Site Cross-Device Visits Prior to Mobile Transactions
Includes consumers matched across multiple devices by a universal ID and/or hashed email.
CROSS-DEVICE MOBILE
TRANSACTIONS

Apps drive more transactions and value by removing barriers to purchase
#3

Copyright © 2016 Criteo
Invest in an app that highlights relevant products for each consumer
Retailers whose apps focus on providing shoppers relevant and useful products and remove barriers to purchase drive a higher share of transactions than mobile web.
Continuing the trend from past quarters, the overall share of app transactions consists of half or more of all transactions.
Global App vs. Browser Share of Mobile Transactions, Q4 2015
Includes sites that have over 25% of eCommerce transactions on mobile, 10% of which are from mobile apps.
RETAIL
54%
46%
APP
MOBILE BROWSER

Copyright © 2016 Criteo
Apps convert better than desktops
Due to the native environment and additional control of the purchase path, retailers see a higher conversion rate on their apps than both mobile web and desktop.
Technologies like deep linking and mobile retargeting can help retailers drive sustained engagement and transactions in their apps.
Global Retail Mobile Conversion Rates, by Channel
Includes sites that have over 25% of eCommerce transactions on mobile, 10% of which are from mobile apps.
+100%
+20% RETAIL
DESKTOP MOBILE BROWSER APP

Copyright © 2016 Criteo
Apps beat mobile browsers at every stage in the funnel
The app conversion funnel is wider at every point of contact than mobile web, indicating that app users are your most loyal and dedicated shoppers.
In particular, app users browse almost four times as many products than mobile web. From that larger base, shoppers are almost twice as likely to add items to their basket in an app than in a mobile browser.
Global Retail Conversion Funnel, by Channel
Includes sites that have over 25% of eCommerce transactions on mobile, 10% of which are from mobile apps.
MOBILE BROWSER APP
+286%
+85%
+23%
Products viewed per user
5.7
Add-to-basket
13%
Purchase
44%
Products viewed per user
22.0
CONVERSION RATE +120% CONVERSION RATE
Add-to-basket
24%
Purchase
54%

Copyright © 2016 Criteo
Per transaction, app buyers spend more than both mobile web and desktop
Not only do apps convert a higher percentage of your customers, they also bring in more revenue per transaction.
Controlling the environment allows retailers to give customers engaging product content (i.e. videos, images, reviews) targeted to things like buying history and browsing behavior. This is more effective than generic targeting signals found on mobile web and desktop sites.
Global Retail Average Order Value Index, by Channel (vs Desktop)
Includes sites that have over 25% of eCommerce transactions on mobile, 10% of which are from mobile apps.
$92
MOBILE BROWSER
$100
DESKTOP
$102
APP

Global Mobile Retail Commerce Trends

Copyright © 2016 Criteo
Globally, mobile accounts for 35% of retail eCommerce transactions
Japan, UK and South Korea make up the top three countries ranked by mobile share of transactions, globally. Advanced mobile countries remained constant while others are catching up.
The biggest gainers were UK, which passed South Korea for second, and Australia, which leapfrogged five countries to land in fourth.
The US remains in the middle of the pack, but trails the global average along with Germany, France and Spain.
Mobile Share of Retail eCommerce Transactions, by Country
35%
Ave
rage
30%
Ave
rage
Q4 2014 Q4 2015
JAPAN
UNITED KINGDOM
SOUTH KOREA
AUSTRALIA
NETHERLANDS
SPAIN
GERMANY
UNITED STATES
ITALY
FRANCE
RUSSIA
BRAZIL
YoY
GRO
WTH
+49%
+39%
+89% 0% 50%

Copyright © 2016 Criteo
The smartphone is the mobile purchase device of choice in most markets
In most countries, the smartphone accounts for a majority of mobile transactions, contrary to the idea that tablets are the device of choice for shoppers. This trend is most pronounced in Japan and South Korea, the first and third country in respect to mobile transactions as a share of all eCommerce transactions.
The three exceptions are UK, Netherlands and Russia, which see a slight majority of mobile transactions on tablets.
Smartphone and Tablet Share of Retail eCommerce Transactions, by Country
SMARTPHONE TABLET
JAPAN
UNITED KINGDOM
SOUTH KOREA
AUSTRALIA
NETHERLANDS
SPAIN
GERMANY
UNITED STATES
ITALY
FRANCE
RUSSIA
BRAZIL
0% 50%

Copyright © 2016 Criteo
The US is still trailing advanced markets in mobile conversion rates
When compared to other countries globally, mobile conversion rates in the US come in near the middle of the pack, but the three leaders in mobile share of transactions (Japan, UK and South Korea) also dominate when it comes to conversion rates.
This is an especially interesting finding considering that Japanese and South Korean mobile transactions are mostly conducted on smartphones, defying common logic that tablets almost always convert better.
Global Retail Mobile Conversion Rate Index (vs the US)
JAPAN
UNITED KINGDOM
SOUTH KOREA
AUSTRALIA
NETHERLANDS
SPAIN
GERMANY
UNITED STATES
ITALY
FRANCE
RUSSIA
BRAZIL
0 300
UNIT
ED
STATE
S 10
0

What’s next?

What does the future hold?
Copyright © 2016 Criteo
We see four big trends:
• Growth in mCommerce keeps rolling. MCommerce transaction share nears parity with desktop as retailers adopt customer-friendly mobile websites and transaction-driving apps.
• Smartphones, now with larger screens, fast wireless broadband and seamless synchronization between web and app, will push mobile’s share of commerce to parity with desktop. Mobile devices are closing in on desktop in both conversion rates and average order value, while apps are performing better.
• Across the board, apps will continue to drive business results. Apps are an essential transaction channel that will continue to improve as best practices to boost conversion rates and average order values are adopted throughout the industry.
• A great people-centric strategy will separate the professionals from the amateurs; 2015 was a year of testing emerging solutions, but 2016 will be the year of implementation. Expect eCommerce businesses to implement their customer and device data to connect with people, not devices.

Mobile Commerce Report Methodology
*Data analyzed is for customer browsing and shopping behavior in October 2015, across desktop and all mobile devices (including iPhone, iPad, and Android smartphones and tablets) Copyright © 2016 Criteo
Individual transaction data analyzed How can marketers use this data?
Over 3,300 online retail and travel businesses globally
1.7 billion transactions per year across both desktop and mobile sites
$720 billion in annual sales
Benchmark your performance on relevant KPIs for your mobile browser, mobile app and cross-device channels

This and future Mobile Commerce reports can be found at:
www.criteo.com/resources/mobile-commerce-report/
Criteo delivers personalized performance marketing at an extensive scale. Measuring return on post-click sales, Criteo makes ROI transparent and easy to measure. Criteo has over 1,800 employees in 27 offices across the Americas, EMEA and Asia-Pacific, serving over 10,000 advertisers worldwide with direct relationships with close to 14,000 publishers.
Criteo ads reach over 1.1 billion unique Internet users (comScore, September 2015).
About Criteo