
Cristina Soto-Treviño, Pascale Rabbah, Eve Marder and ... marder/A computational... · This...
16
94:590-604, 2005. First published Feb 23, 2005; doi:10.1152/jn.00013.2005 J Neurophysiol Cristina Soto-Treviño, Pascale Rabbah, Eve Marder and Farzan Nadim You might find this additional information useful... 43 articles, 23 of which you can access free at: This article cites http://jn.physiology.org/cgi/content/full/94/1/590#BIBL 8 other HighWire hosted articles, the first 5 are: This article has been cited by [PDF] [Full Text] [Abstract] , January 28, 2009; 29 (4): 1140-1151. J. Neurosci. M. Antri, K. Fenelon and R. Dubuc Neurons The Contribution of Synaptic Inputs to Sustained Depolarizations in Reticulospinal [PDF] [Full Text] [Abstract] , April 29, 2009; 29 (17): 5573-5586. J. Neurosci. A. L. Taylor, J.-M. Goaillard and E. Marder Multicompartment Model How Multiple Conductances Determine Electrophysiological Properties in a [PDF] [Full Text] [Abstract] , May 20, 2009; 29 (20): 6427-6435. J. Neurosci. V. Tohidi and F. Nadim Correlated with Network Frequency Membrane Resonance in Bursting Pacemaker Neurons of an Oscillatory Network Is [PDF] [Full Text] [Abstract] , September 12, 2009; 364 (1529): 2493-2500. Phil Trans R Soc B A. Cifra, F. Nani, E. Sharifullina and A. Nistri physiological and pathological conditions A repertoire of rhythmic bursting produced by hypoglossal motoneurons in [PDF] [Full Text] [Abstract] , October 1, 2009; 102 (4): 2161-2175. J Neurophysiol J. Golowasch, G. Thomas, A. L. Taylor, A. Patel, A. Pineda, C. Khalil and F. Nadim Measurement Method in Nonisopotential Neurons Membrane Capacitance Measurements Revisited: Dependence of Capacitance Value on including high-resolution figures, can be found at: Updated information and services http://jn.physiology.org/cgi/content/full/94/1/590 can be found at: Journal of Neurophysiology about Additional material and information http://www.the-aps.org/publications/jn This information is current as of December 13, 2009 . http://www.the-aps.org/. American Physiological Society. ISSN: 0022-3077, ESSN: 1522-1598. Visit our website at (monthly) by the American Physiological Society, 9650 Rockville Pike, Bethesda MD 20814-3991. Copyright © 2005 by the publishes original articles on the function of the nervous system. It is published 12 times a year Journal of Neurophysiology on December 13, 2009 jn.physiology.org Downloaded from
Transcript of Cristina Soto-Treviño, Pascale Rabbah, Eve Marder and ... marder/A computational... · This...

94:590-604, 2005. First published Feb 23, 2005; doi:10.1152/jn.00013.2005 J NeurophysiolCristina Soto-Treviño, Pascale Rabbah, Eve Marder and Farzan Nadim
You might find this additional information useful...
43 articles, 23 of which you can access free at: This article cites http://jn.physiology.org/cgi/content/full/94/1/590#BIBL
8 other HighWire hosted articles, the first 5 are: This article has been cited by
[PDF] [Full Text] [Abstract]
, January 28, 2009; 29 (4): 1140-1151. J. Neurosci.M. Antri, K. Fenelon and R. Dubuc
NeuronsThe Contribution of Synaptic Inputs to Sustained Depolarizations in Reticulospinal
[PDF] [Full Text] [Abstract], April 29, 2009; 29 (17): 5573-5586. J. Neurosci.
A. L. Taylor, J.-M. Goaillard and E. Marder Multicompartment Model
How Multiple Conductances Determine Electrophysiological Properties in a
[PDF] [Full Text] [Abstract], May 20, 2009; 29 (20): 6427-6435. J. Neurosci.
V. Tohidi and F. Nadim Correlated with Network Frequency
Membrane Resonance in Bursting Pacemaker Neurons of an Oscillatory Network Is
[PDF] [Full Text] [Abstract], September 12, 2009; 364 (1529): 2493-2500. Phil Trans R Soc B
A. Cifra, F. Nani, E. Sharifullina and A. Nistri physiological and pathological conditions
A repertoire of rhythmic bursting produced by hypoglossal motoneurons in
[PDF] [Full Text] [Abstract], October 1, 2009; 102 (4): 2161-2175. J Neurophysiol
J. Golowasch, G. Thomas, A. L. Taylor, A. Patel, A. Pineda, C. Khalil and F. Nadim Measurement Method in Nonisopotential Neurons
Membrane Capacitance Measurements Revisited: Dependence of Capacitance Value on
including high-resolution figures, can be found at: Updated information and services http://jn.physiology.org/cgi/content/full/94/1/590
can be found at: Journal of Neurophysiologyabout Additional material and information http://www.the-aps.org/publications/jn
This information is current as of December 13, 2009 .
http://www.the-aps.org/.American Physiological Society. ISSN: 0022-3077, ESSN: 1522-1598. Visit our website at (monthly) by the American Physiological Society, 9650 Rockville Pike, Bethesda MD 20814-3991. Copyright © 2005 by the
publishes original articles on the function of the nervous system. It is published 12 times a yearJournal of Neurophysiology
on Decem
ber 13, 2009 jn.physiology.org
Dow
nloaded from

Computational Model of Electrically Coupled, Intrinsically DistinctPacemaker Neurons
Cristina Soto-Trevino,1 Pascale Rabbah,2 Eve Marder,3 and Farzan Nadim4
1Volen Center, Brandeis University, Waltham, Massachusetts and Department of Mathematical Sciences, New Jersey Institute ofTechnology; 2Department of Biological Sciences, Rutgers University, Newark, New Jersey; 3Volen Center and Biology Department,Brandeis University, Waltham, Massachusetts; and 4Department of Mathematical Sciences, New Jersey Institute of Technology andDepartment of Biological Sciences, Rutgers University, Newark, New Jersey
Submitted 6 January 2005; accepted in final form 16 February 2005
Soto-Trevino, Cristina, Pascale Rabbah, Eve Marder, and FarzanNadim. Computational model of electrically coupled, intrinsicallydistinct pacemaker neurons. J Neurophysiol 94: 590–604, 2005. Firstpublished February 23, 2005; doi:10.1152/jn.00013.2005. Electricalcoupling between neurons with similar properties is often studied.Nonetheless, the role of electrical coupling between neurons withwidely different intrinsic properties also occurs, but is less wellunderstood. Inspired by the pacemaker group of the crustacean pyloricnetwork, we developed a multicompartment, conductance-basedmodel of a small network of intrinsically distinct, electrically coupledneurons. In the pyloric network, a small intrinsically bursting neuron,through gap junctions, drives 2 larger, tonically spiking neurons toreliably burst in-phase with it. Each model neuron has 2 compart-ments, one responsible for spike generation and the other for produc-ing a slow, large-amplitude oscillation. We illustrate how thesecompartments interact and determine the dynamics of the modelneurons. Our model captures the dynamic oscillation range measuredfrom the isolated and coupled biological neurons. At the networklevel, we explore the range of coupling strengths for which synchro-nous bursting oscillations are possible. The spatial segregation ofionic currents significantly enhances the ability of the 2 neurons toburst synchronously, and the oscillation range of the model pacemakernetwork depends not only on the strength of the electrical synapse butalso on the identity of the neuron receiving inputs. We also comparethe activity of the electrically coupled, distinct neurons with that of anetwork of coupled identical bursting neurons. For small to moderatecoupling strengths, the network of identical elements, when receivingasymmetrical inputs, can have a smaller dynamic range of oscillationthan that of its constituent neurons in isolation.
I N T R O D U C T I O N
Cells that are electrically coupled through gap junctions arefound in numerous biological tissues, including nervous sys-tems of both vertebrates and invertebrates (Bennett 1997;Dermietzel and Spray 1993). The common role of electricalcoupling among neurons is believed to be synchronization oftheir activities (Jefferys 1995; Perez Velazquez and Carlen2000), although theoretical studies show that electrical cou-pling can lead to more complex network activity (Chow andKopell 2000; Sherman and Rinzel 1992). When the neuronsinvolved are intrinsically distinct, the behavior of an electri-cally coupled 2-cell network can be fairly unintuitive (Med-vedev and Kopell 2001; Wilson and Callaway 2000). A passiveneuron electrically coupled to an oscillatory neuron can have a
nonmonotonic effect on the oscillatory cell frequency as thecoupling strength is increased (Kepler et al. 1990). Electricalcoupling between an oscillatory and a bistable neuron canresult in a wide variety of behaviors, again depending on theirintrinsic properties and the coupling strength (Kopell et al. 1998).
The rhythmically active pyloric network of the crustaceanstomatogastric ganglion (STG) is driven by a pacemaker kernelconsisting of one anterior burster (AB) neuron and 2 pyloricdilator (PD) neurons that are electrically coupled. The ABneuron is a small neuron that, when isolated from all localnetwork interactions, produces rhythmic bursts of action po-tentials. The PD neurons are larger than the AB neuron and inisolation they fire tonically. Rhythmic bursting cannot betypically induced in the PD neurons by externally injectedcurrent (Eisen and Marder 1984; Miller and Selverston 1982).These neurons also differ in the neurotransmitters they use(Marder and Eisen 1984b), their response to neuromodulators,and pre- and postsynaptic targets (Marder and Eisen 1984a). Inthe intact network, the AB–PD group reliably produces in-phase bursts in a wide frequency range that can be altered bycurrent injection (Ayali and Harris-Warrick 1999; Eisen andMarder 1984; Hooper 1997; Miller and Selverston 1982).
We developed a model of an electrically coupled AB–PDpair. To take into account the distinct intrinsic and dynamicproperties of these neurons we used current measurementsfrom cultured STG neurons of the spiny lobster Panulirusinterruptus (Turrigiano et al. 1995) as a starting point. To tunethe model to capture the dynamic activity of the biologicalpacemaker neurons, we used experimental data from the indi-vidual isolated neurons or the isolated pacemaker group underthe 2 conditions in which they are usually experimentallystudied; that is, in the absence and presence of the descendingneuromodulatory inputs to the STG.
We use this model to illustrate, at the single neuron level,behaviors that arise from coupling compartments that in isola-tion are capable of producing very different oscillations. At thenetwork level we explore the coupling ranges for which anintrinsically bursting neuron drives a tonic spiking neuron toburst synchronously with it, and the effect of the compartmen-tal structure on their ability to synchronize. We conclude byasking how the dynamical repertoire of an intrinsically burstingneuron is affected when it is electrically coupled to an identicalneuron or to an intrinsically distinct one.
Address for reprint requests and other correspondence: F. Nadim, Depart-ment of Biological Sciences, Rutgers University, 135 Smith Hall, Newark, NJ07102 (E-mail: [email protected]).
The costs of publication of this article were defrayed in part by the paymentof page charges. The article must therefore be hereby marked “advertisement”in accordance with 18 U.S.C. Section 1734 solely to indicate this fact.
J Neurophysiol 94: 590–604, 2005.First published February 23, 2005; doi:10.1152/jn.00013.2005.
590 0022-3077/05 $8.00 Copyright © 2005 The American Physiological Society www.jn.org
on Decem
ber 13, 2009 jn.physiology.org
Dow
nloaded from

M E T H O D S
Experiments
Adult male and female spiny lobsters (Panulirus interruptus),weighing 400–800 g, were purchased from Don Tomlinson Fisheries(San Diego, CA) and kept in artificial seawater tanks at 12–15°C untiluse. Before dissection, the animals were covered in ice for about 30min. Standard methods (Harris-Warrick 1992; Selverston et al. 1976)were used to isolate the stomatogastric nervous system [including theSTG and the esophageal (OG) and the paired commissural (CoG)ganglia], which was then pinned down in a Sylgard-coated petri dish.The preparations were superfused with normal saline, 18°C, pH 7.35,containing (in mM) 12.8 KCl, 479 NaCl, 13.7 CaCl2, 10.0 MgSO4,3.9 NaSO4, 11.2 Trizma base, and 5.1 maleic acid.
The STG was desheathed to allow penetration of the cell bodies.Glass microelectrodes pulled using a Flaming–Brown micropipettepuller (Sutter Instruments, Novato, CA) were filled with 0.6 M K2SO4
and 0.02 M KCl (resistance 15–23 M�) for neuron identification andcurrent injections or backfilled with 5–10% lucifer yellow (in dH2O)backfilled with 1 M LiCl (resistance 30–50 M�) for photoinactiva-tion. Identification of the neurons was achieved by matching theirintracellular recordings to extracellular recordings on motor nerves(Selverston et al. 1976).
On identification, the neurons were isolated by photoinactivating allneurons that establish synaptic connections onto them. That is, for ABisolation, the 2 PD and the ventricular dilator (VD) neurons wereinactivated, whereas for PD isolation, the AB, the VD, and the lateralpyloric (LP) neurons were inactivated. To isolate the AB–PD group,the VD and LP neurons were inactivated. The complete photoinacti-vation procedure is outlined in Eisen and Marder (1984), Hooper andMarder (1987), and Miller and Selverston (1982).
Once isolated, the AB neuron was impaled with 2 electrodes, onefor injecting current and one for recording voltage in current clamp.The current-injection protocol was carried out using an Axoclamp 2Bamplifier (Axon Instruments, Union City, CA). Single square pulses(duration 60 s) were injected into the AB neuron with various DCcurrent levels to shift the baseline membrane potential �70 mV fromrest. For isolated PD neuron experiments, both PD neurons wereimpaled with 2 electrodes and current was simultaneously injectedinto both neurons using the same protocol as above. For isolatedAB–PD unit experiments, the AB neuron and one PD neuron wereimpaled with 2 electrodes each. Descending neuromodulatory inputsto the STG were reversibly blocked by building a Vaseline wellaround the desheathed stomatogastric nerve that was filled with 1 Msucrose and 10�6 M tetrodotoxin (TTX; Biotium, Hayward, CA).
A Digidata 1332A board was used for data acquisition and currentinjection with pClamp 9 software (Axon Instruments). The acquireddata were saved as individual binary files and were analyzed eitherwith the readscope software (http://stg.rutgers.edu/software/software.htm) developed in the Nadim laboratory or with scripts on a Linuxplatform.
Simulations
Each neuron was modeled with 2 compartments, one representingthe soma, primary neurite, and dendrites (S/N), and the other repre-senting the axon (A). Each A compartment is responsible for theproduction of action potentials. In each compartment the membranepotential V obeyed the current conservation equation
CdV
dt� Iext � Iint � Icoup
where C is the membrane capacitance, Iext is the externally injectedcurrent, Iint is the sum of intrinsic and modulatory currents, and Icoup
is the sum of the axial current (Iaxial) from the adjacent compartment
and (in the case of the S/N compartment) the gap-junctional current(Igap).
The intrinsic and modulatory currents were based primarily onexperimental data from P. interruptus cultured STG neurons (Turri-giano et al. 1995).
These currents are described as a product of a maximal conductancegi, activation mi, and inactivation hi variables, and a driving force(V � Ei), where Ei is the reversal potential that corresponds to theparticular ion i
Ii � gi m ipihi
qi�V � Ei�
The exponents pi and qi take integer values between 0 and 4,depending on the current type. The behavior of the activation andinactivation variables is described by
�m�V�dm
dt� m��V� � m
�h�V�dh
dt� h��V� � h
where m� and h� represent the steady-state values, and �m and �h arethe respective time constants. The dependency on voltage and intra-cellular Ca2� concentration ([Ca2�]) of each of these functions isgiven in Table 1. The steady-state activation of IKCa also depends on[Ca2�] (Table 1). The values of maximal conductances gi are given inTable 2.
In the S/N compartments, [Ca2�] is governed by
�Ca
d�Ca2�
dt� � FICa � �Ca2� � Co
where �Ca is the Ca2� buffering time constant, Co is the backgroundintracellular Ca2� concentration, and the factor F translates the totalCa2� current ICa (in nA) into an intracellular concentration. Thevalues of �Ca, F, and Co used in this model are given in Table 2.
The reversal potential ECa for the calcium currents was computedusing the intracellular calcium concentration from the Nernst equa-tion, assuming an extracellular concentration of 13 mM (Buchholtz etal. 1992). All other reversal potentials were constant and are given inTable 2.
In the case of the model AB neuron, the presence of neuromodu-latory inputs was modeled by adding a fast, noninactivating, voltage-gated, inward current referred to as the modulatory proctolin currentIproc (Golowasch et al. 1992; Swensen and Marder 2000). The voltagedependency and related parameters of the proctolin current are de-scribed in Tables 1 and 2. Because, in P. interruptus, proctolin has noeffect on the biological PD neuron (Hooper and Marder 1987), wemodeled the presence of neuromodulatory inputs in the PD neuron notby adding Iproc, but as an increase in the maximal conductance of theCa2� currents (Table 2), which have been shown to be targets ofmodulation in this neuron (Johnson et al. 2003).
The mathematical description for the axial currents Iaxial and thegap-junctional currents Igap is the same. For each model neuron theaxial current in the S/N compartment IaxialS/N
is the product of an axialconductance and the difference of the membrane potential in the Aand S/N compartments
IaxialS/N� gaxial �VS/N � VA�
Similarly, Igap is the product of a gap-junctional conductance and themembrane voltage difference of the 2 S/N compartments
IgapPD� ggap�VS/NPD
� VS/NAB�
Coupling currents in coupled compartments were symmetrical:IaxialS/N
�IaxialAand IgapPD
�IgapAB.
To distinguish between weak bursting and irregular spiking, forboth experimental data and simulation results, bursting was consid-
591MODEL OF ELECTRICALLY COUPLED PACEMAKER NEURONS
J Neurophysiol • VOL 94 • JULY 2005 • www.jn.org
on Decem
ber 13, 2009 jn.physiology.org
Dow
nloaded from

ered weak when the amplitude of the slow wave oscillation wasbetween 2 and 4 mV and either the number of spikes per burst was �3or the oscillation period was irregular. When the slow wave was �2mV in amplitude the behavior was labeled as spiking.
Simulations were performed on a PC with the Linux platform usingthe network software developed in the Nadim laboratory. We used a4th-order Runge–Kutta numerical integration method with time stepsof 0.05 and 0.01 ms.
R E S U L T S
The behavior of the AB–PD network in response tocurrent injection
To tune the qualitative behavior of the model to match thatof the biological network, we used a dynamic perturbation ofthe biological AB–PD oscillator after synaptic isolation fromother STG neurons. By injecting different values of constant
DC current into the AB or PD neurons, the activity of theseneurons was changed from quiescent to bursting to tonic firingin different conditions. We first examined the activity of theseneurons with the neuromodulatory inputs to the STG intact.
A comparison between the behavior of the biological neu-rons (left traces) and the model (right traces) is shown in Fig.1. In each panel, the gray background illustrates the traces with0 current injection, and depolarizing and hyperpolarizing DCcurrent was injected in increasing amounts. In all cases shown,the model network mimicked the activity of the biologicalneurons.
In the intact network (Fig. 1A), with 0 current injection, theAB and PD neurons showed in-phase rhythmic bursting activ-ity. Hyperpolarization of the AB neuron caused the burstingcycle to slow down and the amplitude of the oscillations todecrease. With sufficient hyperpolarization, the neurons be-
TABLE 1. Voltage and calcium dependency for the steady-state activation m and inactivation h of the currents
m, h x� �x, ms
INa� m31
1 � exp� � �V � 24.7�/5.291.32 �
1.26
1 � exp� � �V � 120�/25
h1
1 � exp��V � 48.9�/5.18� 0.67
1 � exp� � �V � 62.9�/10�
� �1.5 �1
1 � exp��V � 34.9�/3.6�
ICaT m31
1 � exp� � �V � 25�/7.255 �
49.5
1 � exp� � �V � 58�/17
h1
1 � exp��V � 36�/7AB:87.5 �
75
1 � exp� � �V � 50�/16.9
PD:350 �300
1 � exp� � �V � 50�/16.9
ICaS m31
1 � exp� � �V � 22�/8.516 �
13.1
1 � exp� � �V � 25.1�/26.4
INap m31
1 � exp� � �V � 26.8�/8.219.8 �
10.7
1 � exp� � �V � 26.5�/8.6
h1
1 � exp��V � 48.5�/4.8666 �
379
1 � exp� � �V � 33.6�/11.7
Ih m1
1 � exp��V � 70�/6272 �
1499
1 � exp� � �V � 42.2�/8.73
IK m41
1 � exp� � �V � 14.2�/11.87.2 �
6.4
1 � exp� � �V � 28.3�/19.2
IKCa m4 AB:� �Ca
�Ca � 30� 1
1 � exp� � �V � 51�/490.3 �
75.09
1 � exp� � �V � 46�/22.7
PD:� �Ca
�Ca � 30� 1
1 � exp� � �V � 51�/8IA m3 (AB)
1
1 � exp� � �V � 27�/8.711.6 �
10.4
1 � exp� � �V � 32.9�/15.2m4 (PD)
h1
1 � exp��V � 56.9�/4.938.6 �
29.2
1 � exp� � �V � 38.9�/26.5
Iproc m1
1 � exp� � �V � 12�/3.050.5
The function was used for both neurons unless indicated.
592 C. SOTO-TREVINO, P. RABBAH, E. MARDER, AND F. NADIM
J Neurophysiol • VOL 94 • JULY 2005 • www.jn.org
on Decem
ber 13, 2009 jn.physiology.org
Dow
nloaded from

came quiescent. Depolarization of the AB neuron increased theoscillation frequency and decreased its amplitude. The electri-cally coupled model AB–PD neurons showed behavior similarto that of the biological neurons (Fig. 1A).
The isolated biological AB neuron always showed burstingoscillations and showed a similar response with the oscillationfrequency increasing as the depolarization was increased (Fig.1B, left). However, in contrast with the intact AB–PD network,the amplitude of oscillations consistently decreased as a func-tion of injected current. The isolated AB neuron typically didnot exhibit pure tonic firing with large injected DC current.Instead it produced high-frequency and low-amplitude burstsof 2–3 action potentials (Fig. 1B, left top trace). The isolatedmodel AB neuron showed behavior similar to that of thebiological neuron.
In contrast to the isolated AB neuron, isolated biological PDneurons typically showed only tonic spiking activity (Fig. 1C,left middle trace) whose frequency increased with injectedcurrent. Injection of negative current silenced this activity. Insome cases (n 2 of 5), the isolated PD neuron showed weak(small-amplitude and irregular) rhythmic bursting activity thatturned into tonic spiking with positive current injection (datanot shown). Again, the model PD neuron (Fig. 1C, right)showed behavior similar to that of the biological neuron.
Removing the neuromodulatory inputs to the STG drasti-cally changes the activity of the AB–PD network (Bal et al.1988; Miller and Selverston 1982; Selverston and Miller1980). The activity of the AB–PD kernel in the absence ofneuromodulatory inputs is shown in Fig. 2. Without currentinjection the biological AB–PD neurons were typically quies-cent (Fig. 2, bottom left panel, gray) or weakly tonically active(not shown). Injection of positive DC current caused theseneurons to produce weak bursting oscillations with 1–3 spikesper burst. The oscillation frequency increased and its amplitudedecreased with injected current. Removal of the modulatorycurrents in the model AB and PD neurons (Fig. 2, right)
resulted in a model AB–PD kernel that showed behaviorsimilar to that of the biological coupled AB–PD neurons.
In the absence of neuromodulatory inputs, the isolated bio-logical AB neuron was silent (n 4 of 5). (In one preparation,however, small-amplitude oscillations were recorded in theisolated AB neuron.) Positive current injection produced veryweak bursts with 1–2 spikes per burst (n 5, data not shown).The isolated PD neuron showed tonic activity very similar toits activity in the presence of neuromodulatory inputs (n 3,data not shown).
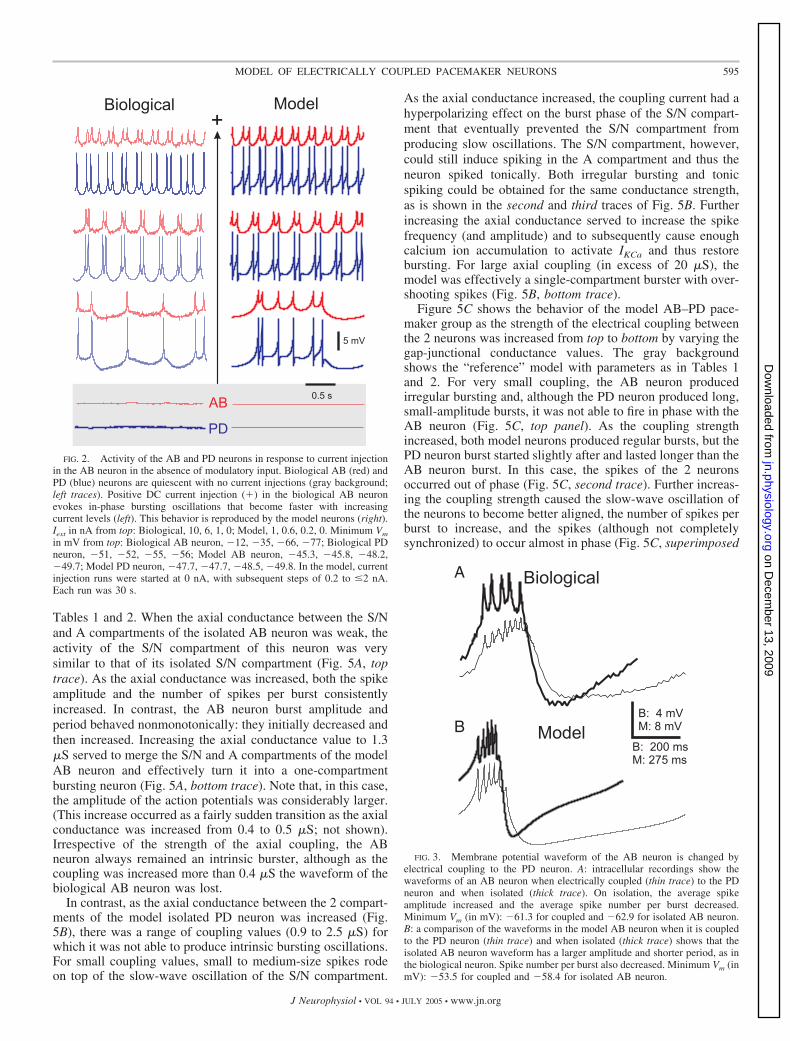
Figure 3A shows a qualitative comparison of the waveformsof the AB neuron when coupled to the PD neurons (thin trace)and after isolation from the PD neurons (thick trace). Theamplitude and number of spikes/burst were measured in 5preparations (5 cycles each), and consistent with the datashown in Fig. 3A, the spike amplitude per burst increased by anaverage of 142% (SD 64%), whereas the number of spikes perburst decreased by an average of 45% (SD 11%). Figure 3Bshows a similar comparison of the waveforms for the modelAB neuron, in isolation (thick trace) and when coupled to themodel PD neuron (thin trace). The model AB neuron showeda decrease in burst amplitude and increase in period whencoupled to the model PD neuron, as well as an increase in theburst duration and the number of spikes per burst. Thesechanges were consistent with the experimental results. Thesedata show that the amplitude of the AB neuron slow wave issignificantly decreased by its coupling to the PD neurons.
Understanding the network model behavior as a function ofits components
The AB–PD neuron model described in the previous sectionhas a number of properties. We now describe how theseproperties contribute to the behavior of the model, and usethese to make some more general statements about networks inwhich nonidentical neurons are electrically coupled.
THE TWO COMPARTMENTS OF THE MODEL NEURONS. There havebeen previous models that were inspired by the pyloric pace-maker neurons, focusing on the effect of electrical coupling onthe frequency of an oscillator to a second neuron that was silentor tonically active (Kepler et al. 1990), and on the effects onfrequency and burst duration of electrically coupled 2-dimen-sional oscillators (Abbott et al. 1991; Meunier 1992). Thesestudies provided valuable insights into the nature of electricalcoupling, but were not meant to reproduce the dynamic behav-ior of the pyloric pacemaker neurons. To build a biophysicallyplausible model that accounted for the specific intrinsic prop-erties of the individual neurons, we based our model onvoltage-clamp descriptions of the ionic currents in culturedSTG neurons (Turrigiano et al. 1995). We then adjusted theparameters of the ionic currents, as described later in RESULTS,to reproduce the behavior of the biological pacemaker neurons,both in isolation and as a group.
Figure 4A shows a schematic representation of the segrega-tion of the currents in the 2 compartments in the modelneurons. The currents responsible for action potential genera-tion were separated from those responsible for the generationof slow oscillations (approximately 1 Hz; see Fig. 4B) for thefollowing reasons: 1) Pyloric neurons produce slow-wave volt-age oscillations in the absence of action potentials (Raper
TABLE 2. Parameter values of the model
AB PD
gi, �S Ei, mV gi, �S Ei, mV
AxonINa 300 50 1,110 50IK 52.5 �80 150 �80IL 0.0018 �60 0.00081 �55C 1.5 nF 6.0 nF
SomaICaT 55.2 22.5 (10)ICaS 9 60 (54)INap 2.7 50 4.38 50Ih 0.054 �20 0.219 �20IK 1,890 �80 1576.8 �80IKCa 6,000 �80 251.85 �80IA 200 �80 39.42 �80Iproc 570 (0) 0IL 0.045 �50 0.105 �55C 9.0 nF 12.0 nF[Ca] �ca 303 ms, F 0.418
�M/nA, Co 0.5 �M�ca 300 ms, F 0.515
�M/nA, Co 0.5 �MIcoup gaxial 0.3 �S,
ggap 0.75 �Sgaxial 1.05 �S,
ggap 0.75 �S
The numbers in parentheses denote the absence of modulatory inputs.
593MODEL OF ELECTRICALLY COUPLED PACEMAKER NEURONS
J Neurophysiol • VOL 94 • JULY 2005 • www.jn.org
on Decem
ber 13, 2009 jn.physiology.org
Dow
nloaded from

1979). 2) Under some modulatory conditions (such as high-frequency stimulation of the inferior ventricular nerve, a mod-ulatory nerve that connects the brain to the stomatogastricnervous system), the PD neuron is able to produce long, slowbursts (Eisen and Marder 1984; Miller and Selverston 1982).
In each model neuron, the action potentials were generatedin the axon (A) compartment by fast sodium INa and delayed-rectifier potassium IKd currents with Hodgkin–Huxley typedynamics. The compartments labeled as S/N represent thesoma and primary neurite. The A compartment was excitable,but in isolation from the S/N compartment remained quiescent(Fig. 4B). In the S/N compartment, the intrinsic outwardcurrents were a delayed-rectifier IKd, a calcium-dependent IKCa,and a transient IA potassium current. The inward currents
consisted of a transient ICaT and a persistent ICaS calciumcurrent, a persistent sodium current INaP, and a hyperpolariza-tion-activated inward current Ih. To model the effect of de-scending modulatory inputs, a voltage-gated inward current(such as the one activated by the neuropeptide proctolin) Iprocwas added to the S/N compartment of the model AB neuron(Fig. 4A) (Hooper and Marder 1987; Marder et al. 1986;Swenson and Marder 2000). In the case of the isolated biolog-ical PD neuron in P. interruptus, however, proctolin has beenreported to show no noticeable effect (Hooper and Marder1987). Thus the presence of modulatory inputs in the PDneuron was modeled as a slight increase in the conductances ofthe 2 Ca2� currents (Johnson et al. 2003). Together with theleak current IL, the currents in the S/N compartments generatedlarge-amplitude (about 35 mV) slow oscillations with a fre-quency of about 1 Hz (Fig. 4B). In the absence of IKCa, themembrane potential remained in a depolarized steady state (notshown).
Figure 4C shows the results of coupling each of the S/Ncompartments with its respective A compartment, with axialconductances as shown in Table 2. In the model AB neuron,the electrical interaction between the excitable A compartmentand the intrinsically oscillatory S/N compartment producedintrinsic bursting activity (Fig. 4C, top panel). In contrast, inthe case of the PD model neuron (Fig. 4C, bottom panel), theelectrical interaction between the excitable A compartment andthe intrinsically oscillatory S/N compartment produced tonicspiking activity (see following text). The electrical synapsebetween the AB and the PD neurons was modeled by couplingthe 2 S/N compartments (gap-junctional conductances as inTable 2). This coupling caused the PD neuron to burst in-phasewith the AB neuron (Fig. 4D), as seen in the biological network.
THE ROLES OF AXIAL AND GAP-JUNCTIONAL CONDUCTANCES. Fig-ure 5, A and B show the isolated AB and isolated PD modelneurons, respectively, as the axial conductance between their 2compartments was increased from top to bottom. The graybackground shows the “reference” model with parameters as in
A
C
B
Biological Model
10 mV
5 mV Bio9 mV Mod
0.5 s
10mV
+
+
+
-
-
-
AB
PD
FIG. 1. Activity of the anterior burster (AB) and pyloric dilator (PD)neurons in response to current injection with intact modulatory inputs to thestomatogastric ganglion (STG). Gray background shows 0 current injection, �denotes positive current injection, and � denotes negative current injection. A:voltage traces of the biological (left) AB (red) and PD (blue) neurons showin-phase bursting oscillations that become faster with increasing currentinjection in the AB neuron. This behavior is mimicked by the model neurons(right). Iext in nA from top: Biological, 5, 3, 0.5, 0, �8, �8.5; Model, 5, 1.1,0.8, 0, �0.22, �0.3. Minimum Vm in mV from top: Biological AB, 36, �41,�49, �51, �85, �86; Biological PD, �41, �42, �45, �46, �53, �54;Model AB, �45.2, �47.5, �48, �53, �52.4, �51; Model PD, �46, �46.5,�48.1, �53, �52.4, �51. Model pacemaker has a frequency range of 0.22 to1.7 Hz. B: voltage traces of the synaptically isolated biological (left) and model(right) AB neurons show bursting oscillations that become faster and smallerin amplitude with injected current. Iext in nA from top: Biological, 33, 12, 6,0, �3, �5; Model: 8, 1.0, 0.3, 0, �0.19, �0.27. Minimum Vm of the ABneuron in mV from top: Biological, 27, �17, �36, �60, �66, �76; Model,�44.6, �51, �54.8, �58.4, �59.2, �52.75. Model AB neuron has a fre-quency range of 0.24 to 3.4 Hz. C: voltage traces from the isolated biological(left) and model (right) PD neurons show tonic spiking activity that increasesin frequency with current injection. Iext in nA from top: Biological, 15, 0, �1;Model: 12, 0, �0.3. Minimum Vm of the PD neuron in mV from top:Biological, �27, �50, �53; Model, �44, �46.5, �53. In the model, currentinjection runs were started at 0 nA with subsequent steps of 0.1 or 0.2 nA thatlasted 20 to 30 s �8 nA (in A), 1.5 nA (in B), or 12 nA (in C). Current was thenreset to 0 nA and subsequently decreased to �0.3 nA in steps of �0.01 nA or�0.02 nA.
594 C. SOTO-TREVINO, P. RABBAH, E. MARDER, AND F. NADIM
J Neurophysiol • VOL 94 • JULY 2005 • www.jn.org
on Decem
ber 13, 2009 jn.physiology.org
Dow
nloaded from
Tables 1 and 2. When the axial conductance between the S/Nand A compartments of the isolated AB neuron was weak, theactivity of the S/N compartment of this neuron was verysimilar to that of its isolated S/N compartment (Fig. 5A, toptrace). As the axial conductance was increased, both the spikeamplitude and the number of spikes per burst consistentlyincreased. In contrast, the AB neuron burst amplitude andperiod behaved nonmonotonically: they initially decreased andthen increased. Increasing the axial conductance value to 1.3�S served to merge the S/N and A compartments of the modelAB neuron and effectively turn it into a one-compartmentbursting neuron (Fig. 5A, bottom trace). Note that, in this case,the amplitude of the action potentials was considerably larger.(This increase occurred as a fairly sudden transition as the axialconductance was increased from 0.4 to 0.5 �S; not shown).Irrespective of the strength of the axial coupling, the ABneuron always remained an intrinsic burster, although as thecoupling was increased more than 0.4 �S the waveform of thebiological AB neuron was lost.
In contrast, as the axial conductance between the 2 compart-ments of the model isolated PD neuron was increased (Fig.5B), there was a range of coupling values (0.9 to 2.5 �S) forwhich it was not able to produce intrinsic bursting oscillations.For small coupling values, small to medium-size spikes rodeon top of the slow-wave oscillation of the S/N compartment.
As the axial conductance increased, the coupling current had ahyperpolarizing effect on the burst phase of the S/N compart-ment that eventually prevented the S/N compartment fromproducing slow oscillations. The S/N compartment, however,could still induce spiking in the A compartment and thus theneuron spiked tonically. Both irregular bursting and tonicspiking could be obtained for the same conductance strength,as is shown in the second and third traces of Fig. 5B. Furtherincreasing the axial conductance served to increase the spikefrequency (and amplitude) and to subsequently cause enoughcalcium ion accumulation to activate IKCa and thus restorebursting. For large axial coupling (in excess of 20 �S), themodel was effectively a single-compartment burster with over-shooting spikes (Fig. 5B, bottom trace).
Figure 5C shows the behavior of the model AB–PD pace-maker group as the strength of the electrical coupling betweenthe 2 neurons was increased from top to bottom by varying thegap-junctional conductance values. The gray backgroundshows the “reference” model with parameters as in Tables 1and 2. For very small coupling, the AB neuron producedirregular bursting and, although the PD neuron produced long,small-amplitude bursts, it was not able to fire in phase with theAB neuron (Fig. 5C, top panel). As the coupling strengthincreased, both model neurons produced regular bursts, but thePD neuron burst started slightly after and lasted longer than theAB neuron burst. In this case, the spikes of the 2 neuronsoccurred out of phase (Fig. 5C, second trace). Further increas-ing the coupling strength caused the slow-wave oscillation ofthe neurons to become better aligned, the number of spikes perburst to increase, and the spikes (although not completelysynchronized) to occur almost in phase (Fig. 5C, superimposed
Biological Model
AB
PD
5 mV
0.5 s
+
FIG. 2. Activity of the AB and PD neurons in response to current injectionin the AB neuron in the absence of modulatory input. Biological AB (red) andPD (blue) neurons are quiescent with no current injections (gray background;left traces). Positive DC current injection (�) in the biological AB neuronevokes in-phase bursting oscillations that become faster with increasingcurrent levels (left). This behavior is reproduced by the model neurons (right).Iext in nA from top: Biological, 10, 6, 1, 0; Model, 1, 0.6, 0.2, 0. Minimum Vm
in mV from top: Biological AB neuron, �12, �35, �66, �77; Biological PDneuron, �51, �52, �55, �56; Model AB neuron, �45.3, �45.8, �48.2,�49.7; Model PD neuron, �47.7, �47.7, �48.5, �49.8. In the model, currentinjection runs were started at 0 nA, with subsequent steps of 0.2 to �2 nA.Each run was 30 s.
FIG. 3. Membrane potential waveform of the AB neuron is changed byelectrical coupling to the PD neuron. A: intracellular recordings show thewaveforms of an AB neuron when electrically coupled (thin trace) to the PDneuron and when isolated (thick trace). On isolation, the average spikeamplitude increased and the average spike number per burst decreased.Minimum Vm (in mV): �61.3 for coupled and �62.9 for isolated AB neuron.B: a comparison of the waveforms in the model AB neuron when it is coupledto the PD neuron (thin trace) and when isolated (thick trace) shows that theisolated AB neuron waveform has a larger amplitude and shorter period, as inthe biological neuron. Spike number per burst also decreased. Minimum Vm (inmV): �53.5 for coupled and �58.4 for isolated AB neuron.
595MODEL OF ELECTRICALLY COUPLED PACEMAKER NEURONS
J Neurophysiol • VOL 94 • JULY 2005 • www.jn.org
on Decem
ber 13, 2009 jn.physiology.org
Dow
nloaded from

traces in middle panel). For the waveforms of the AB and PDneurons to be almost indistinguishable from each other, thecoupling strength needed to be further increased, as shown inthe bottom trace in Fig. 5C. Remarkably, for more than a50-fold range of gap-junctional conductance values (0.1–6 �S)the coupled AB–PD pacemaker group produced qualitatively
similar synchronous bursting oscillations. In the followingsubsection, we show that this need not be the case if the modelneurons involved are one-compartment neurons.
TWO-COMPARTMENT MODELS PROVIDE A MORE ROBUST BURSTING
MECHANISM FOR THE PACEMAKER NETWORK. Thus far, we haveused our 2-compartment per neuron model to show that it ispossible for an intrinsically bursting neuron to drive a tonicallyspiking neuron to oscillate in synchrony with it for a widerange of coupling strengths. We now address the question ofwhether it is possible to obtain similar results with one-compartment model neurons. To answer this question, we builtseveral AB–PD networks, and assayed the network oscillationsas the gap-junctional strength was varied (Fig. 6). We used 2distinct versions of the model AB and PD neurons. These wereeither the “reference” model neurons (AB and PD) or slightlymodified versions of these neurons (AB and PD). The S/Ncompartment of the PD neuron was intrinsically oscillatory, asin Fig. 4B, whereas that of PD lacked IKCa and thus PD had nointrinsic ability to oscillate (and was quiescent). The ABneuron had a smaller transient calcium current ICaT (gCaT 42�S) than that of the AB neuron, which decreased the slowoscillation amplitude. This reduction in gCaT was done so thatthe one-compartment (see following text) AB neuron wouldhave a slow-wave oscillation similar to that of the 2-compart-ment reference AB neuron.
We then addressed the significance of compartmentalizationby comparing the one- and 2-compartment model neurons. Theone-compartment neurons were obtained by increasing (�100-fold) the axial conductance between the A and S/N compart-ments, thus effectively collapsing the 2 compartments. (Theseare shown schematically in Fig. 6A with the whole regionbetween the 2 compartments shaded.) The networks weredivided into 4 cases (I–IV) and in each case, we compared thecoupling of the AB (or AB) neuron to either the PD or the PDneuron, resulting in a total of 8 networks (Fig. 6A). Thebehavior of the “reference” AB–PD network is highlighted inthe gray box in Fig. 6A. The case of the 2-compartment ABwas similar to Case I and it is not shown.
To measure the electrical “load” that the PD neuron placedon the AB neuron, the burst amplitudes of the coupled andisolated AB neurons (see Fig. 6A) were compared for thenetworks that produced synchronous bursting. When the net-work output was tonic, the ratio of the burst amplitudes was setto zero. The ratios as a function of the gap-junctional conduc-tance were plotted for Cases I–IV (Fig. 6, B and C). Theseratios were compared with the range (0.65–0.85) calculatedfrom the biological AB neuron as in the experiment shown inFig. 3A.
In Case I, we used the “reference” 2-compartment model ABneuron and coupled it to either a one-compartment model PD(Fig. 6A, left column) or model PD neuron (Fig. 6A, rightcolumn). In contrast to PD, PD was able to burst in synchronywith the AB neuron for all coupling strengths (Fig. 6A, Case I).However, the burst amplitude of the AB neuron increased asthe coupling strength was increased, irrespective of whether itwas coupled to PD or PD (Fig. 6A, Case I). When AB wascoupled to PD, the range of gap-junctional conductances forwhich the burst amplitude ratio remained within the biologicalrange (0.65–0.85) was approximately 1–2 �S (see Fig. 6A,Case I, left column, fourth panel from top, ggap � 1.6 �S,
FIG. 4. Compartmentalization of the model neurons. A: schematic repre-sentation of the distribution of intrinsic currents in the model neurons. Ioniccurrents responsible for action potential generation were placed in the “A”(axon) compartment. Ionic currents underlying the generation of slow oscilla-tions were placed in the S/N (soma-primary neurite) compartment. Presence ofanterior inputs was modeled with a voltage-gated inward current Iproc in themodel AB neuron, and with larger calcium currents ICaS and ICaT in the modelPD neuron. In B, C, and D, the top voltage traces correspond to the AB neuronand the bottom voltage traces to the PD neuron; the left traces show themembrane potential of the S/N compartments, whereas those on the right showthe A compartments. B: activity of each compartment is shown in isolation,with parameters as described in Table 2. Lowest voltage values are for the ABneuron: �63.5 mV (S/N), �60 mV (A); for the PD neuron: �73 mV (S/N),�57.5 mV (A). C: each S/N compartment shown in B is joined to thecorresponding A compartment, with axial conductances as in Table 2. Result-ing input resistances were 14.8 M� (AB) and 6.9 M� (PD). Lowest voltagevalues are for the AB neuron: �58.4 mV (S/N), �74 mV (A); for the PDneuron: �46.5 mV (S/N), �72.5 mV (A). D: 2 S/N compartments shown in Care electrically coupled to simulate a gap junction with maximal conductanceas in Table 2. Two model neurons now burst in-phase. Lowest voltage valuesare for the AB neuron: �53.5 mV (S/N), �74 mV (A); for the PD neuron:�53.5 mV (S/N), �73 mV (A).
596 C. SOTO-TREVINO, P. RABBAH, E. MARDER, AND F. NADIM
J Neurophysiol • VOL 94 • JULY 2005 • www.jn.org
on Decem
ber 13, 2009 jn.physiology.org
Dow
nloaded from

and Fig. 6B, orange circles). For large coupling conductances(ggap �2 �S), this AB–PD network output was very similar tothat of the 2-compartment AB neuron with large axial coupling(compare Fig. 6A, Case I, left column, bottom panel to Fig. 5A,bottom panel). When the AB neuron was coupled to the PDneuron (Fig. 6A, Case I, right column), the network behaviorprogressed from tonic spiking for small to moderate couplingconductances to large-amplitude bursting for large couplingconductances (ggap �2 �S; Fig. 6A, Case I, right panel andFig. 6C, orange circles).
In Case II, we replaced the 2-compartment AB neuron withthe one-compartment AB neuron that had similar slow-wave
amplitude of oscillations (compare the top voltage traces inFig. 6A, Cases I and II). When the model AB neuron wascoupled to the one-compartment model PD neuron, this net-work was able to produce bursting oscillations for only mod-erate to large coupling strengths (Fig. 6A, Case II, left column).However, the burst amplitude ratios of the coupled to theuncoupled AB neuron calculated as the gap-junctional conduc-tance was increased did not fall within the biological range(Fig. 6B, green triangles), suggesting that the burst amplitudesof AB were either too small or too large. Coupling the ABneuron to the one-compartment PD neuron produced only tonicspiking behavior for all but large coupling strengths, in whichcase the burst amplitude of AB was again too large (Fig. 6C,green triangles).
In Case III, the burst amplitude of the one-compartmentmodel AB neuron was considerably larger (84%) than that ofthe “reference” AB neuron. Even with this larger-amplitudeoscillation in the model AB neuron, however, when it wascoupled to the one-compartment model PD (Fig. 6B, blueinverted triangles) or PD (Fig. 6C, blue inverted triangles)neuron, the range of gap-junctional conductances for which theburst amplitude ratio of the AB neuron was adequate was verysmall. As in Cases I and II, with large coupling strengths, thenetwork behavior was very similar to that of the 2-compart-ment AB neuron with a large axial conductance (compare thebottom panel of Fig. 5A to the bottom panels of the first 6columns in Fig. 6A). From these results, we suggest that aone-compartment model PD (and PD) neuron behaves as anadditional “axon” on the AB oscillator.
In contrast, as shown in Case IV, the 2-compartment perneuron networks were able to function like the biologicalpacemaker for a wider range of coupling strengths (Fig. 6A).The burst amplitude ratio of the coupled to the uncoupledmodel AB neuron remained in the biological range for amuch wider range of gap-junctional conductances than inany of the previous cases (see Fig. 6, B and C, black squares).However, similar to Cases I–III, large coupling strengths in-creased the burst amplitude of the AB neuron to values thatwere beyond the biological range. The burst durations in Case IVremained stable for all coupling strengths (21–38 ms) as opposedto the networks with one-compartment neurons, in which the burstdurations shortened for large coupling strengths (10–15 ms). A
A
B
C
0.1
0.2
0.3
0.4
1.3
0.4
0.8
1.05
2.5
3.0
5.0
20.0
0.05
0.1
0.75
3.0
6.0
500 ms
500 ms 500 ms
20 mV
20 mV 10 mV
AB
AB
PD
PD
FIG. 5. Effects of varying the axial and gap-junctional conductances. Grayboxes show the activity of the “reference” model. A: behavior of the S/Ncompartment of the isolated model AB neuron as the axial coupling betweenthe S/N and A compartments is increased. Values (in �S) shown to the rightare the maximal conductance of the axial current. Most hyperpolarized volt-ages in each trace are, from top (in mV): �61, �58.5, �58.4, �59.5, and �69.B: behavior of the S/N compartment of the isolated model PD neuron as theaxial coupling between the S/N and A compartments is increased. Values (in�S) shown to the right are the maximal conductance of the axial current; notethat there is bistability at 0.8 �S. There was no change in the behavior of theneurons when couplings larger than those shown were used. Most hyperpo-larized voltages are (from top to bottom in mV): �71, �67.8, �46, �46.5,�48.5, �52, �55, and �64. C: behavior of the pacemaker AB–PD network asthe gap-junctional conductance is increased. Red traces correspond to the ABneuron, the blue traces to the PD neuron. Traces are superimposed on the rightto allow a direct comparison of the waveforms. Values (in �S) shown to theright are the gap junction conductances. Most hyperpolarized voltages are(from top to bottom in mV): �52.6, �54.7, �53.5, �57, and �58. In all cases,the simulations were started from the “reference” AB–PD model (Table 2),and the conductance of interest was changed in increments or decrementsof 0.05 �S, with each run using as initial conditions the last point of theprevious run.
597MODEL OF ELECTRICALLY COUPLED PACEMAKER NEURONS
J Neurophysiol • VOL 94 • JULY 2005 • www.jn.org
on Decem
ber 13, 2009 jn.physiology.org
Dow
nloaded from

similar shortening of the burst duration occurred in the isolatedmodel AB neuron when the axial coupling between its 2 com-partments was large (see Fig. 5A, bottom trace). This is consistentwith our earlier suggestion, based on burst amplitudes, that theone-compartment model PD (and PD) neuron behaves as anadditional “axon” on the AB oscillator.
Functional consequences of electrically coupling twoidentical and two distinct neurons
So far we showed that compartmentalization provides areliable mechanism for the model neurons to produce in-phasebursts when they are electrically coupled. We then proceededto examine the functional consequences of coupling identical
iso
late
dg
ap
jun
ctio
nstr
en
gth
500 ms20 mV
ABAB
PDPD
ABAB
PDPD
ABAB
PDPD
AB
PD
AB
PD
III IVIII
A
B C
IIIIIIIV
0.1 1 10 100
Biological Range
PD
0.1 1 10 100
0.0
0.5
1.0
1.5
2.0 PD
Biological Range
AB
bu
rst
am
plit
ud
e r
atio
(co
up
led
/iso
late
d)
Gap-junction conductance (µS) Gap-junction conductance (µS)
FIG. 6. Comparison of the behavior of different AB–PD networks constructed from one- and 2-compartment model neurons. A: each column shows examplesof outputs from a given network as the maximal conductance of the gap junction is increased from top to bottom. Red voltage traces correspond to the modelAB neuron and blue traces to the model PD neuron. Diagram on top of each column describes the type of model neuron used. Two-compartment models areshown with a thin line connecting the S/N and A compartments; one-compartment model neurons are shown with whole region between the 2 compartmentsshaded. Each of the 2 columns in Cases I–IV is built with the same AB neuron but 2 different PD neurons. Gray box shows the activity of the “reference” AB–PDnetwork. Isolated neurons differ from the maximal conductances shown in Table 2 as follows. Case I AB: no difference; Case II AB gCaT 42 �S and gaxial 100 �S; Case III AB: gaxial 100 �S; Case IV AB: no difference. Cases I, II, and III model PD neurons: gNa 2500 �S in the A compartment and gaxial 100 �S. Cases I, II, and III model PD neurons: gNa 2500 �S in the A compartment, gKCa 0 and gaxial 500 �S. Case IV PD: no difference; Case IV PD:gKCa 0. Values for the gap-junctional conductances are (from top in �S): Case I AB–PD: 0, 0.4, 1.0, 1.6, 100. Case I AB–PD: 0, 0.1, 1.6, 2, 100. Case IIAB–PD: 0, 0.2, 0.75, 3, 100. Case II AB–PD: 0, 0.2, 1.5, 3, 100. Case III AB–PD: 0.4, 1.2, 2,100. Case III AB–PD: 0, 0.2, 0.8, 1.5, 100. Case IV: 0, 0.1, 0.75,3, 100. Most hyperpolarized voltage values for the traces are (from top in mV). Case I AB–PD, AB: �58.2, �51, �52, �53, �69; PD: �71.2, �71, �70, �68,�69. Case I AB–PD, AB: �58.2, �50.2, �54.5, �68, �62.7, �68; PD: �73, �73, �70, �73.2, �68. Case II AB–PD, AB: �58.4, �45.8, �49.4, �63.6,�69; PD: �71.2, �71.2, �70, �71.5, �69. Case II AB–PD, AB: �58.4, �46.4, �51.6, �63.2, �69; PD: �72, �71.8, �69, �71, �69. Case III AB–PD,AB: �68, �51.6, �53.5, �65.2, �68.8; PD: �71.2, �71, �69.4, �72, �68.8. Case III AB–PD, AB: �68, �58.2, �49.2, �65.5, �68.8; PD: �72, �71.5,�70, �71.2, � 68.8. Case IV AB–PD, AB: �58.2, �54.5, �52.9, �53.7, �59.9; PD: �71.2, �51.2, �53, �56.7, �59.9. Case IV AB–PD, AB: �58.2, �49.8,�51.5, �55.8, �59.5; PD: �72, �47, �51.6, �55.8, �59.5. B and C: ratio of the AB neuron burst amplitude when coupled to the PD neuron to the burst amplitudeof the isolated AB neuron shown as a function of the maximal gap-junctional conductance. A zero ratio corresponds to a coupled AB neuron that produces tonic spikesinstead of bursting oscillations. B: plots of the burst amplitude ratios are shown for both the AB–PD network (B) and the AB–PD network (C) in Cases I–IV.
598 C. SOTO-TREVINO, P. RABBAH, E. MARDER, AND F. NADIM
J Neurophysiol • VOL 94 • JULY 2005 • www.jn.org
on Decem
ber 13, 2009 jn.physiology.org
Dow
nloaded from

or different neurons on bursting oscillations. We did this bycomparing a model AB–AB network to the reference modelAB–PD network and to the isolated AB neuron. We assayeddifferences among these models by measuring the range ofoscillation periods each model produced in response to DCcurrent injection (Fig. 7). For each value of the gap-junctionalconductance, increasingly larger amounts of hyper- or depo-larizing DC current were injected in the S/N compartment ofone of the coupled neurons until the network became silent orproduced irregular bursts or tonic activity.
The 2 limits of the oscillation period range produced by theAB–AB network when DC current was applied to one AB
neuron are plotted in Fig. 7A. In the absence of currentinjection (dashed line) for all coupling strengths the burstingoscillation produced by each of the coupled AB neurons wasindistinguishable from each other and from those of the iso-lated model AB neuron. However, the asymmetry introducedby injecting DC current into one of the 2 identical AB neuronswhen they were weakly coupled did not allow them to com-pletely synchronize but instead caused them to become phase-locked, as shown in the inset of Fig. 7A (ggap 0.1 �S). TheAB neuron that received the hyperpolarizing DC input (Fig.7A, inset, lighter red trace) burst after its coupled twin neuron.Note that when the 2 identical AB neurons are completely inphase, Igap 0 (not shown). In contrast, the slightly out ofphase oscillation of the coupled AB neurons results in anonzero Igap, thus producing a load on the oscillation of eachneuron. As a result, for weak coupling strengths (ggap �0.3�S), the period range of the AB–AB network was actuallysmaller than that of the isolated AB neuron (period range ofisolated AB marked with gray area). As the gap-junctionalconductance was increased, however, the period range of theAB–AB network approached that of the isolated AB neuronuntil they became identical for ggap �15 �S (not shown). Forall coupling strengths shown, the hyperpolarizing DC currentinjection that caused the coupled AB neuron to become qui-escent was 100% more than the current for the isolated ABneuron. In contrast, the minimum depolarizing DC current thatcaused the coupled AB neuron to produce tonic spiking,compared with the current for the isolated AB neuron, in-creased from 31% (at ggap 0.1 �S) to 315% (at ggap 3 �S)as the gap-junctional conductance was increased.
Figure 7B shows that with small to moderate gap-junctionalconductances, the AB–PD network could oscillate with longerperiods (�18%) than the isolated AB neuron. The inset in Fig.7B shows simultaneous voltage traces of weakly coupled(ggap 0.1 �S) model AB and PD neurons when the ABneuron was hyperpolarized (note that the 2 neurons are more inphase here than those shown in the other 2 insets of Fig. 7). Forlarger coupling strength (ggap 3 �S), the longest period that
0
1
2
3
4
5
Period
(s)
Gap-junction conductance (µS)
A
B
C
AB
AB
AB
PD
AB
PD
0
1
2
3
4
5
Period
(s)
0
1
2
3
4
5
Period
(s)
FIG. 7. Oscillation period range of a model AB–AB network and the modelAB–PD network as a function of the gap-junctional strength (in �S). Burstperiod range was obtained by DC current injection in the AB neuron (A, B) orthe PD neuron (C), as depicted in the inset schematic network diagrams.Dashed curve represents no current injection; the top curve corresponds to thelongest possible period that the network produced with hyperpolarizing currentinjection before becoming quiescent; the bottom curve represents the shortestperiod that the network produced with depolarizing current injection before thebursts became irregular or changed to tonic spiking. Gray area shows the burstperiod range of the isolated AB neuron. White insets show 2 s long voltagetraces of the coupled neurons for a coupling conductance of 0.1 �S and thelargest hyperpolarizing current injection. Voltage in the insets is from �60 to�30 mV. A: an AB–AB model network cannot oscillate with periods longerthan those of an isolated AB model neuron. For small coupling conductances(�0.3 �S) its period range was smaller than that of the isolated AB neuron.Inset: 2 phase-locked AB neurons when hyperpolarizing current (I �0.41nA) was applied to one of them (lighter trace). B: when current is injected intothe model AB neuron, for small to moderate coupling conductance the AB–PDnetwork can produce slower (but not faster) oscillations than the isolated ABneuron. Inset: phase-locked bursting with the PD neuron bursting slightlyearlier, as hyperpolarizing current (I �0.23 nA) was injected into the ABneuron. C: when current is injected into the model PD neuron, the AB–PDnetwork period range of oscillations is smaller than that of the isolated AB.Inset: phase-locked bursting, with the AB neuron bursting slightly earlier, ashyperpolarizing current (I �0.27nA) was injected into the PD neuron. Mosthyperpolarized voltages in the insets are (in mV): �56.5 (A), �48.2 (B), and�52.2 (C).
599MODEL OF ELECTRICALLY COUPLED PACEMAKER NEURONS
J Neurophysiol • VOL 94 • JULY 2005 • www.jn.org
on Decem
ber 13, 2009 jn.physiology.org
Dow
nloaded from

the coupled AB–PD network produced was 26% smaller thanthat produced by the isolated AB neuron (Fig. 7B) and de-creased �46% for even larger coupling (ggap 100 �S; notshown). For the range of coupling strengths shown in Fig. 7B,the hyperpolarizing DC current necessary to silence the cou-pled AB–PD network was 15% more than the current for theisolated AB neuron, whereas the depolarizing DC currentnecessary for transition to tonic spiking was never more than50% of the current for the isolated AB neuron. Taken together,these results suggest that, for moderate coupling strengths, thepresence of the PD neuron broadens the period range of theAB–PD network to encompass larger periods (�5 s) as DCcurrent is injected into the AB neuron, whereas it continues tobuffer the activity of the AB neuron from hyperpolarizing inputs.
When DC current was injected into the PD neuron, theperiod range of the AB–PD network was smaller than that ofthe isolated AB neuron for all coupling strengths (Fig. 7C). Theinset of Fig. 7C (ggap 0.1 �S) illustrates that for smallcoupling strengths, the injection of hyperpolarizing current intothe model PD neuron was more effective in disrupting syn-chronous bursting of the AB–PD network (the AB neuron firedslightly earlier than the PD neuron) than current injection intothe model AB neuron (compare with inset of Fig. 7B). Forsmall to moderate coupling strengths, hyperpolarizing currentinjection into the PD neuron prevented the network fromoscillating as slowly as it would if current were injected intoAB. As the gap-junctional conductance was increased (Fig. 7,B and C), the difference in oscillation range as a consequenceof current injection into either the AB or PD neuron slowly
diminished, and eventually the oscillation ranges became iden-tical (ggap 100 �S, not shown). For the range of gap-junctional conductances shown in Fig. 7C, the amount ofhyperpolarizing DC current (injected in the PD neuron) thatcaused the AB–PD network to become silent was 15 to 35%more than the current for the isolated AB neuron. Thus, similarto the case shown in Fig. 7B, the presence of the model PDneuron buffered the AB–PD network from hyperpolarizinginputs. However, in this case, the model AB–PD network wasable to tolerate only 10 to 24% of the amount of depolarizingcurrent that the isolated AB neuron would before transitioningto tonic spiking. These values should be contrasted with themuch larger depolarizing current necessary to eliminate burst-ing in the AB–AB network (Fig. 7A), despite the fact that thePD neuron had a lower input resistance than that of the ABneuron (14.8 M� for AB and 6.9 M� for PD; see also legendof Fig. 4).
The role of ionic currents in the model and the actionof neuromodulators
The biological AB and PD neurons are differentially mod-ulated by a variety of different amines and neuropeptides(Ayali and Harris-Warrick 1999; Flamm and Harris-Warrick1986; Hooper and Marder 1987; Marder and Eisen 1984a). Toprovide some insight into the function of differential modula-tion of 2 electrically coupled but distinct neurons, we examinedthe time course of activity of the inward (Fig. 8, top panels)and outward (Fig. 8, bottom panels) currents when descending
200 ms
5 nA
0.5 nA
15 nA 100 nA
50 nA
1.5 nA
Iproc
ICaT
ICaS
INaP
Ih
IKd
IK(Ca)
IA
Ileak
0.5 nA
100 ms
0.2 nA
100 ms
0.2 nA
200 ms
0.5 nA
200 ms
5 nA
200 ms
5 nA
200 ms
A B DCABAB PDPD
FIG. 8. Currents that participate in the approximately 1-Hz oscillations in the isolated S/N compartments, and their behavior in the isolated model neuron.For each model neuron, the leftmost column shows the currents for its isolated S/N compartment, and the rightmost column shows the same currents when theS/N and A compartments are connected. Boxes in the first 3 columns display the currents at a different scale for 600-ms duration, after the first 100 ms of activity.Boxes in the fourth column display enlargements of the full 1,100 ms of activity. Parameters are as in Table 2.
600 C. SOTO-TREVINO, P. RABBAH, E. MARDER, AND F. NADIM
J Neurophysiol • VOL 94 • JULY 2005 • www.jn.org
on Decem
ber 13, 2009 jn.physiology.org
Dow
nloaded from

neuromodulatory inputs were present. Variations of the leakcurrent IL (plotted separately in the middle panels of Fig. 8)allow for a comparison of the time course of the membranepotential in all cases because the membrane potential is linearlyrelated to IL (Vm EL � IL/gL).
The membrane potential oscillation in the S/N compartmentof the model AB neuron was obtained by a balance between theinward and outward currents (Fig. 8A). During the slow initialrise of the membrane potential, the inward currents barelydominated the outward currents until Iproc and ICaS stronglyactivated to produce a more rapid rise of the membranepotential. This rise was followed by a rapid increase in theoutward current IKd with smaller contributions from IA andIKCa. In the most depolarized phase, the outward and inwardcurrents were in balance. At this time, the calcium-activatedoutward current IKCa increased, first gradually and then rapidly,to produce a decrease in the membrane potential of the neuron,and the cycle repeated. In the absence of IKCa, the membranepotential remained in a depolarized steady state (not shown).For the generation of this large slow-wave voltage oscillation,INaP, Ih, and IA were not necessary: the slow wave was stillproduced in their absence (not shown). The oscillation periodof about 1 s was set mainly by the activation and inactivationtime constants of the transient calcium current ICaT and wasmodulated by the maximal conductances of the leak current ILand the outward currents IKd and IKCa. To obtain oscillationswith a frequency around 1 Hz, we had to modify someparameters of the currents described in Turrigiano et al. (1995);the main changes were in the transient calcium current ICaT(activation and inactivation midpoints and their time constants)and in the calcium-dependent potassium current IKCa (activa-tion midpoint).
When the S/N compartment of the AB neuron was coupledto the A compartment (Fig. 8B), an initial slow rise of themembrane potential that was similar to the uncoupled caseoccurred until the membrane potential was large enough for theaxial current to induce the generation of action potentials in theaxon. Thus began the active or spiking phase, which subse-quently ended by the activation of IKCa. An increase of 33% inthe maximal conductance of IKCa decreased both the number ofspikes per burst (by 1) and the burst duration, whereas adecrease of 50% in the maximal conductance produced alonger burst duration with one extra spike per burst (notshown). The way in which the transition from bursting to tonicspiking took place as constant depolarizing current was in-jected into the S/N compartment of the AB neuron dependedon the amount of IKCa. Increasing gKCa shortened the burstduration (with no applied current) and maintained burstingwith larger amounts of current injection. With smaller gKCa,depolarizing current injection produced a transition to the tonicspiking regime more easily. This was a smooth transitionwhere no irregular bursting or spiking was seen (not shown).Similar transitions from bursting to tonic spiking withoutintermediate irregular bursting or spiking have been observedin other studies (Shilnikov and Cymbalyuk 2005).
Recall that the neuromodulatory actions on the AB neuronwere modeled by adding the ionic current Iproc. When gproc inthe model was set to 0 to mimic the removal of neuromodu-latory actions on the AB neuron, the large-voltage oscillationin the S/N compartment of the AB neuron was lost (notshown). In this case, a small-voltage oscillation could be
obtained by injecting a small constant depolarizing current.This small oscillation was sufficient to trigger a single spikeper cycle and the model neuron produced small-amplitudebursts, with only one spike per burst. The amplitude of theoscillation and the number of spikes per burst could be in-creased by increasing gCaT (not shown).
The currents involved in the generation of the large-ampli-tude voltage oscillation of the S/N compartment of the isolatedPD neuron are shown in Fig. 8. There were several differencesbetween these oscillations and those of the S/N compartment ofthe model AB neuron. First, in the S/N compartment of the PDneuron, the persistent calcium current ICaS was more prominentthan the transient ICaT. Second, the calcium-dependent potas-sium current IKCa was smaller. Third, the large oscillation as asingle stable state depended on the presence of the hyperpo-larization-activated current Ih: in its absence there was bistabil-ity between a quiescent state and the large oscillation. Theoscillation still persisted, however, in the absence of INaP andIA. Figure 8D shows the role of the intrinsic currents in the S/Ncompartment of the PD neuron when it is coupled to its Acompartment. In this case Ih provided enough backgrounddepolarization to allow the A compartment to fire continu-ously. In turn the axial current from the A compartment to theS/N compartment had a hyperpolarizing effect that prevented itfrom continuing to produce large-amplitude oscillations andthus the 2-compartment neuron spiked tonically. Note that theleak current was now entirely outward because the spikingoccurred above the leak reversal potential (�60 mV), and thatIKCa played a very small role. In this case the smaller ICaT toICaS ratio and smaller IKCa (compared with the model ABneuron S/N compartment) were essential to produce the correctoutput for the isolated PD neuron. If either gCaT was increasedby more than 15% or gKCa was increased by 80% the 2-com-partment PD neuron became an intrinsic burster (not shown).However, if both gCaT and gCaS were increased by 20%, the2-compartment coupled PD neuron remained tonically spiking.An increase of more than 50% of gNaP could also turn thisspiking neuron into a bursting one, whereas an increase ofmore than 50% in gA caused it to become quiescent (not shown).
We modeled the removal of the neuromodulatory inputsonto the PD neuron by a slight decrease in the maximalconductance of the calcium currents. The persistent current(gCaS) was decreased by 10%, which served to decrease thespiking frequency by removing some of the background depo-larization provided by this current (see Fig. 8D, top panel). Thetransient current (gCaT) was decreased by 66.6%. This changehad the effect of turning the PD neuron into a quiescent cellthat spiked tonically with a small depolarizing current injection(not shown). The roles of the intrinsic currents in this case werevery similar to those shown in Fig. 8D and thus are not shown.It is interesting to note that the PD model neuron could be builtand tuned (by changing gCaT to 20.5 �S and gproc to 35 �Sfrom those shown in Table 2) to have a neuromodulatorycurrent Iproc, as in the AB neuron, and yet produce activitysimilar to that of the model PD neuron described above (notshown). In this case, the removal of Iproc from the PD neuronwould have effects that are similar to those obtained bydecreasing the calcium currents (data not shown).
Figure 9 shows the currents in the S/N compartments of themodel AB and PD neurons when these 2 compartments wereelectrically coupled, mimicking the gap junction in the biolog-
601MODEL OF ELECTRICALLY COUPLED PACEMAKER NEURONS
J Neurophysiol • VOL 94 • JULY 2005 • www.jn.org
on Decem
ber 13, 2009 jn.physiology.org
Dow
nloaded from

ical network. The electrical coupling current allowed the PDneuron to produce slow, bursting oscillations in phase with theAB neuron. In turn, the coupling current into the S/N compart-ment of the AB neuron affected the waveform of the ABneuron by diminishing its burst amplitude, lengthening boththe burst and the silent phases and thereby increasing its period(see also Fig. 3B). The gap-junctional current in the AB neuron(Fig. 9, left column, third trace from top) was mostly hyper-polarizing during the silent phase and also (at least on average)during the initial part of the burst. This was consistent with thedecrease in amplitude of the AB neuron burst, as well as thelengthening of the silent phase. The lengthening of the ABneuron burst phase was mainly attributed to the depolarizingeffect from the gap-junctional current later in the burst. Theroles of the intrinsic currents of the coupled AB neuron (Fig. 9,left column) are very similar to those of the isolated AB neuron(Fig. 8B). The most noticeable difference between the intrinsiccurrents of the coupled PD neuron (Fig. 9, right column) andthose of its isolated S/N compartment (Fig. 8C) was that theleak current IL in the case of the coupled PD is completelyhyperpolarizing because the S/N compartment oscillation wasabove its leak reversal potential. This difference, however, wasnot significant because, by decreasing the maximal conduc-
tance of the leak current by 31%, the membrane potentialoscillation in the coupled PD neuron also hyperpolarized belowits leak reversal potential (not shown). In both the isolated S/Ncompartment of the model PD and the coupled PD neurons, anincrease of 24% in the maximal conductance of the leak currentIL had the effect of increasing the oscillation period; theincrease was 27% in the isolated S/N compartment of the PDneuron and 42% in the coupled PD neuron (not shown). Theamplitude of the oscillation, however, was basically not af-fected by a 24% increase in the maximal conductance of IL inthe case of the isolated S/N compartment of the PD neuron,whereas it did decrease in the case of the coupled PD neuronby 2 mV (not shown).
D I S C U S S I O N
The common intuition on the role of gap junctions is thatthey synchronize the activity of similar neurons. Several mod-eling and analytical studies have addressed the role that elec-trical coupling plays in neuronal systems and these studiesindicate a more complex role. For example, in networks ofidentical integrate-and-fire spiking neurons, different activitypatterns of the network such as synchronous, asynchronous,and phase-locked modes depend on the spike shape, amplitude,and frequency as well as the strength of the coupling betweenthe neurons (Chow and Kopell 2000). Electrical coupling canextend the parameter range over which initially uncoupledmodel neurons were able to burst (Komendantov et al. 2004;Sherman and Rinzel 1992). When heterogeneity is introducedin diffusely coupled bursting neurons synchronous behaviorcan be destabilized (De Vries et al. 1998). However, the rightcombination of heterogeneous conductances with appropriatecoupling strengths in electrically coupled nonoscillator modelneurons can produce synchronous oscillatory behavior (Manoret al. 1997).
Chains of strongly diffusively coupled oscillators, each witha distinct intrinsic frequency, can display very long transientsbefore reaching a stationary periodic state in which the fre-quency is the mean of the individual oscillator frequencies(Medvedev et al. 2003; Wilson and Callaway 2000). Combi-nations of electrical coupling and chemical synapses couldproduce yet more complexity in the network output. In anetwork of electrically coupled neurons that reciprocally in-hibit each other, the generation and stabilization of burstingbehavior was attributed to the electrical coupling between them(Skinner et al. 1999).
In this study we set out to explore the consequences ofelectrical coupling between 2 intrinsically distinct neurons. Inparticular, we focused on electrical coupling between a burst-ing neuron to a larger, tonic spiking neuron inspired by thepacemaker network of the lobster pyloric central pattern gen-erator. We developed a 2-compartment per neuron network ofthe pacemaker and used the model to illustrate a variety ofneuron and network behaviors arising from electrically cou-pling very different oscillators.
The AB–PD model and the biological AB–PD pacemaker
We have built a model of the lobster pyloric pacemakernetwork, consisting of the strongly electrically coupled AB andPD neurons, in which the 2 neurons are modeled as separate
200 ms0.5 nA
5 nA
5 nA
2 nA
0.1 nA
100 ms
Iproc
ICaT
ICaS
INaP
Ih
IKd
IK(Ca)
IA
Ileak
Igap
0.1 nA
100 ms
AB PD
FIG. 9. Currents in the S/N compartments of the AB–PD pacemaker modelnetwork in the presence of modulatory inputs. Boxes show enlargements of600 ms of activity.
602 C. SOTO-TREVINO, P. RABBAH, E. MARDER, AND F. NADIM
J Neurophysiol • VOL 94 • JULY 2005 • www.jn.org
on Decem
ber 13, 2009 jn.physiology.org
Dow
nloaded from

cells, taking into account their distinct intrinsic dynamics. Ourmodel captures the qualitative dynamic behavior of the actualnetwork: 1) It has a wide frequency range; 2) the burstamplitude decreases with increasing frequency; 3) as the fre-quency increases, the number of spikes per burst decrease; 4)there is a transition to tonic spiking in which irregular smallbursting and irregular spiking occurs; and 5) with sufficientlyhigh depolarizing current the network produces tonic spiking.Although the evolution from bursting to tonic spiking is qual-itatively similar to that of the biological network, our modelshows higher sensitivity to hyperpolarizing than to depolariz-ing current injection compared with the biological neurons.This difference is probably attributable to the specific voltagedependency properties of the currents we used. Our model doesnot include low-threshold regenerative inward currents becauseno such current has yet been characterized in the biological ABand PD neurons. The calcium currents have half-maximumpotential values at somewhat depolarized values, whereas thecalcium-dependent potassium currents are activated at fairlyhyperpolarized values. As more measurements of ionic cur-rents from the biological AB and PD neurons become avail-able, the model can be refined to reflect better the intrinsicproperties of these pacemaker neurons.
Both neurons were modeled using the same intrinsic cur-rents. The only major differences were the time constants forthe inactivation of ICaT and the steady-state activation slope ofthe calcium-dependent potassium current IKCa (see Table 1).These differences acted to prevent the model PD neuron frombursting in isolation by having a slower inactivation of ICaT anda less-abrupt activation of IKCa. Whether the biological AB andPD neurons express all of the same currents is not known. It isquite possible, however, that these 2 neurons express differentratios of calcium channel types (Johnson et al. 2003) and ourmodeling results would predict this. In our model, it wasnecessary that the AB and PD neurons have different ICaT toICaS conductance ratios, with more of the noninactivating ICaSin the PD neuron.
The AB–PD modeling strategy
In each model neuron, action-potential generation was seg-regated from other intrinsic currents. In the case of the intrin-sically bursting AB neuron, the separation of currents allowedthe model neuron to burst intrinsically for basically all axialcoupling strengths. As the axial coupling strength between its2 compartments was varied the oscillation frequency firstincreased and then decreased. This is in agreement with one ofthe 2 behaviors described in Kepler et al. (1990), in which theeffect of electrically coupling a hyperpolarized, passive cell toan intrinsic, relaxation oscillator are described. The behavior ofthe model PD neuron was a bit more complicated but also moreinteresting: its compartments exhibited bursting behavior forboth small and large axial conductances, but for an intermedi-ate range of conductance values exhibited tonic spiking behav-ior or bistability between bursting and tonic spiking. Thusdepending on the strength of the axial coupling, the intrinsicdynamics of one compartment dominated the behavior at theneuron level. Although the actual mathematical mechanism forthese behavioral transitions still needs to be analyzed, theoverall nonmonotonic behavior of the bursting frequency inthese 2 compartments (first decreasing and then increasing as
the axial coupling strength increased) is similar to some ofthose described in Kopell et al. (1998) for the effect of electricallycoupling a bistable element to a relaxation oscillator.
At the network level, we have illustrated that both a one- anda 2-compartment intrinsic bursting neuron, when very stronglyelectrically coupled to a tonic spiking neuron, can drive thespiking neuron to burst synchronously with it. However, thiswas not necessarily the case when the coupling was small tomoderate. Instead, the spiking neuron was able to dominate thenetwork dynamics and prevent the oscillator from burstingwhen one-compartment model neurons were used. Segregatingthe currents responsible for action-potential generation fromother intrinsic currents allowed the electrical coupling to pro-vide a very robust mechanism for producing synchronousbursting oscillations: the range of coupling strengths for whichsynchronous bursting was possible widened considerably toinclude small to intermediate coupling strengths. This couldpotentially have significant consequences for electrically cou-pled networks of nonelectrotonically compact neurons in thatthe spatial structure and the location of the gap junctions maydetermine their ability to synchronize (Lewis and Rinzel 2004;Saraga and Skinner 2004).
Asymmetric perturbations in networks of electricallycoupled neurons
The synaptic and modulatory inputs received by electricallycoupled neurons are often asymmetrical and this asymmetrymay have functional consequences for the network behavior(Blatow et al. 2003; Galarreta and Hestrin 1999; Gibson et al.1999; Johnson et al. 1994; Landisman et al. 2002; Marder andEisen 1984a). We showed that the period range of oscillationsof 2 identical, electrically coupled bursting neurons receivingasymmetric inputs, if the coupling is weak to moderate, can besmaller than that of the isolated neurons. On the other hand, thedynamic range of inputs to an isolated, bursting neuron may beexpanded when it is electrically coupled to a distinct neuron.Our results suggest that in the coupled network, the AB and PDneurons may play distinct roles in the regulation of longercycle periods, whereas their role is similar for shorter cycleperiods: the coupled network cannot produce bursting oscilla-tions with periods as short as those of the isolated AB neuron.These results also suggest that the presence of the PD neuronmay simultaneously buffer the AB neuron oscillation fromhyperpolarizing inputs while making the AB–PD networkmore sensitive to depolarizing inputs.
An experimental example of asymmetric effects of synapticinputs to a network occurs in the biological AB–PD pace-maker. High-frequency stimulation of the inferior ventricularnerve (ivn), which synaptically affects these electrically cou-pled neurons, results in an increase in the AB–PD networkburst amplitude and frequency. Stimulation of ivn producesasymmetrical responses from each neuron in isolation: theburst frequency of the AB neuron decreases and the PD neuronundergoes a long, slow depolarization (Marder and Eisen1984a; Miller and Selverston 1982). It is this long depolariza-tion on the PD neuron that is thought to be responsible for thenetwork response. The effect of ivn stimulation on the PDneuron, characterized in Sigvardt and Mulloney (1982), con-sists of a fast excitation, a slower inhibition followed by along-lasting depolarization. The total synaptic current could be
603MODEL OF ELECTRICALLY COUPLED PACEMAKER NEURONS
J Neurophysiol • VOL 94 • JULY 2005 • www.jn.org
on Decem
ber 13, 2009 jn.physiology.org
Dow
nloaded from

seen as an additional current contributing to the axial currentfrom the A compartment into the S/N compartment of the PD.This contribution would amount to an effective change in themaximal conductance of the axial current, and we have seenthat such a change, if sufficiently large in either direction, canturn the model tonic spiking PD neuron into a bursting neuron.
The examples presented throughout this work help illustratethat neuromodulation that acts at any of the different networklevels, whether it is by modifying intrinsic properties, couplingconductances, and/or synaptic inputs, could change the effec-tive compartmental structure of the network, and thus signifi-cantly modify the network behavior.
G R A N T S
This work was supported by National Institute of Mental Health GrantMH-60605 to F. Nadim. C. Soto-Trevino was supported by National ScienceFoundation Grant IBN0090250.
R E F E R E N C E S
Abbott LF, Marder E, and Hooper SL. Oscillating networks: control of burstduration by electrically coupled neurons. Neural Comput 3: 487–497, 1991.
Ayali A and Harris-Warrick RM. Monoamine control of the pacemakerkernel and cycle frequency in the lobster pyloric network. J Neurosci 19:6712–6722, 1999.
Bal T, Nagy F, and Moulins M. The pyloric central pattern generator incrustacea: a set of conditional neuronal oscillators. J Comp Physiol 163:715–727, 1988.
Bennett MV. Gap junctions as electrical synapses. J Neurocytol 26: 349–366,1997.
Blatow M, Rozov A, Katona I, Hormuzdi SG, Meyer AH, WhittingtonMA, Caputi A, and Monyer H. A novel network of multipolar burstinginterneurons generates theta frequency oscillations in neocortex. Neuron 38:805–817, 2003.
Buchholtz F, Golowasch J, Epstein IR, and Marder E. Mathematical modelof an identified stomatogastric ganglion neuron. J Neurophysiol 67: 332–340, 1992.
Chow CC and Kopell N. Dynamics of spiking neurons with electricalcoupling. Neural Comput 12: 1643–1678, 2000.
Dermietzel R and Spray DC. Gap junctions in the brain: where, what type,how many and why? Trends Neurosci 16: 186–192, 1993.
De Vries G, Sherman A, and Zhu HR. Diffusively coupled bursters: effectsof cell heterogeneity. B Math Biol 60: 1167–1200, 1998.
Eisen JS and Marder E. A mechanism for production of phase shifts in apattern generator. J Neurophysiol 51: 1375–1393, 1984.
Flamm RE and Harris-Warrick RM. Aminergic modulation in lobsterstomatogastric ganglion. II. Target neurons of dopamine, octopamine, andserotonin within the pyloric circuit. J Neurophysiol 55: 866–881, 1986.
Galarreta M and Hestrin S. A network of fast-spiking cells in the neocortexconnected by electrical synapses. Nature 402: 72–75, 1999.
Gibson JR, Beierlein M, and Connors BW. Two networks of electricallycoupled inhibitory neurons in neocortex. Nature 402: 75–79, 1999.
Golowasch J, Buchholtz F, Epstein IR, and Marder E. Contribution ofindividual ionic currents to activity of a model stomatogastric ganglionneuron. J Neurophysiol 67: 341–349, 1992.
Harris-Warrick RM. Dynamic Biological Networks: The StomatogastricNervous System. Cambridge, MA: MIT Press, 1992.
Hooper SL. Phase maintenance in the pyloric pattern of the lobster (Panulirusinterruptus) stomatogastric ganglion. J Comput Neurosci 4: 191–205, 1997.
Hooper SL and Marder E. Modulation of the lobster pyloric rhythm by thepeptide proctolin. J Neurosci 7: 2097–2112, 1987.
Jefferys JG. Nonsynaptic modulation of neuronal activity in the brain: electriccurrents and extracellular ions. Physiol Rev 75: 689–723, 1995.
Johnson BR, Kloppenburg P, and Harris-Warrick RM. Dopamine modu-lation of calcium currents in pyloric neurons of the lobster stomatogastricganglion. J Neurophysiol 90: 631–643, 2003.
Johnson BR, Peck JH, and Harris-Warrick RM. Differential modulation ofchemical and electrical components of mixed synapses in the lobster
stomatogastric ganglion. J Comp Physiol A Sens Neural Behav Physiol 175:233–249, 1994.
Kepler TB, Marder E, and Abbott LF. The effect of electrical coupling onthe frequency of model neuronal oscillators. Science 248: 83–85, 1990.
Komendantov AO, Komendantova OG, Johnson SW, and Canavier CC. Amodeling study suggests complementary roles for GABAA and NMDAreceptors and the SK channel in regulating the firing pattern in midbraindopamine neurons. J Neurophysiol 91: 346–357, 2004.
Kopell N, Abbott LF, and Soto-Trevino C. On the behavior of a neuraloscillator electrically coupled to a bistable element. Physica D 121: 367–395, 1998.
Landisman CE, Long MA, Beierlein M, Deans MR, Paul DL, and ConnorsBW. Electrical synapses in the thalamic reticular nucleus. J Neurosci 22:1002–1009, 2002.
Lewis TJ and Rinzel J. Dendritic effects in networks of electrically coupledfast-spiking interneurons. Neurocomputing 58–60: 145–150, 2004.
Manor Y, Rinzel J, Segev I, and Yarom Y. Low-amplitude oscillations in theinferior olive: a model based on electrical coupling of neurons with heter-ogeneous channel densities. J Neurophysiol 77: 2736–2752, 1997.
Marder E and Eisen JS. Electrically coupled pacemaker neurons responddifferently to same physiological inputs and neurotransmitters. J Neuro-physiol 51: 1362–1374, 1984a.
Marder E and Eisen JS. Transmitter identification of pyloric neurons:electrically coupled neurons use different transmitters. J Neurophysiol 51:1345–1361, 1984b.
Marder E, Hooper SL, and Siwicki KK. Modulatory action and distributionof the neuropeptide proctolin in the crustacean stomatogastric nervoussystem. J Comp Neurol 243: 454–467, 1986.
Medvedev GS and Kopell N. Synchronization and transient dynamics in thechains of electrically coupled Fitzhugh–Nagumo oscillators. Siam J ApplMath 61: 1762–1801, 2001.
Medvedev GS, Wilson CJ, Callaway JC, and Kopell N. Dendritic synchronyand transient dynamics in a coupled oscillator model of the dopaminergicneuron. J Comput Neurosci 15: 53–69, 2003.
Meunier C. The electrical coupling of two simple oscillators: load andacceleration effects. Biol Cybern 67: 155–164, 1992.
Miller JP and Selverston AI. Mechanisms underlying pattern generation inlobster stomatogastric ganglion as determined by selective inactivation ofidentified neurons. II. Oscillatory properties of pyloric neurons. J Neuro-physiol 48: 1378–1391, 1982.
Perez Velazquez JL and Carlen PL. Gap junctions, synchrony and seizures.Trends Neurosci 23: 68–74, 2000.
Raper JA. Nonimpulse-mediated synaptic transmission during the generationof a cyclic motor program. Science 205: 304–306, 1979.
Saraga F and Skinner FK. Location, location, location (and density) of gapjunctions in multi-compartment models. Neurocomputing 58–60: 713–719,2004.
Selverston AI and Miller JP. Mechanisms underlying pattern generation inlobster stomatogastric ganglion as determined by selective inactivation ofidentified neurons. I. Pyloric system. J Neurophysiol 44: 1102–1121, 1980.
Selverston AI, Russell DF, Miller JP, and King D. The stomatogastricnervous system: structure and function of a small neural network. ProgNeurobiol 7: 215–290, 1976.
Sherman A and Rinzel J. Rhythmogenic effects of weak electrotonic cou-pling in neuronal models. Proc Natl Acad Sci USA 89: 2471–2474, 1992.
Shilnikov A and Cymbalyuk G. Transition between tonic spiking andbursting in a neuron model via the blue-sky catastrophe. Phys Rev Lett 94:048101, 2005.
Sigvardt KA and Mulloney B. Properties of synapses made by IVN com-mand-interneurones in the stomatogastric ganglion of the spiny lobsterPanulirus interruptus. J Exp Biol 97: 153–168, 1982.
Skinner FK, Zhang L, Velazquez JL, and Carlen PL. Bursting in inhibitoryinterneuronal networks: a role for gap-junctional coupling. J Neurophysiol81: 1274–1283, 1999.
Swensen AM and Marder E. Multiple peptides converge to activate the samevoltage-dependent current in a central pattern-generating circuit. J Neurosci20: 6752–6759, 2000.
Turrigiano G, LeMasson G, and Marder E. Selective regulation of currentdensities underlies spontaneous changes in the activity of cultured neurons.J Neurosci 15: 3640–3652, 1995.
Wilson CJ and Callaway JC. Coupled oscillator model of the dopaminergicneuron of the substantia nigra. J Neurophysiol 83: 3084–3100, 2000.
604 C. SOTO-TREVINO, P. RABBAH, E. MARDER, AND F. NADIM
J Neurophysiol • VOL 94 • JULY 2005 • www.jn.org
on Decem
ber 13, 2009 jn.physiology.org
Dow
nloaded from


![Parshas Shemos תומש תשרפ - YUTorah.orgdownload.yutorah.org/2016/shemos - qs1mqhz83t.pdf · Shemos Rabbah 2:5, Bemidbar Rabbah, Bem. 1:3, etc.] And this connection is for good](https://static.fdocuments.in/doc/165x107/5e8ebdda8512696c3934cb5f/parshas-shemos-qs1mqhz83tpdf-shemos-rabbah-25-bemidbar.jpg)


