Crisis Monitoring at Community Level in the Republic of Moldova Trends: Survey 1&2
25
Crisis Monitoring at Community Level in the Republic of Moldova Trends: Survey 1&2 Supported by UNDP UNICEF UNIFEM 1 Olesea Cruc, IDIS ‘Viitorul’
-
Upload
jared-summers -
Category
Documents
-
view
17 -
download
0
description
Supported by UNDP UNICEF UNIFEM. Crisis Monitoring at Community Level in the Republic of Moldova Trends: Survey 1&2. Olesea Cruc, IDIS ‘Viitorul’. Initiative of UNDP, UNICEF, UNIFEM. Impl e mented by: IDIS ‘ Viitorul ’ CBS AXA. Survey methodology. Data collection period - PowerPoint PPT Presentation
Transcript of Crisis Monitoring at Community Level in the Republic of Moldova Trends: Survey 1&2
Crisis Monitoring at Community Level in the Republic of Moldova
Trends: Survey 1&2
Supported by UNDP UNICEF UNIFEM
1
Olesea Cruc, IDIS ‘Viitorul’
Initiative of UNDP, UNICEF, UNIFEMUNDP, UNICEF, UNIFEM
Implemented by:
IDIS ‘Viitorul’ IDIS ‘Viitorul’
CBS AXACBS AXA
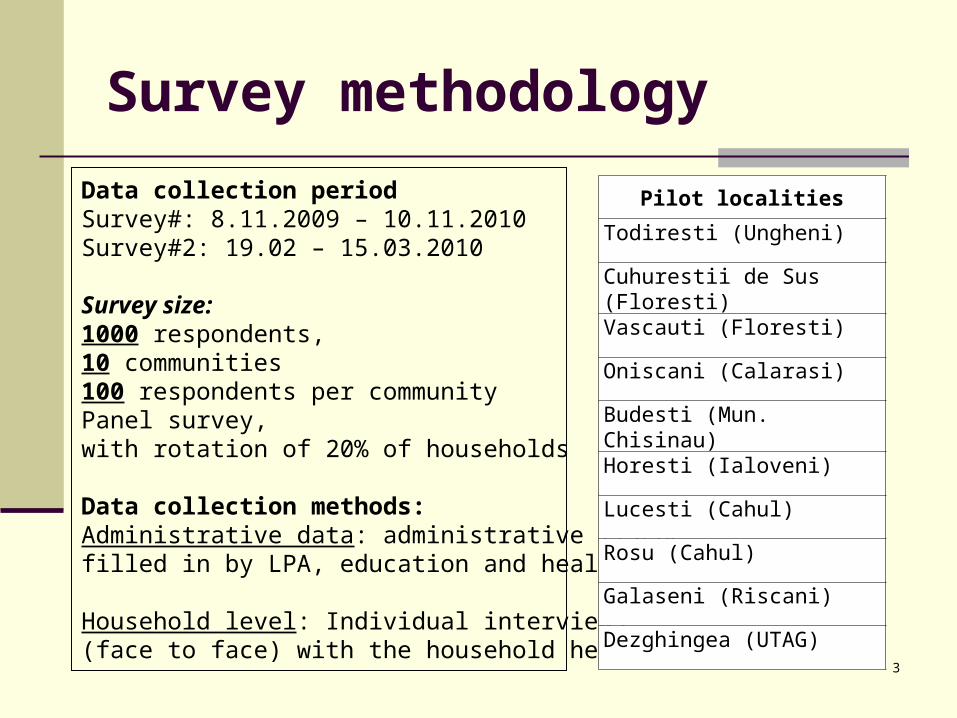
Survey methodology
Data collection period Survey#: 8.11.2009 – 10.11.2010Survey#2: 19.02 – 15.03.2010
Survey size: 1000 respondents, 10 communities100 respondents per communityPanel survey, with rotation of 20% of households
Data collection methods:Administrative data: administrative fische filled in by LPA, education and health institutions; Household level: Individual interviews (face to face) with the household head.
Pilot localities
Todiresti (Ungheni)
Cuhurestii de Sus (Floresti)
Vascauti (Floresti)
Oniscani (Calarasi)
Budesti (Mun. Chisinau)
Horesti (Ialoveni)
Lucesti (Cahul)
Rosu (Cahul)
Galaseni (Riscani)
Dezghingea (UTAG)
3
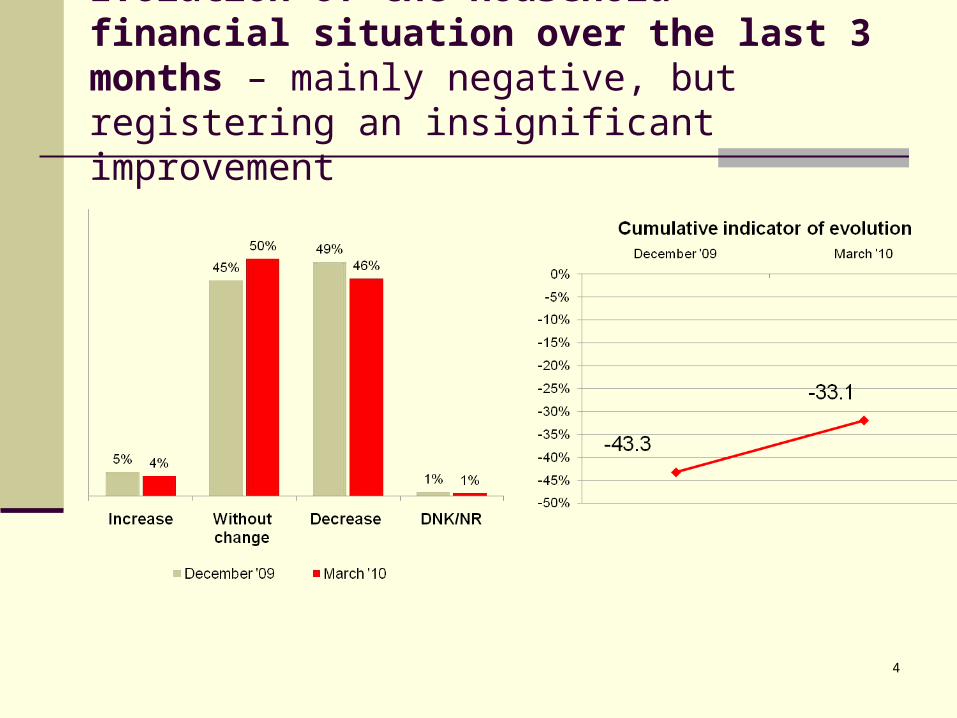
Evolution of the household financial situation over the last 3 months – mainly negative, but registering an insignificant improvement
4

Prognosis of household’s financial situation for the next 3 months – winter effects are off
5

Causes for worsening of the financial situation – stable incomes, increasing expenses
December March
Increase in prices for food, clothes, services
69.9% 67.2%
Beginning of the cold period of the year / heating costs
70.3% 56.1%
Sickness, increase in health costs 38.0% 33.9%
Decrease of prices of agricultural products produced by themselves
28.5% 17.4%
Job loss 20.0% 14.6%
Decrease in sale of individual businesses 17.3% 13.9%
Decrease in salary 16.3% 13.2%
Reduction of remittance amounts 9.0% 20.3%
Delayed payment of pensions / social payments
4.5% 4.0%6

Products for which expenses have been reduced
December March
Clothes and footwear 65.0% 79.2%
Trips outside the locality 43.8% 50.9%
Utility services 48.1% 48.9%
Food products 29.5% 29.6%
Other current expenses 45.5% 29.6%Alcoholic beverages and tobacco 40.7% 28.4%
Education 5.0% 19.0%
Health 7.6% 7.6%7
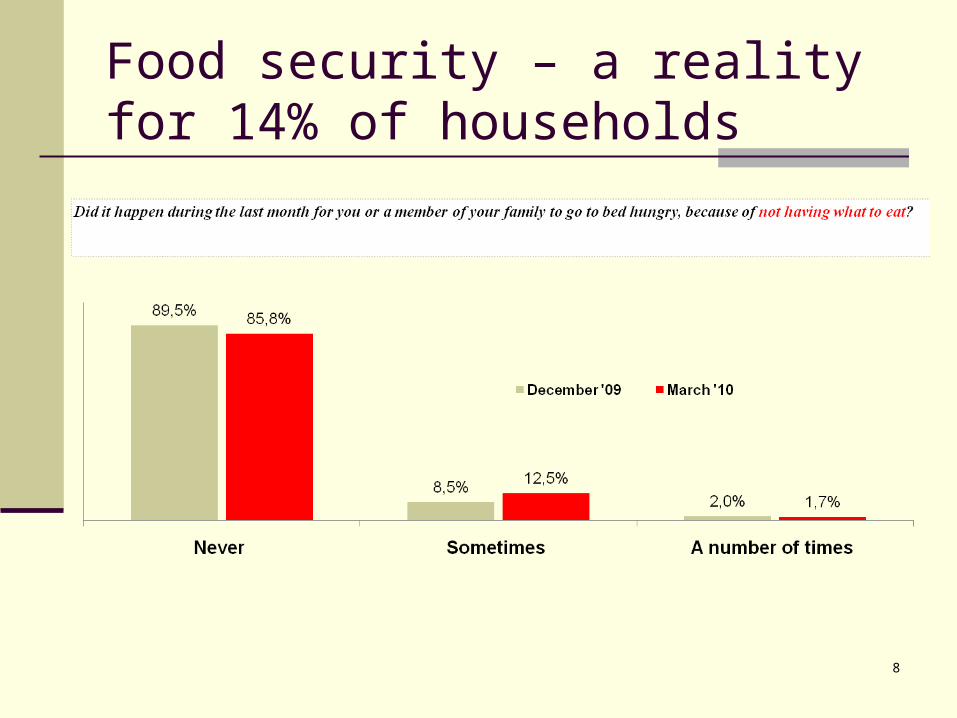
Food security – a reality for 14% of households
8
The study data show that the crisis has passed the critical point and households begin to assess their financial capacity less negative than in December 2009;
The economic crisis is manifested at the community level through worsening of household financial status, caused by increase of price and cost of living. The dynamic of financial capacity of households in the last three months and expectations of this development on the following three months are mostly negative
Among the most vulnerable groups from this point of view are household with 3 and more children and those with a single parent;
The main risk sources for family budgets in the period December 2009 - March 2010 are: the increase of prices for goods and services, housing and heating costs associated with increased spending for health;
During the assessed period four out of ten households have reduced their consumption expenses.
9
Generally, the socio-economic situation seems to be improving compared to the end of 2009.
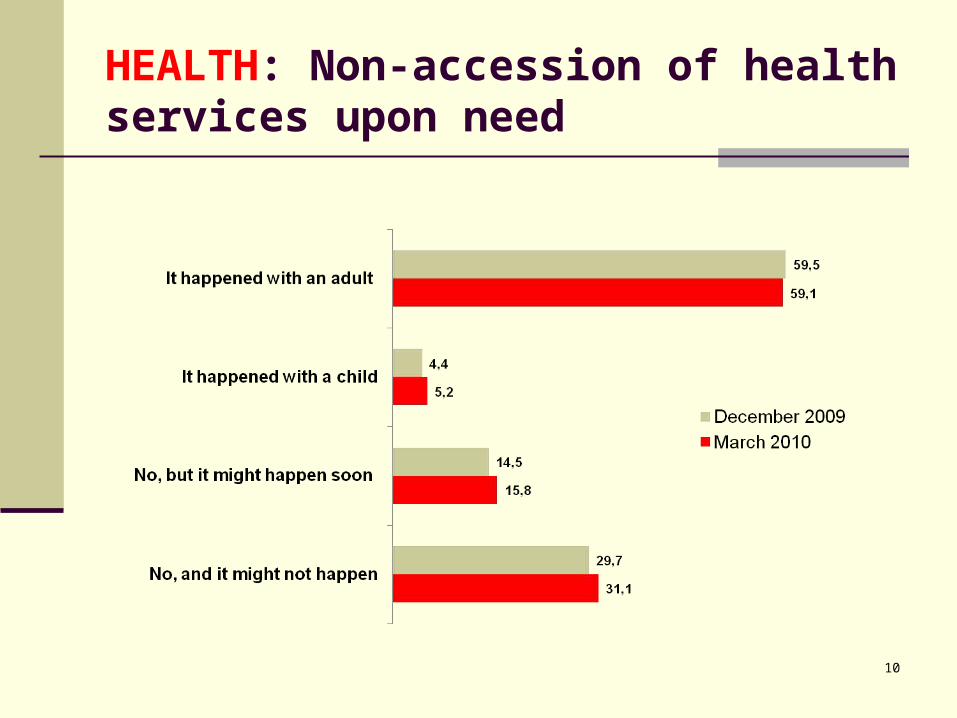
HEALTH: Non-accession of health services upon need
10
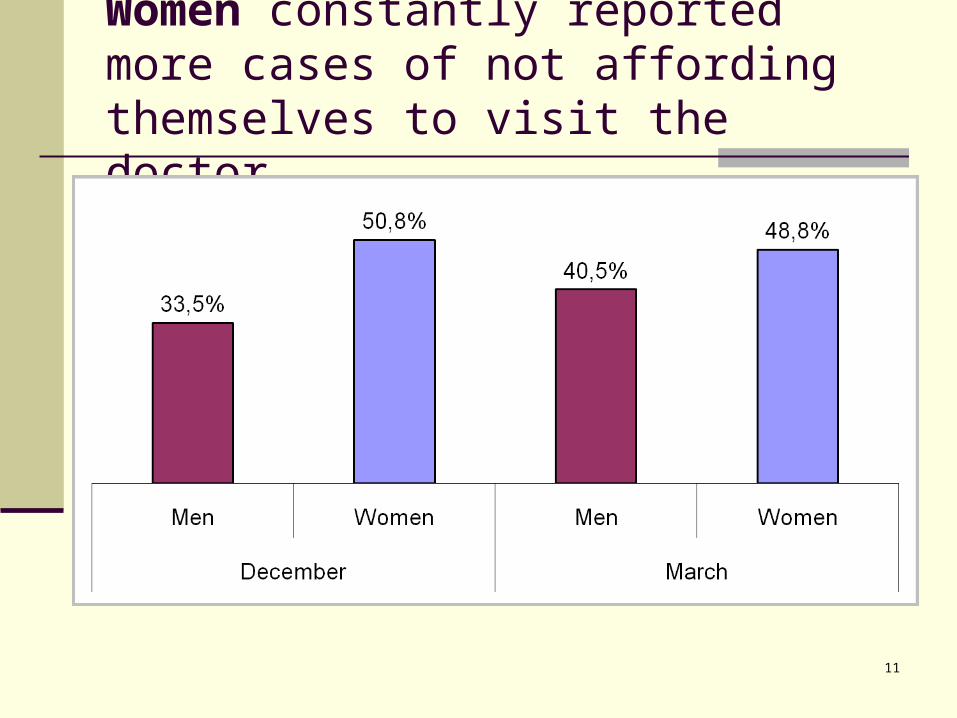
Women constantly reported more cases of not affording themselves to visit the doctor
11
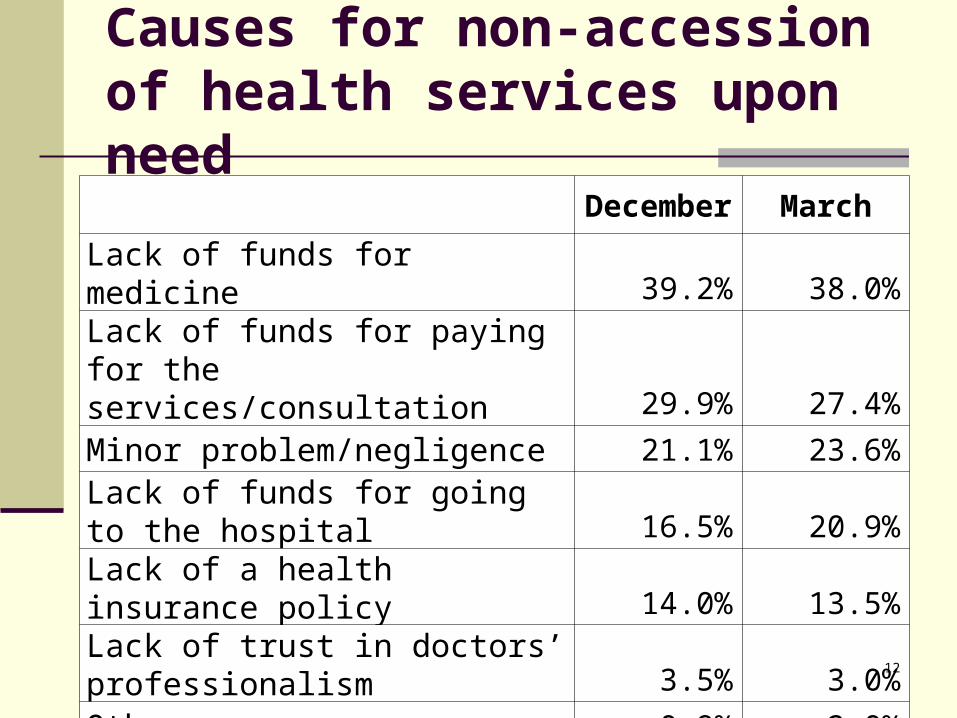
Causes for non-accession of health services upon need
December March
Lack of funds for medicine 39.2% 38.0%
Lack of funds for paying for the services/consultation 29.9% 27.4%
Minor problem/negligence 21.1% 23.6%
Lack of funds for going to the hospital 16.5% 20.9%
Lack of a health insurance policy 14.0% 13.5%
Lack of trust in doctors’ professionalism 3.5% 3.0%
Other 0.9% 2.0%12

Administrative data regarding health population show a better situation
December 2009
March 2010
Trend
Number of population with social diseases 172 162 -5.8
New cases of sicknesses 1044 734 -29.7
Among 0-2 years old 153 43 -71.9
3-6 years old 309 114 -63.1
7-15 years old 381 87 -77.2
Number of trauma cases among children 8 3 -62.5
Number of population without health insurance 5009 4512 -9.9
Number of malnourished children 0-3 years old 20 10 -50.0
Number of malnourished children 4-7 years old 20 13 -35.0
Number of children with 1st and 2nd disability degree 96 91 -5.2
13
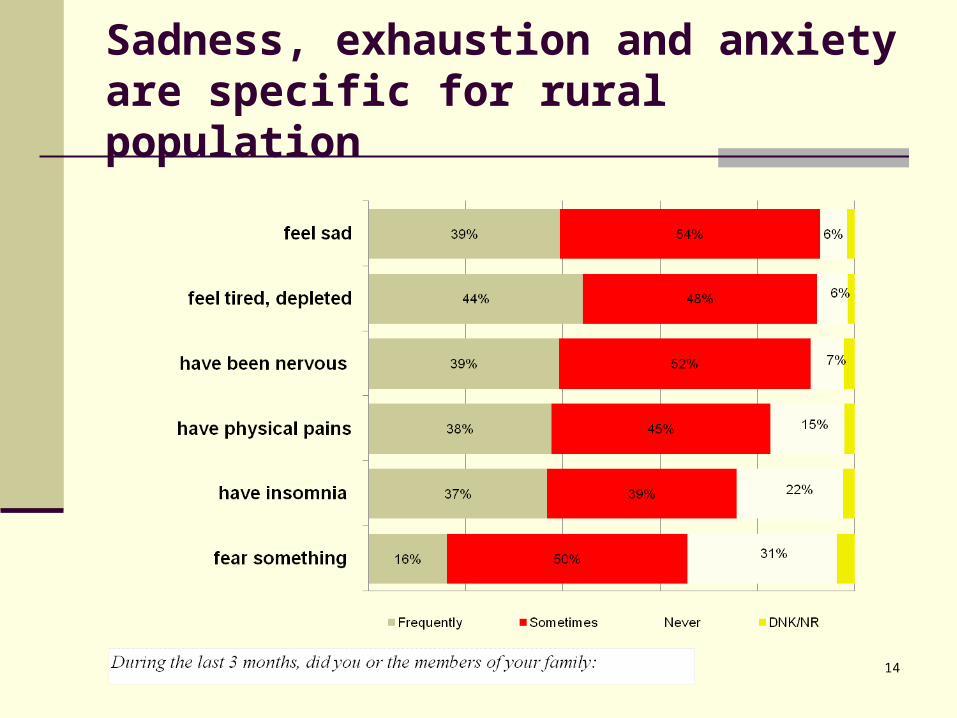
Sadness, exhaustion and anxiety are specific for rural population
14
Health trends
The access of the population to health services remains very limited. Two thirds of households undergo the risk of not affording themselves the access to medical services upon need, mainly because of lack of finances;
The study data reveal an improvement of population health for the first quarter of the year. Compared with December 2010 there is a decrease of new cases of sickness in the general of the population, and among children as well. The number of malnourished children and of social diseases has also decreased;
The most vulnerable segments from the perspective of access to health services are the pensioners and households with persons with disabilities;
During the study period the coverage of medical insurance decreased with 10%;
15
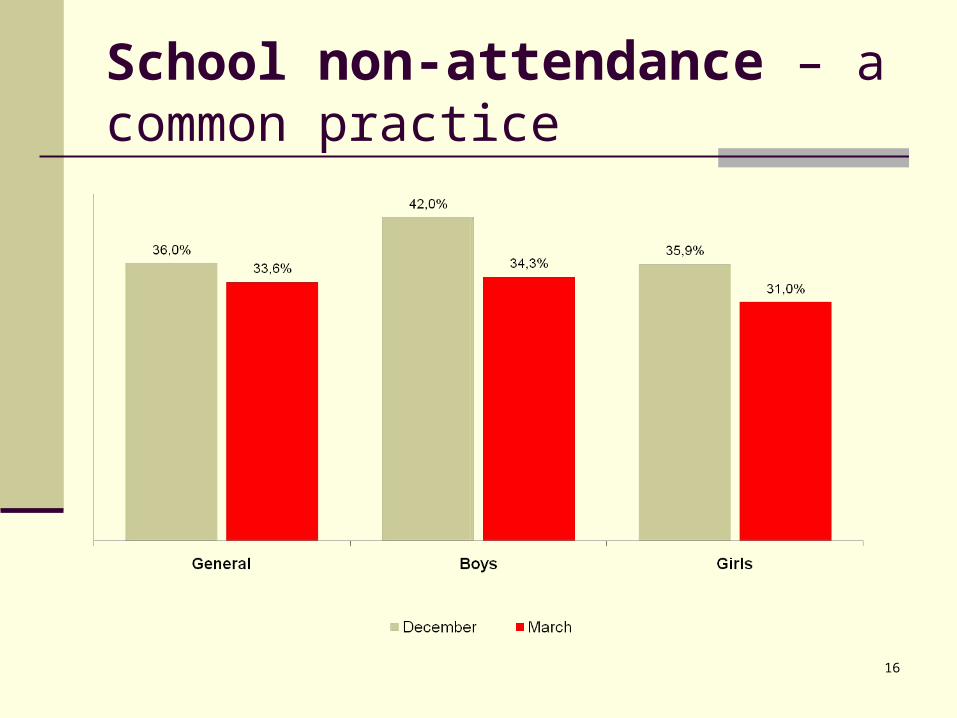
School non-attendance – a common practice
16
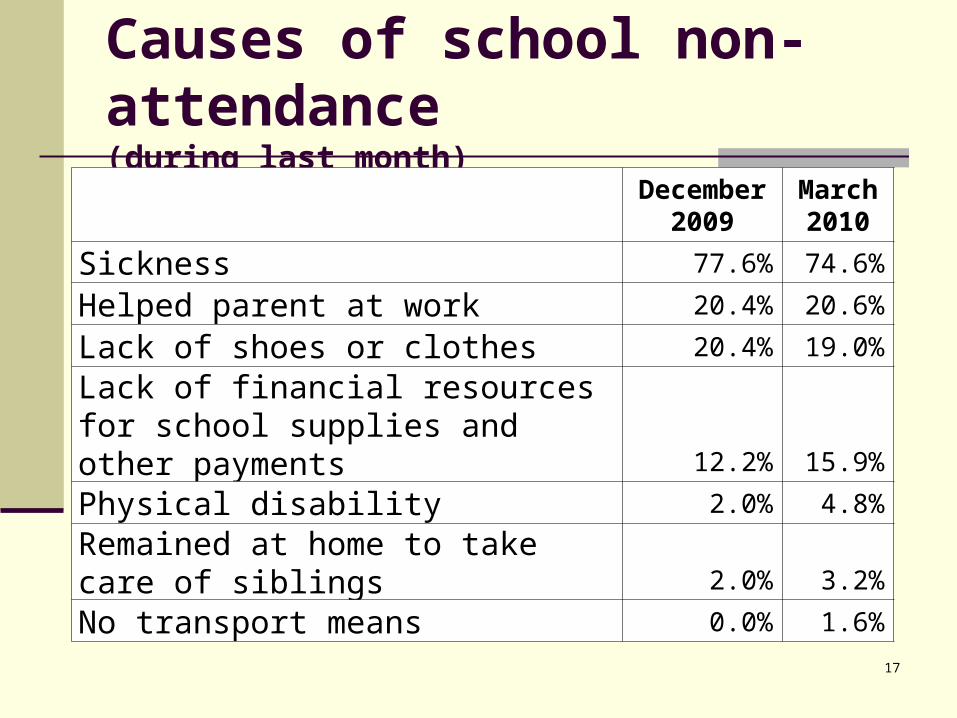
Causes of school non-attendance(during last month)
December 2009
March 2010
Sickness 77.6% 74.6%
Helped parent at work 20.4% 20.6%
Lack of shoes or clothes 20.4% 19.0%
Lack of financial resources for school supplies and other payments 12.2% 15.9%
Physical disability 2.0% 4.8%
Remained at home to take care of siblings 2.0% 3.2%
No transport means 0.0% 1.6%
17

Relationship between parents and children
Did it happen during last 3 months to: December 2009
March 2010
Reprimanding the children 50.8% 43.4%
Raising the voice 33.3% 33.8%
Other punishments 20.5% 24.4%
Physical violence 2.1% 1.8%
Complaints from the children regarding problems at schools (with other colleagues, etc.)
13.6% 10.0%
18
Education
At the moment the study doesn’t indicate essential changes in the children education;
A widely spread practice is children missing classes. Apart from such reasons as health problems, child labor is another cause of school non-attendance;
Children are often subject to reprimands and punishments, but very rarely by physical violence.
19
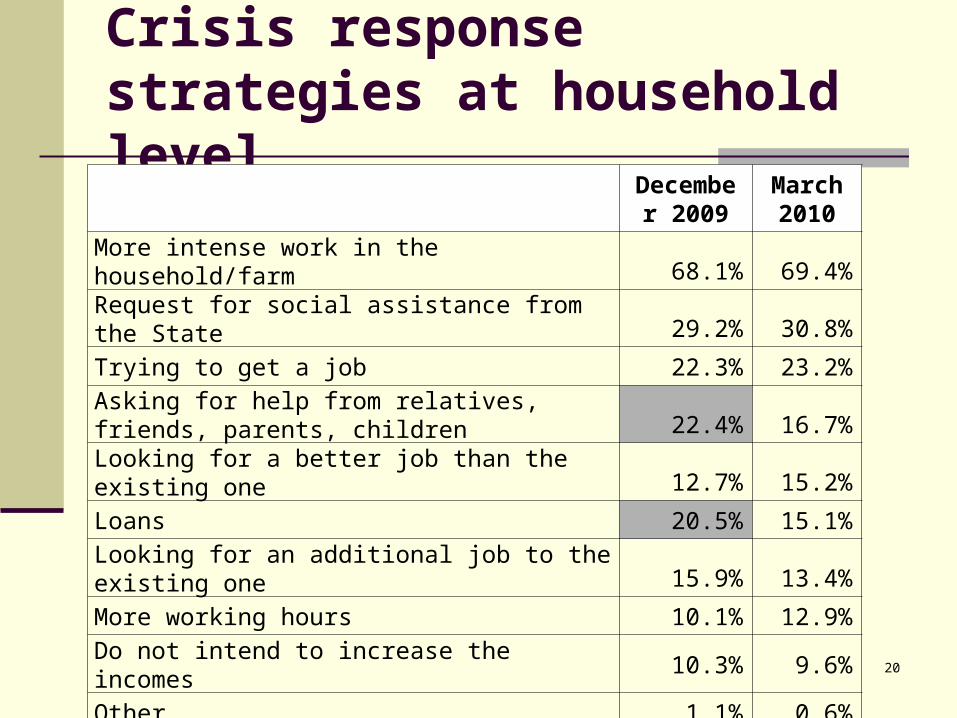
Crisis response strategies at household level
December 2009
March 2010
More intense work in the household/farm 68.1% 69.4%
Request for social assistance from the State 29.2% 30.8%
Trying to get a job 22.3% 23.2%
Asking for help from relatives, friends, parents, children 22.4% 16.7%
Looking for a better job than the existing one 12.7% 15.2%
Loans 20.5% 15.1%
Looking for an additional job to the existing one 15.9% 13.4%
More working hours 10.1% 12.9%
Do not intend to increase the incomes 10.3% 9.6%
Other 1.1% 0.6%
20
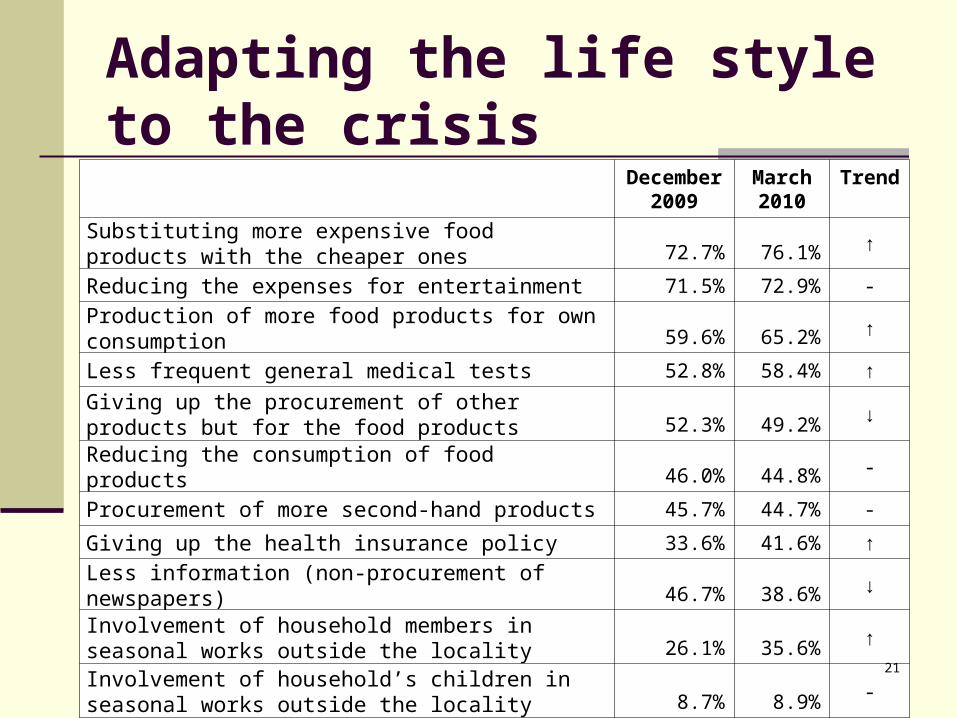
Adapting the life style to the crisis
December 2009
March 2010
Trend
Substituting more expensive food products with the cheaper ones 72.7% 76.1% ↑
Reducing the expenses for entertainment 71.5% 72.9% -
Production of more food products for own consumption 59.6% 65.2% ↑
Less frequent general medical tests 52.8% 58.4% ↑
Giving up the procurement of other products but for the food products 52.3% 49.2% ↓
Reducing the consumption of food products 46.0% 44.8% -
Procurement of more second-hand products 45.7% 44.7% -
Giving up the health insurance policy 33.6% 41.6% ↑
Less information (non-procurement of newspapers) 46.7% 38.6% ↓
Involvement of household members in seasonal works outside the locality 26.1% 35.6% ↑
Involvement of household’s children in seasonal works outside the locality 8.7% 8.9% -
School dropout (school, kindergarten) 6.6% 6.7% -21

Perceived impact of the crisis at community level
22

Social benefits – more requests, less beneficiaries: administrative data
December 2009
March 2010
Trend
Nr. of new requests for social benefits
384 389 1.3
Including women 337 331 -1.8Including under the new law on social aid
94 173 84.0
Nr. of beneficiaries of social benefits
720 470 -34.7
Including women 629 318 -49.4Including under the new law on social aid
358 172 -52.0
23
Crisis at the community level
Population perception of the crisis is manifested by: increased morbidity, increased poverty and intensification of migration processes. On the other hand, administrative data do not confirm intensification of migration processes, neither increased unemployment during the period December 2009 - March 2010;
The introduction of the new Law on social aid seems to "disconnect" from the social benefits system an important part of its former beneficiaries. In particular this refers to families with children (needs in-depth study);
Reducing the number of beneficiaries of social benefits involves increasing pressure on the LPA, in the form of financial aid requests increase.
24

THANK YOU FOR ATTENTION!
25