Criminal background and job performance
49
ORIGINAL ARTICLE Open Access Criminal background and job performance Dylan Minor, Nicola Persico and Deborah M. Weiss * * Correspondence: deborah.weiss@ northwestern.edu Northwestern University, Evanston, IL, USA Abstract Job applicants with criminal records are much less likely than others to obtain legitimate employment. Recent efforts to address this problem include campaigns to persuade employers to hire applicants with a record voluntarily and legislation such as Ban the Box laws. The success of any remedial strategy depends on whether employer concerns are founded on an accurate view of how employees with a criminal background behave on the job if hired. Little empirical evidence now exists to answer this question. This paper attempts to fill this gap by examining firm-level hiring practices and worker-level performance outcomes. Our data indicate that individuals with criminal records have a much longer tenure and are less likely to quit their jobs voluntarily than other workers. Some results, however, differ by job: sales employees with a criminal record have a higher tendency than other workers to leave because of misconduct, while this effect is smaller and less significant for customer service workers. By examining psychometric data, we find evidence that bad outcomes for sales people with records may be driven by job rather than employee characteristics. We find some evidence that psychometric testing might provide a substitute for the use of criminal records, but that it would not in our own sample. Keywords: Criminal records, Discrimination, Personnel economics, Job performance JEL Classification: K14, J24, J78 1 Introduction Job applicants with a criminal record are much less likely than others to receive an offer of employment. Recent audit studies suggest that lower human capital does not fully explain this difference, and that employers apply a hiring penalty to job applicants with a criminal background. Recent legislation and initiatives have attempted to improve the labor market prospects of individuals with a criminal record. One approach, known as Ban the Box, would restrict or prohibit employer inquiries about an applicant’ s criminal record until a conditional offer of employment has been made. Alternative approaches include attempts to encourage voluntary efforts by employers either through persuasion or tax incentives. The success of any approach to improve the employment prospects of those with a criminal record depends on why firms impose a hiring penalty. Are employers primar- ily concerned with potential workplace misconduct or are they using a criminal record as a proxy for the personality characteristics associated with job instability or poor per- formance? Is either fear founded on an accurate view of how individuals with records behave on the job if they are hired? This paper addresses these questions leveraging a dataset drawn from the client firms of a hiring consultancy whose data has been previously used in academic work © The Author(s). 2018 Open Access This article is distributed under the terms of the Creative Commons Attribution 4.0 International License (http://creativecommons.org/licenses/by/4.0/), which permits unrestricted use, distribution, and reproduction in any medium, provided you give appropriate credit to the original author(s) and the source, provide a link to the Creative Commons license, and indicate if changes were made. Minor et al. IZA Journal of Labor Policy (2018) 7:8 https://doi.org/10.1186/s40173-018-0101-0
Transcript of Criminal background and job performance
ORIGINAL ARTICLE Open Access
Criminal background and job performanceDylan Minor, Nicola Persico and Deborah M. Weiss*
* Correspondence: [email protected] University, Evanston,IL, USA
Abstract
Job applicants with criminal records are much less likely than others to obtain legitimateemployment. Recent efforts to address this problem include campaigns to persuadeemployers to hire applicants with a record voluntarily and legislation such as Ban the Boxlaws. The success of any remedial strategy depends on whether employer concerns arefounded on an accurate view of how employees with a criminal background behave on thejob if hired. Little empirical evidence now exists to answer this question. This paper attemptsto fill this gap by examining firm-level hiring practices and worker-level performanceoutcomes. Our data indicate that individuals with criminal records have a much longertenure and are less likely to quit their jobs voluntarily than other workers. Some results,however, differ by job: sales employees with a criminal record have a higher tendency thanother workers to leave because of misconduct, while this effect is smaller and less significantfor customer service workers. By examining psychometric data, we find evidence that badoutcomes for sales people with records may be driven by job rather than employeecharacteristics. We find some evidence that psychometric testing might provide a substitutefor the use of criminal records, but that it would not in our own sample.
Keywords: Criminal records, Discrimination, Personnel economics, Job performance
JEL Classification: K14, J24, J78
1 IntroductionJob applicants with a criminal record are much less likely than others to receive an offer of
employment. Recent audit studies suggest that lower human capital does not fully explain
this difference, and that employers apply a hiring penalty to job applicants with a criminal
background. Recent legislation and initiatives have attempted to improve the labor market
prospects of individuals with a criminal record. One approach, known as Ban the Box,
would restrict or prohibit employer inquiries about an applicant’s criminal record until a
conditional offer of employment has been made. Alternative approaches include attempts
to encourage voluntary efforts by employers either through persuasion or tax incentives.
The success of any approach to improve the employment prospects of those with a
criminal record depends on why firms impose a hiring penalty. Are employers primar-
ily concerned with potential workplace misconduct or are they using a criminal record
as a proxy for the personality characteristics associated with job instability or poor per-
formance? Is either fear founded on an accurate view of how individuals with records
behave on the job if they are hired?
This paper addresses these questions leveraging a dataset drawn from the client
firms of a hiring consultancy whose data has been previously used in academic work
© The Author(s). 2018 Open Access This article is distributed under the terms of the Creative Commons Attribution 4.0 InternationalLicense (http://creativecommons.org/licenses/by/4.0/), which permits unrestricted use, distribution, and reproduction in any medium,provided you give appropriate credit to the original author(s) and the source, provide a link to the Creative Commons license, andindicate if changes were made.
Minor et al. IZA Journal of Labor Policy (2018) 7:8 https://doi.org/10.1186/s40173-018-0101-0
(Burks et al. 2015). The data consists of observations of individual applicants to, and
employees holding, low-skill white-collar jobs, primarily at call centers. The data in-
cludes information available at the time of hiring, such as criminal record and job qual-
ifications, and for those hired, it contains tenure-related outcomes such as length of
service and, if the employee separated, the circumstances of separation.
In positions in which turnover is a major labor cost determinant, we find that
workers with criminal records have a longer tenure and are less likely to quit their jobs
voluntarily than other workers. This finding suggests that individuals with criminal re-
cords represent an untapped productivity pool. However, when we disaggregate by job,
we find that the association between criminal record and termination for misconduct is
heterogeneous and differs between customer service and sales, suggesting the need for
caution in drawing general conclusions.
We examine the differences in outcomes between jobs using psychometric test results
of the type commonly used in hiring. First, we find striking differences between the
psychometric predictors of poor outcomes in sales jobs and customer service jobs. Sec-
ond, we find psychometric differences between sales people and customer service
workers with criminal records. These results suggest that bad outcomes for sales people
with records may be driven by differences either in worker or in job characteristics.
We then use detailed psychometric data on workers to show that criminal back-
ground predicts longer tenure even after controlling for personality traits. In theory,
psychometric testing might provide a mechanism to allow employers to ignore criminal
records entirely by testing directly for the characteristics that cause difficulties in a sub-
set of employees with criminal records. In our data, we find that the psychometric vari-
ables have a reasonable degree of association with both a criminal record and job
outcomes. However, they do not reduce the value of a criminal record in predicting
misconduct, and further research is required to determine whether they could do so.
In considering the policy implications of these findings, one qualification is critical.
Especially since employers apply a hiring penalty to individuals with criminal records,
those who are actually hired are presumably more qualified than those who are not,
and the instances in which we find better performance of employees with a criminal
record cannot be generalized to the entire applicant pool. However, we believe we can
make some reasonable inferences about marginal hires with a criminal record, and our
results suggest that some employers could be missing profitable opportunities to hire
low turnover workers. Our contribution to the existing literature is as follows. To the
best of our knowledge this is the first paper to study the correlation between criminal
background and productivity in a civilian setting. Unusually, we have data on the crim-
inal background and psychological characteristics of all applicants merged with tenure
data. Consistent with the literature that focuses on the hiring process, we find that ap-
plicants with criminal records are penalized at the hiring stage conditional on observ-
able characteristics. Furthermore, we find that criminal history seems to be associated
with better performance overall in customer service positions and is ambiguous in sales
positions. These associations persist even after conditioning on psychological character-
istics and other observables that employers use in the hiring process. These findings
suggest that, at least with regard to customer service positions, there are unexploited
opportunities to expand marginally the hiring toward applicants with a criminal back-
ground in a way that makes sense both on efficiency and on moral grounds.
Minor et al. IZA Journal of Labor Policy (2018) 7:8 Page 2 of 49
2 Related literatureObservational studies have repeatedly found that job applicants with criminal records
are much less likely than others to obtain legitimate employment (Western et al. 2001).
Six months or so after release, 50 to 80% of the formerly incarcerated are not employed
in the legitimate labor market (Visher et al. 2011; Petersilia 2003).
Establishing whether a causal relation exists between a criminal record and poor em-
ployment prospects is difficult, but studies using a variety of methods suggest that trad-
itional human capital measures alone do not explain the hiring penalty associated with
a criminal record, and that employers consider a criminal record a liability in job appli-
cants.1 Survey evidence confirms these findings and indicates that 69% of organizations
conduct criminal background checks on all of their job candidates (Holzer et al. 2004;
Society for Human Resource Management 2012).
The poor employment prospects of individuals with criminal records are of consider-
able policy concern. Technological changes continue to make background checking
easier, and evidence suggests that lower costs have driven the increased use of these
checks (Bushway 2004; Finlay 2009). The incarceration rate in the USA has grown con-
siderably over the past several decades and now far exceeds that of any other country
in the world. Over 650,000 offenders are released from prison each year (Carson and
Golinelli 2013). The post-release employment prospects of inmates are of great prac-
tical consequence. Over half of released prisoners are reconvicted within 3 years (Dur-
ose et al. 2014). A failure to obtain legitimate employment is one of the strongest
correlates of criminal recidivism, and recent evidence suggests that this relation may be
causal (Uggen and Shannon 2014; Yang 2017).
Recent legislation and initiatives have attempted to improve the labor market pros-
pects of applicants with criminal records. Some approaches restrict the use that em-
ployers can make of a criminal record. Ban the Box statutes prohibit employer
inquiries about an applicant’s criminal record until a conditional offer of employment
has been made and sometimes restrict the type of records that can be used or prohibit
the employer from withdrawing the offer unless certain conditions are met.2 The Equal
Employment Opportunity Commission (EEOC) has challenged criminal background
checks on the grounds that they have a disparate impact on African Americans and en-
courages employers to meet the requirements of disparate impact doctrine by proce-
dures similar to those in Ban the Box laws.3
Alternative policy approaches attempt to encourage voluntary employer efforts. The
Obama administration launched an initiative called “Take the Fair Chance Pledge.”
Businesses and educational institutions have been asked to commit to employing fairly
those with a criminal record. Over 100 organizations in a variety of industries signed
on, including such companies as American Airlines, Coca-Cola, Koch Industries, Goo-
gle, Starbucks, and Walmart.4 Related policies attempt to provide incentives or remove
disincentives for hiring people with criminal records. The Work Opportunity Tax
Credit allows employers to reduce their federal income tax liability by $2400 for hiring
ex-felons within 1 year after their conviction or release from prison.5
An employer who hires an applicant with a criminal record faces a double risk: the
employee’s criminal record will preclude the employer from obtaining private insurance
against misconduct, and if the employee commits a wrongdoing on the job that harms
another individual, the criminal record is generally admissible as evidence of
Minor et al. IZA Journal of Labor Policy (2018) 7:8 Page 3 of 49
negligence. To address this, the Federal Bonding Program provides limited bonding for
some employers during the first 6 months of an eligible employee’s employment.6 Some
jurisdictions have limited the extent to which an employee’s criminal record can be the
basis of employer liability for negligent hiring.7
Yet another approach attempts to improve the employability of people with criminal
records by identifying those at low risk for recidivism8 or improving human capital
through job training or services directed toward individual change (Visher et al. 2017).
These policies are based on widely varying assumptions about the nature and accur-
acy of the business rationale for the hiring penalty. Employers often claim to use crim-
inal records primarily from concern about liability for negligent hiring.9 Fewer state,
when asked, that they are using criminal records as evidence regarding the personality
characteristics they seek. However, studies have found that employers overstate their
overall willingness to hire applicants with a criminal record (Pager and Quillian 2005),
and in surveys, they may well de-emphasize reasons for non-hiring that they perceived
as socially disfavored, such as using criminal records as a personality proxy.10
If little is known about exactly why employers use criminal records, still less is known
about whether this use is based on accurate assumptions about how those with crim-
inal records perform once hired or whether there are general characteristics that ex-
plain why employees with criminal records are at higher risk of bad job outcomes. Our
paper aims to shed some light on these issues.
Only one other paper examines the job performance of people with criminal records.
Lundquist et al. (2018) compare the performance of felons and non-felons using data
drawn from the military. Like us, Lundquist et al. (2018) find that military personnel
with a felony record are more attached to the job than other personnel and appear bet-
ter on some performance dimensions, though different ones than we use. In contrast to
our results, they find weaker performance and retention among those with a history of
lesser offenses. On the other hand, Lundquist et al. (2018) provide an extensive qualita-
tive analysis of selection procedures but not an estimate of the hiring penalty, while we
provide an estimate of the hiring penalty with less institutional detail regarding the hir-
ing process itself. We thus view the two papers as complementary, examining different
labor markets, civilian, and military, and providing different perspectives on the selec-
tion process.
Somewhat more evidence bears on the personality characteristics of those with crim-
inal records and the value of personality in predicting work outcomes. Psychologists
define personality as “enduring patterns of perceiving, relating to, and thinking about
the environment and oneself that are exhibited in a wide range of social and personal
contexts” (American Psychiatric Association and others 2013, Glossary). In the last
20 years, the most frequently used framework for personality psychology has been trait
theory, which typically begins with the responses of adult lay subjects to self-descriptive
words (Goldberg 1990) or sentences (Costa and McCrae 1992a, 1992b). The personality
evidence in our data consists of responses to 15 sentences of the type used in trait
methodology.
The descriptive categories of trait analysis were developed by grouping the responses
of a pool of subjects using factor analysis (Block 2010).11 The most specific,
lowest-level category is called a facet, of which there are generally thought to be about
25–30. Researchers agree that there is at least one higher-level category, factors, and
Minor et al. IZA Journal of Labor Policy (2018) 7:8 Page 4 of 49
the most common number of top levels is five, notably in the Five Factor Approach
(FFA), sometimes called the Big Five (Lee and Ashton 2004). A commonly used version
of the FFA describes the five factors as conscientiousness, agreeableness, neuroticism,
extraversion, and openness to experience (Costa and McCrae 1992a, 1992b).
Although early work focused on higher-level factor analysis, more recent work has
found that the less aggregated facet level is more predictive (Judge et al. 2013; Pauno-
nen and Ashton 2001). Factors do remain useful because of data constraints as well as
their use by much of the existing literature. For instance, each of the 15 questions in
our data can be roughly associated with a factor, although, as will always be the case,
most sentences load on more than one factor.
Although a number of previous studies have examined the predictive value of FFA in
employment settings, most of these studies are small and study highly specific out-
comes. Useful conclusions, therefore, require meta-analyses, of which the most com-
prehensive and recent are Judge et al. (2013) and Barrick et al. (2001). Both find that
neuroticism usually has a negative effect on work outcomes and that, broadly speaking,
all other factors have on average a positive effect, with conscientiousness the most im-
portant. However, there is a great deal of occupation and task specificity, with different
factors predictive in different settings. The more recent of the two meta-analyses
stresses that lower-level traits like facets are much more predictive than higher-level
factors (Judge et al. 2013).
Relatively little work has been done on the relation between FFA and criminal behav-
ior due both to the relative newness of the FFA and to the unpopularity among crimi-
nologists of personality-based theories compared with theories based on factors such as
social class (Andrews and Bonta 2014; Jones et al. 2011).
Within this literature, most studies do find that the population of interest differs from
the population as a whole in some personality traits. Most commonly, people with
criminal records or related traits score high in extraversion and neuroticism and low in
conscientiousness and agreeableness (Jones et al. 2011; O’Riordan and O’Connell
2014). Since low neuroticism and high scores on other factors tend to predict good job
outcomes, these findings suggest that people with criminal records may not perform
well on the job.
3 Data description and summary statisticsThe dataset contains information on all the applicants to low-skilled white-collar
jobs—typically, customer service or sales representatives in a call center. Unsuccessful
applicants show up only once in the data. Successful applicants will typically occur re-
peatedly in the dataset, with reoccurrences indicating key HR events such as changes in
position or termination. The data cover the period May 2008 to January 2014. The data
are provided by a hiring consultancy whose business model was to provide a number of
corporate clients with hiring recommendations. In the process, the consultancy admin-
istered pre-employment exams, including the psychological questions examined here.
After dropping repeated observations referring to the same worker, we are left with
1,163,384 observations, each of which refers to a unique applicant. We further drop a
comparatively small number of observations that pertain to establishments located out-
side of the USA. We are left with 1,144,575 observations and will refer to this dataset
as the “applicant pool.” Table 1, panel A, provides summary statistics about the
Minor et al. IZA Journal of Labor Policy (2018) 7:8 Page 5 of 49
available variables for the applicant pool. Note that fields are often missing. We believe
this occurred because different clients requested that the consultancy collect different
data and provided different elements of their own data for merging. For most appli-
cants, we have data on schooling and prior jobs. The school variable is an indicator that
equals 1 if the applicant has schooling above high school.12 Two variables indicate the
applicant’s stability on previous jobs. The fewer_short_jobs variable codes the answer to
the question “In the last five years, how many full-time jobs have you held for less than
six months, other than jobs you had while in school?” This variable takes value − 1
when the answer was “None,” − 2 when the answer was “One job,” all the way down to
− 5 when the answer was “More than 6 jobs.” The variable longest_job codes the an-
swer to the question “What is the longest amount of time that you ever worked for a
single company?” This variable takes value 1 when the answer was “Not applicable/Less
than 3 months,” all the way up to 6 when the answer was “More than 5 years.” The
variable hired records whether the applicant was in fact hired.
The variable pre_crim is a field that can be zero or one, depending on whether the
applicant is recorded as having a criminal history. This field is recorded for only about
264,000 observations out of the entire sample. Because this is the key variable in this
paper, we investigated possible reasons why it could be missing. We concluded, based
on a cross-analysis with other missing fields, that the occurrences in which pre_crim is
missing reflect a deliberate decision by an employer not to collect criminal records in-
formation, rather than a choice by an applicant to not respond.13 We are somewhat
reassured by this conclusion, but still we acknowledge that a selection bias might occur
if, even within our narrow occupational range, some jobs entailed a higher risk or cost
Table 1 Summary statistics for the applicant pool
Mean sd Min Max Count
Panel A: Summary statistics for the applicant pool, all observations
crim_rec .0850228 .2789161 0 1 264,094
school .4339291 .4956163 0 1 285,065
fewer_short_jobs − 1.783947 .8724028 − 5 − 1 753,259
longest_job 4.351786 1.417482 1 6 760,943
position_id 520.7322 304.4393 193 1233 264,094
loc_new 86.18591 53.31425 1 148 242,681
job_app_ .2060669 .4044793 0 1 1,144,575
hired .0515274 .221071 0 1 1,144,575
Observations 1,144,575
Panel B: Summary statistics for the applicant pool, sample estimated
crim_rec .0996549 .2995413 0 1 73,885
school .2711511 .4445569 0 1 73,885
fewer_short_jobs − 1.85966 .861079 − 5 − 1 73,885
longest_job 4.431501 1.29493 1 6 73,884
position_id 398.3541 235.7445 193 1117 73,885
loc_new 91.80543 58.9545 1 147 73,885
job_app_ 1 0 1 1 73,885
hired .1934628 .3950153 0 1 73,885
Observations 73,885
Minor et al. IZA Journal of Labor Policy (2018) 7:8 Page 6 of 49
of crime. Such employers would be less likely than average to hire applicants with a
criminal record. However, no evidence of such selection is evident in our data.14 The
applicant pool contains 110,023 observations that have data on criminal record, school-
ing, and job stability. The data do not contain the position_type, firm, or location for
applicants who were not hired, but for many non-hired applicants we were able to re-
construct the values for position and location.15 We were not able to reconstruct values
for the firm applied to. However, the data indicate a good though not perfect associ-
ation between firms and location. As discussed below, our sample of the hired was lim-
ited to sales and customer service workers, so for consistency, we also limited our
applicant sample to these jobs. After dropping observations for other positions and
where key fields were missing, we were left with 73,885 observations described in Table
1, panel B.
Table 2, panel A, provides summary statistics for the subset of applicants who were
in fact hired. We refer to this subset as the “hired pool.” A number of additional vari-
ables are available for hired workers. For example, hired employees have an anon-
ymized identifier of their employer called firm_id; a location field that encodes the city
and state in which the employee was hired16; a position_type field describing the type
of job held by the worker (agent, customer service, sales, technical support, or other)17;
a variable LOE recording the length of employment, in days18; and the cause of termin-
ation either voluntary (TERM_V) or involuntary (TERM_I) when known.19 For 4.5% of
our employees, the cause of termination was “misconduct.” All applicants took a per-
sonality test that including three proprietary questions and 15 FFA questions. The 15
FFA questions were grouped by the consultancy’s industrial psychologist into the stand-
ard FFA categories of conscientiousness, agreeableness, neuroticism, extraversion, and
openness to experience.20 Our variables neurtot, opentot, extratot, contot, and agreetot
represent the sum total of answers chosen that support the respective personality factor
of the FFA. These values can range from zero to three for each of these variables. Our
variables neur1-neur3 and so on represent answers to individual questions that
support the respective personality factor of the FFA. The three proprietary vari-
ables—badservice, confidence_regress, and rulebreaker—will be described in greater
detail in Section 6.
The total number of hired applicants is 58,977. Criminal record was only available
for a subset of the sample, leaving 18,142 observations of hired workers. In most of our
estimates, the employee’s position was an important control, and the limited availability
of pre_crim reduced the number of observations for jobs other than sales and customer
support below the usable level.21 Retaining only customer service and sales left 17,256
observations, or over 95% of all those hired for whom we had criminal record informa-
tion. Finally, we eliminated observations which did not have all of our explanatory vari-
ables (job stability, school, and the psychometric variables) or outcome variables
(related to turnover), leaving a total sample of 10,699 hired workers described in Table
2, panel B.
4 Hiring penalty attached to criminal record and selection biasWe examine the hiring penalty attached to a criminal record and the resulting selection
bias in the pool of employees with a criminal record. We restrict attention to the
Minor et al. IZA Journal of Labor Policy (2018) 7:8 Page 7 of 49
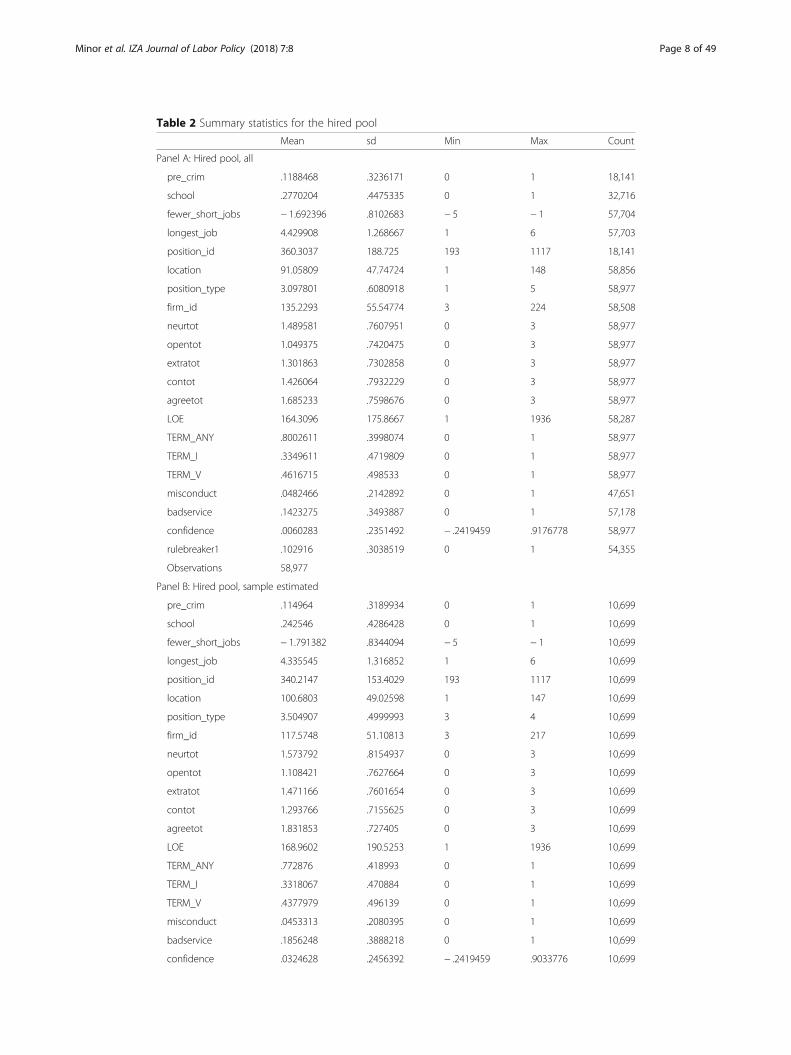
Table 2 Summary statistics for the hired pool
Mean sd Min Max Count
Panel A: Hired pool, all
pre_crim .1188468 .3236171 0 1 18,141
school .2770204 .4475335 0 1 32,716
fewer_short_jobs − 1.692396 .8102683 − 5 − 1 57,704
longest_job 4.429908 1.268667 1 6 57,703
position_id 360.3037 188.725 193 1117 18,141
location 91.05809 47.74724 1 148 58,856
position_type 3.097801 .6080918 1 5 58,977
firm_id 135.2293 55.54774 3 224 58,508
neurtot 1.489581 .7607951 0 3 58,977
opentot 1.049375 .7420475 0 3 58,977
extratot 1.301863 .7302858 0 3 58,977
contot 1.426064 .7932229 0 3 58,977
agreetot 1.685233 .7598676 0 3 58,977
LOE 164.3096 175.8667 1 1936 58,287
TERM_ANY .8002611 .3998074 0 1 58,977
TERM_I .3349611 .4719809 0 1 58,977
TERM_V .4616715 .498533 0 1 58,977
misconduct .0482466 .2142892 0 1 47,651
badservice .1423275 .3493887 0 1 57,178
confidence .0060283 .2351492 − .2419459 .9176778 58,977
rulebreaker1 .102916 .3038519 0 1 54,355
Observations 58,977
Panel B: Hired pool, sample estimated
pre_crim .114964 .3189934 0 1 10,699
school .242546 .4286428 0 1 10,699
fewer_short_jobs − 1.791382 .8344094 − 5 − 1 10,699
longest_job 4.335545 1.316852 1 6 10,699
position_id 340.2147 153.4029 193 1117 10,699
location 100.6803 49.02598 1 147 10,699
position_type 3.504907 .4999993 3 4 10,699
firm_id 117.5748 51.10813 3 217 10,699
neurtot 1.573792 .8154937 0 3 10,699
opentot 1.108421 .7627664 0 3 10,699
extratot 1.471166 .7601654 0 3 10,699
contot 1.293766 .7155625 0 3 10,699
agreetot 1.831853 .727405 0 3 10,699
LOE 168.9602 190.5253 1 1936 10,699
TERM_ANY .772876 .418993 0 1 10,699
TERM_I .3318067 .470884 0 1 10,699
TERM_V .4377979 .496139 0 1 10,699
misconduct .0453313 .2080395 0 1 10,699
badservice .1856248 .3888218 0 1 10,699
confidence .0324628 .2456392 − .2419459 .9033776 10,699
Minor et al. IZA Journal of Labor Policy (2018) 7:8 Page 8 of 49
sample of applicants for sales or customer service jobs for whom we have information
about criminal record and all controls.
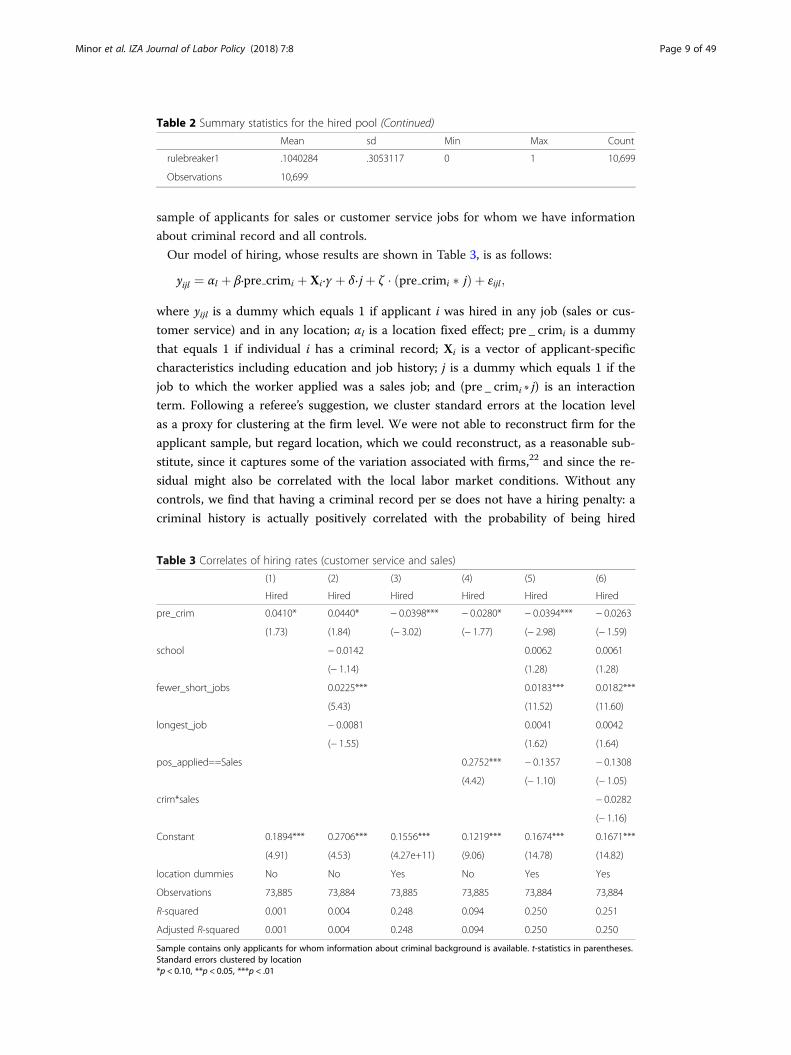
Our model of hiring, whose results are shown in Table 3, is as follows:
yijl ¼ αl þ β∙pre crimi þ Χi∙γ þ δ∙ jþ ζ � pre crimi � jð Þ þ εijl;
where yijl is a dummy which equals 1 if applicant i was hired in any job (sales or cus-
tomer service) and in any location; αl is a location fixed effect; pre _ crimi is a dummy
that equals 1 if individual i has a criminal record; Χi is a vector of applicant-specific
characteristics including education and job history; j is a dummy which equals 1 if the
job to which the worker applied was a sales job; and (pre _ crimi ∗ j) is an interaction
term. Following a referee’s suggestion, we cluster standard errors at the location level
as a proxy for clustering at the firm level. We were not able to reconstruct firm for the
applicant sample, but regard location, which we could reconstruct, as a reasonable sub-
stitute, since it captures some of the variation associated with firms,22 and since the re-
sidual might also be correlated with the local labor market conditions. Without any
controls, we find that having a criminal record per se does not have a hiring penalty: a
criminal history is actually positively correlated with the probability of being hired
Table 2 Summary statistics for the hired pool (Continued)
Mean sd Min Max Count
rulebreaker1 .1040284 .3053117 0 1 10,699
Observations 10,699
Table 3 Correlates of hiring rates (customer service and sales)
(1) (2) (3) (4) (5) (6)
Hired Hired Hired Hired Hired Hired
pre_crim 0.0410* 0.0440* − 0.0398*** − 0.0280* − 0.0394*** − 0.0263
(1.73) (1.84) (− 3.02) (− 1.77) (− 2.98) (− 1.59)
school − 0.0142 0.0062 0.0061
(− 1.14) (1.28) (1.28)
fewer_short_jobs 0.0225*** 0.0183*** 0.0182***
(5.43) (11.52) (11.60)
longest_job − 0.0081 0.0041 0.0042
(− 1.55) (1.62) (1.64)
pos_applied==Sales 0.2752*** − 0.1357 − 0.1308
(4.42) (− 1.10) (− 1.05)
crim*sales − 0.0282
(− 1.16)
Constant 0.1894*** 0.2706*** 0.1556*** 0.1219*** 0.1674*** 0.1671***
(4.91) (4.53) (4.27e+11) (9.06) (14.78) (14.82)
location dummies No No Yes No Yes Yes
Observations 73,885 73,884 73,885 73,885 73,884 73,884
R-squared 0.001 0.004 0.248 0.094 0.250 0.251
Adjusted R-squared 0.001 0.004 0.248 0.094 0.250 0.250
Sample contains only applicants for whom information about criminal background is available. t-statistics in parentheses.Standard errors clustered by location*p < 0.10, **p < 0.05, ***p < .01
Minor et al. IZA Journal of Labor Policy (2018) 7:8 Page 9 of 49
(Table 3, column 1). This average effect can be gleaned directly from a comparison with
pre_crim means in Tables 1 and 2, which shows that there are more individuals with a
criminal background among the hired than in the applicant pool. The human cap-
ital controls alone do not change the positive effect of the criminal record (Table
3, column 2).
However, after controlling for either location or the position to which the applicant
applied, the effect of a criminal record becomes negative (Table 3, columns 3–4), as
suggested by previous studies (Pager 2003; Holzer et al. 2004, 2006; Uggen et al. 2014;
Agan and Starr 2018; Doleac and Hansen 2016). With full controls other than the pos-
ition interaction term (column 5), a criminal record lowers the probability of being
hired about 4% from the 20% absolute probability of being hired in our sample. Com-
parable results for the sign and magnitude of the effect of a criminal record are found
when a logit model of the same variables is estimated (Table 15 in Appendix 1).
This coefficient reversal from columns 1 and 2 to 3 through 6 suggests that those
with a criminal history in our sample are applying to jobs and in locations with better
hiring rates than those of the average position. To explore whether these higher hiring
rates are for the job generally or represent a greater willingness to hire applicants with
criminal records, we add an interaction of sales with pre_crim. The results, which are
reported in column 6, suggest possible heterogeneity of the hiring penalty across posi-
tions. The baseline customer service positions have a penalty of 2.6% while sales posi-
tions have a hiring penalty of an additional 2.8% for a total of 5.4%, although neither
coefficient is significant. The logit version does not show a significant difference be-
tween the hiring penalty for the two jobs (Table 15 in Appendix 1, column 6).
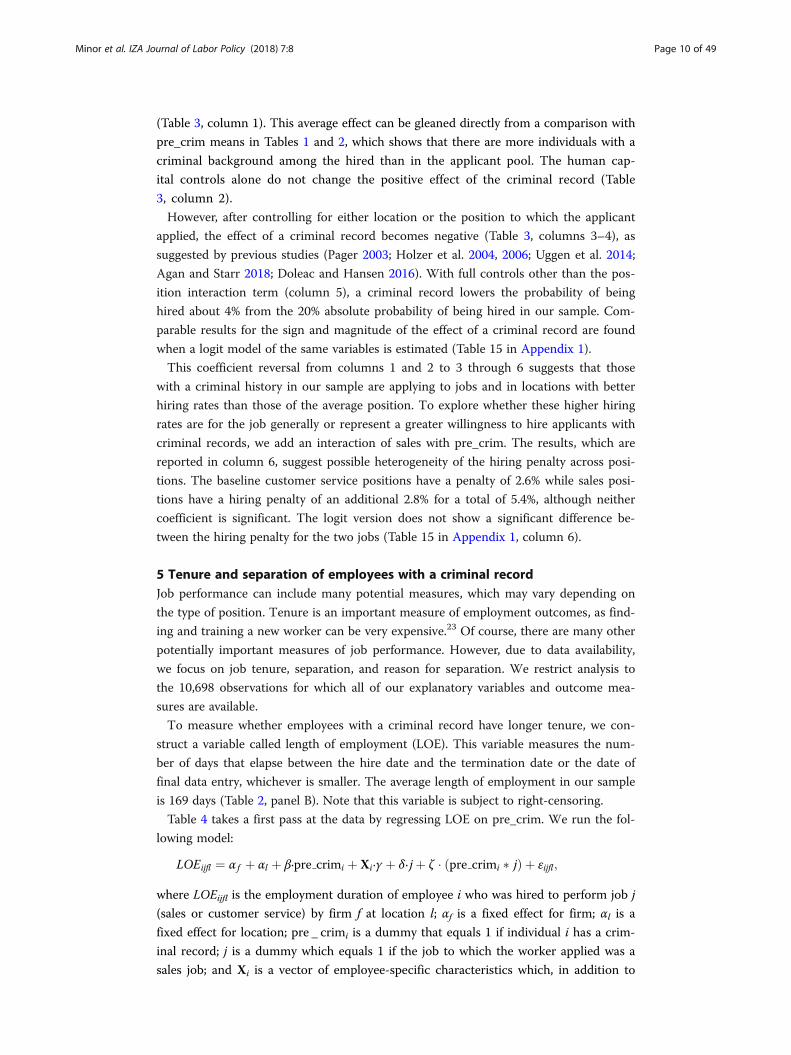
5 Tenure and separation of employees with a criminal recordJob performance can include many potential measures, which may vary depending on
the type of position. Tenure is an important measure of employment outcomes, as find-
ing and training a new worker can be very expensive.23 Of course, there are many other
potentially important measures of job performance. However, due to data availability,
we focus on job tenure, separation, and reason for separation. We restrict analysis to
the 10,698 observations for which all of our explanatory variables and outcome mea-
sures are available.
To measure whether employees with a criminal record have longer tenure, we con-
struct a variable called length of employment (LOE). This variable measures the num-
ber of days that elapse between the hire date and the termination date or the date of
final data entry, whichever is smaller. The average length of employment in our sample
is 169 days (Table 2, panel B). Note that this variable is subject to right-censoring.
Table 4 takes a first pass at the data by regressing LOE on pre_crim. We run the fol-
lowing model:
LOEijfl ¼ α f þ αl þ β∙pre crimi þ Χi∙γ þ δ∙ jþ ζ � pre crimi � jð Þ þ εijfl;
where LOEijfl is the employment duration of employee i who was hired to perform job j
(sales or customer service) by firm f at location l; αf is a fixed effect for firm; αl is a
fixed effect for location; pre _ crimi is a dummy that equals 1 if individual i has a crim-
inal record; j is a dummy which equals 1 if the job to which the worker applied was a
sales job; and Χi is a vector of employee-specific characteristics which, in addition to
Minor et al. IZA Journal of Labor Policy (2018) 7:8 Page 10 of 49
Table
4Correlatesof
leng
thof
employmen
t,OLS
(1)
(2)
(3)
(4)
(5)
(6)
(7)
(8)
(9)
(10)
(11)
(12)
All
All
All
All
Sales
Sales
Sales
Sales
Cust.Serv.
Cust.Serv.
Cust.Serv.
Cust.Serv.
pre_crim
18.9664**
16.7731**
16.5098**
17.7470**
18.6532
15.5804
15.1885
16.0485
20.6284**
19.6851**
19.4344**
22.4486**
(2.41)
(2.40)
(2.35)
(2.61)
(1.69)
(1.62)
(1.59)
(1.68)
(2.23)
(2.12)
(2.03)
(2.46)
sales
−113.4119***
−118.8626***
−124.0721***
−69.9048***
(−7.46)
(−7.56)
(−8.27)
(−3.24)
scho
ol−1.2225
−2.4141
−1.7923
1.9270
0.9519
0.5464
−3.3279
−4.6141*
−3.1864
(−0.48)
(−0.91)
(−0.71)
(0.50)
(0.23)
(0.14)
(−1.36)
(−1.69)
(−1.12)
fewer_sho
rt_job
s8.3934***
8.0471***
7.3944***
8.6225*
8.3008*
8.0564*
7.9525***
7.4542***
6.2850***
(3.45)
(3.29)
(3.11)
(1.96)
(1.87)
(1.80)
(3.84)
(3.54)
(3.09)
long
est_job
7.8540***
7.4660***
8.2519***
8.9060***
8.4112***
9.4796***
6.3588***
5.8821***
6.9036***
(4.72)
(4.44)
(4.96)
(3.33)
(3.10)
(3.72)
(5.45)
(5.43)
(5.56)
badservice
4.7773
8.3546
−2.3144
(1.19)
(1.19)
(−0.68)
confiden
ce−25.6951***
−25.8342***
−27.5452*
(−3.58)
(−4.78)
(−1.75)
rulebreaker1
4.6127
−3.8881
15.0785**
(1.07)
(−0.94)
(2.66)
open
110.7522***
10.9779**
10.5110**
(3.24)
(2.37)
(2.18)
open
2−29.8031*
72.8791***
−39.7706**
(−1.78)
(6.21)
(−2.51)
open
31.5238
−0.8795
3.5340
(0.37)
(−0.15)
(0.52)
con1
4.2707
1.0363
7.7012**
Minor et al. IZA Journal of Labor Policy (2018) 7:8 Page 11 of 49
Table
4Correlatesof
leng
thof
employmen
t,OLS
(Con
tinued)
(1)
(2)
(3)
(4)
(5)
(6)
(7)
(8)
(9)
(10)
(11)
(12)
All
All
All
All
Sales
Sales
Sales
Sales
Cust.Serv.
Cust.Serv.
Cust.Serv.
Cust.Serv.
(1.54)
(0.26)
(2.47)
con2
6.5186**
4.9525
8.4729
(2.00)
(0.84)
(1.64)
con3
−19.4901***
−9.5269
−21.9944***
(−4.17)
(−0.48)
(−4.48)
extra1
−7.9939**
−15.3407***
1.3196
(−2.20)
(−3.34)
(0.26)
extra2
−10.7999*
−14.3397***
−3.9990
(−1.79)
(−5.00)
(−0.26)
extra3
11.5721***
12.8660***
10.5244**
(4.09)
(4.44)
(2.24)
agree1
5.5521
12.7077
−2.5295
(1.02)
(1.69)
(−0.60)
agree2
0.7225
−4.5640
5.6775
(0.24)
(−1.19)
(1.09)
agree3
−44.5771**
50.9987***
−44.5049**
(−2.56)
(11.38)
(−2.55)
neur1
−0.4072
−1.6039
1.1931
(−0.10)
(−0.25)
(0.25)
neur2
2.0334
3.8971
0.0249
(0.69)
(0.84)
(0.01)
neur3
9.5797**
6.7000
17.1011***
(2.12)
(0.89)
(4.07)
Minor et al. IZA Journal of Labor Policy (2018) 7:8 Page 12 of 49
Table
4Correlatesof
leng
thof
employmen
t,OLS
(Con
tinued)
(1)
(2)
(3)
(4)
(5)
(6)
(7)
(8)
(9)
(10)
(11)
(12)
All
All
All
All
Sales
Sales
Sales
Sales
Cust.Serv.
Cust.Serv.
Cust.Serv.
Cust.Serv.
Con
stant
247.0000
240.7641***
233.9013***
290.4578***
−41.5923***
−66.9899**
−78.0466***
−125.3095***
247.0000
245.4222***
227.7935***
279.5057***
(.)(23.63)
(24.17)
(17.88)
(−4.30)
(−2.90)
(−3.23)
(−3.51)
(.)(26.80)
(21.28)
(17.30)
firm_iddu
mmies
Yes
Yes
Yes
Yes
Yes
Yes
Yes
Yes
Yes
Yes
Yes
Yes
locatio
ndu
mmies
Yes
Yes
Yes
Yes
Yes
Yes
Yes
Yes
Yes
Yes
Yes
Yes
Observatio
ns10,699
10,699
10,699
10,699
5402
5402
5402
5402
5297
5297
5297
5297
Notes:Sam
plecontains
onlyhiredworkers
forwhich
inform
ationab
outcrim
inal
backgrou
ndisavailable.
t-statisticsin
parenthe
ses.Stan
dard
errors
clusteredby
firm
*p<0.10
,**p
<0.05
,***p<.01
Minor et al. IZA Journal of Labor Policy (2018) 7:8 Page 13 of 49
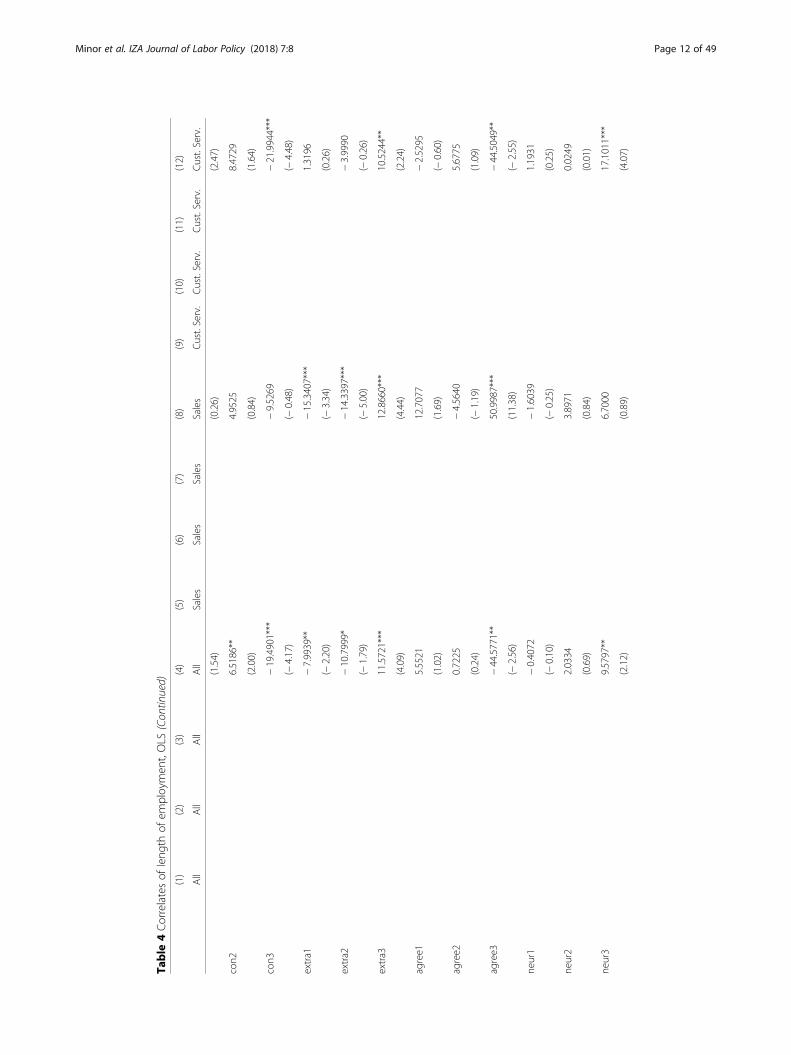
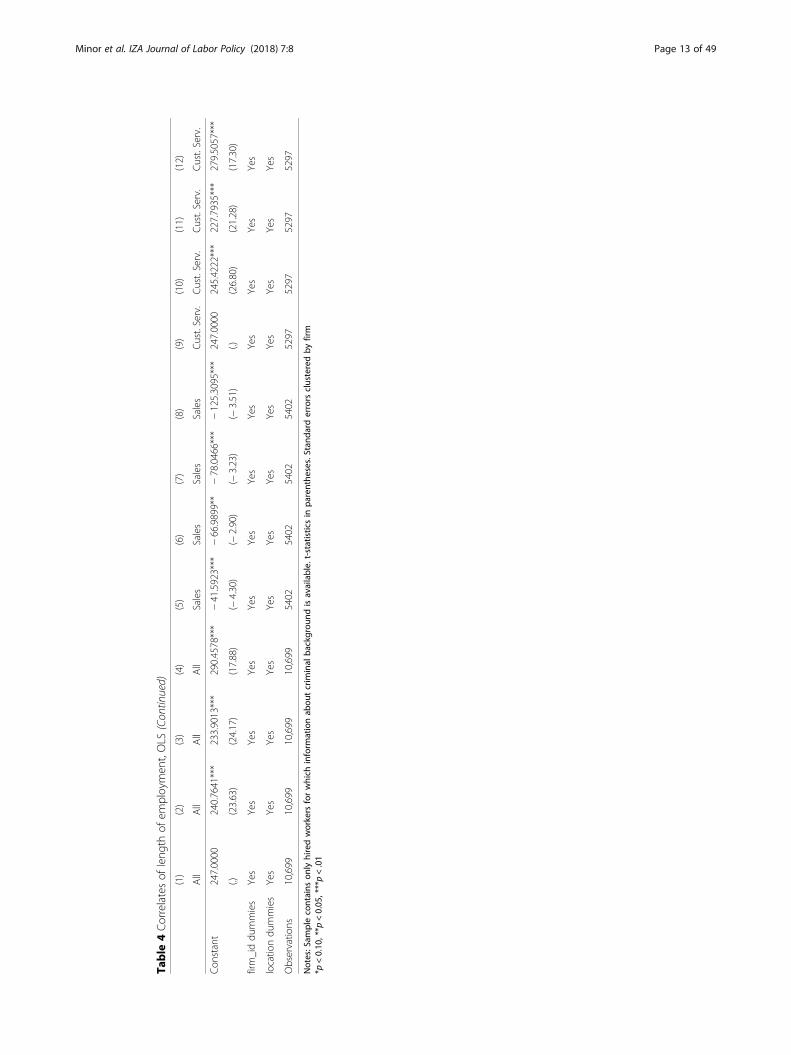
education and job history, now includes psychometric measurements. Following a ref-
eree’s suggestion we cluster standard errors at the firm level.
For the sample of both sales and customer service employees and with controls only
for location, position, and firm, the estimates indicate that employees with a criminal
background stay employed on average 19 days longer than those who do not have a
criminal background (Table 4, column 1).
LOE combines the effect of voluntary and involuntary terminations. Involuntary termin-
ation is by definition associated with weaker performance, while studies indicate that vol-
untary termination is most common among highest and lowest performers.24 The
expected sign of the human capital variables is thus ambiguous, since departing em-
ployees include both the best and the worst. Schooling does not predict LOE, but the co-
efficients on both job history variables are positive and statistically significant in all
specifications (Table 4, columns 2–4). Job history and school together reduce the LOE as-
sociated with pre_crim by about 2 days (Table 4, columns 1–2). Controlling for propri-
etary psychometric variables and FFA reduce the additional LOE of employees with
criminal records to about 16.5 and 17.7 days, respectively (Table 4, columns 3–4). The
effect of the psychometric variables will be considered at more length in the next section.
To quantify the economic significance of longer LOE, we obtained estimates from
the consultancy on the average cost of replacing a worker found in our dataset. This
figure amounted to $4000 per termination. At average values of other variables, a
worker without a criminal record lasts 167 days while a worker with a record lasts
183 days.25 Since the average wage for call center employees is about $30,000 per year,
this amounts to a savings of about 2.5% of wages per year for these employees.26 How-
ever, if applicants with records were hired in greater numbers, their quality, and there-
fore the associated employer savings, might well drop.
The LOE of employees varies strikingly with the job held (Table 4, columns 1–4).
Because the effect is so large, we examine the possibility that different models underlie
each job (Table 4, columns 5–12). With only location and firm as controls, sales people
with criminal records last about 19 days longer than others, while customer service
agents with a record last about 21 days longer. The coefficient in the sales estimate is
not significant; the p values are between .11 and .14. Schooling has no effect in any esti-
mate. In most specifications, the job stability and school variables together reduce the
effect of a criminal record slightly. The psychometric variables will be discussed in the
next section.
We next conduct a more refined analysis to account both for different types of separ-
ation and for the censoring that results from the unknown ultimate length of employ-
ment of those workers who were employed when the data collection ended. About 77%
of all workers had separated by the end of data collection, and about 55% of all separa-
tions were voluntary. We run the following Cox proportional hazards model to predict
employment tenure:
hijfl ¼ h0 tð Þ � exp α f þ αl þ β � pre crimi þ Χi � γ þ δ � j� �;
where hijfl is the hazard that employee i, who was hired to perform job j (sales or cus-
tomer service) by firm f at location l, separates t days after being hired; h0(t) is the base-
line hazard rate; αf is a fixed effect for firm; αl is a fixed effect for location; pre _ crimi is
a dummy that equals 1 if individual i has a criminal record; Χi is a vector of employee-
Minor et al. IZA Journal of Labor Policy (2018) 7:8 Page 14 of 49
specific characteristics; and j is a dummy which equals 1 if the job to which the worker
applied was a sales job.
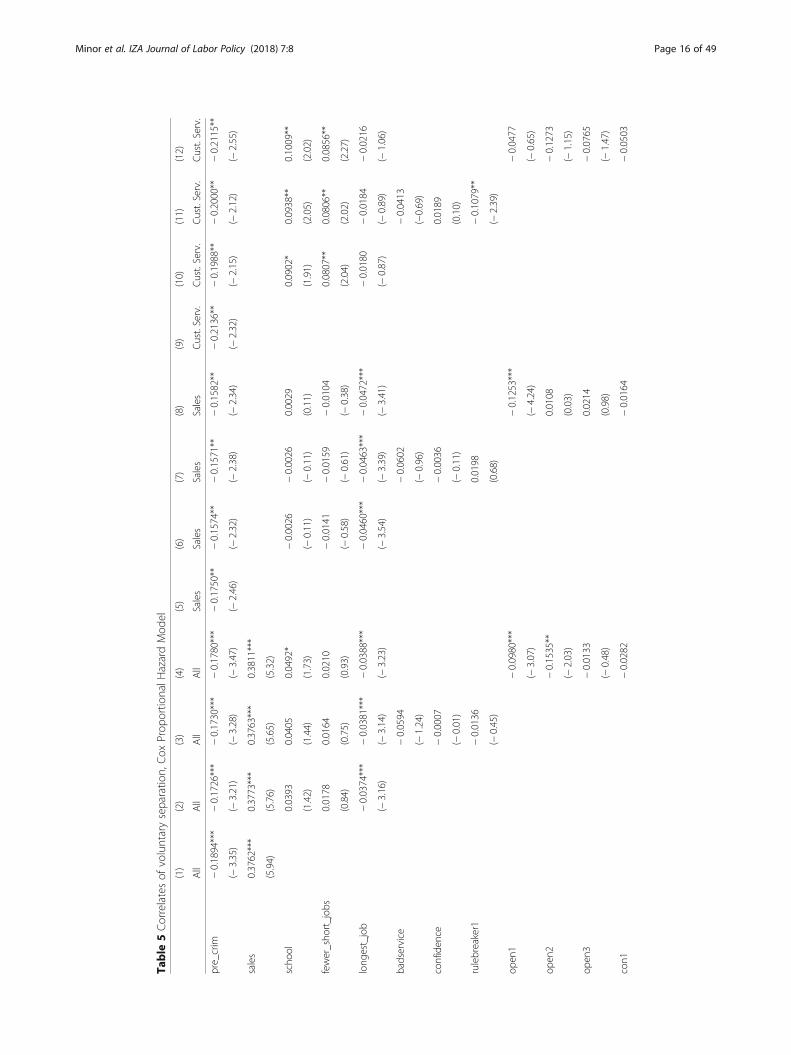
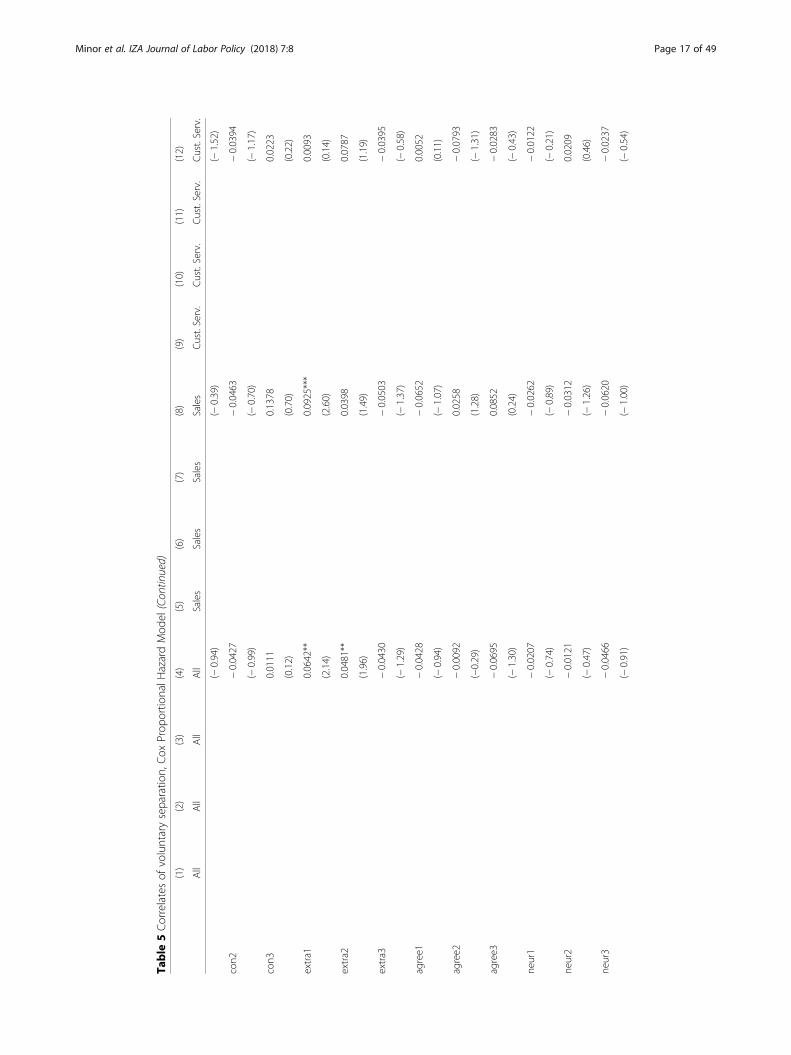
We begin by applying this model to voluntary separations. Table 5 provides the esti-
mated coefficients of a Cox proportional hazard model in which only voluntary separa-
tions are counted as “failures.” For the whole pool, a criminal background has a
consistently negative and statistically significant impact on voluntary separations, sug-
gesting that having a criminal background makes an employee less likely to leave volun-
tarily (Table 5, columns 1–4). This result could be due to several factors. Workers with
a criminal record presumably have fewer external labor market opportunities. They
may also feel a sense of loyalty or gratitude to an employer who has given them a sec-
ond chance. Again, the coefficient on job type is highly significant (Table 5, columns
1–4), and we therefore also examine each job separately (Table 5, columns 5–12). A
criminal record decreases the voluntary separation rates of customer service employees
more than that of sales employees, though both effects are significant and negative
(Table 5, columns 5–12). Like LOE, voluntary departures are driven by a mix of high
and low performers, and thus, the expected signs on the human capital coefficients are
ambiguous. Schooling seldom predicts voluntary separation for either the entire sample
or for the sales sample, but for the customer service sample is positive and significant
at the 5 or 10% level (Table 5, columns 2–4, 6–8, and 10–12). One of the job history
variables, longest_job, is significant and negative for the whole sample and sales, but is
insignificant for customer service; the other, fewer_short_jobs is significant (and posi-
tive) for customer service only and insignificant otherwise (Table 5, columns 2–4, 6–8,
and 10–12). Two psychometric variables are predictive for sales and one is predictive
for customer service––we discuss these in more detail later.
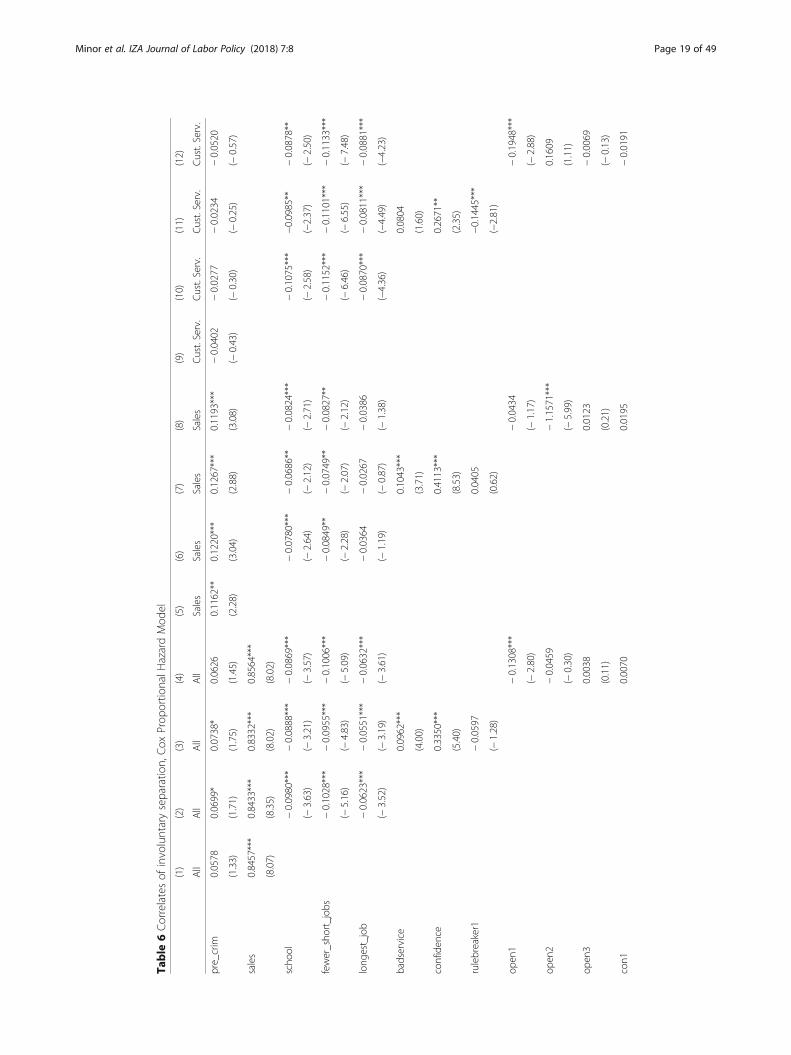
Table 6 provides the estimated coefficients of the Cox proportional hazard model in
which only involuntary terminations are counted as failures. Since involuntary termin-
ation is associated with lower quality workers, coefficients should now have the sign as-
sociated with lower quality. For the whole sample, a criminal background predict
involuntary terminations at the 10% significance level in two of four specifications.
(Table 6, columns 1–4). Other variables are much more significant. As expected, invol-
untary terminations are more likely among workers who would be regarded as lower
quality by traditional measures: better schooling (Table 6, columns 2–4) and higher job
stability (Table 6, columns 2–4) reduce involuntary termination in all four specifi-
cations at the 1% significance level. Again, the coefficient on a sales position is
highly significant (Table 6, columns 1–4), so we examine the two jobs separately.
A criminal record does not predict involuntary termination for customer service
jobs (Table 6, columns 9–12) but is highly predictive for sales jobs in all specifica-
tions (Table 6, columns 5–8). School and one job stability variable are, as expected,
negative and significant in all specifications in both positions. The other job stabil-
ity variable is negative for all specifications, but significant only for customer ser-
vice. Again, the psychometric predictors are somewhat different for the two jobs, a
finding we discuss further in the next section.
So far, the evidence on tenure has shown that having a criminal background makes
an employee less likely to leave voluntarily and likely to have a longer tenure. Em-
ployees with a criminal record are no more likely to be terminated involuntarily in cus-
tomer service positions, but more likely in a sales position. Since involuntary turnover
Minor et al. IZA Journal of Labor Policy (2018) 7:8 Page 15 of 49
Table
5Correlatesof
voluntaryseparatio
n,Cox
Prop
ortio
nalH
azardMod
el
(1)
(2)
(3)
(4)
(5)
(6)
(7)
(8)
(9)
(10)
(11)
(12)
All
All
All
All
Sales
Sales
Sales
Sales
Cust.Serv.
Cust.Serv.
Cust.Serv.
Cust.Serv.
pre_crim
−0.1894***
−0.1726***
−0.1730***
−0.1780***
−0.1750**
−0.1574**
−0.1571**
−0.1582**
−0.2136**
−0.1988**
−0.2000**
−0.2115**
(−3.35)
(−3.21)
(−3.28)
(−3.47)
(−2.46)
(−2.32)
(−2.38)
(−2.34)
(−2.32)
(−2.15)
(−2.12)
(−2.55)
sales
0.3762***
0.3773***
0.3763***
0.3811***
(5.94)
(5.76)
(5.65)
(5.32)
scho
ol0.0393
0.0405
0.0492*
−0.0026
−0.0026
0.0029
0.0902*
0.0938**
0.1009**
(1.42)
(1.44)
(1.73)
(−0.11)
(−0.11)
(0.11)
(1.91)
(2.05)
(2.02)
fewer_sho
rt_job
s0.0178
0.0164
0.0210
−0.0141
−0.0159
−0.0104
0.0807**
0.0806**
0.0856**
(0.84)
(0.75)
(0.93)
(−0.58)
(−0.61)
(−0.38)
(2.04)
(2.02)
(2.27)
long
est_job
−0.0374***
−0.0381***
−0.0388***
−0.0460***
−0.0463***
−0.0472***
−0.0180
−0.0184
−0.0216
(−3.16)
(−3.14)
(−3.23)
(−3.54)
(−3.39)
(−3.41)
(−0.87)
(−0.89)
(−1.06)
badservice
−0.0594
−0.0602
−0.0413
(−1.24)
(−0.96)
(−0.69)
confiden
ce−0.0007
−0.0036
0.0189
(−0.01)
(−0.11)
(0.10)
rulebreaker1
−0.0136
0.0198
−0.1079**
(−0.45)
(0.68)
(−2.39)
open
1−0.0980***
−0.1253***
−0.0477
(−3.07)
(−4.24)
(−0.65)
open
2−0.1535**
0.0108
−0.1273
(−2.03)
(0.03)
(−1.15)
open
3−0.0133
0.0214
−0.0765
(−0.48)
(0.98)
(−1.47)
con1
−0.0282
−0.0164
−0.0503
Minor et al. IZA Journal of Labor Policy (2018) 7:8 Page 16 of 49
Table
5Correlatesof
voluntaryseparatio
n,Cox
Prop
ortio
nalH
azardMod
el(Con
tinued)
(1)
(2)
(3)
(4)
(5)
(6)
(7)
(8)
(9)
(10)
(11)
(12)
All
All
All
All
Sales
Sales
Sales
Sales
Cust.Serv.
Cust.Serv.
Cust.Serv.
Cust.Serv.
(−0.94)
(−0.39)
(−1.52)
con2
−0.0427
−0.0463
−0.0394
(−0.99)
(−0.70)
(−1.17)
con3
0.0111
0.1378
0.0223
(0.12)
(0.70)
(0.22)
extra1
0.0642**
0.0925***
0.0093
(2.14)
(2.60)
(0.14)
extra2
0.0481**
0.0398
0.0787
(1.96)
(1.49)
(1.19)
extra3
−0.0430
−0.0503
−0.0395
(−1.29)
(−1.37)
(−0.58)
agree1
−0.0428
−0.0652
0.0052
(−0.94)
(−1.07)
(0.11)
agree2
−0.0092
0.0258
−0.0793
(−0.29)
(1.28)
(−1.31)
agree3
−0.0695
0.0852
−0.0283
(−1.30)
(0.24)
(−0.43)
neur1
−0.0207
−0.0262
−0.0122
(−0.74)
(−0.89)
(−0.21)
neur2
−0.0121
−0.0312
0.0209
(−0.47)
(−1.26)
(0.46)
neur3
−0.0466
−0.0620
−0.0237
(−0.91)
(−1.00)
(−0.54)
Minor et al. IZA Journal of Labor Policy (2018) 7:8 Page 17 of 49
Table
5Correlatesof
voluntaryseparatio
n,Cox
Prop
ortio
nalH
azardMod
el(Con
tinued)
(1)
(2)
(3)
(4)
(5)
(6)
(7)
(8)
(9)
(10)
(11)
(12)
All
All
All
All
Sales
Sales
Sales
Sales
Cust.Serv.
Cust.Serv.
Cust.Serv.
Cust.Serv.
firm_iddu
mmies
Yes
Yes
Yes
Yes
Yes
Yes
Yes
Yes
Yes
Yes
Yes
Yes
locatio
ndu
mmies
Yes
Yes
Yes
Yes
Yes
Yes
Yes
Yes
Yes
Yes
Yes
Yes
Observatio
ns10,699
10,699
10,699
10,699
5402
5402
5402
5402
5297
5297
5297
5297
Pseudo
R-squared
0.013
0.013
0.013
0.013
0.005
0.005
0.005
0.006
0.008
0.009
0.009
0.009
Samplecontains
only
hiredworkers
forwho
minform
ationab
outcrim
inal
backgrou
ndisavailable.
t-statisticsin
parenthe
ses.Stan
dard
errors
clusteredby
firm
*p<0.10
,**p
<0.05
,***p<.01
Minor et al. IZA Journal of Labor Policy (2018) 7:8 Page 18 of 49
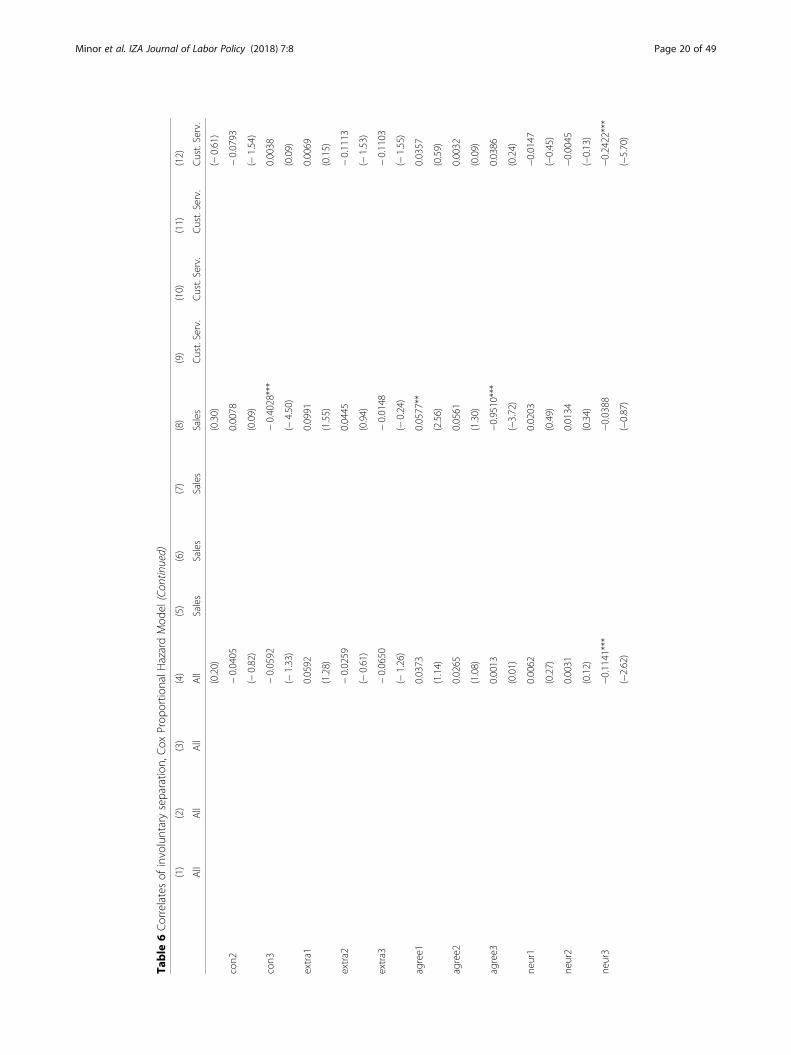
Table
6Correlatesof
involuntaryseparatio
n,Cox
Prop
ortio
nalH
azardMod
el
(1)
(2)
(3)
(4)
(5)
(6)
(7)
(8)
(9)
(10)
(11)
(12)
All
All
All
All
Sales
Sales
Sales
Sales
Cust.Serv.
Cust.Serv.
Cust.Serv.
Cust.Serv.
pre_crim
0.0578
0.0699*
0.0738*
0.0626
0.1162**
0.1220***
0.1267***
0.1193***
−0.0402
−0.0277
−0.0234
−0.0520
(1.33)
(1.71)
(1.75)
(1.45)
(2.28)
(3.04)
(2.88)
(3.08)
(−0.43)
(−0.30)
(−0.25)
(−0.57)
sales
0.8457***
0.8433***
0.8332***
0.8564***
(8.07)
(8.35)
(8.02)
(8.02)
scho
ol−0.0980***
−0.0888***
−0.0869***
−0.0780***
−0.0686**
−0.0824***
−0.1075***
−0.0985**
−0.0878**
(−3.63)
(−3.21)
(−3.57)
(−2.64)
(−2.12)
(−2.71)
(−2.58)
(−2.37)
(−2.50)
fewer_sho
rt_job
s−0.1028***
−0.0955***
−0.1006***
−0.0849**
−0.0749**
−0.0827**
−0.1152***
−0.1101***
−0.1133***
(−5.16)
(−4.83)
(−5.09)
(−2.28)
(−2.07)
(−2.12)
(−6.46)
(−6.55)
(−7.48)
long
est_job
−0.0623***
−0.0551***
−0.0632***
−0.0364
−0.0267
−0.0386
−0.0870***
−0.0811***
−0.0881***
(−3.52)
(−3.19)
(−3.61)
(−1.19)
(−0.87)
(−1.38)
(−4.36)
(−4.49)
(−4.23)
badservice
0.0962***
0.1043***
0.0804
(4.00)
(3.71)
(1.60)
confiden
ce0.3350***
0.4113***
0.2671**
(5.40)
(8.53)
(2.35)
rulebreaker1
−0.0597
0.0405
−0.1445***
(−1.28)
(0.62)
(−2.81)
open
1−0.1308***
−0.0434
−0.1948***
(−2.80)
(−1.17)
(−2.88)
open
2−0.0459
−1.1571***
0.1609
(−0.30)
(−5.99)
(1.11)
open
30.0038
0.0123
−0.0069
(0.11)
(0.21)
(−0.13)
con1
0.0070
0.0195
−0.0191
Minor et al. IZA Journal of Labor Policy (2018) 7:8 Page 19 of 49
Table
6Correlatesof
involuntaryseparatio
n,Cox
Prop
ortio
nalH
azardMod
el(Con
tinued)
(1)
(2)
(3)
(4)
(5)
(6)
(7)
(8)
(9)
(10)
(11)
(12)
All
All
All
All
Sales
Sales
Sales
Sales
Cust.Serv.
Cust.Serv.
Cust.Serv.
Cust.Serv.
(0.20)
(0.30)
(−0.61)
con2
−0.0405
0.0078
−0.0793
(−0.82)
(0.09)
(−1.54)
con3
−0.0592
−0.4028***
0.0038
(−1.33)
(−4.50)
(0.09)
extra1
0.0592
0.0991
0.0069
(1.28)
(1.55)
(0.15)
extra2
−0.0259
0.0445
−0.1113
(−0.61)
(0.94)
(−1.53)
extra3
−0.0650
−0.0148
−0.1103
(−1.26)
(−0.24)
(−1.55)
agree1
0.0373
0.0577**
0.0357
(1.14)
(2.56)
(0.59)
agree2
0.0265
0.0561
0.0032
(1.08)
(1.30)
(0.09)
agree3
0.0013
−0.9510***
0.0386
(0.01)
(−3.72)
(0.24)
neur1
0.0062
0.0203
−0.0147
(0.27)
(0.49)
(−0.45)
neur2
0.0031
0.0134
−0.0045
(0.12)
(0.34)
(−0.13)
neur3
−0.1141***
−0.0388
−0.2422***
(−2.62)
(−0.87)
(−5.70)
Minor et al. IZA Journal of Labor Policy (2018) 7:8 Page 20 of 49
Table
6Correlatesof
involuntaryseparatio
n,Cox
Prop
ortio
nalH
azardMod
el(Con
tinued)
(1)
(2)
(3)
(4)
(5)
(6)
(7)
(8)
(9)
(10)
(11)
(12)
All
All
All
All
Sales
Sales
Sales
Sales
Cust.Serv.
Cust.Serv.
Cust.Serv.
Cust.Serv.
firm_iddu
mmies
Yes
Yes
Yes
Yes
Yes
Yes
Yes
Yes
Yes
Yes
Yes
Yes
locatio
ndu
mmies
Yes
Yes
Yes
Yes
Yes
Yes
Yes
Yes
Yes
Yes
Yes
Yes
Observatio
ns10,699
10,699
10,699
10,699
5402
5402
5402
5402
5297
5297
5297
5297
Pseudo
R-squared
0.010
0.011
0.011
0.011
0.010
0.011
0.012
0.012
0.010
0.012
0.012
0.013
Samplecontains
only
hiredworkers
forwho
minform
ationab
outcrim
inal
backgrou
ndisavailable.
t-statisticsin
parenthe
ses.Stan
dard
errors
clusteredby
firm
*p<0.10
,**p
<0.05
,***p<.01
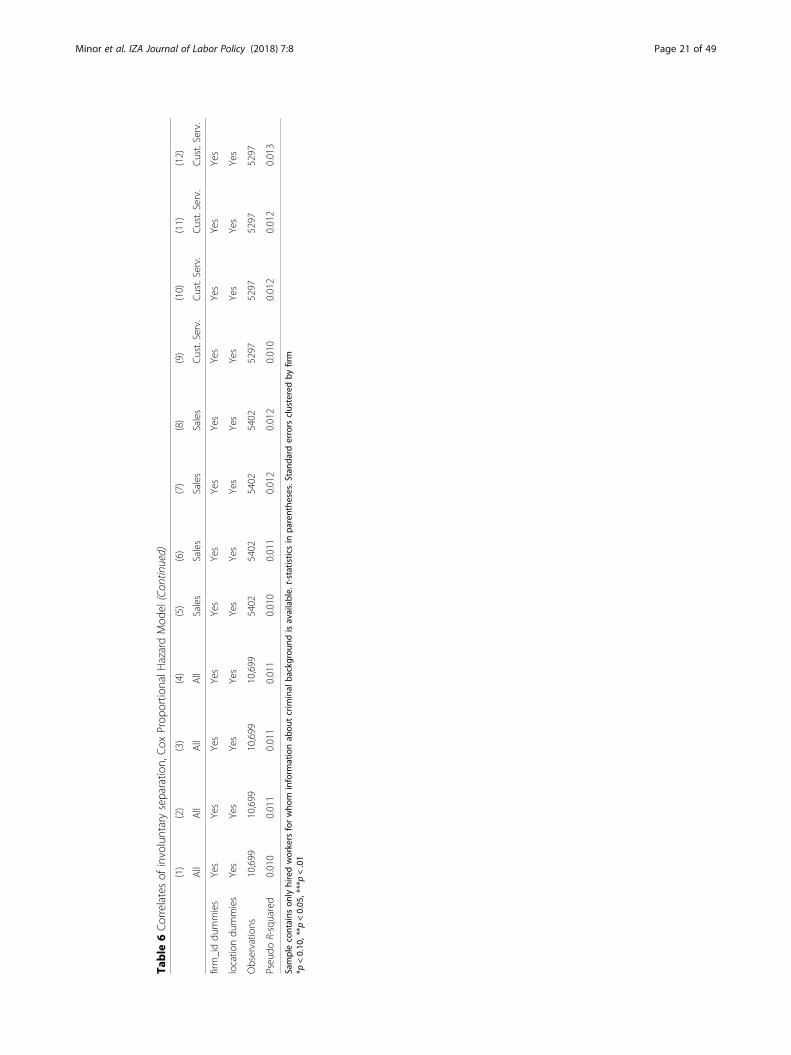
Minor et al. IZA Journal of Labor Policy (2018) 7:8 Page 21 of 49
is associated with weaker performance and turnover is costly, this evidence taken to-
gether suggests that customer service employees with a criminal background are, at
least at the current margin, a promising pool for employers. Sales employees present a
slightly more mixed picture, since they do appear to have higher rates of involuntary
terminations.
To further explore the cost of involuntary terminations, we examine a subset of these
terminations, those that involve misconduct. Note that the concept of “misconduct,” as
used in the human resource setting, corresponds to the definition found in unemploy-
ment insurance (UI) law. Employers keep records of misconduct discharges for the pur-
pose of UI reporting: if an employer discharges an employee for misconduct, the
employee receives reduced UI or none at all, and thus, the discharge has a lesser effect
on the employer’s UI premiums. Although the term “misconduct” seems to imply se-
vere misbehavior, it may also include much lesser failings such as excessive absenteeism
or even the use of profanity.27
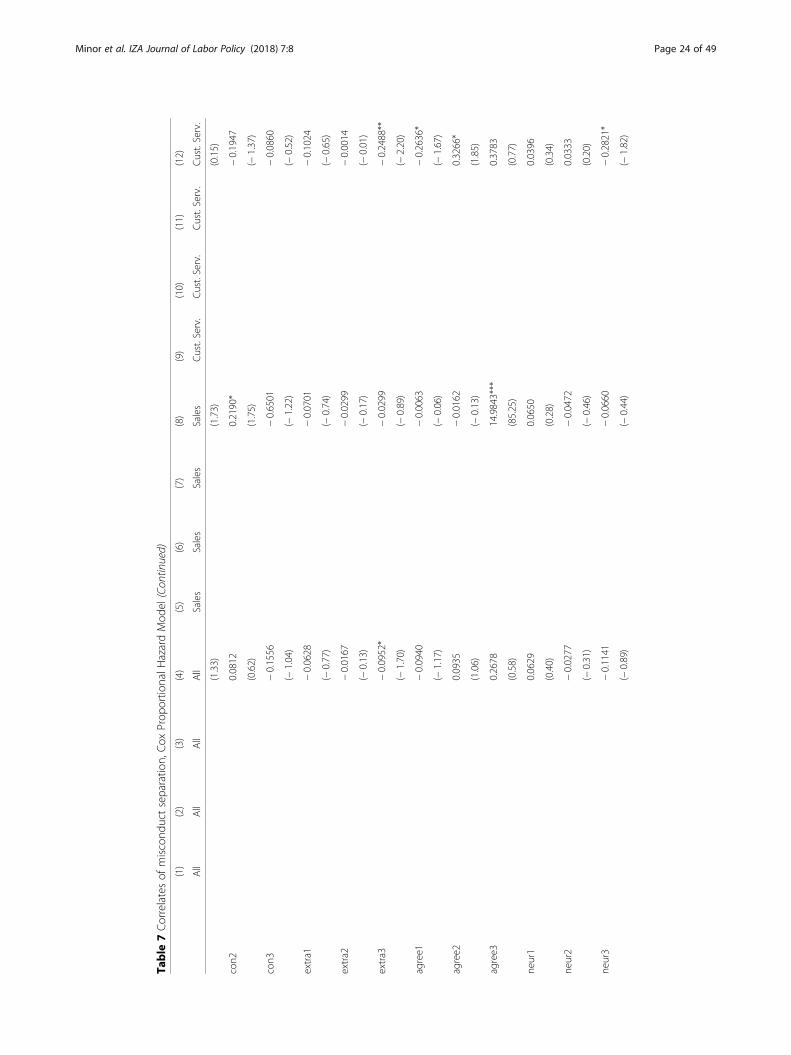
Misconduct discharges are a relatively rare event, occurring in 4.5% of our sample of
the hired (Table 2, panel B). Termination for misconduct is generally more common in
sales, occurring in 5.9% of sales positions compared with 3.1% of customer service posi-
tions. For the sample of both positions, a criminal record is associated with a higher
risk of misconduct (Table 7, columns 1–4). Because of the apparently different under-
lying models, we again examine each job separately. A criminal record is significantly
associated with an increased risk of misconduct in sales jobs (Table 7, columns 5–12).
Sales workers with a criminal record are about 34% more likely to be terminated for
misconduct than those without.28 In customer service jobs, the coefficient on a crim-
inal record is about 40% smaller than is sales and borderline significant, suggesting a
possible connection but weaker than that in sales.
Our results suggest that all employees with a criminal record have longer tenure and
lower voluntary turnover than other employees. Customer service employees with a
criminal record are also not significantly more likely to be terminated involuntarily or
for misconduct, though a higher misconduct rate cannot be ruled out. Sales employees
with a record display a more complicated pattern. The value of their longer tenure is at
least partly offset by their significant and slightly higher rates of involuntary discharge
and their significant and clearly higher rates of misconduct discharge. The discrepancy
between sales and customer service jobs is particularly striking since the hiring penalty
seems to be greater for sales jobs (Table 3, column 6): despite the higher degree of se-
lection, more misconduct is observed. We consider our finding a cautionary tale of the
risks of drawing broad conclusions based on one type of position or industry.
The observational nature of our data means that we cannot draw conclusions about
the pool of the non-hired, and applicants who were not hired may have been those at
greater risk of poor outcomes. Instead, since our estimates describe average values for
those hired, they are not conclusive of how marginal applicants with a criminal record
might perform. Although we have no direct evidence of which employees were mar-
ginal, we do have some indirect evidence. For each firm, we can calculate the percent
of the workforce with a criminal record (crimper) and examine the association of this
with the likelihood of misconduct by individual workers (Table 8). For the whole sam-
ple and the sales and customer service jobs estimated separately, we find that the
likelihood of misconduct is actually lower in firms with a larger number of workers
Minor et al. IZA Journal of Labor Policy (2018) 7:8 Page 22 of 49
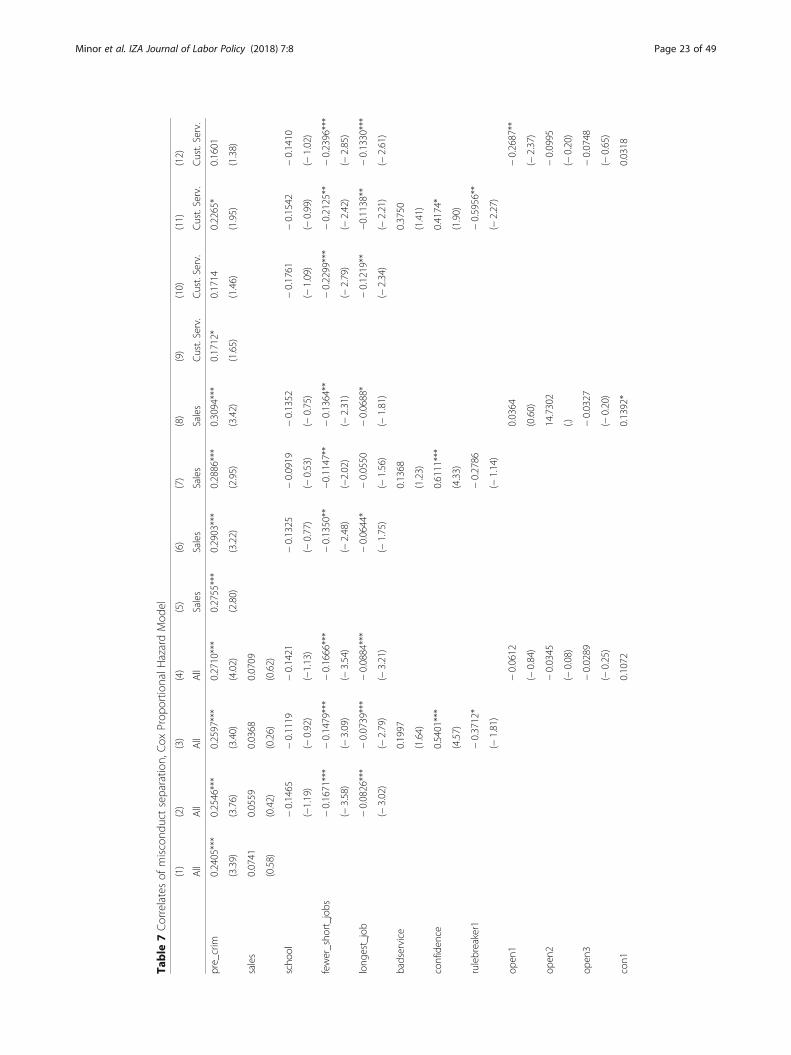
Table
7Correlatesof
miscond
uctseparatio
n,Cox
Prop
ortio
nalH
azardMod
el
(1)
(2)
(3)
(4)
(5)
(6)
(7)
(8)
(9)
(10)
(11)
(12)
All
All
All
All
Sales
Sales
Sales
Sales
Cust.Serv.
Cust.Serv.
Cust.Serv.
Cust.Serv.
pre_crim
0.2405***
0.2546***
0.2597***
0.2710***
0.2755***
0.2903***
0.2886***
0.3094***
0.1712*
0.1714
0.2265*
0.1601
(3.39)
(3.76)
(3.40)
(4.02)
(2.80)
(3.22)
(2.95)
(3.42)
(1.65)
(1.46)
(1.95)
(1.38)
sales
0.0741
0.0559
0.0368
0.0709
(0.58)
(0.42)
(0.26)
(0.62)
scho
ol−0.1465
−0.1119
−0.1421
−0.1325
−0.0919
−0.1352
−0.1761
−0.1542
−0.1410
(−1.19)
(−0.92)
(−1.13)
(−0.77)
(−0.53)
(−0.75)
(−1.09)
(−0.99)
(−1.02)
fewer_sho
rt_job
s−0.1671***
−0.1479***
−0.1666***
−0.1350**
−0.1147**
−0.1364**
−0.2299***
−0.2125**
−0.2396***
(−3.58)
(−3.09)
(−3.54)
(−2.48)
(−2.02)
(−2.31)
(−2.79)
(−2.42)
(−2.85)
long
est_job
−0.0826***
−0.0739***
−0.0884***
−0.0644*
−0.0550
−0.0688*
−0.1219**
−0.1138**
−0.1330***
(−3.02)
(−2.79)
(−3.21)
(−1.75)
(−1.56)
(−1.81)
(−2.34)
(−2.21)
(−2.61)
badservice
0.1997
0.1368
0.3750
(1.64)
(1.23)
(1.41)
confiden
ce0.5401***
0.6111***
0.4174*
(4.57)
(4.33)
(1.90)
rulebreaker1
−0.3712*
−0.2786
−0.5956**
(−1.81)
(−1.14)
(−2.27)
open
1−0.0612
0.0364
−0.2687**
(−0.84)
(0.60)
(−2.37)
open
2−0.0345
14.7302
−0.0995
(−0.08)
(.)(−
0.20)
open
3−0.0289
−0.0327
−0.0748
(−0.25)
(−0.20)
(−0.65)
con1
0.1072
0.1392*
0.0318
Minor et al. IZA Journal of Labor Policy (2018) 7:8 Page 23 of 49
Table
7Correlatesof
miscond
uctseparatio
n,Cox
Prop
ortio
nalH
azardMod
el(Con
tinued)
(1)
(2)
(3)
(4)
(5)
(6)
(7)
(8)
(9)
(10)
(11)
(12)
All
All
All
All
Sales
Sales
Sales
Sales
Cust.Serv.
Cust.Serv.
Cust.Serv.
Cust.Serv.
(1.33)
(1.73)
(0.15)
con2
0.0812
0.2190*
−0.1947
(0.62)
(1.75)
(−1.37)
con3
−0.1556
−0.6501
−0.0860
(−1.04)
(−1.22)
(−0.52)
extra1
−0.0628
−0.0701
−0.1024
(−0.77)
(−0.74)
(−0.65)
extra2
−0.0167
−0.0299
−0.0014
(−0.13)
(−0.17)
(−0.01)
extra3
−0.0952*
−0.0299
−0.2488**
(−1.70)
(−0.89)
(−2.20)
agree1
−0.0940
−0.0063
−0.2636*
(−1.17)
(−0.06)
(−1.67)
agree2
0.0935
−0.0162
0.3266*
(1.06)
(−0.13)
(1.85)
agree3
0.2678
14.9843***
0.3783
(0.58)
(85.25)
(0.77)
neur1
0.0629
0.0650
0.0396
(0.40)
(0.28)
(0.34)
neur2
−0.0277
−0.0472
0.0333
(−0.31)
(−0.46)
(0.20)
neur3
−0.1141
−0.0660
−0.2821*
(−0.89)
(−0.44)
(−1.82)
Minor et al. IZA Journal of Labor Policy (2018) 7:8 Page 24 of 49

Table
7Correlatesof
miscond
uctseparatio
n,Cox
Prop
ortio
nalH
azardMod
el(Con
tinued)
(1)
(2)
(3)
(4)
(5)
(6)
(7)
(8)
(9)
(10)
(11)
(12)
All
All
All
All
Sales
Sales
Sales
Sales
Cust.Serv.
Cust.Serv.
Cust.Serv.
Cust.Serv.
firm_iddu
mmies
Yes
Yes
Yes
Yes
Yes
Yes
Yes
Yes
Yes
Yes
Yes
Yes
locatio
ndu
mmies
Yes
Yes
Yes
Yes
Yes
Yes
Yes
Yes
Yes
Yes
Yes
Yes
Observatio
ns10,699
10,699
10,699
10,699
5402
5402
5402
5402
5297
5297
5297
5297
Pseudo
R-squared
0.033
0.035
0.038
0.037
0.016
0.017
0.020
0.019
0.044
0.049
0.053
0.056
Samplecontains
only
hiredworkers
forwho
minform
ationab
outcrim
inal
backgrou
ndisavailable.
t-statisticsin
parenthe
ses.Stan
dard
errors
clusteredby
firm
*p<0.10
,**p
<0.05
,***p<.01
Minor et al. IZA Journal of Labor Policy (2018) 7:8 Page 25 of 49
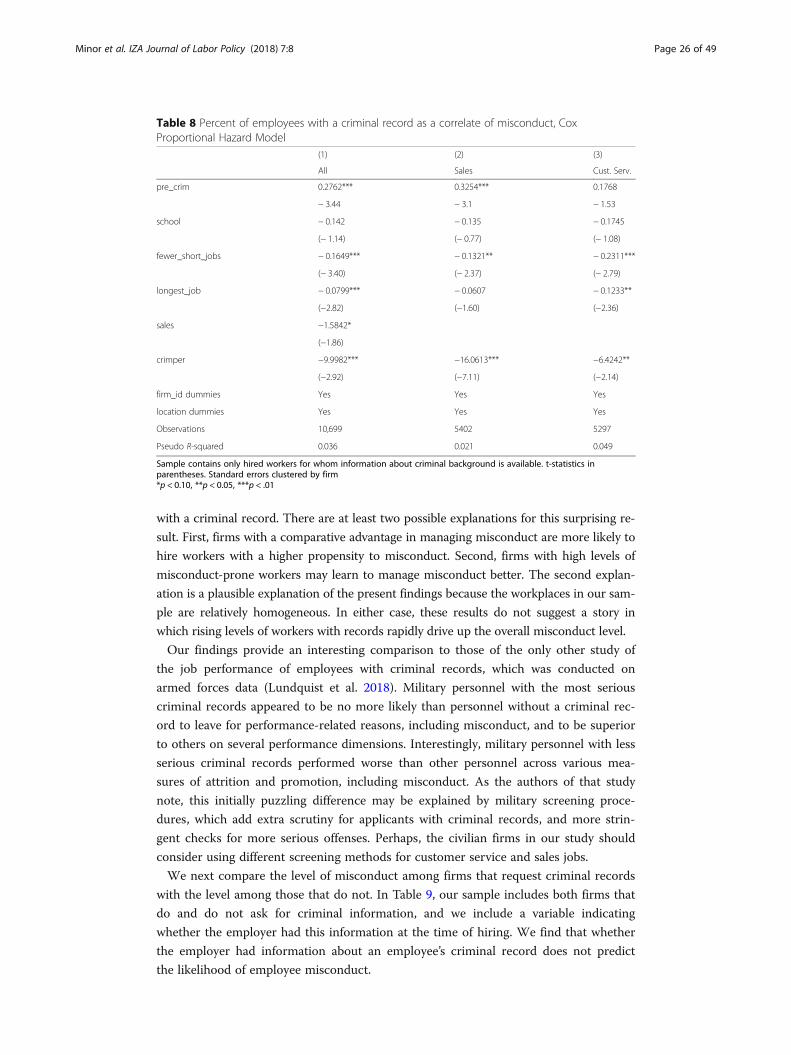
with a criminal record. There are at least two possible explanations for this surprising re-
sult. First, firms with a comparative advantage in managing misconduct are more likely to
hire workers with a higher propensity to misconduct. Second, firms with high levels of
misconduct-prone workers may learn to manage misconduct better. The second explan-
ation is a plausible explanation of the present findings because the workplaces in our sam-
ple are relatively homogeneous. In either case, these results do not suggest a story in
which rising levels of workers with records rapidly drive up the overall misconduct level.
Our findings provide an interesting comparison to those of the only other study of
the job performance of employees with criminal records, which was conducted on
armed forces data (Lundquist et al. 2018). Military personnel with the most serious
criminal records appeared to be no more likely than personnel without a criminal rec-
ord to leave for performance-related reasons, including misconduct, and to be superior
to others on several performance dimensions. Interestingly, military personnel with less
serious criminal records performed worse than other personnel across various mea-
sures of attrition and promotion, including misconduct. As the authors of that study
note, this initially puzzling difference may be explained by military screening proce-
dures, which add extra scrutiny for applicants with criminal records, and more strin-
gent checks for more serious offenses. Perhaps, the civilian firms in our study should
consider using different screening methods for customer service and sales jobs.
We next compare the level of misconduct among firms that request criminal records
with the level among those that do not. In Table 9, our sample includes both firms that
do and do not ask for criminal information, and we include a variable indicating
whether the employer had this information at the time of hiring. We find that whether
the employer had information about an employee’s criminal record does not predict
the likelihood of employee misconduct.
Table 8 Percent of employees with a criminal record as a correlate of misconduct, CoxProportional Hazard Model
(1) (2) (3)
All Sales Cust. Serv.
pre_crim 0.2762*** 0.3254*** 0.1768
− 3.44 − 3.1 − 1.53
school − 0.142 − 0.135 − 0.1745
(− 1.14) (− 0.77) (− 1.08)
fewer_short_jobs − 0.1649*** − 0.1321** − 0.2311***
(− 3.40) (− 2.37) (− 2.79)
longest_job − 0.0799*** − 0.0607 − 0.1233**
(−2.82) (−1.60) (−2.36)
sales −1.5842*
(−1.86)
crimper −9.9982*** −16.0613*** −6.4242**
(−2.92) (−7.11) (−2.14)
firm_id dummies Yes Yes Yes
location dummies Yes Yes Yes
Observations 10,699 5402 5297
Pseudo R-squared 0.036 0.021 0.049
Sample contains only hired workers for whom information about criminal background is available. t-statistics inparentheses. Standard errors clustered by firm*p < 0.10, **p < 0.05, ***p < .01
Minor et al. IZA Journal of Labor Policy (2018) 7:8 Page 26 of 49
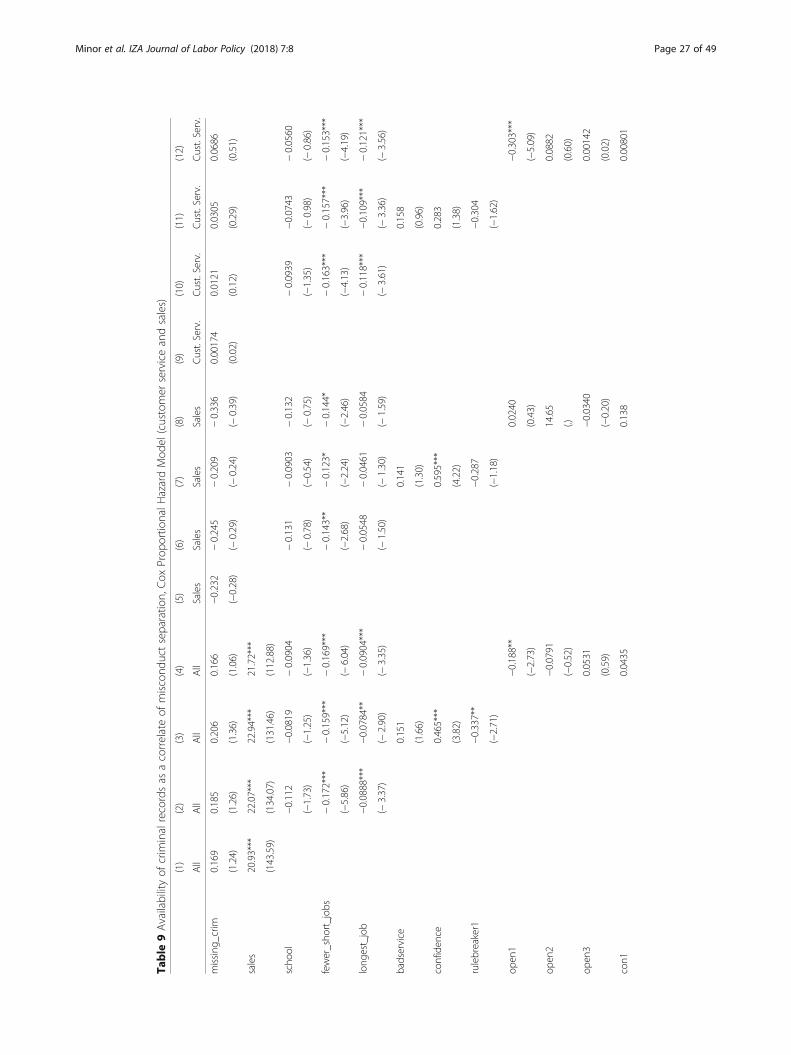
Table
9Availabilityof
crim
inalrecordsas
acorrelateof
miscond
uctseparatio
n,Cox
Prop
ortio
nalH
azardMod
el(customer
serviceandsales)
(1)
(2)
(3)
(4)
(5)
(6)
(7)
(8)
(9)
(10)
(11)
(12)
All
All
All
All
Sales
Sales
Sales
Sales
Cust.Serv.
Cust.Serv.
Cust.Serv.
Cust.Serv.
missing
_crim
0.169
0.185
0.206
0.166
−0.232
−0.245
−0.209
−0.336
0.00174
0.0121
0.0305
0.0686
(1.24)
(1.26)
(1.36)
(1.06)
(−0.28)
(−0.29)
(−0.24)
(−0.39)
(0.02)
(0.12)
(0.29)
(0.51)
sales
20.93***
22.07***
22.94***
21.72***
(143.59)
(134.07)
(131.46)
(112.88)
scho
ol−0.112
−0.0819
−0.0904
−0.131
−0.0903
−0.132
−0.0939
−0.0743
−0.0560
(−1.73)
(−1.25)
(−1.36)
(−0.78)
(−0.54)
(−0.75)
(−1.35)
(−0.98)
(−0.86)
fewer_sho
rt_job
s−0.172***
−0.159***
−0.169***
−0.143**
−0.123*
−0.144*
−0.163***
−0.157***
−0.153***
(−5.86)
(−5.12)
(−6.04)
(−2.68)
(−2.24)
(−2.46)
(−4.13)
(−3.96)
(−4.19)
long
est_job
−0.0888***
−0.0784**
−0.0904***
−0.0548
−0.0461
−0.0584
−0.118***
−0.109***
−0.121***
(−3.37)
(−2.90)
(−3.35)
(−1.50)
(−1.30)
(−1.59)
(−3.61)
(−3.36)
(−3.56)
badservice
0.151
0.141
0.158
(1.66)
(1.30)
(0.96)
confiden
ce0.465***
0.595***
0.283
(3.82)
(4.22)
(1.38)
rulebreaker1
−0.337**
−0.287
−0.304
(−2.71)
(−1.18)
(−1.62)
open
1−0.188**
0.0240
−0.303***
(−2.73)
(0.43)
(−5.09)
open
2−0.0791
14.65
0.0882
(−0.52)
(.)(0.60)
open
30.0531
−0.0340
0.00142
(0.59)
(−0.20)
(0.02)
con1
0.0435
0.138
0.00801
Minor et al. IZA Journal of Labor Policy (2018) 7:8 Page 27 of 49
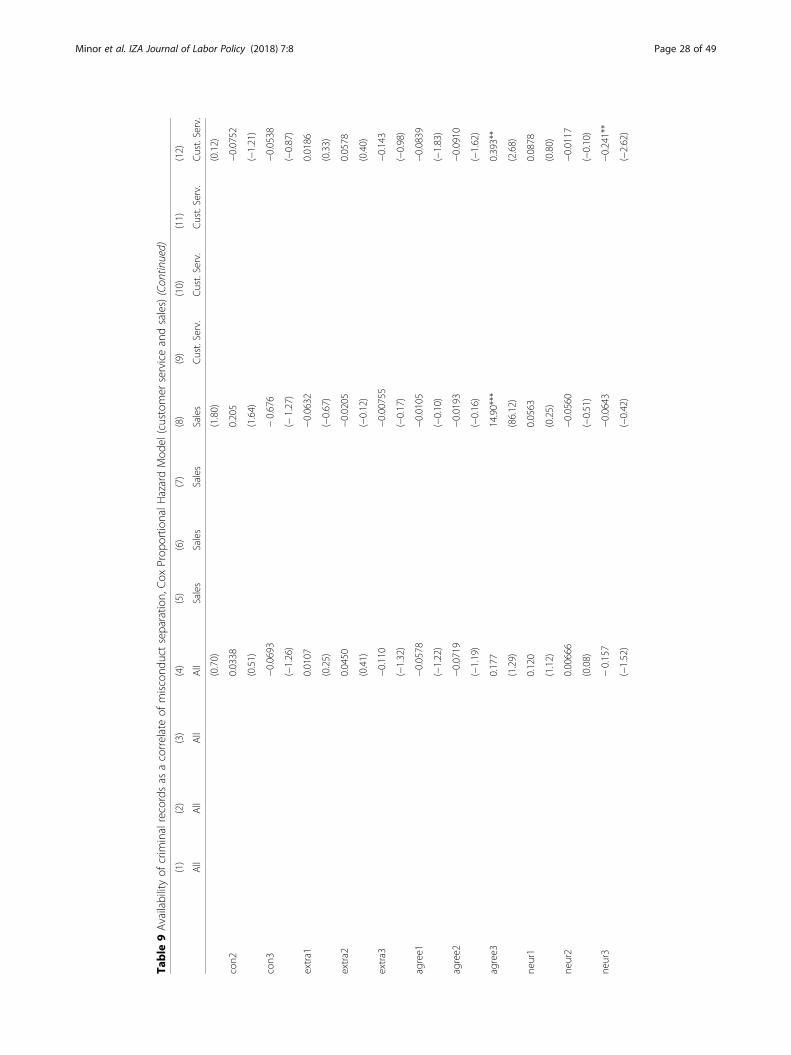
Table
9Availabilityof
crim
inalrecordsas
acorrelateof
miscond
uctseparatio
n,Cox
Prop
ortio
nalH
azardMod
el(customer
serviceandsales)(Con
tinued)
(1)
(2)
(3)
(4)
(5)
(6)
(7)
(8)
(9)
(10)
(11)
(12)
All
All
All
All
Sales
Sales
Sales
Sales
Cust.Serv.
Cust.Serv.
Cust.Serv.
Cust.Serv.
(0.70)
(1.80)
(0.12)
con2
0.0338
0.205
−0.0752
(0.51)
(1.64)
(−1.21)
con3
−0.0693
−0.676
−0.0538
(−1.26)
(−1.27)
(−0.87)
extra1
0.0107
−0.0632
0.0186
(0.25)
(−0.67)
(0.33)
extra2
0.0450
−0.0205
0.0578
(0.41)
(−0.12)
(0.40)
extra3
−0.110
−0.00755
−0.143
(−1.32)
(−0.17)
(−0.98)
agree1
−0.0578
−0.0105
−0.0839
(−1.22)
(−0.10)
(−1.83)
agree2
−0.0719
−0.0193
−0.0910
(−1.19)
(−0.16)
(−1.62)
agree3
0.177
14.90***
0.393**
(1.29)
(86.12)
(2.68)
neur1
0.120
0.0563
0.0878
(1.12)
(0.25)
(0.80)
neur2
0.00666
−0.0560
−0.0117
(0.08)
(−0.51)
(−0.10)
neur3
−0.157
−0.0643
−0.241**
(−1.52)
(−0.42)
(−2.62)
Minor et al. IZA Journal of Labor Policy (2018) 7:8 Page 28 of 49
Table
9Availabilityof
crim
inalrecordsas
acorrelateof
miscond
uctseparatio
n,Cox
Prop
ortio
nalH
azardMod
el(customer
serviceandsales)(Con
tinued)
(1)
(2)
(3)
(4)
(5)
(6)
(7)
(8)
(9)
(10)
(11)
(12)
All
All
All
All
Sales
Sales
Sales
Sales
Cust.Serv.
Cust.Serv.
Cust.Serv.
Cust.Serv.
firm_iddu
mmies
Yes
Yes
Yes
Yes
Yes
Yes
Yes
Yes
Yes
Yes
Yes
Yes
locatio
ndu
mmies
Yes
Yes
Yes
Yes
Yes
Yes
Yes
Yes
Yes
Yes
Yes
Yes
Observatio
ns21,300
21,300
21,300
21,300
5417
5417
5417
5417
14,538
14,538
14,538
14,538
Sampleinclud
esallh
iredworkers,reg
ardlessof
whe
ther
crim
inal
backgrou
ndinform
ationisavailable.
t-statisticsin
parenthe
ses.Ro
bust
stan
dard
errors
*p<0.10
,**p
<0.05
,***p<.01
Minor et al. IZA Journal of Labor Policy (2018) 7:8 Page 29 of 49
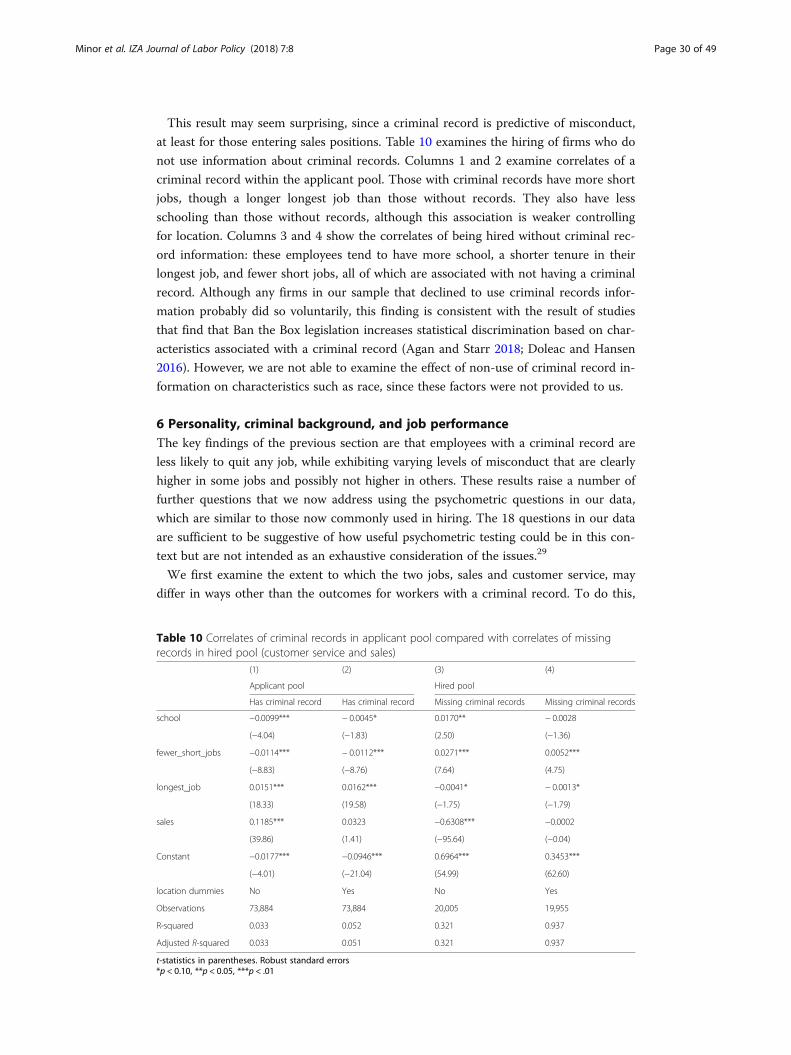
This result may seem surprising, since a criminal record is predictive of misconduct,
at least for those entering sales positions. Table 10 examines the hiring of firms who do
not use information about criminal records. Columns 1 and 2 examine correlates of a
criminal record within the applicant pool. Those with criminal records have more short
jobs, though a longer longest job than those without records. They also have less
schooling than those without records, although this association is weaker controlling
for location. Columns 3 and 4 show the correlates of being hired without criminal rec-
ord information: these employees tend to have more school, a shorter tenure in their
longest job, and fewer short jobs, all of which are associated with not having a criminal
record. Although any firms in our sample that declined to use criminal records infor-
mation probably did so voluntarily, this finding is consistent with the result of studies
that find that Ban the Box legislation increases statistical discrimination based on char-
acteristics associated with a criminal record (Agan and Starr 2018; Doleac and Hansen
2016). However, we are not able to examine the effect of non-use of criminal record in-
formation on characteristics such as race, since these factors were not provided to us.
6 Personality, criminal background, and job performanceThe key findings of the previous section are that employees with a criminal record are
less likely to quit any job, while exhibiting varying levels of misconduct that are clearly
higher in some jobs and possibly not higher in others. These results raise a number of
further questions that we now address using the psychometric questions in our data,
which are similar to those now commonly used in hiring. The 18 questions in our data
are sufficient to be suggestive of how useful psychometric testing could be in this con-
text but are not intended as an exhaustive consideration of the issues.29
We first examine the extent to which the two jobs, sales and customer service, may
differ in ways other than the outcomes for workers with a criminal record. To do this,
Table 10 Correlates of criminal records in applicant pool compared with correlates of missingrecords in hired pool (customer service and sales)
(1) (2) (3) (4)
Applicant pool Hired pool
Has criminal record Has criminal record Missing criminal records Missing criminal records
school −0.0099*** − 0.0045* 0.0170** − 0.0028
(−4.04) (−1.83) (2.50) (−1.36)
fewer_short_jobs −0.0114*** − 0.0112*** 0.0271*** 0.0052***
(−8.83) (−8.76) (7.64) (4.75)
longest_job 0.0151*** 0.0162*** −0.0041* − 0.0013*
(18.33) (19.58) (−1.75) (−1.79)
sales 0.1185*** 0.0323 −0.6308*** −0.0002
(39.86) (1.41) (−95.64) (−0.04)
Constant −0.0177*** −0.0946*** 0.6964*** 0.3453***
(−4.01) (−21.04) (54.99) (62.60)
location dummies No Yes No Yes
Observations 73,884 73,884 20,005 19,955
R-squared 0.033 0.052 0.321 0.937
Adjusted R-squared 0.033 0.051 0.321 0.937
t-statistics in parentheses. Robust standard errors*p < 0.10, **p < 0.05, ***p < .01
Minor et al. IZA Journal of Labor Policy (2018) 7:8 Page 30 of 49
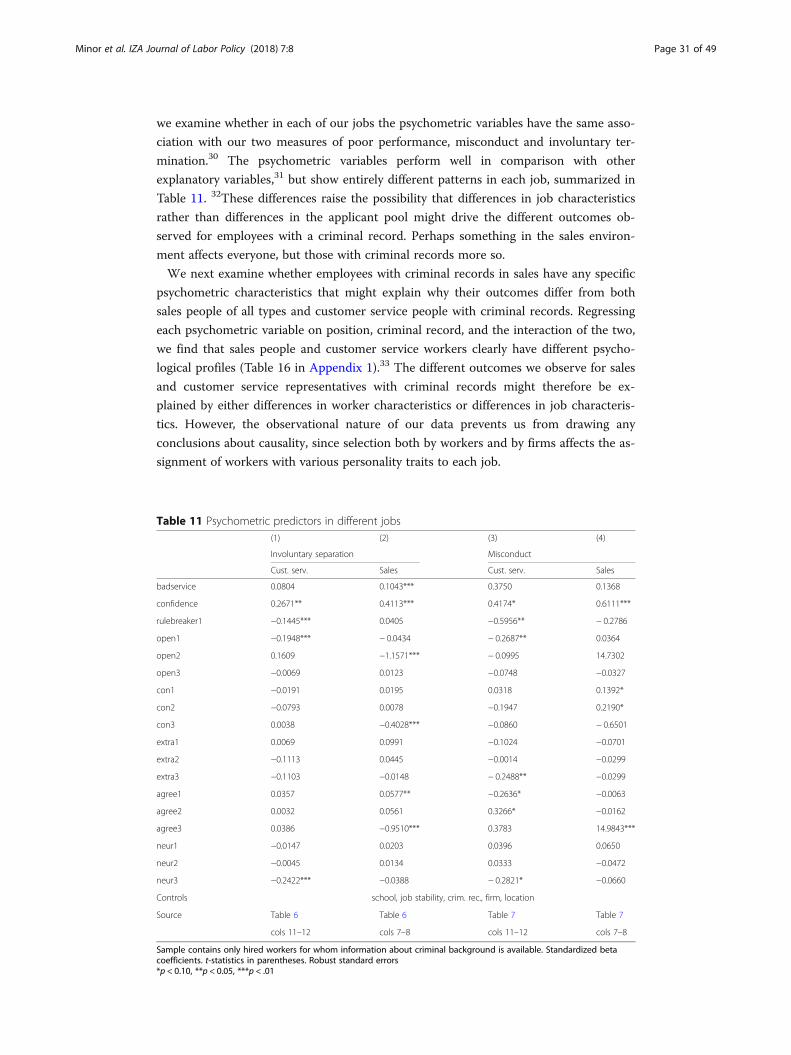
we examine whether in each of our jobs the psychometric variables have the same asso-
ciation with our two measures of poor performance, misconduct and involuntary ter-
mination.30 The psychometric variables perform well in comparison with other
explanatory variables,31 but show entirely different patterns in each job, summarized in
Table 11. 32These differences raise the possibility that differences in job characteristics
rather than differences in the applicant pool might drive the different outcomes ob-
served for employees with a criminal record. Perhaps something in the sales environ-
ment affects everyone, but those with criminal records more so.
We next examine whether employees with criminal records in sales have any specific
psychometric characteristics that might explain why their outcomes differ from both
sales people of all types and customer service people with criminal records. Regressing
each psychometric variable on position, criminal record, and the interaction of the two,
we find that sales people and customer service workers clearly have different psycho-
logical profiles (Table 16 in Appendix 1).33 The different outcomes we observe for sales
and customer service representatives with criminal records might therefore be ex-
plained by either differences in worker characteristics or differences in job characteris-
tics. However, the observational nature of our data prevents us from drawing any
conclusions about causality, since selection both by workers and by firms affects the as-
signment of workers with various personality traits to each job.
Table 11 Psychometric predictors in different jobs(1) (2) (3) (4)
Involuntary separation Misconduct
Cust. serv. Sales Cust. serv. Sales
badservice 0.0804 0.1043*** 0.3750 0.1368
confidence 0.2671** 0.4113*** 0.4174* 0.6111***
rulebreaker1 −0.1445*** 0.0405 −0.5956** − 0.2786
open1 −0.1948*** − 0.0434 − 0.2687** 0.0364
open2 0.1609 −1.1571*** − 0.0995 14.7302
open3 −0.0069 0.0123 −0.0748 −0.0327
con1 −0.0191 0.0195 0.0318 0.1392*
con2 −0.0793 0.0078 −0.1947 0.2190*
con3 0.0038 −0.4028*** −0.0860 − 0.6501
extra1 0.0069 0.0991 −0.1024 −0.0701
extra2 −0.1113 0.0445 −0.0014 −0.0299
extra3 −0.1103 −0.0148 − 0.2488** −0.0299
agree1 0.0357 0.0577** −0.2636* −0.0063
agree2 0.0032 0.0561 0.3266* −0.0162
agree3 0.0386 −0.9510*** 0.3783 14.9843***
neur1 −0.0147 0.0203 0.0396 0.0650
neur2 −0.0045 0.0134 0.0333 −0.0472
neur3 −0.2422*** −0.0388 − 0.2821* −0.0660
Controls school, job stability, crim. rec., firm, location
Source Table 6 Table 6 Table 7 Table 7
cols 11–12 cols 7–8 cols 11–12 cols 7–8
Sample contains only hired workers for whom information about criminal background is available. Standardized betacoefficients. t-statistics in parentheses. Robust standard errors*p < 0.10, **p < 0.05, ***p < .01
Minor et al. IZA Journal of Labor Policy (2018) 7:8 Page 31 of 49
We finally examine whether these psychometric variables can be used to reduce the value
of a criminal record in predicting job outcomes and find that they cannot.34 Indeed, they do
not even have the same association with misconduct and involuntary termination. In the
misconduct estimate for sales, the inclusion of the proprietary variables lowers the coeffi-
cient on pre_crim slightly while the inclusion of the FFA variables increases the coefficient
on pre_crim also very slightly (Table 7, columns 7–8). In the involuntary termination esti-
mate for sales, the reverse is true: the inclusion of the proprietary variables raises the coeffi-
cient on pre_crim slightly while the inclusion of the FFA lowers slightly the coefficient on
pre_crim (Table 6, columns 7–8). Overall, controlling for the psychometric variables does
not sizably affect the relationship between criminal background and productivity. Moreover,
although the psychometric questions appear well correlated with criminal background,35
the psychometric factors associated with either set of poor job outcomes were not consist-
ently related to those associated with a criminal record.36 This was surprising, since prior
work often found that traits associated with criminal behavior were those that tended to
produce worse work outcomes.37 The pessimistic implication of these findings is that psy-
chometrics is not yet useful for eliminating the predictive value of a criminal record. The
optimistic implication is that even simple psychometric tests have some predictive value,
and the development of better tests may eventually eliminate the incentive for employers to
use criminal records in all jobs.
In sum, our analysis of psychometric variables suggests two interesting lines of future
inquiry. First, our evidence suggests that either differences in worker characteristics or dif-
ferences in job characteristics might explain the different misconduct levels observed for
employees with criminal records in sales and customer service positions. Second, the psy-
chometric variables have a reasonable degree of association with both a criminal record
and job outcomes. However, in our data, they do not reduce the value of a criminal rec-
ord, and further research is required to determine whether they could do so.
7 ConclusionsUsing a unique source of data, we find that employees with a criminal record have a much
longer tenure and are less likely to quit their jobs voluntarily than other workers. We fur-
ther find that in certain jobs, employees with a criminal record are no more likely than
those without a record to leave their job involuntarily or for reasons of misconduct. These
workers with a criminal background appear to be no worse than, and possibly even better
than, workers without such a background. In our data, this low-risk job is customer ser-
vice. In other jobs, however, employees with a criminal record do appear more likely to
leave for reasons of misconduct. In our data, the high-risk job is sales, and we conjecture
that whatever factors create the overall high misconduct rate observed in sales jobs may
have an even greater effect on employees with criminal records.
The precise cost of this excess risk is highly speculative: the term “misconduct”
encompasses behavior ranging from excessive absenteeism to a variety of criminal
conduct. Surveys suggest that employers are primarily concerned about large negli-
gent hiring judgments for violent acts (Walker and Miller 2009; Platt 1993), but
no systematic evidence supports this concern.38 The primary employer losses from
misconduct are probably more pedestrian. Only one published study has any bear-
ing on this and, though small and highly specific, suggests that the work-related
misconduct of workers with criminal records is on average less serious than that of
Minor et al. IZA Journal of Labor Policy (2018) 7:8 Page 32 of 49
other workers.39 With this in mind, we use dishonesty, a serious but non-catastrophic type
of employee misconduct, as a basis for a rough estimate of the cost-benefit calculation fa-
cing an employer. The National Retail Federation estimates the loss from each dishonest
employee case is about $1546 (National Retail Federation 2015). Only sales workers with a
criminal record pose an excess misconduct risk: about 5.9% of sales workers with a criminal
record are discharged for misconduct compared with 3.1% of other sales workers, a differ-
ence of 2.8%.40 An employer who hired a worker with a criminal record rather than a
worker without a record increased its expected theft-related costs by about 2.8% of $1546,
or $43. The same employer saved about $746 in turnover costs on that worker.
Our results are subject to an important qualification: our estimates were made
on employees, in other words, on those applicants who had been filtered through a
hiring process that discriminated based on their criminal record. If discrimination
against these applicants decreased, either by employer choice or through legislation,
the employee group would change, and the new group of employees with records
might not exhibit tenures as long as those we observe. All we can say is that, at
the current margin, employers may be missing opportunities to hire quality em-
ployees by applying a hiring penalty of the current magnitude to a criminal record.
Our findings are not simple, and neither are their policy implications. Finding gainful
employment for individuals with criminal records is an important public priority: without
such employment, recidivism is almost inevitable, at great cost to both the individual and
the community. At the same time, employers are concerned that employing individuals
with records may carry risks, and our study does not entirely dispel those fears. On the
whole, our results provide support for efforts to expand hiring of applicants with a criminal
record at the margin, but one qualification is critical. The instances in which we find better
performance of employees with a criminal record cannot be generalized to the entire pool.
Ban the Box laws have come to dominate the policy discussion of how to improve the
employment prospects of people with criminal records. These laws apply uniform rules to
all employees and employers. Yet a clear takeaway from our study is that not all workforces
are the same. Employers should be encouraged to re-examine their assumptions about ap-
plicants with criminal records by studying their own workforce. A wide variety of measures
could promote this self-examination. For example, the current Work Opportunity Tax Credit
is only available to employers who hire ex-felons within 1 year after their conviction or release
from prison even though employers appear to discriminate against applicants with criminal
records long after release or conviction, and some employers apply a hiring penalty to those
with a misdemeanor or even arrest record. Policy to reintegrate individuals with criminal re-
cords should consider the variety of job applicants, of jobs, and of employer motivation.
Endnotes1That a hiring penalty is attached to a criminal record has been found in audit studies
(Pager 2003; Uggen et al. 2014; Agan and Starr 2018); employer survey data (Holzer
et al. 2006); by examining changes in employer behavior resulting from Ban the Box
(Doleac and Hansen 2016); and by examining the employer response to the availability
of information about criminal records (Bushway 2004; Finlay 2009).2For example, Hawaii requires that a conviction record bear a rational relationship to
the duties and responsibilities of the position and only allows the use of records less
than 10 years old (Hawaii Revised Statutes (HRS) § 378-2.5 (Supp. 2007)). Minnesota
Minor et al. IZA Journal of Labor Policy (2018) 7:8 Page 33 of 49
also allows a record to be used only if it “directly relates” to the position (Minn. Stat. §
364). New York and Wisconsin also prohibit employment discrimination against those
with a criminal record unless an employer can show that a person with a propensity for
the kind of crime the prospective employee had previously committed would be unable
to successfully perform the relevant job (Wis. Stat. § 111.325–111.335 (2003); N.Y. Cor-
rect. Law §§750-55 (2003) (amended in 2007)). New York, however, permits inquiry
about a criminal record at any stage of an application.3Equal Employment Opportunity Commission. “Enforcement Guidance 915.002: Con-
sideration of Arrest and Conviction Records in Employment Decisions Under Title VII of
the Civil Rights Act of 1964,” https://www.eeoc.gov/laws/guidance/arrest_conviction.cfm.4The White House. “Take the Fair Chance Pledge.” https://obamawhitehouse.archi-
ves.gov/issues/criminal-justice/fair-chance-pledge (accessed September 28, 2016).526 U.S. C. § 51.6Federal Bonding Program, Answers to Questions About Fidelity Bonding, http://
www.bonds4jobs.com/highlights.html (Accessed 22 Aug 2018).7The most comprehensive protection is provided by Texas. Tex. Civ. Prac. & Rem.,
§142.002 which provides that “[a] cause of action may not be brought against an em-
ployer, general contractor, premises owner, or other third party solely for negligently
hiring or failing to adequately supervise an employee, based on evidence that the em-
ployee has been convicted of an offense.”8Some states, such as Florida, disallow the use at any time of expunged records
and permit job candidates to lie if asked (Fla. Stat. ch. § 943.0585 4(a)). Most
states have procedures that attempt to identify individuals with records who have
been rehabilitated and either expunge their records or grant a Certificate of Good
Conduct, which leaves their conviction standing but testifies to their rehabilitation
since that time (Jacobs 2015, 143–49).9Surveys suggest that employers consider criminal records to reduce legal liability for negli-
gent hiring (52%); to ensure a safe work environment for employees (49%); to reduce theft and
other criminal activity (38%); to comply with laws requiring checks (28%); and to assess the
overall trustworthiness of a candidate (17%) (Society for Human Resource Management 2012).10The continued importance of character proxy use may be indicated by a recent Supreme
Court case, NASA v. Nelson, 131 S. Ct. 746, 760 (2011), that accepted a defendant’s argument
that questions about illegal drug use are a useful way of determining which employees will
“‘efficiently and effectively’ discharge their duties” (upholding the constitutionality of govern-
ment use of criminal background checks absent any specific statutory prohibition).11These categories have been validated by replicability across samples rather than by
prediction of real world outcomes (Hogan 2005, 332)12In our sample, 27% of those with criminal records had more than high school com-
pared with 40% of those without a record. Another study found that only about 10% of
individuals with criminal records had more than a high school education (Yang 2017),
so our sample appears to be more educated than the population with a criminal record
as a whole, though it may be typical of those who apply for white-collar jobs.13We found that applicants are missing pre_crim if and only if they are missing posi-
tion_id. This suggests that the occurrences in which pre_crim is missing reflect a delib-
erate decision by an employer not to collect criminal records information for a set of
jobs indicated by a position_id rather than a selective response on the part of
Minor et al. IZA Journal of Labor Policy (2018) 7:8 Page 34 of 49
applicants. Furthermore, we examined applicants who were hired to check whether the
establishment (firm_id) predicts the missing pre_crim and found that indeed there is a
strong correlation. Establishments are sharply divided into two groups; those for which
the pre_crim field is missing for almost all employees and those for which the pre_crim
field is complete for almost all workers. This indicates that information on criminal
background was fully recorded for some establishments and fully missing for the vast
majority of the rest of the establishments in our sample.14Although comprehensive data on employee crime is not available, the financial ser-
vices sector appears, not surprisingly, to be especially vulnerable, and FDIC insured
firms have a strong incentive to conduct background checks (12 U.S.C. 1829). In our
sample, however, noninsurance financial services are actually more than average likely
to be missing criminal records (Table 12 in Appendix 1).15For about 264,000 applicants we know the value of a field called position_id. By exam-
ining applicants who were hired, we can see that position_id combines information about
the type of job to which the applicant applied and the location variable. For example, al-
most all employees for whom position_id is coded 193 are customer service representatives
in location 10. For many non-hired applicants, we were therefore able to reconstruct loca-
tion code (loc_new) and position applied for. The variable job_app_equals 1 when we were
able to impute a position (Table 1).16In order to preserve the anonymity of its clients, the consultancy masked the codes so
that we were able to identify groups of employees who were hired at the same location, but
not to identify the location itself. We do have reason to think that none of the firms, whether
or not they collected criminal records information, were in a state that had Ban the Box legis-
lation at the time of data collection. We can make a few educated guesses about the geo-
graphic distribution of our firms. The hiring consultancy told us that its client sites were
overwhelmingly located in the South and continental West, and we have some corroboration
for this. In addition to the location code, the data contain state and city fields that are empty
for observations that have criminal record information, but had values for some of the obser-
vations that do not. Within this group of observations, 50.4% are in the West, 36% are in the
South, 9% are in the Midwest, and 4% are in the East. This group of observations might have
differed from the ones we analyze here, since by definition observations that had criminal re-
cords information were in states that, at the time of application, did not ban the box, while
those for which criminal records information was missing might or might not have been in
such states. However, any such difference is likely to be small. During the period of data col-
lection, only four states covering about 5% of the US population banned the box for private
employers (Hawaii, Rhode Island, Massachusetts, and Minnesota). Moreover, not one identi-
fiable observation was in any of these four states. The group with identifiable states was
slightly skewed away from states that have since banned the box for private employers. Five
other states (Connecticut, Illinois, New Jersey, Oregon, and Vermont) passed laws after data
collection, and about 14% of the US population now lives in a state that bans the box for pri-
vate employers. Only one state that could be identified in the data, Oregon, now has a private
employer Ban the Box law. It accounts for 1.2% of the US population though about 7.3% of
all observations for which the state could be identified.17This field sometimes changes through a worker’s tenure, presumably because the em-
ployer has shifted the worker to a different job. We retain the most recently recorded posi-
tion_type and use it as a control for occupation held in our analysis of the employee pool.
Minor et al. IZA Journal of Labor Policy (2018) 7:8 Page 35 of 49
18This variable is censored for those workers who had not yet separated when the data
collection ended.19A variable TERM_ANY was constructed to take value 0 for any observation for which
the cause of termination was not recorded and 1 otherwise; thus, from Table 2, panel B, we
see that 77% of our sample had separated from their job by the time data collection ended.20“Openness to experience” reflects the individual’s degree of intellectual curiosity,
creativity, and a preference for novelty and variety. “Conscientiousness” is the tendency
to be organized and dependable, show self-discipline, act dutifully, aim for achievement,
and prefer planned rather than spontaneous behavior. “Extraversion” includes energy,
positive emotions, surgency, assertiveness, sociability, and talkativeness. “Agreeable-
ness” is the tendency to be compassionate and cooperative rather than suspicious and
antagonistic toward others. “Neuroticism” is the tendency to experience unpleasant
emotions easily, such as anger, anxiety, depression, and vulnerability.21The number of observations of “Agent” and “Technical Support” was below the
level needed to draw useful inferences; we therefore dropped these positions. Although
the number of observations of “Other” with pre_crim was reasonably large, it shrank
when other variables like school were added. Since “Other” also represents a heteroge-
neous group, results would be hard to interpret, and we dropped it as well.22Of 110 unique locations, 42 had values for only one firm and 73 had three firms or
less. Five locations were associated with 10 or more firms, with a high of 20 firms.23In general, lower turnover is associated with higher firm value, although the rela-
tionship is not linear (Hancock et al. 2013).24A literature review finds a wide range of results regarding the relationship between
voluntary turnover and performance, with slightly more studies finding a weak negative
association (Allen and Griffeth 1999).25The difference in turnover rates is (365/183–365/167), or 19%; multiplying by
$4000 per turnover implies a cost difference of $764.26In 2015, the average wage for all customer services representatives was about $34,000.
The workers in our sample typically did not have specialized skills, and their wages were
likely closer to the sub-category “Business support services”, for which the average wage
was about $28,000. https://www.bls.gov/oes/2015/may/oes434051.htm (accessed February
1, 2017).27The Vermont definition of misconduct includes profanity, 21 V.S.A. § 1344; a number
of states include absenteeism without fault as misconduct (Ark. Code Ann. § 11-10-514).
Minn. Stat. Ann. § 268.09(1)(2). Campbell v. Minneapolis Star & Tribune Co., 345 N.W.2d
803 (Minn. Ct. App. 1984); Clark v. Iowa Dep’t of Job Serv., 317 N.W.2d 517 (Iowa Ct. App.
1982); and one case held sleeping on the job was misconduct. L. Washington & Associates,
Inc. v. Unemployment Compensation Bd. of Review, 662 A.2d 1148 (Pa. Commw. Ct. 1995).28Since most firms would not use these particular psychometric variables in hiring,
column 6 of Table 7 is most relevant to a typical firm’s risk assessment. The antilog of
the regression coefficient on pre_crim yields a hazard ratio of about 1.34.29Our data contain two kinds of psychometric questions, 15 FFA questions and
three proprietary questions. Fifteen questions are considered valid for assessment at
the factor level (Donnellan et al. 2006), but that number is not enough to distinguish
among the 30 or more categories at the facet level, and is below the preferred level
for comprehensive assessment.
Minor et al. IZA Journal of Labor Policy (2018) 7:8 Page 36 of 49
30As noted earlier, LOE and voluntary turnover can result from a number of factors both
good and bad. Thus, the signs on explanatory variables do not have clear interpretations.31For example, when the psychometric variables are included in the misconduct esti-
mate for sales, the coefficients on the significant psychometric variables are about as
large or larger (confidence regress = .61; con2 = .22; agree3 = 15) than that on pre_crim
(.28–.31) (Table 7, columns 7–8).32In the misconduct estimates for sales employees, three FFA questions, con1, con2 and
agree3, have significant positive coefficients, with agree3 extremely large and highly signifi-
cant. In comparison, in the misconduct estimates for customer service, five FFA variables
have predictive value and not one of these is significant in the sales regression (Table 11, col-
umns 3–4). In our estimates of involuntary termination, four of the fifteen FFA variables are
significant for sales and two for customer service, but no FFA variable is significant in both
estimates. (Table 11, columns 1–2). In addition to the FFA, we examine three measures based
on proprietary psychometric tests of the hiring consultancy. Again, the predictive power of
these variables is not always the same for customer service and sales. One, confidence_re-
gress, is a measure of overconfidence that is notable for combining self-reports and objective
information. Applicants were asked how confident they felt in their technical skills without
knowing that they would later take a computer test. Confidence_regress is based on the dif-
ference between the applicant’s reported self-confidence and his or her actual performance
on the later test. Confidence_regress performs well: it is highly significant in both the miscon-
duct and the involuntary termination estimates for sales; it is significant for customer service
in predicting both involuntary termination and misconduct, but with smaller coefficients and
lower confidence levels (Table 11). A second proprietary variable, rulebreaker, is a forced
choice variation of the first two FFA conscientiousness questions. Rulebreaker is significant
in predicting involuntary termination and misconduct for customer service but not for sales
(Table 11). A third measure is badservice, which is meant to predict poor customer service
skills. Badservice had some predictive power for involuntary separation in sales but not in
customer service, and none for misconduct (Table 11).33The position term is significant, usually highly, in 17 of 18 regressions: a criminal record
is significant in 6 of 18 estimates and the interaction term is significant in 5 of 18. The five
psychometric measures for which the interaction term is significant do not correspond to
the measures that are associated with poor performance outcomes (Tables 6 and 7, columns
7–8, and Table 16 in Appendix 1). The sales*criminal record interaction is negatively associ-
ated with confidence regress, but confidence_regress is positive and significantly associated
with both involuntary termination and misconduct. The sales*criminal record interaction is
positively associated with con3, but con3 is unrelated to misconduct and has a significant
negative association with involuntary termination. The interaction term is significant and
negatively associated with variables extra2 and extra3, but extra2 and extra3 are unrelated
to either work outcome. The interaction term is significant and negatively associated with
agree3, and while agree3 is significant and negatively associated with involuntary termin-
ation it is positively associated with misconduct. However, without random assignment of
workers to jobs, no causal conclusions can be drawn from this.34We restrict our analysis to the hired pool because personality variables are available
only for this group. We report the results for the sample restricted to sales and cus-
tomer service jobs. Results for the whole hired pool are consistent and are provided in
Tables 13 and 14 of Appendix 1.
Minor et al. IZA Journal of Labor Policy (2018) 7:8 Page 37 of 49
35Of the 15 FFA questions, 7 are predictive in both specifications (Table 19 in
Appendix 1, columns 4 and 6) and our results generally correspond with the prior
literature. See Appendix 2. One of the three proprietary questions, badservice, is
positively correlated with a criminal record (Table 19 in Appendix 1, columns 3 and 5).36Table 17 in Appendix 1 compares psychometric variables as predictors of a criminal
record and of poor employment outcomes for sales workers. Since a criminal record, in-
voluntary termination, and misconduct are all undesirable outcomes, we might expect to
see psychometric variables tending to have the same signs in all three. However, Table 17
in Appendix 1 indicates that only one question with a significant association with miscon-
duct in sales positions, agree3, has a significant association of the same sign in the crim-
inal record estimate. Three other questions significantly associated with misconduct
(confidence_regress, con1, and con2) are not significantly associated with a criminal rec-
ord. Similarly, Table 17 in Appendix 1 shows only a minimal relationship between the pre-
dictors of involuntary termination in sales positions and a criminal record. Two
questions, con3 and badservice, are significant and of the same sign in predicting involun-
tary termination and a criminal record. Six questions are associated with a criminal record
but not involuntary termination, while one question is associated with involuntary termi-
nations but not a criminal record. Two questions, open2 and agree3, have associations of
opposite signs with involuntary terminations and a criminal record.37High neuroticism and low conscientiousness and agreeableness usually lead to
worse work outcomes (Judge et al. 2013; Barrick et al. 2001) and more criminal behav-
ior (Jones et al. 2011; O’Riordan and O’Connell 2014). Only extraversion usually in-
creases criminal behavior while improving work outcomes.38No aggregate statistics are collected on this issue, and supposed evidence that a
criminal record has a major effect on negligent hiring costs is basically folklore (Hickox
and Roehling 2013). One often-cited article claims employers have lost 72% of negligent
hiring cases with an average settlement of more than $1.6 million. It provides no evi-
dence as to the use of a criminal background in such verdicts, no data on the frequency
of such cases, and for the evidence it does provide it cites a broken web link to what
appears to have been either a background check provider or a trade magazine (Conner-
ley et al. 2001). Large judgments have indeed been rendered for the acts of employees
with criminal backgrounds, Ward v. Trusted Health, No. 94-4297 (Suffolk Super. Ct.
Mass) (1999)($26.5 million damages); Tallahassee Furniture Co. v. Harrison, 583 So. 2d
744 (Fla. Dist. Ct. App. 1991); but also for the acts of employees without a criminal rec-
ord, Diaz v. Carcamo, 253 P.3d 535 (Ca. 2011) ($23 million award); Glomb v. Glomb,
530 A.2d 1362, 1364 (Pa. Super. Ct. 1987) ($1.5 million).39Roberts et al. (2007) examined a birth cohort of about 900 New Zealand resi-
dents who had been tracked from birth to age 26. Adolescent criminal convic-
tions were unrelated to committing counterproductive activities at work in
general, and were actually negatively related to more serious counterproductive
work behaviors such as fighting or stealing.40Note that these rates are unadjusted raw numbers. The hazard ratios from our Cox
estimate cannot be used here because Cox estimation does not produce a baseline haz-
ard rate. However, the hazard ratio implied by these raw numbers is higher than the
Cox hazard ratio, and the estimate in text is likely to be of the right order of magnitude
but on the higher side.
Minor et al. IZA Journal of Labor Policy (2018) 7:8 Page 38 of 49
Appendix 1
Table 12 Industry correlates of missing criminal record(1)
missing_pre_crim
industry==Electronics 0.3090***
(29.21)
industry==Financial 0.1815***
(24.60)
industry==Healthcare −0.0683***
(−10.30)
industry==Insurance −0.2626***
(−35.72)
industry==Miscellaneous −0.0866***
(−17.08)
industry==Retail −0.1902***
(−23.61)
industry==Telecommunications 0.3852***
(77.00)
position_type==Agent 0.3952***
(36.58)
position_type==Customer_service −0.0519***
(−6.08)
position_type==Sales −0.5887***
(−66.50)
position_type==Technical_support −0.0651***
(−4.90)
Constant 0.6341***
(69.08)
Observations 57,397
R-squared 0.590
Adjusted R-squared 0.590
t-statistics in parentheses. Robust standard errors*p < 0.10, **p < 0.05, ***p < .01
Minor et al. IZA Journal of Labor Policy (2018) 7:8 Page 39 of 49
Table 13 Factor-level correlates of criminal background in hired population (all positions)
(1) (2) (3) (4)
pre_crim pre_crim pre_crim pre_crim
school − 0.0006 −0.0068
(−0.09) (−0.94)
fewer_short_jobs −0.0207*** −0.0195***
(−5.45) (−5.14)
longest_job 0.0184*** 0.0208***
(8.84) (9.60)
neurtot 0.0116*** 0.0124***
(3.14) (3.36)
opentot −0.0198*** −0.0178***
(−4.82) (−4.34)
extratot 0.0210*** 0.0223***
(5.05) (5.39)
contot −0.0281*** −0.0307***
(−7.26) (−7.93)
agreetot 0.0015 0.0013
(0.37) (0.32)
Constant 0.1141*** −0.0030 0.1207*** − 0.0042
(32.71) (−0.27) (9.93) (−0.26)
Observations 11,008 11,008 11,008 11,008
R-squared 0.000 0.008 0.010 0.019
Adjusted R-squared −0.000 0.008 0.009 0.019
Sample contains only hired workers for whom information about criminal background is available. Standardized betacoefficients. t-statistics in parentheses. Robust standard errors*p < 0.10, **p < 0.05, ***p < .01
Table 14 Question-level correlates of criminal background in hired population (all positions)
(1) (2) (3) (4) (5) (6)
pre_crim pre_crim pre_crim pre_crim pre_crim pre_crim
school −0.0006 −0.0109 −0.0018
(−0.09) (−1.49) (−0.25)
fewer_short_jobs −0.0207*** −0.0201*** −0.0189***
(−5.45) (−5.25) (−4.99)
longest_job 0.0184*** 0.0194*** 0.0230***
(8.84) (8.94) (10.50)
badservice 0.0178** 0.0183**
(2.15) (2.21)
confidence_regress −0.0109 −0.0040
(− 0.88) (− 0.32)
rulebreaker1 −0.0098 − 0.0068
(−1.03) (−0.72)
open1 −0.0221*** −0.0228***
(−3.50) (−3.62)
open2 0.0744*** 0.0830***
Minor et al. IZA Journal of Labor Policy (2018) 7:8 Page 40 of 49
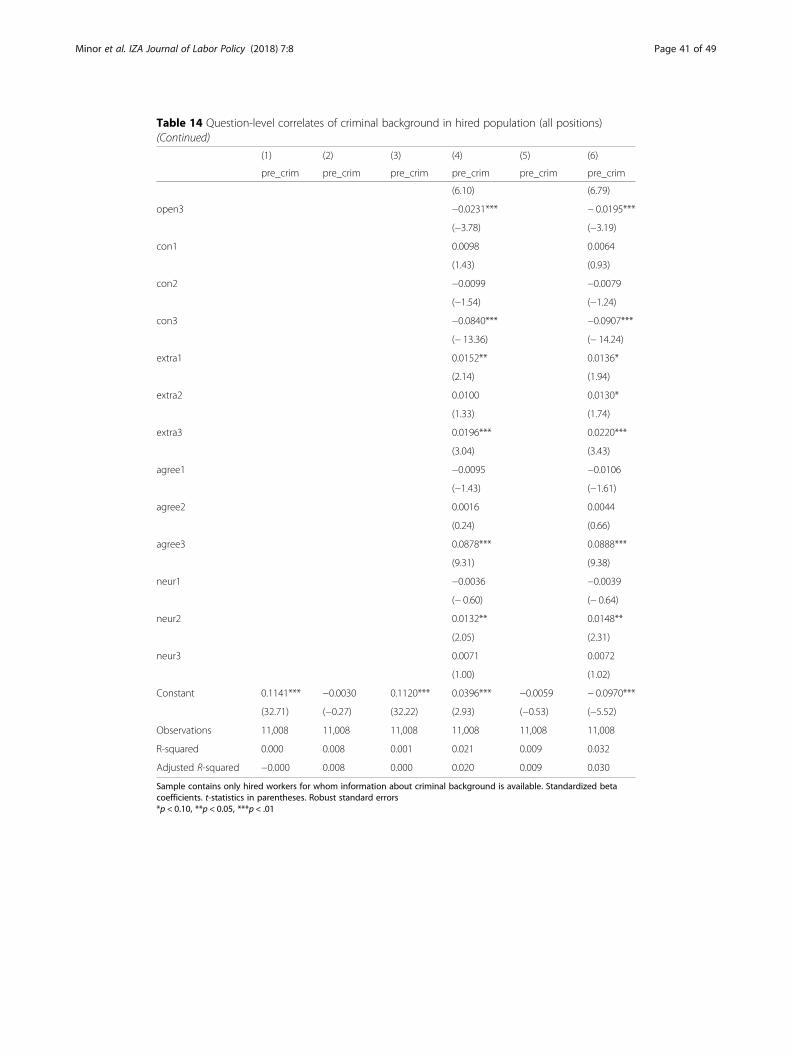
Table 14 Question-level correlates of criminal background in hired population (all positions)(Continued)
(1) (2) (3) (4) (5) (6)
pre_crim pre_crim pre_crim pre_crim pre_crim pre_crim
(6.10) (6.79)
open3 −0.0231*** − 0.0195***
(−3.78) (−3.19)
con1 0.0098 0.0064
(1.43) (0.93)
con2 −0.0099 −0.0079
(−1.54) (−1.24)
con3 −0.0840*** −0.0907***
(− 13.36) (− 14.24)
extra1 0.0152** 0.0136*
(2.14) (1.94)
extra2 0.0100 0.0130*
(1.33) (1.74)
extra3 0.0196*** 0.0220***
(3.04) (3.43)
agree1 −0.0095 −0.0106
(−1.43) (−1.61)
agree2 0.0016 0.0044
(0.24) (0.66)
agree3 0.0878*** 0.0888***
(9.31) (9.38)
neur1 −0.0036 −0.0039
(− 0.60) (− 0.64)
neur2 0.0132** 0.0148**
(2.05) (2.31)
neur3 0.0071 0.0072
(1.00) (1.02)
Constant 0.1141*** −0.0030 0.1120*** 0.0396*** −0.0059 − 0.0970***
(32.71) (−0.27) (32.22) (2.93) (−0.53) (−5.52)
Observations 11,008 11,008 11,008 11,008 11,008 11,008
R-squared 0.000 0.008 0.001 0.021 0.009 0.032
Adjusted R-squared −0.000 0.008 0.000 0.020 0.009 0.030
Sample contains only hired workers for whom information about criminal background is available. Standardized betacoefficients. t-statistics in parentheses. Robust standard errors*p < 0.10, **p < 0.05, ***p < .01
Minor et al. IZA Journal of Labor Policy (2018) 7:8 Page 41 of 49
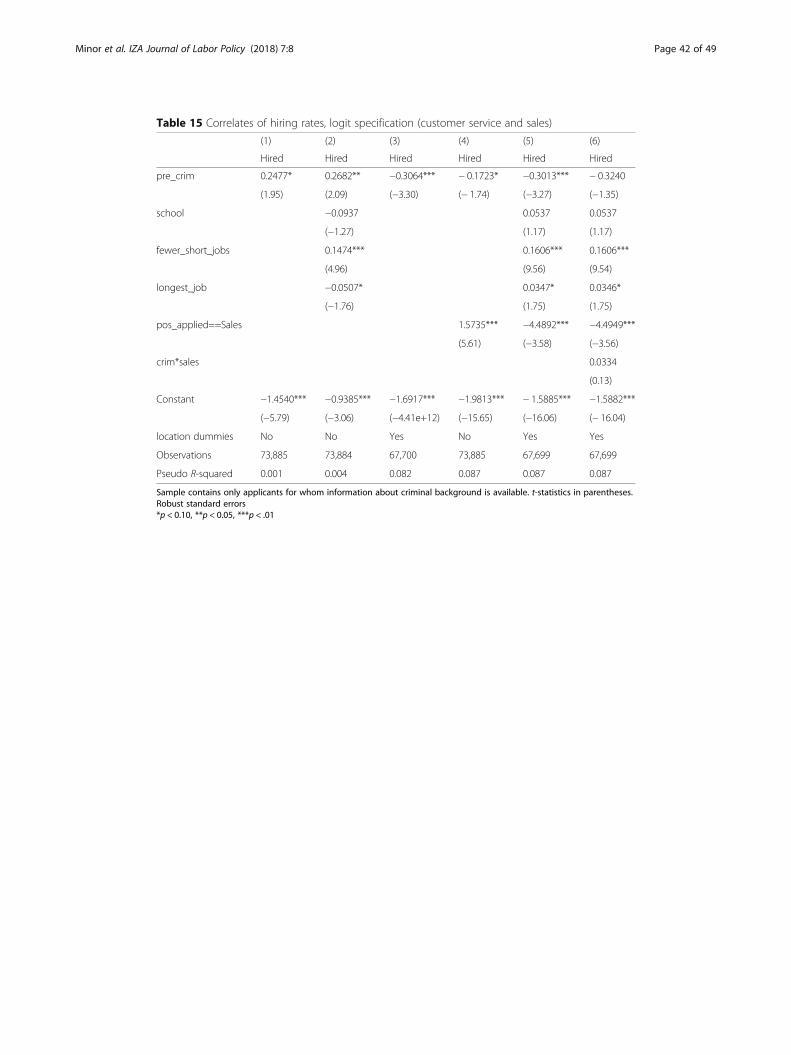
Table 15 Correlates of hiring rates, logit specification (customer service and sales)
(1) (2) (3) (4) (5) (6)
Hired Hired Hired Hired Hired Hired
pre_crim 0.2477* 0.2682** −0.3064*** − 0.1723* −0.3013*** − 0.3240
(1.95) (2.09) (−3.30) (− 1.74) (−3.27) (−1.35)
school −0.0937 0.0537 0.0537
(−1.27) (1.17) (1.17)
fewer_short_jobs 0.1474*** 0.1606*** 0.1606***
(4.96) (9.56) (9.54)
longest_job −0.0507* 0.0347* 0.0346*
(−1.76) (1.75) (1.75)
pos_applied==Sales 1.5735*** −4.4892*** −4.4949***
(5.61) (−3.58) (−3.56)
crim*sales 0.0334
(0.13)
Constant −1.4540*** −0.9385*** −1.6917*** −1.9813*** − 1.5885*** −1.5882***
(−5.79) (−3.06) (−4.41e+12) (−15.65) (−16.06) (− 16.04)
location dummies No No Yes No Yes Yes
Observations 73,885 73,884 67,700 73,885 67,699 67,699
Pseudo R-squared 0.001 0.004 0.082 0.087 0.087 0.087
Sample contains only applicants for whom information about criminal background is available. t-statistics in parentheses.Robust standard errors*p < 0.10, **p < 0.05, ***p < .01
Minor et al. IZA Journal of Labor Policy (2018) 7:8 Page 42 of 49
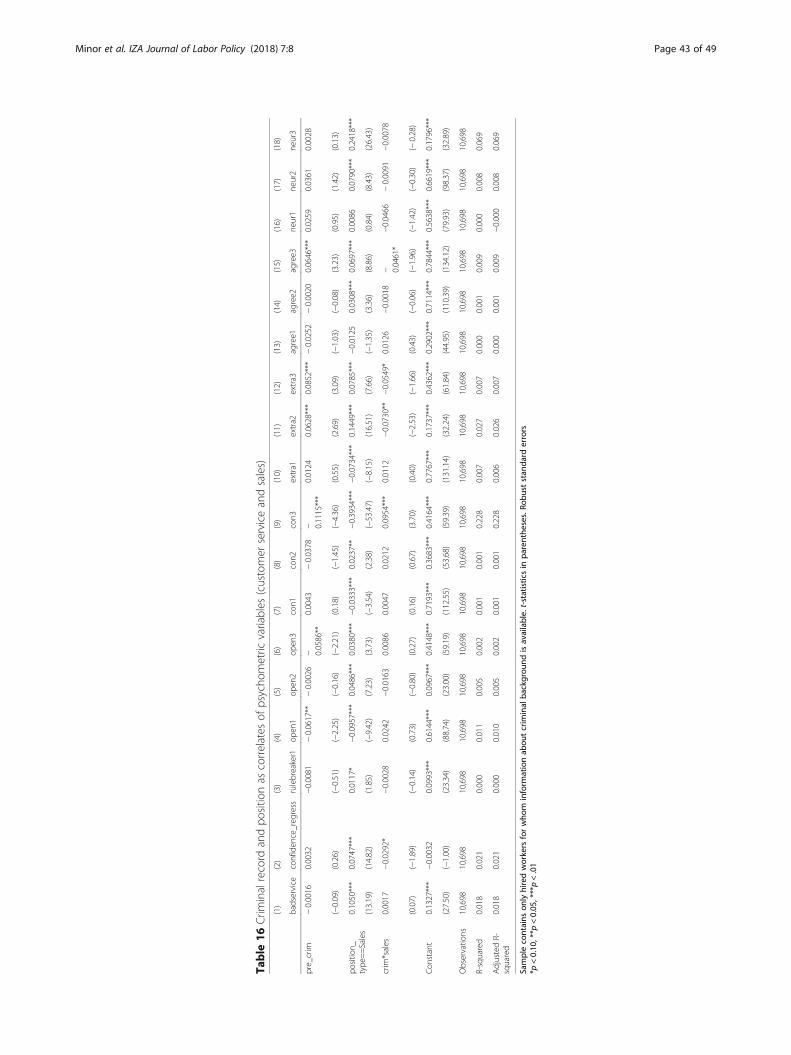
Table
16Crim
inalrecord
andpo
sitio
nas
correlates
ofpsycho
metric
variables
(customer
serviceandsales)
(1)
(2)
(3)
(4)
(5)
(6)
(7)
(8)
(9)
(10)
(11)
(12)
(13)
(14)
(15)
(16)
(17)
(18)
badservice
confiden
ce_reg
ress
rulebreaker1
open
1op
en2
open
3con1
con2
con3
extra1
extra2
extra3
agree1
agree2
agree3
neur1
neur2
neur3
pre_crim
−0.0016
0.0032
−0.0081
−0.0617**
−0.0026
− 0.0586**
0.0043
−0.0378
− 0.1115***
0.0124
0.0628***
0.0852***
−0.0252
−0.0020
0.0646***
0.0259
0.0361
0.0028
(−0.09)
(0.26)
(−0.51)
(−2.25)
(−0.16)
(−2.21)
(0.18)
(−1.45)
(−4.36)
(0.55)
(2.69)
(3.09)
(−1.03)
(−0.08)
(3.23)
(0.95)
(1.42)
(0.13)
positio
n_type
==Sales
0.1050***
0.0747***
0.0117*
−0.0957***
0.0486***
0.0380***
−0.0333***
0.0237**
−0.3934***
−0.0734***
0.1449***
0.0785***
−0.0125
0.0308***
0.0697***
0.0086
0.0790***
0.2418***
(13.19)
(14.82)
(1.85)
(−9.42)
(7.23)
(3.73)
(−3.54)
(2.38)
(−53.47)
(−8.15)
(16.51)
(7.66)
(−1.35)
(3.36)
(8.86)
(0.84)
(8.43)
(26.43)
crim
*sales
0.0017
−0.0292*
−0.0028
0.0242
−0.0163
0.0086
0.0047
0.0212
0.0954***
0.0112
−0.0730**
−0.0549*
0.0126
−0.0018
− 0.0461*
−0.0466
−0.0091
−0.0078
(0.07)
(−1.89)
(−0.14)
(0.73)
(−0.80)
(0.27)
(0.16)
(0.67)
(3.70)
(0.40)
(−2.53)
(−1.66)
(0.43)
(−0.06)
(−1.96)
(−1.42)
(−0.30)
(−0.28)
Con
stant
0.1327***
−0.0032
0.0993***
0.6144***
0.0967***
0.4148***
0.7193***
0.3683***
0.4164***
0.7767***
0.1737***
0.4362***
0.2902***
0.7114***
0.7844***
0.5638***
0.6619***
0.1796***
(27.50)
(−1.00)
(23.34)
(88.74)
(23.00)
(59.19)
(112.55)
(53.68)
(59.39)
(131.14)
(32.24)
(61.84)
(44.95)
(110.39)
(134.12)
(79.93)
(98.37)
(32.89)
Observatio
ns10,698
10,698
10,698
10,698
10,698
10,698
10,698
10,698
10,698
10,698
10,698
10,698
10,698
10,698
10,698
10,698
10,698
10,698
R-squared
0.018
0.021
0.000
0.011
0.005
0.002
0.001
0.001
0.228
0.007
0.027
0.007
0.000
0.001
0.009
0.000
0.008
0.069
AdjustedR-
squared
0.018
0.021
0.000
0.010
0.005
0.002
0.001
0.001
0.228
0.006
0.026
0.007
0.000
0.001
0.009
−0.000
0.008
0.069
Samplecontains
onlyhiredworkers
forwho
minform
ationab
outcrim
inal
backgrou
ndisavailable.t-statisticsin
parenthe
ses.Ro
bust
stan
dard
errors
*p<0.10
,**p
<0.05
,***p<.01
Minor et al. IZA Journal of Labor Policy (2018) 7:8 Page 43 of 49
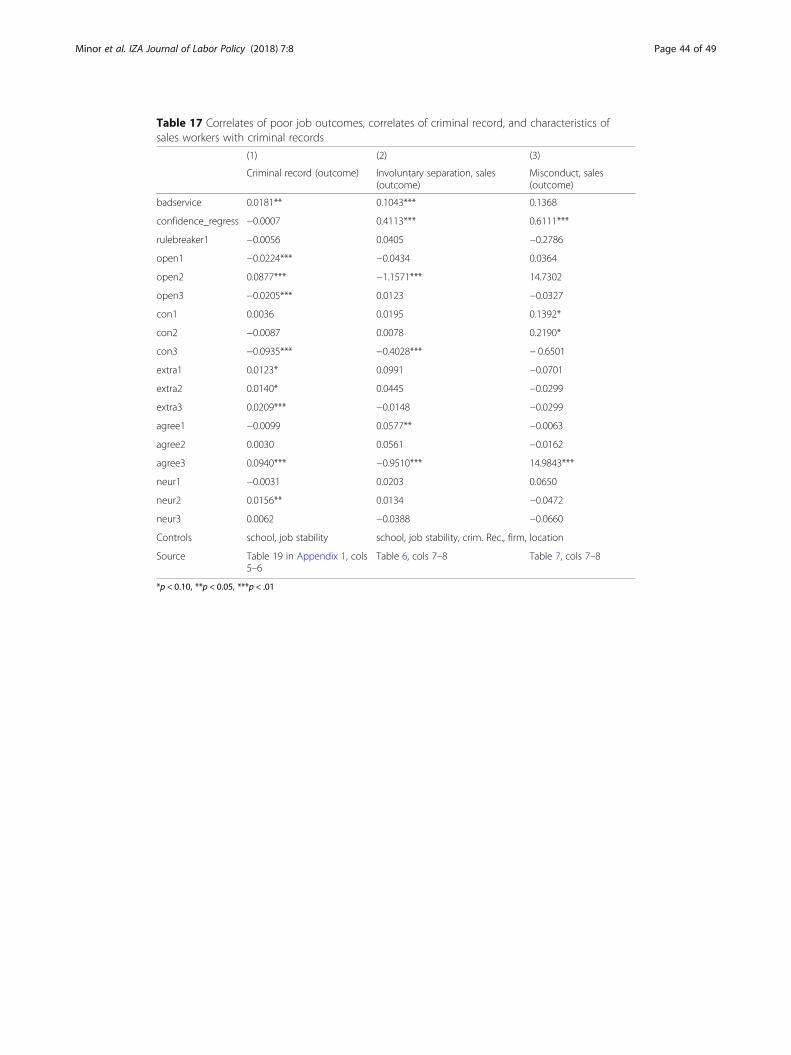
Table 17 Correlates of poor job outcomes, correlates of criminal record, and characteristics ofsales workers with criminal records
(1) (2) (3)
Criminal record (outcome) Involuntary separation, sales(outcome)
Misconduct, sales(outcome)
badservice 0.0181** 0.1043*** 0.1368
confidence_regress −0.0007 0.4113*** 0.6111***
rulebreaker1 −0.0056 0.0405 −0.2786
open1 −0.0224*** −0.0434 0.0364
open2 0.0877*** −1.1571*** 14.7302
open3 −0.0205*** 0.0123 −0.0327
con1 0.0036 0.0195 0.1392*
con2 −0.0087 0.0078 0.2190*
con3 −0.0935*** −0.4028*** − 0.6501
extra1 0.0123* 0.0991 −0.0701
extra2 0.0140* 0.0445 −0.0299
extra3 0.0209*** −0.0148 −0.0299
agree1 −0.0099 0.0577** −0.0063
agree2 0.0030 0.0561 −0.0162
agree3 0.0940*** −0.9510*** 14.9843***
neur1 −0.0031 0.0203 0.0650
neur2 0.0156** 0.0134 −0.0472
neur3 0.0062 −0.0388 −0.0660
Controls school, job stability school, job stability, crim. Rec., firm, location
Source Table 19 in Appendix 1, cols5–6
Table 6, cols 7–8 Table 7, cols 7–8
*p < 0.10, **p < 0.05, ***p < .01
Minor et al. IZA Journal of Labor Policy (2018) 7:8 Page 44 of 49
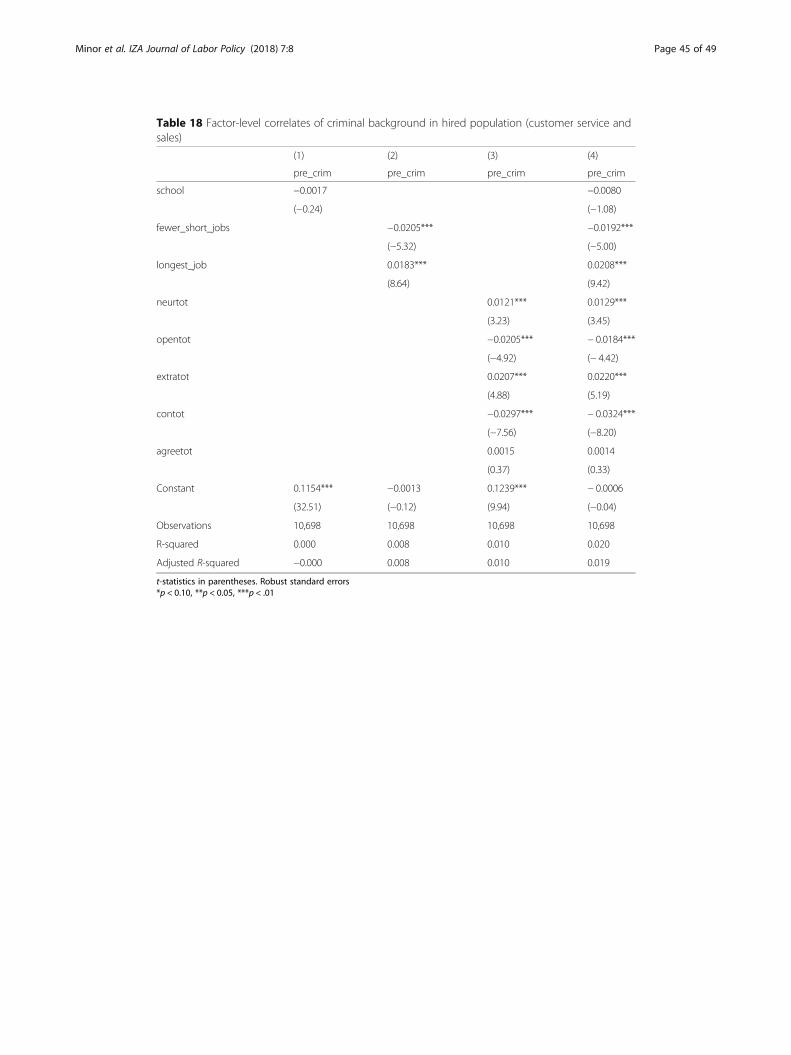
Table 18 Factor-level correlates of criminal background in hired population (customer service andsales)
(1) (2) (3) (4)
pre_crim pre_crim pre_crim pre_crim
school −0.0017 −0.0080
(−0.24) (−1.08)
fewer_short_jobs −0.0205*** −0.0192***
(−5.32) (−5.00)
longest_job 0.0183*** 0.0208***
(8.64) (9.42)
neurtot 0.0121*** 0.0129***
(3.23) (3.45)
opentot −0.0205*** − 0.0184***
(−4.92) (− 4.42)
extratot 0.0207*** 0.0220***
(4.88) (5.19)
contot −0.0297*** − 0.0324***
(−7.56) (−8.20)
agreetot 0.0015 0.0014
(0.37) (0.33)
Constant 0.1154*** −0.0013 0.1239*** − 0.0006
(32.51) (−0.12) (9.94) (−0.04)
Observations 10,698 10,698 10,698 10,698
R-squared 0.000 0.008 0.010 0.020
Adjusted R-squared −0.000 0.008 0.010 0.019
t-statistics in parentheses. Robust standard errors*p < 0.10, **p < 0.05, ***p < .01
Minor et al. IZA Journal of Labor Policy (2018) 7:8 Page 45 of 49
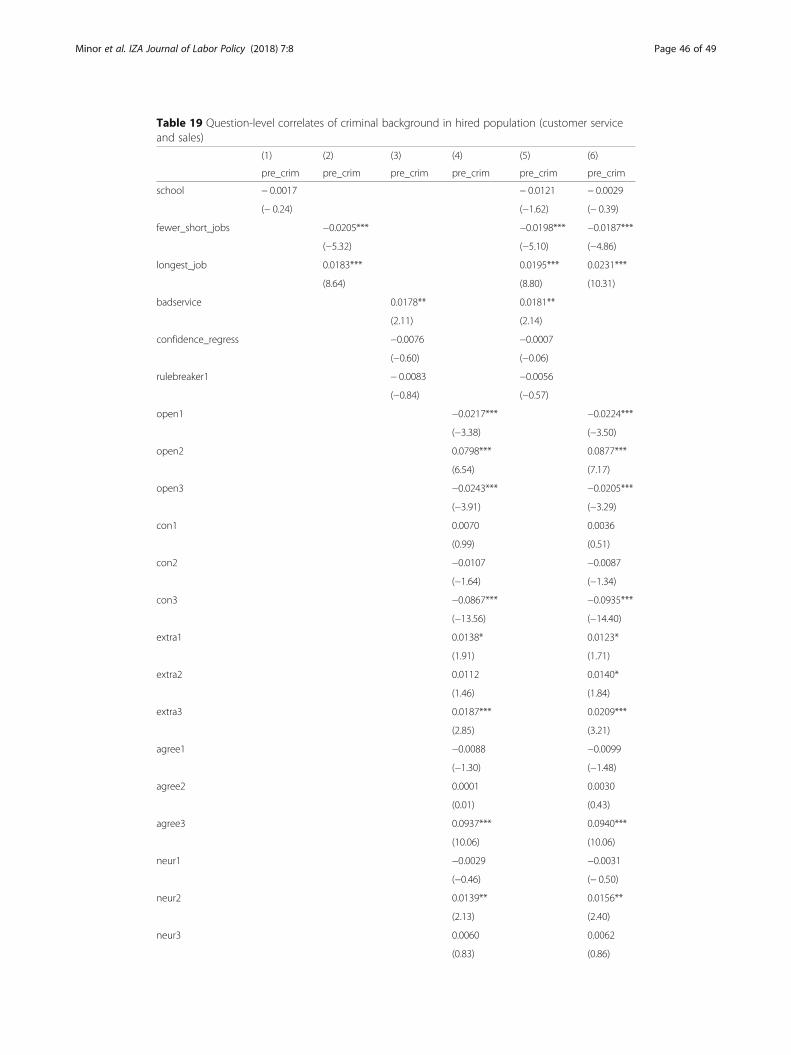
Table 19 Question-level correlates of criminal background in hired population (customer serviceand sales)
(1) (2) (3) (4) (5) (6)
pre_crim pre_crim pre_crim pre_crim pre_crim pre_crim
school − 0.0017 − 0.0121 − 0.0029
(− 0.24) (−1.62) (− 0.39)
fewer_short_jobs −0.0205*** −0.0198*** −0.0187***
(−5.32) (−5.10) (−4.86)
longest_job 0.0183*** 0.0195*** 0.0231***
(8.64) (8.80) (10.31)
badservice 0.0178** 0.0181**
(2.11) (2.14)
confidence_regress −0.0076 −0.0007
(−0.60) (−0.06)
rulebreaker1 − 0.0083 −0.0056
(−0.84) (−0.57)
open1 −0.0217*** −0.0224***
(−3.38) (−3.50)
open2 0.0798*** 0.0877***
(6.54) (7.17)
open3 −0.0243*** −0.0205***
(−3.91) (−3.29)
con1 0.0070 0.0036
(0.99) (0.51)
con2 −0.0107 −0.0087
(−1.64) (−1.34)
con3 −0.0867*** −0.0935***
(−13.56) (−14.40)
extra1 0.0138* 0.0123*
(1.91) (1.71)
extra2 0.0112 0.0140*
(1.46) (1.84)
extra3 0.0187*** 0.0209***
(2.85) (3.21)
agree1 −0.0088 −0.0099
(−1.30) (−1.48)
agree2 0.0001 0.0030
(0.01) (0.43)
agree3 0.0937*** 0.0940***
(10.06) (10.06)
neur1 −0.0029 −0.0031
(−0.46) (− 0.50)
neur2 0.0139** 0.0156**
(2.13) (2.40)
neur3 0.0060 0.0062
(0.83) (0.86)
Minor et al. IZA Journal of Labor Policy (2018) 7:8 Page 46 of 49
Appendix 2Correspondence of FFA results to prior literature
The discussion in the main text uses the individual 15 questions as controls because
these more closely approximate the trait level analysis that is currently preferred to the
broader factor level approach. However, much of the earlier literature relies on factor
analysis, and so we present factor variables here for purposes of comparing our results
to prior research (Table 18 in Appendix 1, columns 3–7). In Table 18 in Appendix 1,
the standardized coefficients in column 3 indicate that an increase of 1 standard devi-
ation in neuroticism or extroversion increases the probability of having a criminal back-
ground by about 1.2% and 2.1% over its 12.4% baseline in the hired pool. An increase
of 1 standard deviation in openness to experience and conscientiousness decrease the
probability of having a criminal background by about 2% and 3%, respectively. Agree-
ableness has a small and insignificant coefficient.
As discussed in Section 2, the prior literature on the personality correlates of a crim-
inal record is sparse, and much of the relevant work examines some different but re-
lated outcome such as aggression. However, two strong findings have emerged: a highly
consistent positive correlation of related outcomes to neuroticism and a highly consist-
ent negative correlation to conscientiousness. Our results are consistent with these,
and also with the moderately consistent positive association found with extraversion
(Jones et al. 2011; O’Riordan and O’Connell 2014). Openness has a negative association
in our data, which may seem at first inconsistent with the usual finding in
meta-analysis that it is insignificant (Jones et al. 2011; O’Riordan and O’Connell 2014).
However, this can readily be explained by the fact that we do not have enough ques-
tions to examine all underlying facets.
Prior work finds differences among the approximately six lower order traits
within each high-level five-factor (Jones et al. 2011, Table 3). In that literature, out-
comes related to criminality are negatively associated with one facet of openness
(feelings), sometimes positively associated with two others (actions and ideas), and
not significantly associated with three (fantasy, esthetics, and, oddly, values). Con-
sistent with this complex pattern, Table 19 in Appendix 1 shows that two of our
openness questions are negatively associated and one positively associated with a
criminal record. With only 15 questions, we observe a net negative effect. However,
with a greater variety of questions comprehensively covering all facets of openness,
Table 19 Question-level correlates of criminal background in hired population (customer serviceand sales) (Continued)
(1) (2) (3) (4) (5) (6)
pre_crim pre_crim pre_crim pre_crim pre_crim pre_crim
Constant 0.1154*** −0.0013 0.1128*** 0.0389*** −0.0047 − 0.0970***
(32.51) (−0.12) (31.90) (2.84) (−0.42) (−5.41)
Observations 10,698 10,698 10,698 10,698 10,698 10,698
R-squared 0.000 0.008 0.000 0.022 0.009 0.032
Adjusted R-squared −0.000 0.008 0.000 0.020 0.009 0.031
Sample contains only hired workers for whom information about criminal background is available. Standardized betacoefficients. t-statistics in parentheses. Robust standard errors*p < 0.10, **p < 0.05, ***p < .01
Minor et al. IZA Journal of Labor Policy (2018) 7:8 Page 47 of 49
various opposing effects might have canceled each other out. Variation in findings
may also be partly explained by differences in the outcome studied. Low openness
may be correlated to recidivism (Clower and Bothwell 2001) while high openness
may be correlated to aggression (Barlett and Anderson 2012).
Agreeableness is negative, as expected from prior work finding that all facets of
agreeableness are negatively correlated with outcomes related to criminality (Jones et
al. 2011; O’Riordan and O’Connell 2014). It is, however, surprisingly small and insignifi-
cant. The explanation may lie in the fact that no individual question can be unambigu-
ously assigned to any given facet or factor. Rather, test-makers assign questions to the
factors or facets for which they have the highest loading, which may vary among tests.
Of our agreeableness questions, one has the expected negative sign, one is insignificant.
Only our question agree3 has a positive sign, and other tests group it with the facet as-
sertiveness, which is part of extraversion, so that its positive sign is consistent with the
usual sign of extraversion.
AcknowledgementsWeiss and Minor gratefully acknowledge the generous financial support of the Joyce Foundation. This paper hasbenefitted from the input of participants at the Society of Labor Economists Annual Meeting 2017, the 2017 APPAMFall Research Conference, and the faculty colloquium of the Northwestern Pritzker School of Law. We would like tothank the anonymous referee and the editor for the useful remarks.Responsible editor: Denis Fougère
FundingWeiss and Minor gratefully acknowledge the generous financial support of the Joyce Foundation.
Availability of data and materialsThe analysis in this paper was conducted on existing data not collected for research purposes and was fully de-identified—it therefore did not constitute human subjects research and did not require the approval of an institutionalreview board. A consultancy had collected the data for its own business purposes. Prior to delivering the data, theconsultancy replaced the names of clients, applicants and employees with numeric codes. In addition, other informa-tion was omitted in order to foreclose any possibility of identifying firms or individuals. For example, the data did notcontain any demographic data such as age, sex, or race.
Competing interestsThe IZA Journal of Labor Policy is committed to the IZA Guiding Principles of Research Integrity. The authors declarethat they have observed these principles.
Publisher’s NoteSpringer Nature remains neutral with regard to jurisdictional claims in published maps and institutional affiliations.
Received: 7 January 2018 Accepted: 25 July 2018
ReferencesAgan AY, Starr SB (2018) Ban the box, criminal records, and statistical discrimination: a field experiment. Q J Econ
133(1):191–235. https://doi.org/10.1093/qje/qjx028Allen DG, Griffeth RW (1999) Job performance and turnover: a review and integrative multi-route model. Hum Resour
Manag Rev 9(4):525–548. https://doi.org/10.1016/S1053-4822(99)00032-7American Psychiatric Association, and others (2013) Diagnostic and statistical manual of mental disorders (DSM-5®).
American Psychiatric Publishing, ArlingtonAndrews DA, Bonta J (2014) The psychology of criminal conduct. Routledge, New YorkBarlett CP, Anderson CA (2012) Direct and indirect relations between the big 5 personality traits and aggressive and
violent behavior. Personal Individ Differ 52(8):870–875. https://doi.org/10.1016/j.paid.2012.01.029Barrick MR, Mount MK, Judge TA (2001) Personality and performance at the beginning of the new millennium: what do
we know and where do we go next? Int J Sel Assess 9(1 & 2):9–30Block J (2010) The five-factor framing of personality and beyond: some ruminations. Psychol Inq 21(1):2–25. https://doi.
org/10.1080/10478401003596626Burks SV, Cowgill B, Hoffman M, Housman M (2015) The value of hiring through employee referrals. Q J Econ 130(2):
805–839. https://doi.org/10.1093/qje/qjv010Bushway S (2004) Labor market effects of permitting employer access to criminal history records. J Contemp Crim
Justice Spec Issue Econ Crime 20:276–291Carson EA, Golinelli D (2013) Prisoners in 2012. Bur Justice Stat 2(3) https://www.bjs.gov/content/pub/pdf/p12ac.
pdf. Accessed 22 Aug 2018
Minor et al. IZA Journal of Labor Policy (2018) 7:8 Page 48 of 49
Clower CE, Bothwell RK (2001) An exploratory study of the relationship between the big five and inmate recidivism. J ResPers 35(2):231–237
Connerley ML, Arvey RD, Bernardy CJ (2001) Criminal background checks for prospective and current employees:current practices among municipal agencies. Public Pers Manag 30(2):173–183
Costa PT, McCrae RR (1992a) Normal personality assessment in clinical practice: the NEO Personality Inventory. PsycholAssess 4(1):5
Costa PT, McCrae RR (1992b) Revised NEO Personality Inventory (NEO PI-R) and NEO Five-Factor Inventory (NEO FFI):professional manual. Psychological Assessment Resources
Doleac, Jennifer L., and Benjamin Hansen. 2016. Does ‘ban the box’ help or hurt low-skilled workers? Statisticaldiscrimination and employment outcomes when criminal histories are hidden. National Bureau of economicresearch working paper 22469. http://www.nber.org/papers/w22469
Donnellan MB, Oswald FL, Baird BM, Lucas RE (2006) The mini-IPIP scales: tiny-yet-effective measures of the big fivefactors of personality. Psychol Assess 18(2):192
Durose MR, Cooper AD, Snyder HN (2014) Recidivism of prisoners released in 30 states in 2005: patterns from 2005 to2010. Bureau of Justice Statistics, Washington, DC, p 28 http://www.bjs.gov/content/pub/pdf/rprts05p0510.pdf
Finlay K (2009) Effect of employer access to criminal history data on the labor market outcomes of ex-offenders andnon-offenders. In: Autor DH (ed) Studies of labor market intermediation. University of Chicago Press, Chicago, pp89–126
Goldberg LR (1990) An alternative ‘description of personality’: the big-five factor structure. J Pers Soc Psychol 59(6):1216–1229. https://doi.org/10.1037/0022-3514.59.6.1216
Hancock JI, Allen DG, Bosco FA, McDaniel KR, Pierce CA (2013) Meta-analytic review of employee turnover as apredictor of firm performance. J Manag 39(3):573–603. https://doi.org/10.1177/0149206311424943
Hickox SA, Roehling MV (2013) Negative credentials: fair and effective consideration of criminal records. Am Bus Law J50(2):201–227
Hogan R (2005) In defense of personality measurement: new wine for old whiners. Hum Perform 18(4):331–341Holzer, H. J., S. Raphael, and M. A. Stoll. 2004. “The effect of an applicant’s criminal history on employer hiring decisions
and screening practices: evidence from Los Angeles” University of Michigan, National Poverty Center WorkingPaper 04–15
Holzer HJ, Raphael S, Stoll MA (2006) Perceived criminality, criminal background checks, and the racial hiring practicesof employers. J Law Econ 49:451–480
Jacobs JB (2015) The eternal criminal record. Harvard University Press, CambridgeJones SE, Miller JD, Lynam DR (2011) Personality, antisocial behavior, and aggression: a meta-analytic review. J Crim Just
39(4):329–337. https://doi.org/10.1016/j.jcrimjus.2011.03.004Judge TA, Rodell JB, Klinger RL, Simon LS, Crawford ER (2013) Hierarchical representations of the five-factor model of
personality in predicting job performance: integrating three organizing frameworks with two theoreticalperspectives. J Appl Psychol 98(6):875
Lee K, Ashton MC (2004) Psychometric properties of the HEXACO Personality Inventory. Multivar Behav Res 39(2):329–358Lundquist JH, Pager D, Strader E (2018) Does a criminal past predict worker performance? Evidence from one of
America’s largest employers. Soc Forces 96(3):1039–1068. https://doi.org/10.1093/sf/sox092National Retail Federation. 2015. “The 2015 National Retail Security Survey”O’Riordan C, O’Connell M (2014) Predicting adult involvement in crime: personality measures are significant, socio-
economic measures are not. Personal Individ Differ 68(October):98–101. https://doi.org/10.1016/j.paid. 2014.04.010Pager D (2003) The mark of a criminal record. Am J Sociol 108(5):937–975. https://doi.org/10.1086/374403Pager D, Quillian L (2005) Walking the talk? What employers say versus what they do. Am Sociol Rev 70(3):355–380Paunonen SV, Ashton MC (2001) Big five factors and facets and the prediction of behavior. J Pers Soc Psychol 81(3):524–539Petersilia J (2003) When prisoners come home: parole and prisoner reentry. Oxford University Press, New YorkPlatt BD (1993) Negligent retention and hiring in Florida: safety of customers versus security of employers. Fla St U L Rev 20:697Roberts BW, Harms PD, Caspi A, Moffitt TE (2007) Predicting the counterproductive employee in a child-to-adult
prospective study. J Appl Psychol 92:5Society for Human Resource Management (2012) Background checking—the use of criminal background checks in
hiring decisions. https://www.shrm.org/hr-today/trends-and-forecasting/research-and-surveys/Pages/criminalbackgroundcheck.aspx. Accessed 22 Aug 2018
Uggen C, Shannon SKS (2014) Productive addicts and harm reduction: how work reduces crime-but not drug use. SocProbl 61(1):105–130
Uggen C, Vuolo M, Lageson S, Ruhland E, Whitham HK (2014) The edge of stigma: an experimental audit of the effectsof low-level criminal records on employment. Criminology 52(4):627–654
Visher CA, Lattimore PK, Barrick K, Tueller S (2017) Evaluating the long-term effects of prisoner reentry services onrecidivism: what types of services matter? Justice Q 34(1):136–165
Visher CA, Debus-Sherrill A, Yahner J (2011) Employment after prison: a longitudinal study of former prisoners. Justice Q28(5):698–718
Walker JR, Miller JE (2009) Supervision in the hospitality industry: leading human resources. Wiley, HobokenWestern B, Kling JR, Weiman DF (2001) The labor market consequences of incarceration. Crime Delinq 47(3):410–427.
https://doi.org/10.1177/0011128701047003007Yang CS (2017) Local labor markets and criminal recidivism. J Public Econ 147:16–29. https://doi.org/10.1016/j.jpubeco.
2016.12.003
Minor et al. IZA Journal of Labor Policy (2018) 7:8 Page 49 of 49