CRIME, NEIGHBORHOOD PERCEPTIONS, AND THE UNDERCLASS THE
14
Pergamon Journal of Criminal Justice, Vol. 23, No. 2, pp. 163-176, 1995 Copyright © 1995 Elsevier Science Ltd Printed in the USA. All rights reserved 0047-2352/95 $9.50 + .00 0047-2352(95)00004-6 CRIME, NEIGHBORHOOD PERCEPTIONS, AND THE UNDERCLASS" THE RELATIONSHIP BETWEEN FEAR OF CRIME AND CLASS POSITION JEFFRY A. WILL Department of Sociology and Criminal Justice University of North Florida Jacksonville, Florida 32224 JOHN H. MCGRATH Department of Sociology Virginia Commonwealth University Richmond, Virginia 23284 ABSTRACT Fear of crime and the underclass represent two of the more prominent topics of discussion within the realms o f criminology and sociology over the past several decades. There is little research, however, ty- ing these topics together. Recently, a call has been reissued for the further understanding of the relation- ship between crime and class. Such an examination is essential to the understanding of fear of crime as well. In this article, an attempt is made to meld the two seemingly divergent areas of fear of crime and the underclass in order to develop a more thorough understanding of neighborhood fear. With the use of secondary data, the extent to which this underclass offers a useful model for analysis of neighbor- hood issues is investigated. In particular crime, fear, and perceptions of victimization among members of the underclass are examined. INTRODUCTION Two of the more prominent topics of dis- cussion within the realms of criminology and sociology over the past decade have been fear of crime and the underclass. Fear of crime as a social phenomenon became a research topic in the late 1960s and has been emphasized by criminologists ever since (Baumer, 1985; Liska, Sanchirico, and Reed, 1988). Within the main- stream media, fear of crime has been even more pronounced over the past several years. A brief review of general periodicals found over 100 citations in major national and re- 163
Transcript of CRIME, NEIGHBORHOOD PERCEPTIONS, AND THE UNDERCLASS THE

Pergamon Journal of Criminal Justice, Vol. 23, No. 2, pp. 163-176, 1995
Copyright © 1995 Elsevier Science Ltd Printed in the USA. All rights reserved
0047-2352/95 $9.50 + .00
0047-2352(95)00004-6
CRIME, NEIGHBORHOOD PERCEPTIONS, AND THE UNDERCLASS" THE RELATIONSHIP BETWEEN FEAR
OF CRIME AND CLASS POSITION
JEFFRY A . WILL
Department of Sociology and Criminal Justice University of North Florida Jacksonville, Florida 32224
JOHN H. MCGRATH
Department of Sociology Virginia Commonwealth University
Richmond, Virginia 23284
ABSTRACT
Fear of crime and the underclass represent two of the more prominent topics of discussion within the realms of criminology and sociology over the past several decades. There is little research, however, ty- ing these topics together. Recently, a call has been reissued for the further understanding of the relation- ship between crime and class. Such an examination is essential to the understanding of fear of crime as well. In this article, an attempt is made to meld the two seemingly divergent areas of fear o f crime and the underclass in order to develop a more thorough understanding of neighborhood fear. With the use o f secondary data, the extent to which this underclass offers a useful model for analysis o f neighbor- hood issues is investigated. In particular crime, fear, and perceptions of victimization among members o f the underclass are examined.
INTRODUCTION
Two o f the more prominent topics of dis- cussion within the realms of criminology and sociology over the past decade have been fear of crime and the underclass. Fear of crime as a social phenomenon became a research topic
in the late 1960s and has been emphasized by criminologists ever since (Baumer, 1985; Liska, Sanchirico, and Reed, 1988). Within the main- stream media, fear of crime has been even more pronounced over the past several years. A brief review of general periodicals found over 100 citations in major national and re-
163

164 J.A. WILL and J. H. McGRATH
gional print media outlets over the last two years.
Similarly, research on the underclass also gained prominence in the 1960s and resurfaced in the 1980s after a decade hiatus following the negative reaction to the Moynihan (1965) report on the Black family. Apparently, re- searchers shied away from this area of re- search to avoid being labeled as racist (Cook and Curtin, 1987; Wilson, 1986). A library ci- tation search found over 150 references to the underclass over this same period.
There is little research, however, tying these topics together. The development of these two ostensibly separate topics has not been with- out some overlap; indirect and unintentional as this may have been. Due to both theoreti- cal and methodological limitations, much of the research on fear of crime has centered around neighborhood concerns. Many of these studies center on resident reactions and fear in inner-city neighborhoods, and they fre- quently attempt to understand fear in light of the respondents' previous victimization or lev- els of crime in the neighborhood in question. Research on the underclass also centers fre- quently on neighborhood situations, with many of the writers examining the prevalence of crime among various subgroups within this class.
Recently, however, a call has been reissued for the further understanding of the relation- ship between crime and class (Hagan, 1992). Such an examination is essential to the under- standing of fear of crime as well. In this arti- cle, a model that will attempt to meld the two seemingly divergent areas of fear of crime and the underclass is developed in order to form a more thorough understanding of neighbor- hood fear.
Review of Research on Fear o f Crime
Liska, Sanchirico, and Reed (1988: 835- 836) state, "Fear of crime is a very important social problem about which we know very lit- tie." As Stafford and GaUe (1984) discussed, much of the research on fear of crime has pointed to a unique paradox. That is, those groups who appear most fearful of crime are
those least likely to be victimized. In particu- lar, women and the elderly, who show the highest levels of fear of crime, appear to have the lowest levels of victimization (Baumer, 1985; Clemente and Kleiman, 1976, 1977; La- grange and Ferraro, 1989; Akers et al., 1987).
Literature on crime fear focuses on two pri- mary concerns. First, who is fearful and when? Second, how can we tell? In addition to women and the elderly, a variety of research projects have also focused on the effects of fear of crime on buying handguns (Bankston et al., 1990; Defronzo, 1979) and constraints on personal behavior patterns (Liska, San- chirico, and Reed, 1988; Gates and Rohe, 1987). Results from these studies, however, are inconclusive as to explaining the overall impact of fear of crime on personal behavior. Some studies indicate that fear of crime ap- pears to be only marginally related to actually experiencing crime (Liska, Sanchirico, and Reed, 1988), while others indicate a significant relationship between fear and victimization (Smith and Hill, 1991). Still others report con- tradictory findings in studies that examine neighborhood cohesion and social activity (Hartnagel, 1979; Taylor and Hale, 1986).
Several studies from the 1970s concluded that fear of crime and socioeconomic status were inversely related (Clemente and Kleiman, 1977), although more recent observers have noted that income and social class are posi- tively related to fear of crime or are not use- ful in predicting fear (Moeller, 1989). Fewer recent studies, however, include a systematic analysis of the relationship of socioeconomic class and crime fear. A few do include income measures in the analysis which were significant but were not emphasized in the discussion (e.g., Liska, Sanchirico, and Reed, 1988; Baumer, 1985; Leibowitz, 1975). These find- ings were frequently presented in terms of neighborhood fear, with neighborhood socio- economic makeup used as the primary descrip- tor (Lewis and Salem, 1986).
How one measures fear of crime has also been important in focusing this research. La- grange and Ferraro (1989) argue that two problems plague fear of crime measures. First, the measures used are not necessarily measur-
Fear of Crime and Class Position 165
ing fear, but rather are measuring the risk of being victimized (Lagrange and Ferraro, 1989:698). For example, asking respondents if they are likely to be a victim of a crime mea- sures perceived risk, not fear. Second, is the concern that some of the most commonly used measures of crime are too simplistic. For ex- ample, many studies used single measures of fear of crime. They ask respondents, in one variation or another, "How safe do you feel being out alone in your neighborhood at night?" (Liska, Lawrence, and Sanchirico, 1982; Akers et al., 1987; Hartnagel, 1979) La- grange and Ferraro (1989:699) argue that such items are inadequate because crime is only im- plied and, as single items, these measures are prone to error and cannot specify which crimes one fears• As a result, a number of studies fol- lowing these and other recommendations, have included a battery of items concerning fear of crime to overcome single item measurement problems (cf., Lagrange and Ferraro, 1989; Warr and Stafford, 1983).
Defining the Underclass
The debate over the precise definition of class is extensive and can hardly be decided in these few pages. Some understanding of the use of the term "underclass," and the impli- cations such use has in American society is im- portant. As defined, underclass is a direct reference to a society with a general set of classes, including, perhaps, a working class and a land owning class. In their 1987 discus- sion of various approaches to defining the un- derclass, Cook and Curtin attempt to lay out the general outlines of various approaches for defining the underclass.
The most straightforward discussions of the underclass center on describing them as the extremely poor, such as homeless members of the population. By this definition, the under- class are those members of the population whose incomes, by official designation, fall below the poverty line and, thus, are eligible for various and varying forms of governmen- tal assistance. Defining these conditions of poverty is not as straightforward as would be expected, however. In general, poverty as de-
fined by the government is used as a defini- tive indicator of the underclass. Conservative and liberal debate over exactly what should be included as income in order to qualify for in- clusion in the ranks of the poor tends to cloud this indicator. For some, income should in- clude "in kind" benefits received from the gov- ernment, such as food stamps, housing subsidies, and medical assistance (e.g., Mur- ray, 1984). Others believe that official defini- tions of poverty highly underestimate the effect of income deprivation, and that the minimum required income levels for poverty association are too low (Rossi and Wright, 1989; Wilson, 1989; Shapiro and Greenstein, 1988; Bergmann, 1986). Finally, some com- mentators see the definitional problems as less important than specifying the length of time people are poor or destitute. Cook and Cur- tin (1987) cite more straightforward sociolog- ical discussions (Wilson, 1989; Cook et al., 1988) of the underclass as ones that examine material well-being rather than just income levels. In one of the more visible discussions of the underclass, William J. Wilson (1987) de- fines the underclass as:
• •. the most disadvantaged segments of the black urban community, that heterogeneous grouping of families and individuals who are outside the mainstream of the American Oc- cupational System. Included in this group are individuals who lack training and skills and ei- ther experience long term spells of unemploy- ment or are not members of the labor force, individuals who are engaged in crime and other forms of aberrant behavior, and families that experience long spells of poverty and or wel- fare dependence. These are the populations to which we refer when we speak of the under- class. (Wilson, 1987:8)
From a sociological view, inclusion of demo- graphic and quality of life characteristics, as well as general lack of income, is important for understanding the makeup of the underclass.
A number of researchers examining the un- derclass have focused on the presence of ex- treme poverty among Black Americans, and particularly the inner-city Black poor. These
166 J.A. WILL and J. H. McGRATH
studies suggest that "first, they are predomi- nately unemployed and u n d e r e m p l o y e d . . . they are predominantly b l a c k . . , they are es- sentially an urban p o p u l a t i o n . . , and, most importantly, they lack prospects for social mo- bility" (Rolison, 1991:288).
In addition, Massey (1990) argues that the indicators of membership in the underclass should also include segregation (in particular racial segregation) of the population from the economic and social resources which would al- low for full participation in society. In partic- ular, Massey (1990:330) argues that without racial segregation "the economic dislocations of the 1970s would not have p r o d u c e d . . , a socially and spatially isolated underclass."
Finally, a number of researchers have fo- cused on the extent to which this underclass represents a distinct cultural phenomenon, ex- amining sexual behavior and family disrup- tions among the underclass (Anderson, 1989; Wilson, 1987), criminal and antisocial behav- ior among members of the underclass, partic- ularly young males (Murray, 1984; Wilson, 1987; Jenks, 1991), and the increase in unwed mothers dependent on welfare (Wilson, 1987). Whether explicitly stated as being a culturally (and morally) degenerate segment of the pop- ulation (cf., Murray, 1984) or seen as products of the effects of, and responses to, structural conditions (Wilson, 1987; Jenks, 1991), some commentators are concerned that this line of research is tantamount to "blaming the victim" for ills that, for the most part, are beyond the immediate remedial control of those persons most effected and is simplistic public policy implications (Greenstone, 1991; Jenks, 1991).
Although this discussion of the various ap- proaches examining the characteristics of the underclass is only skeletal, the influence of some of these positions on the overall debate has caused some concern (Rolison, 1991). These various theoretical positions are open for, and are engaged in, extensive debate. For the purposes of this study, however, there is more concern with an overlap between fear of crime and class position. The underclass in this study represents the segment of the population that falls significantly below the poverty line,
with special considerations of the affect of race and inner-city location on fear of crime.
SOME GENERAL HYPOTHESES
Given the unexamined overlap discussed above among the research on fear and the un- derclass, it is believed that important under- standing of the mechanisms of fear is lacking. This study is an exploratory attempt to address the issue of the relationship between underclass membership and fear of crime. In general, none of the previous fear of crime research ad- dresses how fear impacts upon the underclass or the extent to which underlying factors facing this group exacerbates such fear. In this study, several general hypotheses will be examined.
1. As with previous research findings, women, the elderly, and inner-city residents are more likely to indicate higher levels of fear of crime than men, the young, and residents of non- city locales.
2. Persons classified as the underclass-in par- ticular, those persons who fall below the pov- erty line, minorities, and those who have experienced periods of unemployment- will show increased levels of fear of crime regard- less of gender, age, city size, or other factors. Being poor, particularly extremely poor, in- creases the likelihood of neighborhood fear.
3. Those persons who see the need for increased funding for neighborhood police presence, assisting big cities with dealing with prob- lems, and increased support for welfare pro- grams will show increased levels of fear because of their concern that not enough is being done to protect them.
4. Poor persons are less likely to show confi- dence in their government and business lead- ers. This lack of confidence is associated with increasing levels of neighborhood fear.
DATA AND MEASURES
The use of secondary data is not always op- timal for developing alternative approaches to studying anything. Using such data requires one to accept the shortcomings of the mea-

Fear of Crime and Class Position 167
surement vehicles produced by the authors of the original data. The goal of this study is to provide an exploratory framework for the de- velopment of a more useful theory of fear of crime with regard to the underclass. The op- timal data set would include: a variety of mea- sures of fear of crime, precise measures of the underclass, a coordinated set of items address- ing the social and structural concerns facing members of the underclass (and society at large), as well as the requisite related de- mographic characteristics most frequently associated with fear of crime research. Unfor- tunately, such a detailed and comprehensive data set is not available. An exploratory study using secondary data analysis provides for ap- proximate measures which adequately address these concerns.
To this end, this study utilizes data from the 1987 General Social Survey to explore the ex- tent to which neighborhood fear and the un- derclass are complimentary areas of research. It is believed that, given previous research which utilized this data set (as well as ones using a similar measure), it is instructive to see the interaction between fear and the under- class discussed above. Once this relationship is established, future research will warrant more inclusive measures of both fear of crime and the underclass.
Neighborhood Fear
As noted, accurate and appropriate mea- sures of fear of crime are not easily devised or agreed upon. The same could easily be said about the definition of neighborhood. Exactly what constitutes one's neighborhood is vari- able, often delineated only in unwritten and / or unspoken understanding among members of that community. A former writer for the New York Post preferred the definition of neighborhood as offered by a Puerto Rican la- borer: "A neighborhood is where, when you go out of it, you get beat up." Given this defi- nition, it would follow that neighborhood fear constitutes being afraid, even within one's neighborhood, of being beat u p . 1 Although it is not the optimal definition of neighborhood,
in this study, neighborhood is defined as the general area in which one lives.
Various researchers have addressed con- cerns about how to assess fear of crime. The 1987 General Social Survey included one item which addresses this issue of neighborhood fear of crime. The item asked respondents, "Is there any area right around here where you would be afraid to walk alone at night?" A similar item was used by Baumer (1985), Garo- falo (1979), and Clemente and Kleiman (1976). A multiple indicator model of neighborhood fear is preferable; however, the widespread use of this question offers some consistency in comparing results to other research.
The Underclass
Although some concerns have been ex- pressed about the quality and quantity of data on the poor (particularly the extremely poor) that are obtained through standard survey re- search methods (Beeghley, 1989), the General Social Survey (GSS) represents one of the more thorough and comprehensive research efforts. Additionally, the GSS contains a num- ber of measures of respondent socioeconomic conditions which allow for a variety of com- posite measures. The primary measure of underclass used here is a postinterview con- structed item which indicated whether the re- spondent's household would be considered poor (with household income below approxi- mately 80 percent of the poverty line), border- line poor (ranging from approximately 80 percent to 112 percent of the poverty line), or not poor (above the borderline cutoff of ap- proximately 112 percent of the poverty line). 2
Sociodemographic Characteristics
In addition to the respondent's poverty sta- tus, demographic characteristics including re- spondent race, age, gender, unemployment status, city size, and marital status are in- cluded in the analysis. Race, age, gender, em- ployment status, and city size are common demographic measures used in fear of crime research and studies on the underclass. Mari-

168 J . A . WILL and J. H. McGRATH
tal status and number of children were in- cluded as proxy measures for family structure and stability in order to examine how personal attachment to others is related to neighbor- hood fear. Also, respondent victimization measures, such as being shot at with a gun, be- ing hit, being robbed, and having a burglary of one's home were included. A number of studies have examined the impact of victim- ization on levels of fear with mixed results. Al- though these measures are subjective, and the extent of their impact on the respondent is not known, such victimization measures do pro- vide some measure of the impact of the direct experience of crime on fear.
Social~Structural Measures
In order to examine the extent to which the relationship between neighborhood fear and the underclass might be related to issues which respondents have concerning more broadly de- fined social or structural constraints, a num- ber of items are also examined which address the relationship between neighborhood fear and respondents' perceptions of government spending on dealing with social problems, con- fidence in government, overall satisfaction lev- els with one's life and/or community situation, and perceptions of overall levels of conflict within the society. These variables are loosely considered structural in that they represent factors which are, for the most part, beyond
the basic control of the individuals- particu- larly members of the underclass.
RESULTS
Table 1 presents the response distributions for neighborhood fear and the measure of pover ty- the two primary variables examined in this study. As can be seen in this table, four out of ten respondents indicated that he or she did not feel comfortable walking the area right around where he or she lived.
Table 1 also presents the distribution of the poverty line measure as constructed in the General Social Survey. The poor and imputed poor categories were combined and labeled the poor. The borderline and imputed categories were combined to form the borderline group, and the nonpoor and imputed nonpoor were combined in similar fashion. In all, slightly less than 16 percent of respondents were con- sidered to be poor, while an additional 2.6 percent bordered on the poverty line. This rep- resents slightly more than the official poverty rate for 1987 as set by the U.S. government. Approximately 85 percent of the GSS respon- dents were classified as not poor.
Of particular concern for this study is the extent to which being a member of the under- class affects levels of neighborhood fear. That is, do members of the underclass show ele- vated levels of fear of crime? If so, is this the case across a number of other predictors of
TABLE 1
DISTRIBUTION OF RESPONSES TO FEAR AND UNDERCLASS ITEMS
Response N %
Fear: "Is there any area right around here where you would be afraid to walk alone at night?."
Measure of poverty
Yes 721 40.0 No 1,083 60.0 Valid N 1,804 100.0
Category N %
Poor 281 15.6 Borderline 46 2.6 Not poor 1,472 84.8 Valid N 1,799 100.0
Fear of Crime and Class Position 169
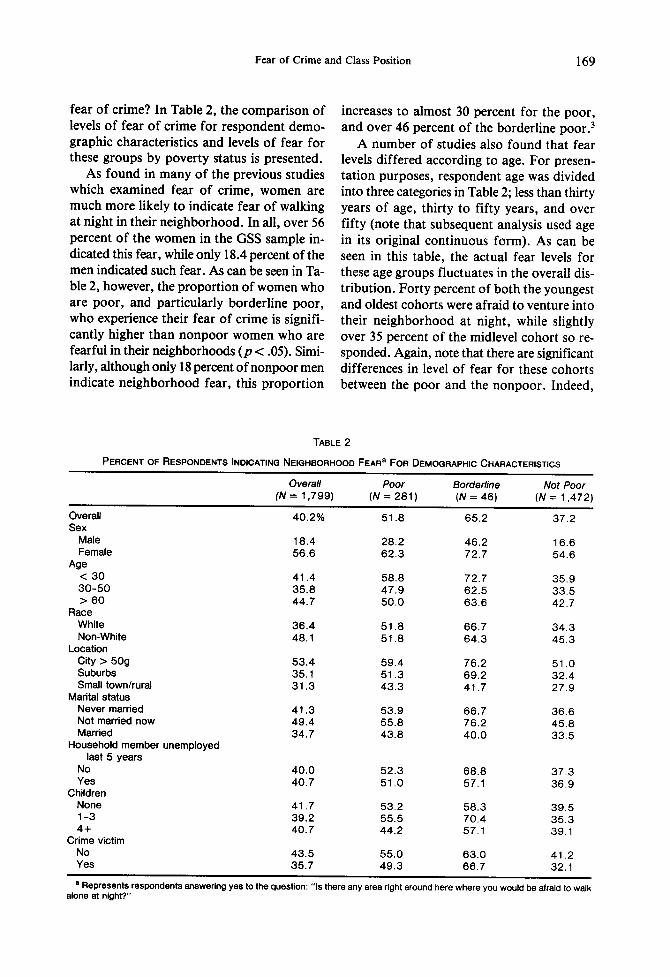
fear of crime? In Table 2, the comparison of levels of fear of crime for respondent demo- graphic characteristics and levels of fear for these groups by poverty status is presented.
As found in many of the previous studies which examined fear of crime, women are much more likely to indicate fear of walking at night in their neighborhood. In all, over 56 percent of the women in the GSS sample in- dicated this fear, while only 18.4 percent of the men indicated such fear. As can be seen in Ta- ble 2, however, the proportion of women who are poor, and particularly borderline poor, who experience their fear of crime is signifi- cantly higher than nonpoor women who are fearful in their neighborhoods (p < .05). Simi- larly, although only 18 percent of nonpoor men indicate neighborhood fear, this proportion
increases to almost 30 percent for the poor, and over 46 percent of the borderline poor. 3
A number of studies also found that fear levels differed according to age. For presen- tation purposes, respondent age was divided into three categories in Table 2; less than thirty years of age, thirty to fifty years, and over fifty (note that subsequent analysis used age in its original continuous form). As can be seen in this table, the actual fear levels for these age groups fluctuates in the overall dis- tribution. Forty percent of both the youngest and oldest cohorts were afraid to venture into their neighborhood at night, while slightly over 35 percent of the midlevel cohort so re- sponded. Again, note that there are significant differences in level of fear for these cohorts between the poor and the nonpoor. Indeed,
TABLE 2
PERCENT OF RESPONDENTS INDICATING NEIGHBORHOOD FEAR a FOR DEMOGRAPHIC CHARACTERISTICS
Overall Poor Borderline Not Poor (N = 1,799) (N = 281) (N = 46) (N = 1,472)
Overall 40.2% 51.8 65.2 37.2 Sex
Male 18.4 28,2 46.2 16.6 Female 56.6 62.3 72.7 54.6
Age < 30 41.4 58.8 72.7 35,9 3 0 - 5 0 35.8 47.9 62.5 33.5 > 60 44.7 50.0 63.6 42.7
Race White 36.4 51.8 66.7 34.3 Non-White 48.1 51.8 64.3 45.3
Location City > 50g 53.4 59.4 76.2 51.0 Suburbs 35.1 51.3 69.2 32.4 Small town/rural 31.3 43.3 41.7 27.9
Marital status Never married 41.3 53.9 66.7 36.6 Not married now 49.4 55.8 76.2 45.8 Married 34.7 43.8 40.0 33.5
Household member unemployed last 5 years
No 40.0 52.3 68.8 37.3 Yes 40.7 51.0 57.1 36.9
Children None 41.7 53.2 58.3 39,5 1 -3 39.2 55.5 70.4 35.3 4 + 40.7 44.2 57.1 39.1
Crime victim No 43.5 55.0 63.0 41.2 Yes 35.7 49.3 66.7 32.1
a Represents respondents answering yes to the question: "Is there any area right around here where you would be afraid to walk alone at night?."

170 J . A . WILL and J. H. McGRATH
over 60 percent of the borderline poor respon- dents showed neighborhood fear, as is the case for over 70 percent of the youngest cohorts. Al- most 60 percent of the youngest cohorts who were poor showed neighborhood fear. On the other hand, only 35 percent of the nonpoor youths said they were afraid in their neighbor- hood. Again, for each of these age cohorts, differences in levels of fear by relation to the poverty line were significant (p < .001 for low- est cohorts; p < .1 for elderly).
When Table 2 is examined for the effect of city size on levels of neighborhood fear, pre- vious research is again supported overall. Over half of the GSS respondents who live in cities with fifty thousand or more residents indi- cated that they are afraid to walk in their neighborhood at night. Only about one-third of the residents of suburbs or small towns and rural areas indicated that they were fearful.
When this fear is examined in relation to class position, however, it is found that residents in all areas who are poor show much higher lev- els of neighborhood fear than do nonpoor res- idents. In large cities, almost 60 percent of the poor and over three-fourths of the borderline poor indicate that they are afraid to walk around their neighborhood at night. For non- poor residents of big cities, one-half of the residents indicated this fear. This is a high pro- portion, yet significantly lower than for poor residents (p < .05). Differences in levels of neighborhood fear were even greater when com- paring poor and nonpoor in the suburbs (p < .001) and small towns and rural areas (p < .01).
It should be noted that for some of these demographic variables, the cells in the border- line poor column contain a limited number of cases. It can be seen throughout Table 2 that there is a drastic difference between the pro-
TABLE
CORRELATION MATRIX FOR NEIGHBORHOOD
Fear Underclass c
Confidence Variables a Spending Variables b
Leg. Fed. Business Crime Welfare City
Fear 1 .0 Underclass .131 ** 1 .0 Legislature - . 0 2 3 - . 0 0 6 1.0 Federal . 025 .004 . 3 6 4 " * 1 .0 Business . 038 . 0 9 5 * * . 2 6 5 * * .291 ** 1 .0 Crime - . 0 7 9 * * . 007 - . 0 0 6 - . 0 0 9 - . 0 1 7 1.0 Welfare - . 0 6 2 * * - . 0 9 5 * * .037 - . 0 8 3 * * - . 0 6 0 * - . 0 2 1 1.0 City - . 0 7 2 " * - . 0 3 5 .041 - . 1 4 0 " * - . 0 6 6 * . 1 8 2 " * . 1 1 4 " * 1 .0 Race - . 0 6 8 * * - . 1 1 9 " * . 039 - . 1 2 0 " * - . 1 1 7 " * . 0 8 8 * * . 2 6 5 " * . 3 6 3 " * Black . 1 0 5 " * . 2 6 7 * * . 006 . 1 3 2 " * . 1 6 1 " * - . 0 1 2 - . 2 0 9 * * - . 2 4 7 " * Sex - . 3 8 4 * * - . 1 1 8 " * . 019 - . 0 1 5 - . 0 1 7 . 040 . 0 4 8 * .030 Age . 0 4 8 * .022 .004 - . 0 0 8 - . 0 1 5 - . 0 5 7 * .046 . 0 5 9 " Marital . 1 1 4 " * . 2 1 4 " * - . 0 3 1 .042 .029 .046 - . 1 3 1 ** - . 1 6 1 ** City size - . 1 7 6 * * - . 0 0 4 - . 0 5 1 " - . 0 7 7 " * - . 1 1 1 " * . 028 . 0 8 5 * * . 2 5 2 * * Unemployment .006 . 1 1 8 " * . 006 . 0 5 5 * . 0 5 5 * .013 - . 0 8 0 * * - . 0 5 3 " Children - . 0 0 8 .121 ** - . 0 0 2 .007 .018 - . 0 1 5 - . 0 0 4 - . 0 5 4 * Victim h - . 0 8 0 " * . 043 . 0 8 6 * * . 0 8 6 * * . 035 .031 - . 0 5 9 * - . 0 4 5
Mean . 386 . 160 2 . 0 2 4 2 . 1 2 9 1 .797 1 .466 1 .636 1.911 SD ( .487) ( .367) ( .591) ( .681) ( .588) ( .615) ( .784) ( .786)
Note: ** = p < . 0 1 , * = p < . 0 5 . aVariables are coded 1 = great deal, 2 = some, 3 = hardly any. bVariables are coded 1 = too little, 2 = about right, 3 = too much. Cpoor and borderline poor respondents have been combined. 1 = underclass, 0 = not poor. dFor this variable, 0 = female, 1 = male. eFor this variable, 1 = married, 2 = not married. fFor city size, 1 = city 50,000+, 2 = suburbs and medium cities, 3 = small towns and rural. gThis variable measures unemployment experience for any adult household member within 5 years. For this variable, 0 = no experi-
ience with unemployment, 1 = experience. hRepresents having been a victim of any one of the following: burglary, robbery, physical attack, or having been shot at with
a gun.
Fear of Crime and Class Position 171
portion of the poor who are fearful and the nonpoor who show such fear. For the most part, these differences are significant at least at the p < .05 level. Exceptions to this trend are found only with regard to families with four or more children.
Thus, the traditional variables of gender, race, and age are significantly related in bivar- iate analysis of neighborhood fear. As Table 2 also shows, however, where one is positioned in relation to poverty has an additional impact on levels of fear. The poor (and near poor) are significantly more likely to show levels of neighborhood fear than those who are not poor.
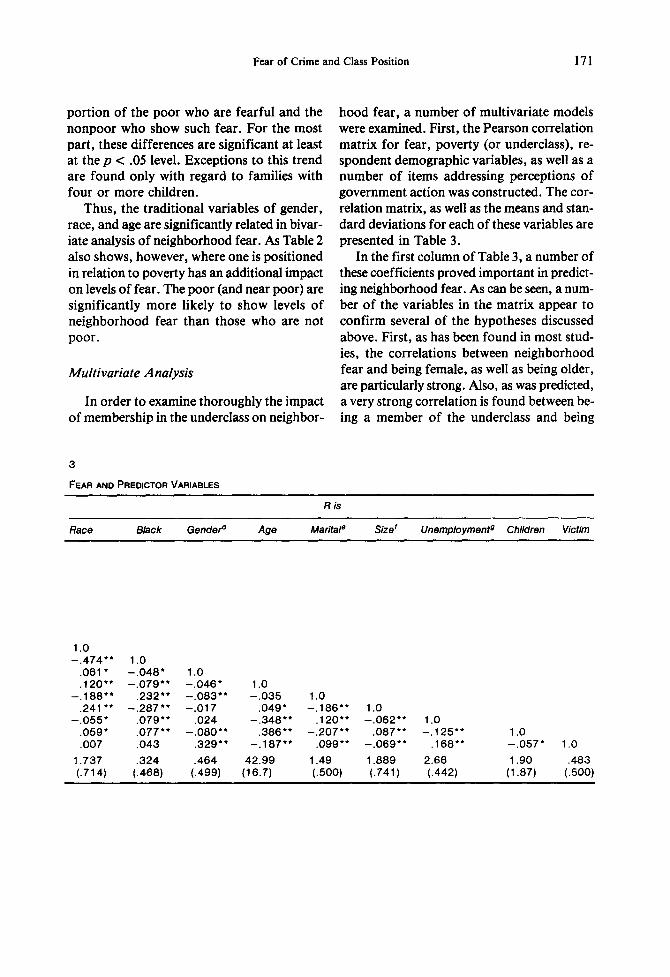
Multivariate Analysis
In order to examine thoroughly the impact of membership in the underclass on neighbor-
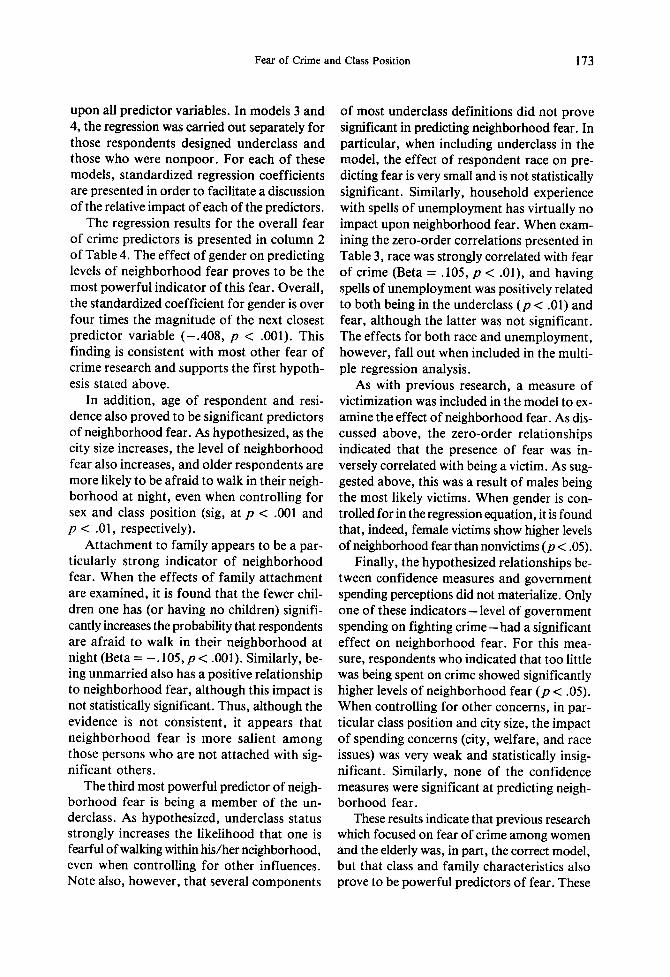
hood fear, a number of multivariate models were examined. First, the Pearson correlation matrix for fear, poverty (or underclass), re- spondent demographic variables, as well as a number of items addressing perceptions of government action was constructed. The cor- relation matrix, as well as the means and stan- dard deviations for each of these variables are presented in Table 3.
In the first column of Table 3, a number of these coefficients proved important in predict- ing neighborhood fear. As can be seen, a num- ber of the variables in the matrix appear to confirm several of the hypotheses discussed above. First, as has been found in most stud- ies, the correlations between neighborhood fear and being female, as well as being older, are particularly strong. Also, as was predicted, a very strong correlation is found between be- ing a member of the underclass and being
3
FEAR AND PREDICTOR VARIABLES
Ris
Race Black Gender ~ Age Marital e Size r Unemployment g Children Victim
1.0 - . 4 7 4 " * 1.0
.061" - . 0 4 8 * 1.0
.120"* - . 0 7 9 * * - . 0 4 6 * 1.0 - . 1 8 8 " * .232** - . 0 8 3 * * - . 0 3 5
.241"* - . 2 8 7 * * - . 0 1 7 .049* - . 0 5 5 " .079** .024 - . 3 4 8 * *
.059* .077"* - . 0 8 0 * * .386"*
.007 .043 .329"* - . 1 8 7 " *
1.737 .324 .464 42.99 (.714) (.468) (.499) (16.7)
1.0 - . 1 8 6 " * 1.0
.120"* - . 0 6 2 * * 1.0 - . 2 0 7 * * .087"* - . 1 2 5 " * 1.0
.099"* - . 0 6 9 * * .168"* - . 0 5 7 " 1.0
1.49 1.889 2.66 1.90 .483 (.500) (.741) (.442) (1.87) (.500)
172 J . A . WILL and J. H. McGRATH
afraid within one's neighborhood (p < .01). Members of the underclass are more likely to show neighborhood fear. Next, all of the co- efficients for the spending variables came out as predicted. Coefficients indicate that neigh- borhood fear is strongly correlated with re- spondents who believed too little was being spent on dealing with crime, welfare, condi- tions of Blacks, and problems facing big cit- ies. Blacks, unattached persons, those living in larger cities, and those who had been victims of crimes all showed strong and statistically significant correlations with neighborhood fear. In particular, note that the zero order re- lationship between fear and crime is negative. That is, being victimized (according to the measures utilized here) is an indication of de- creased likelihood of neighborhood fear be- ing present. Further examination of Table 3, however, suggests that this relationship is a by- product of the fact that men are most victim- ized (according to these measures) and also show the lowest levels of neighborhood fear.
Several hypothesized relationships are not supported in Table 3. None of the confidence measures proved significant in relation to levels of neighborhood fear. Similarly, having a his- tory of employment instability also is not an indicator of this fear. Note, however, that when the correlation between underclass and con- fidence in business is examined, it is found that the poor are less likely to have confidence in this group. Also, when the Pearson correlation coefficient is examined, it is found that the un- derclass are less likely to believe that additional money is needed to fight crime, although this finding is not statistically significant.
Multiple Regression Analysis
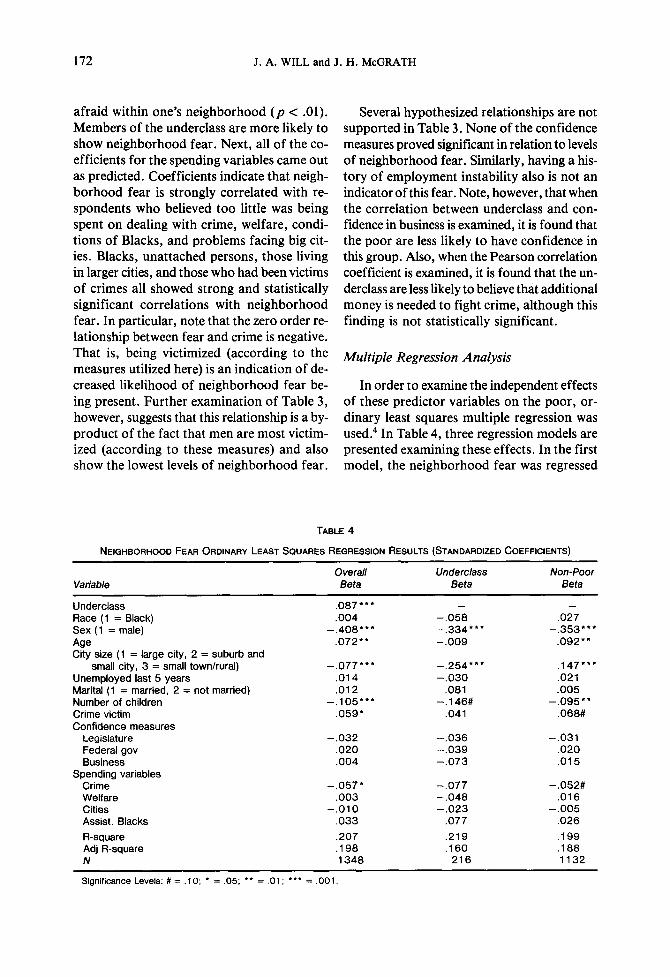
In order to examine the independent effects of these predictor variables on the poor, or- dinary least squares multiple regression was used. 4 In Table 4, three regression models are presented examining these effects. In the first model, the neighborhood fear was regressed
TABLE 4
NEIGHBORHOOD FEAR ORDINARY LEAST SQUARES REGRESSION RESULTS (STANDARDIZED COEFFICIENTS)
Overall Underclasa Non-Poor Variable Beta Beta Beta
Underclass .087 * * * - - Race (1 = Black) . 004 - . 0 5 8 .027 Sex (1 = male) - . 4 0 8 . . . . . 334 . . . . . 3 5 3 " * * Age . 0 7 2 " * - . 0 0 9 . 0 9 2 " * City size (1 = large city, 2 = suburb and
small city, 3 = small town/rural) - . 0 7 7 . . . . . 2 5 4 * * * . 1 4 7 * * * Unemployed last 5 years .014 - . 0 3 0 .021 Marital (1 = married, 2 = not married) . 012 .081 . 005 Number of children - . 1 0 5 " * * - . 146# - . 0 9 5 * * Crime victim . 0 5 9 * .041 .068# Conf idence measures
Legislature - . 0 3 2 - . 0 3 6 - - .031 Federal gov . 020 - . 0 3 9 . 020 Business .004 - . 0 7 3 . 015
Spending variables Crime - . 0 5 7 * - . 0 7 7 - . 0 5 2 # Welfare .003 - . 0 4 8 .016 Cities - . 0 1 0 - . 0 2 3 - . 0 0 5 Assist. Blacks . 033 .077 .026
R-square .207 .219 .199 Adj R-square .198 .160 .188 N 1 3 4 8 216 1 1 3 2
Significance Levels: # = .10; * = .05; ** = .01; *** = .001.
Fear of Crime and Class Position 173
upon all predictor variables. In models 3 and 4, the regression was carried out separately for those respondents designed underclass and those who were nonpoor. For each of these models, standardized regression coefficients are presented in order to facilitate a discussion of the relative impact of each of the predictors.
The regression results for the overall fear of crime predictors is presented in column 2 of Table 4. The effect of gender on predicting levels of neighborhood fear proves to be the most powerful indicator of this fear. Overall, the standardized coefficient for gender is over four times the magnitude of the next closest predictor variable (- .408, p < .001). This finding is consistent with most other fear of crime research and supports the first hypoth- esis stated above.
In addition, age of respondent and resi- dence also proved to be significant predictors of neighborhood fear. As hypothesized, as the city size increases, the level of neighborhood fear also increases, and older respondents are more likely to be afraid to walk in their neigh- borhood at night, even when controlling for sex and class position (sig, at p < .001 and p < .01, respectively).
Attachment to family appears to be a par- ticularly strong indicator of neighborhood fear. When the effects of family attachment are examined, it is found that the fewer chil- dren one has (or having no children) signifi- cantly increases the probability that respondents are afraid to walk in their neighborhood at night (Beta = - . 105, p < .001). Similarly, be- ing unmarried also has a positive relationship to neighborhood fear, although this impact is not statistically significant. Thus, although the evidence is not consistent, it appears that neighborhood fear is more salient among those persons who are not attached with sig- nificant others.
The third most powerful predictor of neigh- borhood fear is being a member of the un- derclass. As hypothesized, underclass status strongly increases the likelihood that one is fearful of walking within his/her neighborhood, even when controlling for other influences. Note also, however, that several components
of most underclass definitions did not prove significant in predicting neighborhood fear. In particular, when including underclass in the model, the effect of respondent race on pre- dicting fear is very small and is not statistically significant. Similarly, household experience with spells of unemployment has virtually no impact upon neighborhood fear. When exam- ining the zero-order correlations presented in Table 3, race was strongly correlated with fear of crime (Beta = . 105, p < .01), and having spells of unemployment was positively related to both being in the underclass (p < .01) and fear, although the latter was not significant. The effects for both race and unemployment, however, fall out when included in the multi- ple regression analysis.
As with previous research, a measure of victimization was included in the model to ex- amine the effect of neighborhood fear. As dis- cussed above, the zero-order relationships indicated that the presence of fear was in- versely correlated with being a victim. As sug- gested above, this was a result of males being the most likely victims. When gender is con- trolled for in the regression equation, it is found that, indeed, female victims show higher levels of neighborhood fear than nonvictims (p < .05).
Finally, the hypothesized relationships be- tween confidence measures and government spending perceptions did not materialize. Only one of these indicators- level of government spending on fighting c r ime- had a significant effect on neighborhood fear. For this mea- sure, respondents who indicated that too little was being spent on crime showed significantly higher levels of neighborhood fear (p < .05). When controlling for other concerns, in par- ticular class position and city size, the impact of spending concerns (city, welfare, and race issues) was very weak and statistically insig- nificant. Similarly, none of the confidence measures were significant at predicting neigh- borhood fear.
These results indicate that previous research which focused on fear of crime among women and the elderly was, in part, the correct model, but that class and family characteristics also prove to be powerful predictors of fear. These
174 J.A. WILL and J. H. McGRATH
findings did not, however, support earlier hy- potheses that confidence in government and/or perceptions examined here explain neighbor- hood fear. Overall, approximately 20 percent of the variance for measuring neighborhood fear can be explained in this analysis.
The Underclass and the Nonpoor
In addition to the overall levels of neigh- borhood fear, this study is concerned with the underclass and this group's relationship to fear. In columns 3 and 4 of Table 4, results from separate regressions for the underclass and nonpoor respondents are presented.
Perhaps most striking when comparing the differences between the neighborhood fear models of the underclass and nonpoor is that very few of the predictor variables proved sig- nificant for predicting underclass neighbor- hood fear. Indeed, only city of residence (where the larger the city, the more likely one is to be afraid) and gender had strong effects on neighborhood fear (each sigp < .001). Only one other predictor variable, number of chil- dren, came close to significance. As seen be- fore, the more children the respondents had, the less fearful they were, although this find- ing was only marginally significant (Beta = - . 146, p < .1). City size, race, victimization, and respondent age all proved to be weak and statistically insignificant predictors of neigh- borhood fear. Overall, the model predicting neighborhood fear among the underclass ex- plained 16 percent of the variance.
For the nonpoor, however, a number of other predictors proved important for under- standing neighborhood fear. As with the un- derclass, women and those with fewer children were more likely to be afraid in their neigh- borhood. Additional variables also proved im- portant for understanding fear. First, for the nonpoor, older persons were more significantly likely to be afraid to walk in their neighborhood at night (p < .01). Those persons who believed too little was being spent on fighting crime also were more afraid. Of particular note, how- ever, is the effect of being a victim of a crime. Although the findings are only marginally sig- nificant, the nonpoor respondents who had
been victimized were more likely to be afraid in their neighborhood (Beta = -.068, p < .1). Overall, the model predicting neighborhood fear for the nonpoor explains almost 19 per- cent of the variance.
DISCUSSION
This article has attempted to supplement previous research examining fear of crime. In particular, this article examines how neighbor- hood fear impacts upon members of the un- derclass. Very little can be found in reviews of previous research which examines the relation- ship between neighborhood fear and income, let alone the underclass. Although the mea- sures used in this study are not optimal, the implications from the findings suggest that ex- amining class relations and fear provides an important insight into understanding the over- all problem of fear of crime.
This analysis shows that, even when control- ling for the more commonly examined effects of gender and age, fear among the underclass is much higher than among the nonpoor. In- deed, the Stafford and Galle (1984) suggestion that fear of crime represents a paradox in that the least victimized may be the most fearful may not be so paradoxical for the underclass. The underclass are the most victimized popu- lation, particularly with regard to street crime. They are also the most fearful, particularly un- derclass women. Being a resident in a large city is also strongly tied to neighborhood fear, but, regardless of location, the poor are more fear- ful than the nonpoor.
Neighborhood watch groups, tenant orga- nizations, and "poor people's movements" against crime are usually portrayed in the me- dia as anomalies in an otherwise indifferent, crime-prone, and crime-accepting segment of the population. They are seen as rarities among an underclass whose lives seem integral with the presence of crime. Indeed, gun buy-back programs and efforts of previous gang mem- bers to work in the community are often por- trayed with skepticism, if not cynicism, by the media. Yet, the findings here suggest other-

Fear of Crime and Class Position 175
wise. These findings suggest that many of the underclass are very afraid. As seen in Table 3, some in this group want the government to put resources into programs for the poor and mi- norities, but this group also suffers from low levels of confidence that government will do the job (although these results are not strong predictors of neighborhood fear).
Finally, the findings from this study sug- gest that additional research needs to be car- ried out that more accurately focuses on the concerns and fears of the underclass. As a number of previous studies suggested, it is im- portant to understand which crimes drive this fear. Evidence suggests that the types of crime faced by the underclass are different than those faced by the nonpoor. Understanding how these differences are manifested would offer insights into how to deal with the prob- lem of fear of crime, as well as perhaps deal- ing with the types of crime facing these groups.
ACKNOWLEDGMENTS
We wish to thank Charles E. Owens, Bob Bursik, Mitch Chamlin, Bruce Arneklev, and several anonymous reviewers for help on this article. An earlier version of this article was presented at The American Society of Crimi- nology Annual Meetings, San Francisco, November 1991.
NOTES
1. Particular thanks for this definition of neighborhood goes to Bob Bursik, who revealed this definition in per- sonal correspondence.
2. The approximate relationship to the poverty line as explained here can be found in the General Social Survey Codebook. This measure is constructed from government definitions of poverty status. For a full description of this measure, see the General Social Survey Methodological Report #57 (Davis and Smith, 1987).
3. Note that the number of cases in the borderline cat- egory is quite limited. This designation is maintained here primarily for heuristic purposes. Subsequent multivari- ate analysis combines the poor and borderline cases.
4. Recent research has concluded that logistic regres- sion is advisable for most analysis of this order which in- clude dichotomous dependent variables. Although the dependent variable used here is dichotomous, the overall distribution of the responses to fear is such that ordinary least squares regression is warranted. Note that logistic regression and logit analysis techniques were also per- formed as a check on the overall findings.
REFERENCES
Akers, R., La Greca, A., Sellers, C., and Cochran, J. (1987). Fear of crime and victimization among the el- derly in different types of communities. Criminology 25:487-505.
Anderson, E. (1989). Sex codes and family life among poor inner city youths. In The annals: The ghetto un- derclass, ed. W. Wilson. Newbury Park, CA: Sage Publication.
Bankston, W., Thompson, C., Jenkins, Q., and Forsyth, C. (1990). The influence of crime, gender, and south- ern culture on carrying firearms for protection. The So- ciological Quarterly 31:287-305.
Baumer, T. (1985). Testing a general model of fear of crime: Data from a national sample. Journal o f Re- search in Crime and Delinquency 22:239-55.
Beeghley, L. (1989). The structure o f social stratification in the United States. Boston: Allyn and Bacon.
Bergmann, B. (1986). The economic emergence of women. New York: Basic Books.
Bursik, R., and Grasmick, H. (1993). Neighborhoods and crime: The dimensions o f effective community control. New York: Lexington Books.
Clemente, E , and Kleiman, M. (1977). Fear of crime in the United States: A multivariate analysis. Social Forces 56:519-31.
Clemente, E, and Kleiman, M. (1976). Fear of crime among the aged. The Gerontologist 16:207-10.
Cook, E, Barrett, E., Popkin, S., Constantino, E., and Kaufman, J. (1988). Convergent perspectives on social welfare policy: The views from the general public, mem- bers of Congress, and AFDC recipients. Evanston, IL: Center for Urban Affairs and Policy Research.
Cook, T., and Curtin, T. (1987). The mainstream and the underclass: Why are the differences so salient and the similarities so unobtrusive? In Social comparison, so- cial justice and relative deprivation: Theoretical empir- ical and policy perspectives, eds. J. Masters and W. Smith. Hillsdale, NJ: LEA Publishers.
Davis, J., and Smith, T. (1987). The general social sur- veys 1972-1987 [machine readable data file]. NORC ed. Chicago: National Opinion Research Center, producer. Storrs, CT: The Roper Center for Public Opinion Re- search, University of Connecticut, distributor.
Defronzo, J. (1979). Fear of crime and handgun owner- ship. Criminology 17:331-39.
Garofalo, J. (1979). Victimization and fear of crime. Jour- nal o f Research in Crime and Delinquency 16:80- 97.
Gates, L., and Rohe, W. (1987). Fear and reactions to crime: A revised model. Urban Affairs Quarterly 22:425-53.
Greenstone, J. (1991). Culture, rationality and the under- class. In The urban underclass, eds. C. Jenks and P. Peterson. Washington, DC: The Brookings Institute.
Hagan, J. (1992). The poverty of classless criminology- The American Society of Criminology 1991 presiden- tiai address. Criminology 30:1-18.
Hartnagel, T. (1979). The perception and fear of crime: Implications for neighborhood cohesion, social activ- ity and community affect. Social Forces 58:176-93.
Jenks, C. (1991). Is the American underclass growing? In The urban underclass, eds. C. Jenks and P. Peter- son. Washington, DC: The Brookings Institute.
Lagrange, R., and Ferraro, K. (1989). Assessing age and
176 J . A . WILL and J. H. McGRATH
gender differences in perceived risk and fear of crime. Criminology 4:697-719.
Leibowitz, B. (1975). Age and fearfulness: Personal and situational factors. Journal o f Gerontology 30:696-700.
Lewis, D., and Maxfield, M. (1980). Fear in the neigh- borhoods: An investigation of the impact of crime. Journal o f Research in Crime and Delinquency 17:160-89.
Lewis, D., and Salem, G. (1986). Fear o f crime: Incivil- ity and the production o f a social problem. New Bruns- wick, NJ: Transaction Books.
Liska, A., Sanchirico, A., and Reed, M. (1988). Fear of crime and constrained behavior specifying and estimat- ing a reciprocal effect model. Social Forces 66:827-37.
Liska, A., Lawrence, J., and Sanchirico, A. (1982). Fear of crime as a social fact. Social Forces 60:760-70.
Massey, D. (1990). American apartheid: Segregation and the making of the underclass. American Journal o f So- ciology 96:329-57.
Moeller, G. (1989). Fear of criminal victimization: The effect of neighborhood racial composition. Sociologi- cal lnquiry 59:208-21.
Moynihan, D. (1965). The Negro family: A case for na- tional action. Washington, DC: Office of Policy Plan- ning and Research, U.S. Department of Labor.
Murray, C. (1984). Losing ground: American social pol- icy 1950-1980. New York: Basic Books.
Rolison, G. (1991); An exploration of the term "under- class', as it relates to African-Americans. Journal o f Black Studies 21:287-301.
Rossi, P., and Wright, H. (1989). The urban homeless: A portrait of urban dislocation. In The annals: The ghetto underclass, ed. W. Wilson. Newbury Park, CA: Sage Publications.
Shapiro, I., and Greenstein, R. (1988). Holes in the safety net: Poverty programs and policies in the states. Wash- ington, DC: Center on Budget and Policy Priorities.
Smith, L., and Hill, G. (1991). Victimization rates and fear of crime. Criminal Justice and Behavior 18:217-39.
Stafford, M., and Galle, O. (1984). Victimization rates, exposure to risk, and fear of crime. Criminology 22: 173-85.
Taylor, R., and Hale, M. (1986). Testing alternative mod- els of fear of crime. Journal o f Criminal Law and Crim- inology 77:151-89.
Warr, M., and Stafford, M. (1983). Fear of victimization: A look at the proximate causes. Social Forces 61:1033- 43.
Wilson, W. (ed.). (1989). The annals: The ghetto under- class. Newbury Park, CA: Sage Publications.
Wilson, W. (1986). The truly disadvantaged." The inner city, the underclass and public policy. Chicago: Uni- versity of Chicago Press.