Crime in California - 2014 - Publications - Crime Data - Office of the ...

CRIMEIN CALIFORNIA
January 1994

Crime in California i
Table of Contents
Introduction.......................................................................................................... 1
What Is Crime?.......................................................................................................... 3
How Much Crime Is There in California?(Figure 7) 5
What Are the Trends in Crime in California?(Figures 10-13) 9
How Does Crime Vary Among Statesand Within California?(Figures 16-21) 15
Who Are the Victims of Crime?(Figures 20-21) 19
Who Commits Crime?(Figures 24-26) 23
How Does California'sCriminal Justice System Work?(Figures 28-40) 27
How Much Does Crime Cost?(Figures 42-45) 41
What Are the Policy Implications?........................................................................................................ 47
__ Legislative Analyst's Office~

Crime in California
Introduction
In recent years, the Legislature and Governor have enacted
numerous laws to respond to the public's concerns with crime in
California, including measures to stiffen penalties for existing criminal
offenses, define new criminal offenses, construct new correctional
facilities, and provide financial assistance to law enforcement. De
spite these responses, however, recent polls indicate that fear of
crime remains a top concern of Californians.
In an effort to put the current discussion of crime in California
in perspective, we have prepared this report to answer several key
questions, including:
How much crime is there in California?
What are the short-term and long-term trends in crime?
How does crime vary within California, and among the states?
Who are the victims and perpetrators of crime?
How does California's criminal justice system deal with crime?
What are the costs of crime?
• What are the policy implications for decision-makers?
Although this report is not designed to present comprehen
sive answers to all of these questions, it does provide basic infor
mation on these issues. It does this through a "quick reference"
document that relies heavily on charts to present the information.
The State of Crime in California. The message in this re
port about the state of crime in California is mixed. Crime has in
creased substantially over the last several decades. And although
the violent crime rate has increased steadily over the years, overall
,: Legislative Analyst's Office
1

2 Crime in California
crime reached its peak in California in 1980. National surveys in which
persons are asked whether they have been the victim of a crime
(whether reported to the police or not) confirm this trend nationwide.
Much of the increase in the violent crime rate is due to reporting
changes in assault that occurred in 1986. However, preliminary crime
data for the first six months of 1993 compared with the same period in
1992 indicate that all categories of violent crime (with the exception of
homicide) are down. And although the homicide rate has increased, it
still accounts for a tiny fraction of overall violent crime.
Legislative Analyst's Office

Crime in California
What Is Crime?
In its simplest definition, "crime" is any specific act prohibited by
law for which society has provided a formally sanctioned punishment.
This also can include the failure of a person to perform an act specifi
cally required by law.
Types of Offenses. Crimes are classified by the seriousness of
the offenses as follows:
A felony is the most serious offense, for which the offender maybe sentenced to state prison. Felonies generally include violentcrimes, sex offenses, and many types of drug and propertyviolations.
A misdemeanor is a less serious offense for which the offendermay be sentenced to probation, county jail, a fine, or somecombination ofthethree. Misdemeanors generally include crimessuch as assault and battery, petty theft, and public drunkenness.
An infraction is the least serious offense and generally ispunishable by a fine. Many motor vehicle violations are considered infractions.
California law permits law enforcement and prosecutors to charge
many types of crimes as either a felony or misdemeanor (known as a
"wobbler"), or as either a misdemeanor or an infraction. Most of the
resources of the criminal justice system are devoted to dealing with
felonies.
Categories of Crimes. In general, felonies, misdemeanors, and
infractions are classified in one of three broad categories: violent, prop
erty, and drug-related. Violent crime refers to events such as homi
cide, rape, and assault that result in an injury to a person. Robbery is
also considered a violent crime because it involves the use or threat
of force against a person.
Legislative Analyst's Office
3

4 Crime in California
Property crimes are offenses with the intent of gaining property
through the use or threat of force against a person. Burglary and
motor vehicle theft are examples. Such offenses are often referred to
as "household crimes."
Drug-related crimes, such as possession or sale of illegal nar
cotics, are generally in a separate category altogether. This is be
cause such offenses do not fall under the definition of either violent or
property offenses.
Society's Definition of Crime Can Change. Although many
offenses, such as homicide, robbery, and burglary, have been consid
ered crimes for centuries, changes in the values and moral attitudes
of society result in some conduct being criminalized while other con
duct is decriminalized. For example, in recent years California has
chosen to criminalize more severely drunken driving, while lessening
criminal penalties for possession of small amounts of marijuana.
Also, society'S attitudes toward the amount of punishment that
should be dealt out for particular crimes changes over time. For in
stance, the state has enacted many laws that increase the punish
ment for felonies and limit the discretion of state and local criminal
justice officials in dealing with offenders.
Legislative Analyst's Office

Crime in California
How Much CrimeIs There in California?
Although this is a simple question, the answer to it is often con
fusing because of the bewildering volume of crime statistics. For this
reason, it is important to first understand how crimes are counted.
Crime is counted in two different ways. One is based on official re
ports to law enforcement agencies, and is reflected in the national
Uniform Crime Reporting (UCR) data and the California Crime Index
(CCI) data. Crime is also counted based on surveys of individuals to
determine if they have been victims of crime, even though the crime
may not have been reported to the police. These data are obtained
from national victimization surveys.
Crimes as Counted by Law Enforcement Reports. For more
than 60 years, the FBI has collected criminal statistics from through
out the nation under the UCR Program. Under this program, law en
forcement agencies in California report information on crimes to the
state Department of Justice (DOJ), which forwards the data to the
FBI. In order to eliminate differences among various states' statutory
definitions of crimes, the UCR reports data only on selected crimes,
which are chosen because of their seriousness, frequency, and the
likelihood of being reported to law enforcement. The UCR crimes are
homicide, rape, robbery, assault, burglary, larceny-theft, motor ve
hicle theft, and arson.
The DOJ annually reports on California crime using the CCI. The
state's data are similar, but not identical, to the national data. The
state's data exclude larceny-theft and arson in order to maintain the
long-term consistency in the CCI trend.
Legislative Analyst's Office
5

6 Crime in Caiifornia
Crime as Counted by Victimization Surveys. The U.S. De
partment of Justice annually surveys households and organizations
regarding whether they have been victims of crimes. These studies,
known as victimization surveys, are conducted nationally, not on a
state-by-state basis, using scientific survey techniques.
Crime "Rates. "Crime data are often presented in terms of "rates."
A rate is defined as the number of occurrences of a criminal event within
a given population. For example, the overall crime rate in California
(according to the CCI) for 1992 was 3,491.5, which means that there
were about 3,492 reported crimes per 100,000 Californians in 1992.
Crime Is Underreporled. Crime statistics from law enforcement
agencies don't tell the entire story for two reasons. Victimization sur
veys generally show that there is a significant amount of crime com
mitted each year that is not counted in official statistics because it is
not reported to law enforcement authorities. However, the proportion
of crimes reported to law enforcement agencies has increased steadily
since the victimization surveys began in the early 1970s.
Some crimes are more likely to be reported than others. For
example, crimes involving personal injury or large economic loss are
more apt to be reported. Violent crimes that are attempted, but not
completed, and property crimes involving small amounts of money
are much less likely to be reported. According to the U.S. Department
of Justice, in 1992 about two-thirds of all crimes went unreported to
the police. Specifically, about 50 percent of all violent victim izations,
59 percent of all household crimes, and 70 percent of all personal
thefts went unreported.
Another reason for underreporting of crime is that sometimes
several crimes are committed by an offender at the same time, but
only one (usually the most severe) is counted in the data. For ex
ample, if an offender robbed a store, assaulted a clerk, and killed the
owner, only the homicide would be reported.
Legislative Analyst's Office

Crime in California
Most Crime Is Property Crime1992
Assault ViolentCrime
MolarVehicle HomicideTheft
Robbery
Rape
PropertyCrime
Burglary
• There were 3,492 reported crimes per 100,000 Californians in 1992.
• Property crime (burglary and motor vehicle theft) account for about70 percent of crimes reported in California in 1992 and vioient crime(homicide, forcible rape, robbery, and aggravated assault) accounted for about 30 percent.
• Although the proportion of violent crimes increased slightly in 1992from 1991, the general relationship of violent to property crimes(roughly 30 percent to 70 percent) has remained stable in recentyears.
Legislative Analyst's Office
7

8 Crime in California
Legislative Analyst's Office "1

Crime in California
What Are the Trends inCrime in California?
When considering the trends in crime, it is important to consider
both the long-term and the short-term directions of crime in the state.
Changes that occur over the years in demographics, economic condi
tions, social conditions and values, lifestyles, and residential patterns
have a significant impact on crime trends. In several of the charts that
follow, we present California crime data starting with 1952-the first
year in which the DOJ began publishing the statistics.
In addition to the reported crime data, it is also important to con
sider trends in victimization rates to obtain a truer picture of overall
trends in crime. As mentioned earlier, the national victimization sur
vey, which began in 1973, provides valuable data in this area. These
data are national in scope, however, and are not broken down specifi
cally for California.
9
Legislative Analyst's Office !

10 Crime in California
Crime Rate Peaked in California in 1980a
1952 Through 1992
Rate
4,000..--------------~-----__,
3,000
2,000
1,000 ,.d""""'"
52 55 60 65 70 75 80 85 90 92
a Rate per 100,000 population.
• California's crime rate, as measured by the California Crime Index(CCI), has increased about 290 percent since 1952. The state'spopuiation increased about 169 percent over the same period.
• The crime rate reached its peak in 1980, declined for four years, andbegan to increase in 1985, with much of the decline due to asignificant drop in property crime. Although there are probably manyreasons for the decline after 1980, many researchers consider theaging of the population (particularly the aging of "baby-boomers") asthe principal reason.
• Property crime-which accounts for the bulk of crime in Californiagrew at a slower rate (221 percent) than violent crime (621 percent)since 1952. Since 1982, the property crime rate has decreased by12 percent, while violent crime increased by 34 percent.
Legislative Analyst's Office

Crime in California 11
Assault and Robbery AreMost Prevalent Violent Crimes
a
1952 Through 1992
..........................................................................................................................1aa-b.c.::::::::::::::::::=:-
300
200
500
400
52 55 60 65 70 75 80 85 90 92
a Rate per 100,000 population.
• Assault and robbery account for more than 95 percent of all violentcrimes reported. Both offenses increased slightly in 1992 (2.6percent for assault and 2.4 percent for robbery).
• The substantial increase in reported assaults that occurred in 1986was due in large measure to enactment of legislation that reclassified domestic violence from a misdemeanor to a felony. Thus, thespike in the assault rate, and the corresponding increase in theoverall violent crime rate, was not due primarily to an increase in thenumber of crimes committed, but rather a change in the way thecrimes were reported.
• The homicide rate has increased substantially over the years (from2.4 in 1952 to 12.5 in 1992), butit decreased slightly between 1991and 1992, and remains about 1 percent of overall violent crime.
Legislative Analyst's Office

12
Property Crime DownDue to Drop in Burglary Rate
a
1952 Through 1992
Crime in California
Rate
2,500 -r---------=--:----,------------,
2,000
1,500
1,000
500
52 55 60 65 70 75 80 85 9092
a Rate per 100,000 population.
• Burglaries declined substantially from a high in 1980, including a 1.8percent drop from 1991 to 1992.
• Motor vehicle theft rates increased steadily until 1989 (with a sharpincrease between 1984 and 1989). Rates have declined slightlysince 1989.
• The decline in the burglary rate and the sharp increase in the motorvehicle theft rate was probably due to two factors: (1) enactment oflegislation in 1980 that denied probation to offenders convicted ofresidential burglary, thus making motor vehicle theft more attractive, and (2) demographic changes (particularly the aging of thepopulation).
Legislative Analyst's Office

Crime in California
National Victimization StudiesShow Decline in Overall U.S. Crimea1973 Through 1992
13
Rate
250-r------------------,
200
150
100
50
74 76 78 80 82 84 86 88 90 92
a Victimizations per 1,000 persons age 12 or older, or per 1,000 households.
• Like the California crime rate, national surveys in which persons areasked whether they have been the victim of a crime show that crimehas declined since its peak in the early 1980s. However, whileCalifornia's crime rate began to increase after 1984, the nationalvictimization surveys have shown a continuing downward trend.
• Since the surveys began in 1973, the data show a decline of 6percent In victimizations for all crimes, a 3 percent drop for household crimes (burglary, larceny, motor vehicle theft), and 18 percentfor personal theft. Violent victimizations, however, showed a 24percent Increase, but remained a small portion of the total.
• The national victimization surveys are an important measure of theactual amount of crime because the official crime rate data do notinclude crimes that go unreported to the police.
" Legislative Analyst's Office

14 Crime in California
i Legislative Analyst's Office ',,\1

Crime in California 15
How Does Crime Vary AmongStates and W ithin California?
Although there is value in comparing crime data among different
jurisdictions, one should be cautious with such comparisons. Numer
ous factors can influence crime rates, such as the composition of the
populations of different jurisdictions (particularly the age of the resi
dents), the density and size of the jurisdictions, the mobility of the
residents, economic and family conditions, strength and effectiveness
of the law enforcement agencies, crime reporting practices, and
most importantly-the laws and criminal justice policies of the jurisdic
tions. It is especially important not to oversimplify or draw quick con
clusions from comparisons without first understanding the differences
among the jurisdictions being compared.
The most complete information comparing state crime rates is
from the FBI. The most complete information for comparing crime
among jurisdictions within California is from the California DOJ and is
available on a county-by-county basis. In general, we believe that
only large industrial states with diverse populations and economies
should be compared. Comparison of counties should be limited to
comparing simiiar counties-for example, large counties (with popu
lations of 1 million or more), medium-sized counties, and small and
rural counties.
Legislative Analyst's Office

16
California's Crime Rate HigherThan Many Large States
a
Crime in California
1,000 2,000 3,000Rate
CJ 1982
• 1992
4,000
a Rate per 100,000 population in states with populations of 10 million or more.b Excludes California.
• California's 1992 crime rate is higher than the nation's rate and is thesecond highest among the large states.
• Florida's 1992 rate was the highest among the large states and wasabout 11 percent higher than California's rate. The highest rate inthe nation is in the District of Columbia, with a rate that is almosttwice as high as California's.
• Although California's crime rate has increased since 1982, theincrease has been slower than the increase for the nation as awhole, as well as Texas, Florida, and Illinois.
• California ranks third (behind Florida and New York) in overall violentcrime and second (behind Florida) in overall property crime. California ranks first in one individual crime-motor vehicle theft.
Legislative Analyst's Office '.',

Crime in California
Crime Rate in Other StatesIncreased Faster Than in California
a
1980 Through 1992
17
105..,..----------------------,Six Most Populous Slatesb
100
95
90
85
80
80 82 84 86 88 90 92
a Change in rate, indexed to 19aO.
b Excludes California.
• Since 1980, California's crime rate has followed a path similar to thatof the nation and the other six most populous states (states withpopulations of 10 million or more); however, California's rate fellfurther (from 1980 to 1984) and increased slower (from 1985 to1991 ).
• From 1991 to 1992, California's crime rate remained about the samewhile the rates for the rest of the nation and other large states fell.
Legislative Analyst's Office

18 Crime in California
Crime Rates Vary Among Countiesa
1992
Statewide Rate
Fresno liiiiiiii;~irSan FranciscoLos Angeles
RiversideSan Bernardino
San JoaquinSacramento
AlamedaSan Diego
KernContra Costa
Orange 1111Ventu ra
San MateoSanta Clara
1,000 2,000 3,000 4,000 5,000 6,000Rate
aCrime rates in counties with populations of 500,000 or more.
• Among those counties with populations of 500,000 or more, Fresnohad the highest crime rate in 1992-about 50 percent higher thanthe statewide rate. Santa Clara County's rate was the lowest andwas less than half the statewide rate.
• Comparing crime rates in 1982 and 1992, Santa Clara had thelargest drop and Fresno had the largest increase. Some of thischange may reflect the changing populations in the crime-proneage groups (in the 1980s Fresno's juvenile population increased by37 percent while Santa Clara's juvenile population increased byonly 1 percent).
Legislative Analyst's Office

Crime in California 19
Who Are the Victims of Crime?
National victimization surveys provide a good deal of reliabie data
about the victims of crime. These surveys reveal that:
Groups at the highest risk of becoming victims-youngmen-are not the ones who generally express the greatest fearof crime-women and the eiderly. in fact, men are almost twiceas likely as women to be victims of violence, and persons underthe age of 20 are almost ten times more likely to be victims thanpersons over the age of 65.
Teenagers are most often the victims of both vioience andpersonai theft. Teenage black males have the highest victimization rates for violent crime (about 20 percent higher than teenageblack females, the next highest group). Teenage white and blackmaies have the highest victimization rates for personal theft (theirrates are virtually identical).
Blacks are most often the victims of violence-the violentvictimization rate for blacks is about 50 percent higher than forwhites. There is Iittie difference in victimization rates betweenHispanics and non-Hispanics in violent offenses, but Hispanicsare more likeiy to be victims of a property crime.
Victims and offenders are of the same race in 80 percent ofall violent crimes.
Urban dwellers are much more likely to be victims of all typesof crime than are persons who live in suburban and rural areas.
A person is more likely to be the victim ofa violent crime thanto be injured in a motor vehicle accident.
Legislative Analyst's Office

20 Crime in Caiifornia
How Do Crime Rates in the U.S. CompareWith the Rates of Other Life Events?1992
Rate per 1,000Events Adults per year
,,""".'
Accidental injury, all circumstances 220Accidental injury at home 66Personal theft 61Accidental injury at work 47Violent victimization 31
Assault (aggravated and simple) 25Injury in motor vehicle accident 22Death, all causes 11Victimization with injury 11Serious (aggravated) assault 8
Robbery 6Heart disease death 5Cancer death 3
Rape (women only) 1Accidental death, all circumstances 0.4
Pneumoniaiinfluenza death 0.4Motor vehicle accident death 0.2
Suicide 0.2HIV infection death 0.1
Homicide 0.1
Source: U.S. Bureau of Justice Statistics.
! Legislative Analyst's Office

Crime in California
Homicide Most Often CommittedBy Acquaintance1992
Offender
21
Friend,acquaintance
Stranger
Parentlchiid
Spouse
Other reiative
Unknown
400 800 1,200 1,600 2,000
Number of Homicides
• California's 1992 homicide data indicate that the victim and offenderare most likely to know each other.
• Of the 3,920 homicides reported in 1992, 1,677 were committed bya friend or acquaintance, which inciudes an ex-husband or ex-wife,employer, empioyee, gang member, etc. This represents about60 percent of ail known victim-offender relationships.
• Homicides committed by a stranger accounted for about 30 percentof ail known relationships.
Legislative Analyst's Office
22 Crime in California; .. ~, ..
. j Legislative Analyst's Office

Crime in California 23
Who Commits Crime?
Official records of police and correctional officials provide infor
mation about criminal offenders, as do the national victim surveys.
These reports show that:
The vast majority ofoffenders are teenagers andyoung men(in their twenties). Criminal activity declines significantly asindividuals mature into their thirties. A 1987 study in Californiafound that by the time men reached age 29, 35 percent had beenarrested once (66 percent for young black men), aithough thesefigures may actualiy be low because they do not include of ailjuvenile records or driving-under-the-infiuence offenses.
More than half of all violent offenders are under the influence of alcohol or drugs at the time of their crime (most oftenalcohol).
Some studies have shown that some offenders have "lowself-control"-that is, they often commit their crimes as animpulsive response to an immediate stressful situation, ratherthan a rational choice.
• Males are much more likely to be the victims of a strangerin assauit and robbery offenses. Females, however, are equailylikely to be victimized by a husband or boyfriend as they are byan acquaintance or a stranger.
Offenders often commit many more crimes than they arearrested for, and a very smail portion of offenders commit a verylarge portion of totai criminal offenses. A study by the RANDCorporation found, for example, that 50 percent of robberscommitted, on average, iess than five robberies per year, but 10percent of robbers committed more than 85 robberies per year.
Legislative Analyst's Office

24 Crime in California
Juvenile Arrests HigherThan Adult Arrestsa
1972 Through 1992
Rate
5,0001.,-------------------,
4,000
3,000
2,000
1,000
72 74 76 78 80 82 84 86 88 90 92
a Rate per 100,000 population within each group.
• Although the arrest rates for juveniles (ages 10 to 17) haveconsistently been higher than the arrest rates for adults over thepast 20 years, they have become much closer in the past five years.
• There is evidence that a major reason that arrest rates for juvenilesare higher than for adults is that young men tend to be arrested inlarge groups on suspicion of committing a crime or at the scene ofa crime, although charges may not ever be filed.
• Juvenile arrest rates peaked in 1974. This was probabiy due todemographics, that is, the at-risk juvenile population was a largerproportion of the overall state population.
Legislative Analyst's Office

Crime in Caiifornia 25
Felony Arrests Highest Among The Younga
1992
500
1,000
1,500
2,500
2,000
Rate
3,000.,------------1 __-"C.;.;ri",m",es=-_
o Property
- Violent
\~ , ••L \v\' \,:,.\~ ~~.~' ~".~~ ~~.~' ~".~~ ,~." ,,,.,~ ,,~.,,' "".,,~ "'~."'\" , ••7
Age of Arrestee
a Rate per 100,000 age-eligible population.
• Feiony crime arrest rates peak in the 15- to 19-year-old age group.
• About half of all persons arrested in California in 1992 were betweenthe ages of 11 and 24. This group, however, makes up only about20 percent of the state's total population.
Legislative Analyst's Office

26 Crime in California
Firearms Used in Most Homicides1992
Firearm
Knife
Personal Weapon(hands, etc.)
Blunt Object
Oth er/U nknown
1,000 2,000
Number of Homicides
3,000
• Firearms are the weapons used in 73 percent of reported homicidesin 1992, or about five times more often than knives.
• Firearms account for more homicides than all other weaponscombined.
• Teenagers, 18 to 19 years old, are more likely to be killed by firearmsthan other age groups.
Legislative Analyst's Office ,."

Crime in California 27
How Does California'sCriminal Justice System Work?
In general, the criminal justice system does not respond to
most crime because about two-thirds of all crimes are not discov
ered or reported to law enforcement authorities. And of those
crimes reported to law enforcement officials, only about one-quar
ter are solved. In 1992, for example, only about 22 percent of all
reported crimes were solved or "cleared" (that is, a person was
charged with a crime). This figure has remained relatively stable
for a number of years.
Following an arrest, a law enforcement agency may file a com
plaint against the individual and he or she may be prosecuted.
Prosecution may result in the person being convicted. Persons who
are convicted are given a fine or are sentenced to county proba
tion, county jail, county probation with a jail term, state prison, or
Youth Authority. The vast majority of convicted offenders end up on
county probation and/or in jail.
Aithough the Legislature and Governor enact laws that define
crimes and set penalties, criminal justice officials exercise a great
deal of discretion in enforcing these laws. The greatest discretion
is at the iocai level, when police decide whether to arrest someone
for a crime, prosecutors decide whether or how to charge a person
with a crime, and courts adjudicate suspected offenders.
Legislative Analyst's Office

28
Most Criminal Justice PersonnelIn Law Enforcement1992
Corrections
Crime in California
LawEnforcement
Law EnforcementCorrectionsProsecutionPubiic DefenseCourts
87,02046,90810,272
3,2201,763
149,183
• Law enforcement personnel (police, sheriffs, CHP) make up about58 percent of total criminai justice personnel. This proportion hasdeclined from about 66 percent in 1978, although the total numberof law enforcement personnei has increased by 34 percent since1978.
• Corrections personnel (probation, prisons, Youth Authority) makeup about 31 percent of the total.
Legislative Analyst's Office

Crime in California
Corrections Personnel Has Grown Most1978 Through 1992
29
Law Enforcem ent
Courts
Prosecution
Public Defense
Corrections
30 60 90 120%Percent Growth
• The number of corrections personnel (probation, prisons, YouthAuthority) has more than doubled since 1978.
• Law enforcement (police, sheriffs, CHP), which is the largest portionof total criminal justice personnel, grew the least (34 percent).
• The state's total population increased about 37 percent between1978 and 1992.
Legislative Analyst's Office

30 Crime in California
Most Reported Crimes Not Solved1992
Total
Homicide
Rape
Robbery
Assault
Burglary
Vehicle theft
Total
,. ,.. . ......•.'.. 1
.. . '. ',,' . : ,·1. .
...."
. ,.c
, ... .,.' .
I1
. . . . •10 20 30 40 50 60%
Crimes Solved
• Only about 22 percent of all reported crimes were solved in 1992.Violent crimes are solved more often than property crimes. In 1992,59 percent of assaults and 56 percent of homicides were solved; 13percent of burglaries and 11 percent of motor vehicle thefts weresolved.
• Although the rate of crimes solved in recent years has deciinedslightly, the rate has remained relatively stable since 1972.
• Generally, a crime is considered solved or "cleared" when at leastone person is arrested, charged with the crime, and turned over tothe court for prosecution or referred to juvenile authorities. Inaddition, a crime may be considered solved if authorities have ampleevidence for arrest, know the location of the offender, but for somereason cannot take the offender into custody.
"! Legislative Analyst's Office , 'I

Crime in California 31
Who Exercises Discretion in California'sCriminal Justice System?
These CriminalJustice Officials. .. Who Are Subject
to the Control of . . . Must Often Decide Whetheror not or how to ...
Police/Sheriffs CitiesiCounties • Enforce laws
· Investigate crimes
· Search people, premises
· Arrest or detain people
· Supervise offenders in local correctionalfacilities (primarily county sheriffs)
District Attorneys Counties · File charges(prosecutors) · Reduce, modify, or drop charges
Judges State · Set bailor conditions for release
· Accept pleas
· Determine delinquency for juveniles
· Dismiss charges
· Impose sentences
· Revoke probation
Probation Officials Counties or · Recommend sentences to judgesJudges · Supervise offenders released to proba-
tion in the community
· Supervise offenders (especially juve-niles) in probation camps and ranches
· Recommend probation revocation tojudges
Correctional Officials State · Assign offenders to type of correctionalfacility
· Supervise prisoners
· Award privileges, punish for disciplinaryinfractions
Parole Officials State • Determine conditions of parole• Supervise parolees released to the
community
· Revoke parole and return offendersto prison
i' Legislative Analyst's Office

32 Crime in California
What Happened to Adult Felony ArrestsIn 1992?
100% . .
.
ACTIONS TAKENON FELONY ARRESTS
~ ~~ ~
16% 84%
OffendersReleased or
Com plaints FiledComplaintsDenied
~/'.~... 15% 69%
Not Convicted Convictions
~
42% Probation with Jail
15% State Prison
7% Probation
4% Jail1% Fine/Other
Legislative Analyst's Office

Crime in California
Vast Majority of FelonsSupervised by Counties
a
1992
Jail
Probationwith Jail
County
a 1992 felony convictions.
State
State Prison andYouth Authority
Probation
33
• About 78 percent of convicted felons are housed and/or supervisedby counties.
• Only 22 percent of all convicted felons are sentenced to theDepartment of Corrections or the Department of the Youth Authority.
Legislative Analyst's Office

34
More Felons Being Sentenced toState Correctional Institutions
a
1978 Through 1992
Crime in California
500.---------------------,
400
300
200
100
State Prison andYouth Authorily,,--
78 80 82 84 86 88 90 92
a Change in felony sentences, indexed to 1978.
• Although most convicted felons are sentenced to local custody(county probation and/or jail), the proportion being sentenced tostate custody has more than doubled since 1978.
• Reasons for the increase in felons sentenced to state prison (andthe corresponding sharp decline in felons sentenced to county jailand probation) include changes in law requiring state prison(instead of locai punishment) when convicted for certain crimes,court-ordered caps on county jail populations, and a generallytougher approach to punishment by local prosecution officials.
Legislative Analyst's Office

Crime in California 35
Prison Population Exceeds Design Capacity1982-83 Through 1998-99
Inmates(In Thousands)
200-
160
120
80-
40-r- ..., -
I I
D Overcrowding
• Design Capacity'
,-r-- I,
-
-
82-83 84-85 86-87 88-89 90-91 92-93 94-95 96-97 98-99
a Includes funded prison, camp, and community-based beds.
• Despite the state's massive prison construction program, prisonovercrowding will be worse at the end of the decade than it is now_
• The prison population has more than doubled over the past tenyears and is expected to reach 171,000 inmates by 1999. At thattime, prison overcrowding will reach about 202 percent.
• A small change in the sentence length of inmates can result in asignificant need for additional prison beds. For example, the average sentence for male felons recently increased by about nine days,which resulted in the need for about 500 additional prison beds andincreased overcrowding by about 1 percent.
Legislative Analyst's Office

36
A Profile of Criminal OffendersSupervised by Counties
Crime in California
Type of Offender
County JuvenileProbationer
County AdultProbationer
County Jail Inmate
General Characteristics
Male, about 16 years old, equally likely to be white(non-Hispanic), black, or Hispanic
From urban area
At least one year behind in schooling
Committed for property or drug-related offense
Likely to have had two or three other contacts (questioning or arrest) with law enforcement prior to mostrecent arrest
Likely supelVised at home on probation, after shortstay in juvenile hall
After completing probation, stands agood chance ofnot committing anew offense as ajuvenile or an adult
Male, about 26 years old, more likely to be black orHispanic
Committed nonviolent offense, usually property ordrug-related offense
SelVed afew months in jail before beginning probation,although many are placed in drug or DUI diversionprograms (instead of jail) and then are placed onprobation
Generally not supelVised during probation period, except to inform probation officer of whereabouts
Male, 18 to 55 years old (usually 25 to 30), more likelyto be black or Hispanic
About half awaiting triai on misdemeanor charge, suchas DUI, average stay 19 days
Other half sentenced to jailor jail and probation for lessthan one year for a misdemeanor or low-level felony
Source: Federal and state reports and interviews with selected counties.
Legislative Analyst's Office

Crime in California
A Profile of Criminal OffendersSupervised by the State
37
Type of Offender
State YouthAuthority Ward
State Prison Inmate
General Characteristics
Male, 19 years old, from Los Angeles or Bay Area,more likely to be Hispanic or black
64 percent were committed for violent crime
Has abused alcohol and/or drugs, but not incarceratedfor drug-related crime
Sixth-grade education level
Likely to be committed only once to the Youth Authority, but has been arrested between 8 and 33 timesalthough not charged with a crime in many cases
Has been previously incarcerated in county juvenilehall and/or probation camp
Average stay will be 21 months, followed by parole incommunity
45 percent chance of completing parole without committing a new offense as a juvenile or adult
Male, between ages of 25 and 29 years old, from southernCalifornia, more likely to be black or Hispanic
Two-thirds were committed for a nonviolent offense,usually a property crime
Has a history of drug abuse, most likely cocaine
Eighth-grade education level
In prison for 18 months for nonviolent offense; 34 monthsfor violent offense
Will be supervised in community on parole for one yearafter discharge from prison
About 38 percent will return to prison for less than oneyear for atechnical violation of parole (a violation that didnot result in criminal prosecution)
About 20 percent will return to prison for committing anewfelony offense, most likely a property offense
Legislative Analyst's Office

38
Who Is in State Prison?
Prison PopulationJune 30, 1993
Crime in California
1992 Admissionsto Prison
Offenses InmatesPercentofTotal
AverageTerm
Inmates (Years)
Violent Offenses
Murder, First Degree' 5,362 4.6% 452
Murder, Second Degree' 5,790 5.0 657
Manslaughter 2,969 2.6 743
Vehicle Manslaughter 179 0.2 95
Robbery 15,593 13.5 4,226
Assault with Deadly Weapon 6,035 5.2 2,080
Other AssaulUBattery 2,946 2.5 1,038
Rape 2,231 1.9 429
Lewd Act with Child 4,563 3.9 1,305
Oral Copulation 700 0.6 112
Sodomy 195 0.2 15
Penetration with Object 251 0.2 59
Other Sex Offenses 232 0.2 96
Kidnap' 1,733 1.5 266: ..".. ,,-.,-., ... ',.•...::" ....... -.,
···~(42:2;/OlSUbtotals (48,779) . (11,57~)
Property Offenses
Burglary, First Degree 9,723 8.4% 2,527
Burglary, Second Degree 5,600 4.8 2,443
Grand Theft 2,066 1.8 1,045
Petty Theft with Prior 4,516 3.9 1,667
Receiving Stolen Property 2,211 1.9 1,085
Vehicle Theft 4,655 4.0 1,685
Forgery/Fraud 1,096 0.9 604
Other Property 324 0.3 170
Subtotals (30,191) .(26.1%) (11,226). ~'o~
Legislative Analyst's Office
8.6
2.8
4.9
4.2
3.2
9.0
8.5
10.6
12.2
13.8
4.0
9.3
4.0
1.9
2.1
1.9
1.9
2.6
2.1
2.4
Crime in California 39
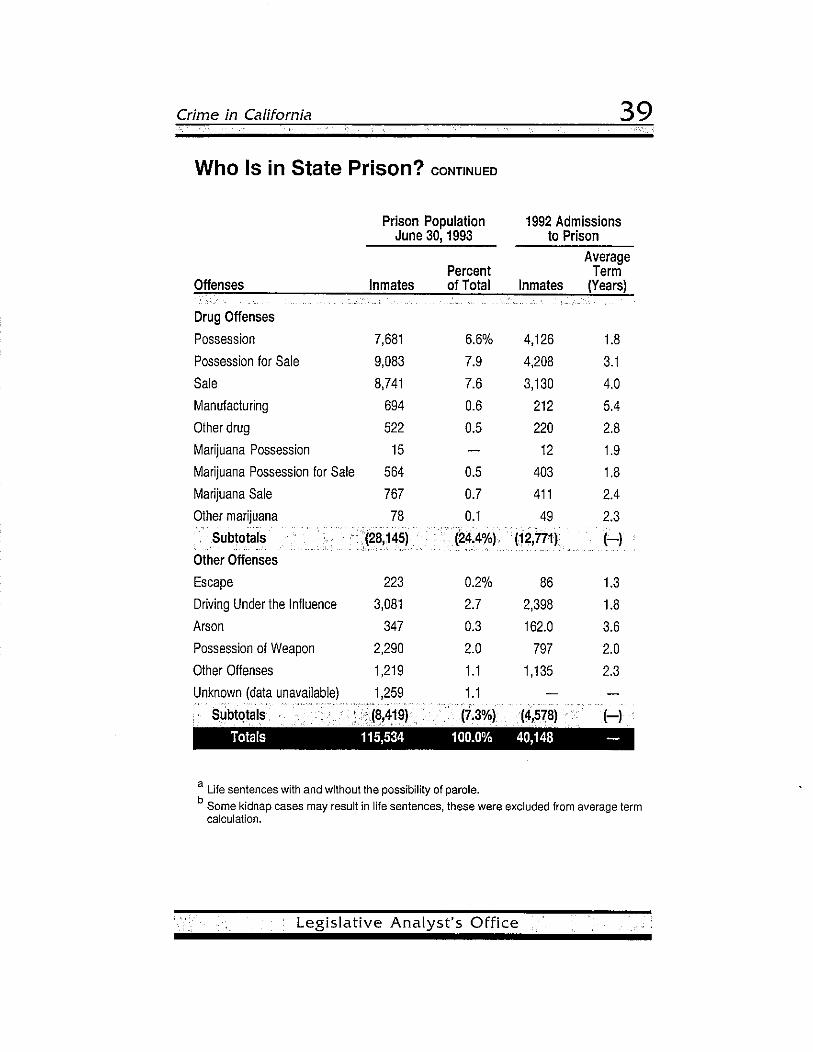
Who Is in State Prison? CONTINUED
Prison Population 1992 AdmissionsJune 30, 1993 to Prison
AveragePercent Term
Offenses Inmates ofTotal Inmates (Years)
Drug Offenses
Possession 7,681 6.6% 4,126 1.8
Possession for Sale 9,083 7.9 4,208 3.1
Sale 8,741 7.6 3,130 4.0
Manufacturing 694 0.6 212 5.4
Other drug 522 0.5 220 2.8
Marijuana Possession 15 12 1.9
Marijuana Possession for Sale 564 0.5 403 1.8
Marijuana Sale 767 0.7 411 2.4
Other marijuana 78 0.1 49 2.3
Subtotals .(28,145) (24.4%) . (12,771) HOther Offenses
Escape 223 0.2% 86 1.3
Driving Under the Influence 3,081 2.7 2,398 1.8
Arson 347 0.3 162.0 3.6
Possession of Weapon 2,290 2.0 797 2.0
Other Offenses 1,219 1.1 1,135 2.3
Unknown (data unavaiiable) 1,259 1.1
Subtotals «~,419). (7,3%) (4,578) (-)
Totals 115,534 100.0% 40,148 -
a Life sentences with and without the possibility of parole.b Some kidnap cases may result in life sentences, these were excluded from average term
calculation.
Legislative Analyst's Office

40 Crime in California
Crime Rate Remains Stable DespiteSharp Increase in Imprisonmenta
1971 Through 1992
500 -,------1
400
300
D Incarceration Rate
- Crime Rate
72 74 76 78 80 82 84 86 88 90 92
a Change in rates per 100,000 population, Indexed to 1972.
• California's incarceration rate has increased almost 300 percentsince 1971 while the crime rate remained relatively flat (it increasedabout 11 percent).
• Some researchers argue that this situation should be expectedbecause they believe that incarcerating more people for a longerperiod of time has no impact on the crime rate. Others disagree andargue that the crime rate would have increased significantly if therate of imprisonment had not increased so significantly.
•. Legislative Analyst's Office

Crime in California 41
How Much Does Crime Cost?
There is no simple answer to this difficult question. Although
many studies over the years have attempted to quantify the total
direct and indirect costs of crime to government and society, the
results have varied widely, but all conciude that the nationwide costs
are in the tens to hundreds of billions annually.
Some components of the cost of crime (such as the
government's cost of fighting crime) can be readily estimated. For
example, in 1991-92, Caiifornia spent about $13.7 billion to fight
crime, which inciuded costs for poiice, prosecution, courts, proba
tion, and incarceration.
Other costs cannot be easily measured. For example, many
crimes go undetected or unreported-such as fraud, embezzle
ment, or arson-and thus their costs to society are not captured.
Also, some costs are difficult to estimate because the costs are
"transferred," such as the costs for goods and services that are
transferred to consumers by manufacturers and retailers to cover
their costs for crime prevention activities or losses from crime.
Legislative Analyst's Office

42 Crime in California
What Is Considered a "Cost" of Crime?
~ Costs to government to operate the criminaljustice system (poiice, prosecution, courts, probation, incarceration, parole).
~ Medical costs to individuals and government because of injuries suffered due to crime.
~ Property stolen or damaged resuiting fromcrime.
~ Loss of productivity to society because ofdeath, medical and mental disabiiities resultingfrom crime.
~, Loss of work time by victims of crime and theirfamiiies.
~, Loss of property values in neighborhoodswith high rates of crime.
• Pain and suffering of crime victims, theirfamiiies, and friends, as wei! as communitiesplagued by crime.
Legislative Analyst's Office
Crime in California
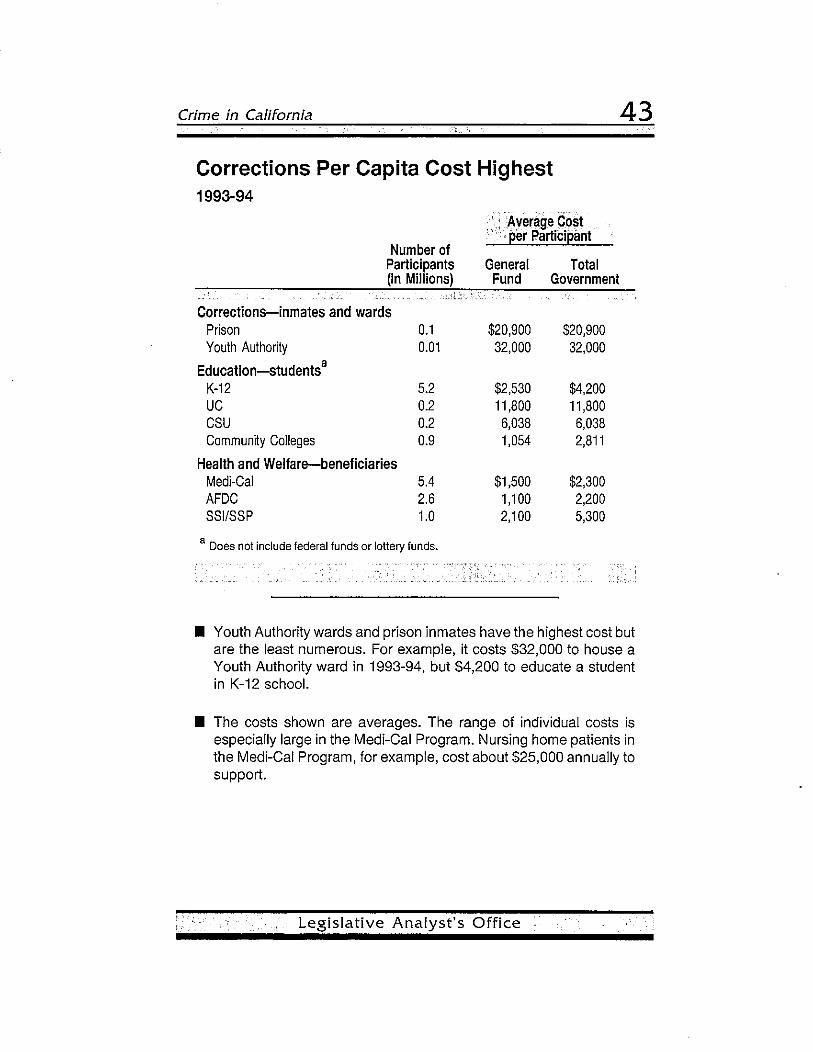
Corrections Per Capita Cost Highest1993-94
43
Number ofParticipants(In Millions)
.•••• ..Average c()S~. . per Participant
General TotalFund Government
Corrections-inmates and wardsPrison 0.1 $20,900 $20,900Youth Authority 0.01 32,000 32,000
Education-studentsa
K-12 5.2 $2,530 $4,200UC 0.2 11,800 11,800CSU 0.2 6,038 6,038Community Colleges 0.9 1,054 2,811
Health and Welfare-beneficiariesMedi-Cal 5.4 $1,500 $2,300AFDC 2.6 1,100 2,200SSIISSP 1.0 2,100 5,300
a Does not include federal funds or lottery funds.
• Youth Authority wards and prison inmates have the highest cost butare the least numerous. For example, it costs $32,000 to house aYouth Authority ward in 1993-94, but $4,200 to educate a studentin K-12 school.
• The costs shown are averages. The range of individual costs isespecially large in the Medi-Cal Program. Nursing home patients inthe Medi-Cal Program, for example, cost about $25,000 annually tosupport.
Legislative Analyst's Office

44
Corrections Is Small Portion ofTotal 1993-94 State Spending
All Other
Transportation
Corrections
Welfare
Health
Crime in California
K-12Education
HigherEducation
• Spending for corrections is about 7 percent of total state spendingin 1993-94.
• Ten years ago in 1983-84, spending for corrections was about 3percent of total state spending.
1 Legislative Analyst's Office , 'I

Crime in California
Corrections Spending Has GrownMuch Faster Than Other State Spending1983-84 Through 1993-94
Total
K-12 Education
Higher Education
Health
Welfare
Corrections
Transportation
All Other
Total
3 6 9 12 15%
Annual Growth Rate
45
• Spending for corrections increased, on average, about 14 percentannually since 1983-84 while total state spending increased about7 percent per year.
• The principal reason that corrections expenditures have grown themost is that the prison inmate population has increased much fasterthan the caseloads of most other programs, such as K-12 and highereducation and welfare.
'! Legislative Analyst's Office

46 Crime in California
Legislative Analyst's Office
Crime in California 47
What Are the Policy Implications?
The major policy implications of the data presented in this report
are summarized briefly below.
Recognize Divergence ofCrime Data and Public Perceptions
of Crime. Contrary to public perception, total crime is down rather
than up in California. Californians are more likely to be victimized by
an accident in their own homes than they are by crime. Nonetheless,
certain types of crime-such as violent crimes and vehicle thefts
are on the rise. Both public perceptions and crime data should be
taken into account by decision-makers when shaping public policy
affecting the state's criminal justice system.
Recognize That Criminal Justice System Deals With Small
Portion of Total Crime. As we indicated earlier, the criminal justice
system deals with only a small portion of all criminal activity in society,
principally because about two-thirds of all crimes go unreported to or
undiscovered by police. If policy-makers wish to affect a larger share
of crime, it will require a significantly larger investment of funds than is
currently being spent by government. Given scarce government re
sources, such an increased investment will require that policy-makers
select new, cost-effective approaches (and new strategies) to crime
fighting, not using scarce resources for activities that may result in
only marginal changes in the crime rate.
Recognize Importance of Demographics in Crime. As we in
dicated, a large amount of crime is committed by young people, and
the decline in crime rates in California in the 1980s was due, at least
in part, to the aging of the population. For these reasons, it is impor
tant for policy-makers to recognize that the changing demographics
: Legislative Analyst's Office
48 Crime in California
of California-particularly the boom in juvenile population that is pro
jected to occur in the early part of the next century-eould result in a
return to the high crime rates of the late 1970s and early 1980s. In our
view, the Legislature should keep this potential increase in mind as it
develops programs to prevent and respond to crime.
Recognize the Interrelationships Among the Parts of the
Criminal Justice System and the Need for Flexibility. The compo
nent parts of the state's criminal justice system are, by necessity, closely
interrelated (persons arrested by police are prosecuted by district at
torneys, decisions as to their fate are made by courts, and punish
ment/treatment is applied by probation and corrections officials). It is
important for policy-makers to understand and appreciate these inter
relationships. For example, federal legislation proposed by the Presi
dent could result in California receiving substantial funds for local ju
risdictions to put more police officers on the streets. Such a move
could have positive crime deterrence effects in communities and re
sult in additional arrests. It would, however, not only increase the re
sponsibilities of police agencies, but also increase the workload of
prosecutors, public defenders, courts, and correctional officials.
As we showed in the chart "Who Exercises Discretion in
California's Criminal Justice System" (see page 31), the system in
cludes significant flexibility at various levels. The greatest flexibility is
generally at the "front-end" of the process-police and prosecutors.
The system functions as a result of this flexibility and efforts to reduce
flexibility could significantly affect the system as a whole. For example,
eliminating the ability of prosecutors to reduce the charges against a
nonviolent offender could result in greater costs for prosecution, courts,
and corrections, thereby limiting resources available to deal with vio
lent offenders or other high-priority matters.
Recognize That the Greater Use of Imprisonment May Have
Limited Affect on Crime. There is no question that incarceration has
Legislative Analyst's Office

Crime in California 49
an important role to play in the criminal justice system. Offenders who
are "career criminals" and persons who commit particularly violent
acts should be Incarcerated for long periods. However, the ability of
increased Imprisonment to significantly reduce crime is unclear.
California's imprisonment rate has increased three-fold since 1972
but the crime rate has remained relatively stable (see page 40). Some
experts argue that this indicates that greater use of imprisonment has
little affect on crime. Others argue that the crime problem would have
gotten worse had imprisonment not been increased. Although there is
little argument that taking offenders off the street will mean that they
will not be able to commit crimes while incarcerated, it does not nec
essarily follow that incarcerating significantly more offenders or incar
cerating them for much longer periods will necessarily result in a com
mensurate reduction in crime in California.
Several studies have concluded that prison-and criminal jus
tice agencies more generally-have a limited impact on the overall
amount of crime experienced by society. This is true for a number of
reasons mentioned earlier, including (1) the fact that the criminai jus
tice system deals with only a relatively small amount of totai crime
and, therefore, the certainty of punishment is diminished, (2) research
shows that some crime is frequently an impulsive response to stress
ful situations (prison is unlikely to deter such behavior). and (3) much
violent crime is perpetrated by young offenders who are unlikely to be
incarcerated in prison early in their lives.
In addition, several studies have pointed out other reasons that
prison has little impact on the overall amount of crime experienced by
society. For example, some research indicates that prison does not
reduce crime because a criminal "labor market" exists in some com
munities where new recruits replace offenders who are incarcerated
(this is particularly true for drug-related crime). Also, some studies
found that different levels of violence and crime result from "social
Legislative Analyst's Office"

50 Crime in Caiifornia
stress" factors in communities, which include such factors as busi
ness failures, bankruptcies, foreclosures, unemployment, divorces,
illegitimate births, and high school dropouts.
Target Violent Crime. Violent crime has risen in California in
recent years as property crime has declined. Given this trend, and the
significantly greater negative consequences of violence, crime reduc
tion efforts should be targeted at reducing violent crime.
Target Offenders Who Are Most At-Risk ofCommitting Crime.
There is substantial evidence that a small number of offenders com
mit a large number of total offenses. Thus, in order to have the great
est impact on crime, efforts should be targeted at imprisoning (some
times referred to as "selective incapacitation") or treating those of
fenders. However, proactively identifying individuais who are most at
risk is difficult and raises ethical and legal questions as well.
Target Rehabilitation Programs. Avaiiable studies conclude that
some rehabilitation programs have been shown to work with certain
offender populations and to have little or no impact on other popula
tions. For this reason, it is important to target rehabiiitation programs
to offenders most likely to benefit, which usually means first-time of
fenders. Substance abuse programs are probably the most impor
tant, given that so many offenders commit violent offenses whiie un
der the influence. In addition, because of the limited information avail
able, policy-makers should require that rigorous evaluations be com
pleted on rehabilitation programs to identify "what works and what
doesn't."
Place Priority on Prevention and Early Intervention. Given
the high costs of crime to society and research that indicates that
efforts to rehabilitate chronic offenders have limited success, the best
course of action may be to place emphasis on intervening with poten
tial offenders early in order to prevent future criminal activity. Given
the large numbers of juveniies who commit crimes, prevention and
Legislative Analyst's Office

Crime in California 51
early intervention efforts (including mental health and drug treatment,
family services, and education) need to start at a young age and be
closely linked.
Research in Orange County has found that a relatively small
number of juvenile offenders commit the bulk of offenses and that
these offenders generally have multiple problems. These include school
behavior and performance problems, significant family problems (al
coholism, abuse or neglect, or criminal family members), and sub
stance abuse problems. In response to these findings, the county is
developing a project to provide integrated services to young offenders
using criminal justice, education, social services, and mental health
resources.
We believe that providing integrated services has the potential
to reduce criminal behavior. Thus, we conclude that incentives need
to be designed to encourage state and local communities to develop
closely linked prevention and intervention programs in order to re
duce the costs and effects of crime in the future.
This Report was prepared by Craig Cornett. For information about this report callMr. Cornett at 445-4660. For additional copies contact the Legislative Analyst's
Office, State of California, 925 LStreet, Suite 1000, Sacramento, CA 95814,(916) 445-2375.
Legislative Analyst's Office"

Notes Crime in California
Legislative Analyst's Office