CRFPO Carbon Footprint · Establish CRFPO carbon footprint reduction goal. This report captures the...
21
U.S. Fish and Wildlife Service CRFPO Carbon Footprint FY 2013 Report CRFPO Carbon Footprint Team J. Michael Hudson, Brook Silver, Maureen Kavanagh, Larry Fishler, Doug Olson U.S. Fish and Wildlife Service Columbia River Fisheries Program Office Vancouver, WA 98683
-
Upload
dinhkhuong -
Category
Documents
-
view
214 -
download
0
Transcript of CRFPO Carbon Footprint · Establish CRFPO carbon footprint reduction goal. This report captures the...

U.S. Fish and Wildlife Service
CRFPOCarbonFootprint
FY 2013 Report
CRFPO Carbon Footprint Team
J. Michael Hudson, Brook Silver, Maureen Kavanagh, Larry Fishler, Doug Olson
U.S. Fish and Wildlife Service
Columbia River Fisheries Program Office Vancouver, WA 98683

On the cover: Columbia River Fisheries Program Office Staff The correct citation for this report is: Hudson, J.M., B. Silver, M. Kavanagh, L. Fishler, D. Olson. 2014. CRFPO Carbon Footprint, FY 2013 Report. U.S. Fish and Wildlife Service, Columbia River Fisheries Program Office, Vancouver, WA. 17 pp.

CRFPO Carbon Footprint 2013 REPORT
Study funded by
U.S. Fish and Wildlife Service Columbia River Fisheries Program Office
and authored by
J. Michael Hudson Brook Silver
Maureen Kavanagh Larry Fishler Doug Olson
U.S. Fish and Wildlife Service Columbia River Fisheries Program Office
1211 SE Cardinal Court, Suite 100 Vancouver, WA 98683
Final June 12, 2014

Disclaimers
The findings and conclusions in this report are those of the authors and do not necessarily represent the views of the U.S. Fish and Wildlife Service. The mention of trade names or commercial products in this report does not constitute endorsement or recommendation for use by the federal government.

i
CRFPO Carbon Footprint 2013 ANNUAL REPORT
J. Michael Hudson, Brook Silver, Maureen Kavanagh, Larry Fishler, Doug Olson
U.S. Fish and Wildlife Service
Columbia River Fishery Program Office 1211 SE Cardinal Court, Suite 100
Vancouver, WA 98683
Abstract –
The U.S. Fish and Wildlife Service – Columbia River Fisheries Program Office (CRFPO) convened a Carbon Footprint Team in 2013. The goal of this team is to quantify, track, and make recommendations toward reducing the office carbon footprint. To this end, we established a process that involved establishing objectives, meeting regularly, establishing contacts outside of CRFPO to collect information, conducting an energy audit, adopting a carbon footprint calculator, quantifying the office carbon footprint, and developing recommendations to reduce that carbon footprint. The energy audit was conducted by Clark Public Utilities and provided some insight to ways we could easily reduce our carbon footprint. The carbon footprint calculator was adopted from Seattle Climate Partnership, and provided a platform to easily input data so that the office carbon footprint could be quantified. The CRFPO carbon footprint for FY 2013 was approximately 350 metric tons of CO2. Recommendations developed included ways of reducing the person commute between home and office, changes to the office vehicle fleet, and reducing electricity usage, all of which represented the biggest sinks to the CRFPO carbon footprint. This approach developed and implemented by the CRFPO Carbon Footprint Team identifies a way that U.S. Fish and Wildlife Service field offices can easily quantify and track their carbon footprint, and can be a meaningful step toward making changes that decrease the carbon footprint for the agency.

ii
Page intentionally left blank

iii
Table of Contents
List of Tables ................................................................................................................................. iv
List of Figures ................................................................................................................................ iv
Introduction ..................................................................................................................................... 5
Relationship to the Service Strategic Plan for Responding to Accelerating Climate Change .... 6
Process ............................................................................................................................................ 7
Energy Audit ................................................................................................................................... 7
Carbon Footprint Calculator Results .............................................................................................. 8
Recommendations ......................................................................................................................... 11
Next Steps ..................................................................................................................................... 12
Acknowledgements ....................................................................................................................... 12
Literature Cited ............................................................................................................................. 13
Appendix A: “How to” Guide...................................................................................................... 14
Appendix B: Contacts and References ......................................................................................... 15
Appendix C: CRFPO Carbon Footprint Goals and Actions ......................................................... 16

iv
ListofTables
Table 1. Metric tons of greenhouse gas emissions generated by the CRFPO (50 average full time employees) in FY 2013 ............................................................................................................9
ListofFigures
Figure 1. Results of the Carbon Footprint Calculator for FY 2013 .............................................. 10 Figure 2. Percentage of greenhouse gas emissions generated by the CRFPO in FY 2013 ........... 10

5
Introduction In February 2013, the U.S. Fish and Wildlife Service – Columbia River Fisheries Program Office (CRFPO) convened a Carbon Footprint Team (CFT) with a goal to quantify, track, and make recommendations toward reducing the office carbon footprint. The need for this arose from the 2010 U.S. Fish and Wildlife Service (Service) Strategic Plan for Responding to Accelerating Climate Change (Strategic Plan). The need was further emphasized by a November 1, 2013, Executive Order 13653, Preparing the United States for the Impacts of Climate Change, signed by President Barack Obama. To meet these directives, Service field offices need the ability to understand what their current carbon footprint is, and what actions can be taken to reduce that footprint.
Carbon tracking efforts currently being used by the Service are more specific to Service owned lands, facilities and equipment (e.g., National Wildlife Refuges, National Fish Hatcheries). A large number of field offices are housed in leased space and use leased vehicles for field activities. The carbon footprint from these facilities and vehicles are typically captured at the national level through General Services Administration (GSA) reporting. However, this information is often too broad scale to be useful at the individual field office level.
The objectives identified by the CRFPO CFT are:
Identify existing models from ongoing/past activities other offices/agencies have used to track/reduce their carbon footprint;
Determine a method to quantify the office carbon footprint;
Conduct quantitative analyses of CRFPO carbon sources and offsets (i.e., what is the value of specific actions?);
Identify platform to track CRFPO carbon footprint and measure progress toward reduction goal;
Make recommendations for reducing CRFPO carbon footprint to achieve reduction goal;
Establish CRFPO carbon footprint reduction goal.
This report captures the process followed, tools used, and outcomes associated with all but the last objective. This effort is consistent with goals and objectives identified in the Service’s Strategic Plan (USFWS 2010) with respect to mitigation and engagement.
6
Relationship to the Service Strategic Plan for Responding to Accelerating Climate Change
Implementation of this project demonstrates application of the Service’s 2010 Strategic Plan for Responding to Accelerating Climate Change. The following goals and objectives have been addressed by this project: Goal 5: We will change our business practices to achieve carbon neutrality by the Year 2020.
Objective 5.1: Assess and reduce the carbon footprint of the Service’s facilities, vehicles, workforce and operations.
Objective 5.3: Offset the remaining carbon balance
Goal 7: We will engage Service employees; our local, State, Tribal, national and international partners in the public and private sectors; our key constituencies and stakeholders; and everyday citizens in a new era of collaborative conservation in which, together, we seek solutions to the impacts of climate change and other 21st century stressors of fish and wildlife.
Objective 7.1: Provide Service employees with climate change information, education and training.

7
Process The CFT met approximately once a month for an hour beginning in February 2013. The first
step taken by the CFT was establishing the goals and objectives of the effort. Once these were
established, our meetings involved discussing information collected since the previous meeting,
integrating that information into our effort, discussing next steps and delegating responsibilities
for the next meeting. All meetings were documented and all information collected and generated
was made available to the office through the process.
We recognized early in the process that carbon footprint tracking was not a novel idea, and it was
not our intent to “re-invent the wheel”. Therefore, we contacted other Service offices and
programs, other agencies and NGOs to identify existing carbon tracking efforts and/or tools that
might be valuable to our effort. These included the Service’s Oregon Fish and Wildlife Office,
Washington Fish and Wildlife Office, and the Region 1 Refuge Program; the Bureau of Land
Management-Medford; the U.S. Geological Survey (USGS)-Cascades Volcano Observatory and
USGS-Sacramento; and, Energy Trust of Oregon, Northwest Sustainable Energy Economic
Development (SEED), and Seattle Climate Partnership (Appendix B). These contacts proved
valuable toward our next steps of conducting an audit and adopting a calculator.
The final component of this process was to develop some recommendations and identify next
steps. The recommendations involved some quantitative analysis to understand how taking
certain actions might affect the CRFPO carbon footprint. Next steps include setting CRFPO
carbon footprint reduction goals and identifying actions to meet those goals.
EnergyAudit
On September 12, 2013 representatives from Clark County Public Utilities’ Green Initiative
Program conducted an on-site energy assessment of the CRFPO office, warehouse, and ware-
yard to identify cost efficient opportunities to improve energy efficiency and reduce energy
operating costs of the office. The areas identified as having the highest impacts on our energy
expenditure are the thermostat units (HVAC) and lighting system. To improve efficiency in both
these areas, they recommended the following: establish a temperature that meets the comfort

8
level of most employees in the office, program the Honeywell thermostat units to the desired
temperature, and cover and lock the units to prevent tampering with the system.
With regards to our lighting system, it was suggested that we upgrade the timer for indoor lights
(software or standalone controls are available to achieve this task), add lighting in the warehouse
(safety), ensure external lighting monitors are functioning properly (daylight harvest when and
where possible), and de-lamp hallways and other over-lit areas/ offices. Other suggestions
include having Bonneville Power Association (BPA) hire a third party to complete a more formal
technical energy study of the building. This study would be at no charge to the office and it
would provide more detail on any potential energy efficiency measures with associated costs,
savings and incentives available.
CarbonFootprintCalculatorResults
The Carbon Footprint Calculator developed by the Seattle Climate Partnership was adopted to
estimate the CRFPO Carbon Footprint for FY 2013. The calculator is intended to provide users
with a platform to inventory their greenhouse gas emissions. Activities that tend to have
significant emissions such as energy use, transportation, purchasing, and waste generation were
evaluated. This inventory created a benchmark to assist in prioritizing our greenhouse gas
reduction strategies.
Building energy use was determined by energy purchased directly from the providers. Building
management (PacTrust) provided utility invoices for our 19,008 square foot office area. In FY
2013, the CRFPO used 5,082 therms of natural gas and 236,770 kWh of electricity. Energy use
was converted to a total of 123.4 metric tons of CO2.
Transportation data was collected from business travel and employee commuting. Annual fleet
fuel use in gallons was determined by fuel credit card invoices. 10,144 gallons of gasoline and
691 gallons of diesel were used. Miles of business travel by airline totaled 2,064 miles of short
trips (<300 miles), 7,478 miles of medium trips (300-700 miles) and 27,144 miles of long trips
(> 700 miles). A survey of 54 employees determined 11,579 gallons of gasoline and 653 gallons

9
of diesel were used during the annual commute. Commute by bus equaled 8,181 total miles.
Transportation data was converted to a total of 214.9 metric tons of CO2.
Accounting provided purchase records of key materials, goods, and services. Recycled paper
(30% recycled content) was purchased for $1,400 and virgin paper was $25. Other items
purchased in FY 2013 were $9,823 of computers, $600 of furniture, and $5,474 of office
supplies. Purchasing data was converted to a total of 5.5 metric tons of CO2.
Waste disposal and recycling data was collected from utility invoices provided by PacTrust.
Twenty tons of waste was disposed of and 1.3 tons of waste was recycled. Waste generation
data was converted to 8.4 metric tons of CO2.
The Carbon Footprint Calculator summarized the results of the carbon footprint inventory. The
carbon footprint for the CRFPO in FY 2013 was an estimated 352 metric tons of CO2, or 7
metric tons of CO2 per employee (Table 1). Business travel, employee commuting, and
electricity use were the top three sources of greenhouse gas emissions (Figure 1). Transportation
(business and commuting) generated 61% of the greenhouse gas emissions and energy use
(electricity and natural gas) generated 35% of the greenhouse gas emissions (Figure 2).
Table 1. Metric tons of greenhouse gas emissions generated by the CRFPO (50 average full
time employees) in FY 2013
Metric tons of CO2
Business Travel 103.8
Employee Commuting 111.1
Energy - Electricity 96.4
Energy - Other 27.0
Materials & Services 5.5
Waste Generation 8.4
Total 352.2

10
Figure 1. Results of the Carbon Footprint Calculator for FY 2013
Figure 2. Percentage of greenhouse gas emissions generated by the CRFPO in FY 2013
Business Travel29%
Employee Commuting
32%
Energy ‐Electricity
27%
Energy ‐Other8%
Materials & Services
2%
Waste Generation
2%

11
Recommendations
The CRFPO carbon footprint calculator produced a quantitative analysis of our greenhouse gas
emissions. Significant sources of greenhouse gas emissions were generated from transportation,
energy use, materials consumption, and waste disposal. This benchmark inventory will serve to
establish trends in future years and improve our ability to make recommendations to achieve
reduction goals. To move forward, our office needs to identify reduction goals and specific
actions. Continued tracking of the CRFPO carbon footprint will document trends and progress
towards these goals.
To reduce transportation emissions, changes to fleet management and work schedules should be
considered. Increasing fleet vehicles that use diesel fuel instead of gasoline would reduce the
FY2013 footprint by 8.3 metric tons of CO2 (7.9%). Regular fleet maintenance such as tire
pressure checks and adjustments increase gas mileage and lower fuel consumption. Walking,
biking, carpooling, and alternative work schedules would all reduce greenhouse gas emissions
from automobiles. Increasing the use of flex schedule and telecommuting would reduce the
FY2013 footprint by 8.2 metric tons CO2 (7.5%).
Reduction of energy use begins with conserving electricity. Electricity use for office lighting
can be reduced by reprograming light timers, adjusting office lights, opening curtains and
manually switching off lights. Additionally, turning off computers and equipment when not in
use (except for patch Wednesdays) will prevent unnecessary energy consumption. Thermostat
regulation (warmer in the summer, cooler in the winter) will lessen the use of air conditioning
units and heaters.
A thoughtful purchasing policy should avoid carbon intensive items and limit the need for new
items by reusing materials. Ordering new supplies from local sources will reduce transportation
energy needed for delivery. To reduce the need for new items, an exchange area for office
supplies, furniture, and equipment can be set up. A substantial amount of purchasing goes
toward paper, which has a large carbon footprint. Purchase of unbleached paper made with
100% recycled content will help save trees, water, energy, landfill space, and prevent air

12
pollution (US EPA 2014). Paper can be conserved by setting all office computer defaults to print
double-sided and careful editing before printing.
Waste disposal can be reduced by increasing recycling and reducing consumption of disposable
products. Paper towels can be recycled or composted with food scraps. Use of reusable dishes
and utensils is encouraged (can be purchased from the second hand store or donated by office
employees
NextSteps
Establish office carbon footprint reduction goals.
Identify actions to meet CRFPO carbon footprint reduction goals.
Continue annual tracking and reporting of CRFPO carbon footprint.
Acknowledgements We acknowledge the CRFPO executive team for providing the CFT the time and resources to
implement this effort. We acknowledge the staff of CRFPO, particularly Mary McGrew, for the
information that was provided critical to accurately assessing the office carbon footprint. We
thank the Region 1 Climate Change Board for its receptiveness of this information and the
feedback provided. We thank a number of individuals that were responsive to our information
needs and provided feedback, including: David Patte, Shauna Ginger, Jeff Stephens, Ed Brown,
Ben Harrison, Jessica Zahn, and Donna Seaman, Kirk Slack with Oregon Community Wind, and
Debbie DePetris with Clark County Public Utilities.

13
LiteratureCited U.S. Environmental Protection Agency (US EPA). Municipal Solid Waste Generation, Recycling, and Disposal in the United States:Facts and Figures for 2012. EPA530-F-14-001. February 2014. http://www.epa.gov/wastes/nonhaz/municipal/pubs/2012_msw_fs.pdf U.S. Fish and Wildlife Service (USFWS). 2010. Rising to the Urgent Challenge: Strategic Plan for Responding to Accelerating Climate Change. U.S. Fish and Wildlife Service, Washington, DC.

14
AppendixA:“Howto”Guide
Identify a group of people in your office willing to compile the information for the calculator – someone with access to the waste and electric bills, and fleet information is useful.
Download the Seattle Climate Partnership calculator from scp.co2challenge.com, or contact Mike Hudson, Fish Biologist, USFWS-Columbia River Fisheries Program Office, for a copy of the Excel based calculator ([email protected]).
Companyinfotab–enteraveragenumberofemployees,facilitytypeandfacility
location(thisshouldbeNWPPforallmainlandRegion1facilities).
Collectyourenergyusefrombillsforthetrackingperiod(e.g.,fiscalyear,calendaryear)–naturalgas(therms),electricity(kWh)–andenterintospreadsheetontheEnergytab.
Collectmileage,fueleconomy,andfueltypefromfleetvehiclesandstaffcommuting.
WehaveaspreadsheetwecanprovidetoconvertthisinformationtogallonsoffuelthatcanthenbeenteredintospreadsheetontheTransporttab.Mileageforanypublictransportationisenteredonthistab.
Collectinformationfromstaffonbusinessairtravel(towhere,howoften).Roundtrip
mileagewillhavetobecalculatedandenteredonappropriateline(shortv.mediumv.longtrips)ontheTransporttab.
Collectinformationonreamsofpaperandcostofofficesupplies(computers,furniture,
otherofficesupplies)andenterintospreadsheetontheMaterialstab.Ifyouhaveinformationonwaterusage(inputandoutput),thatcanbeenteredonthistabtoo.
Collectinformationonwastedisposed,recycling,andanycompostingyourfacility
conductsandenterontheWastetab.
AllofthisinformationisprocessedandpresentedontheResultstab,whichissimilartowhatispresentedunderCalculatorResultsinthisdocument.
15
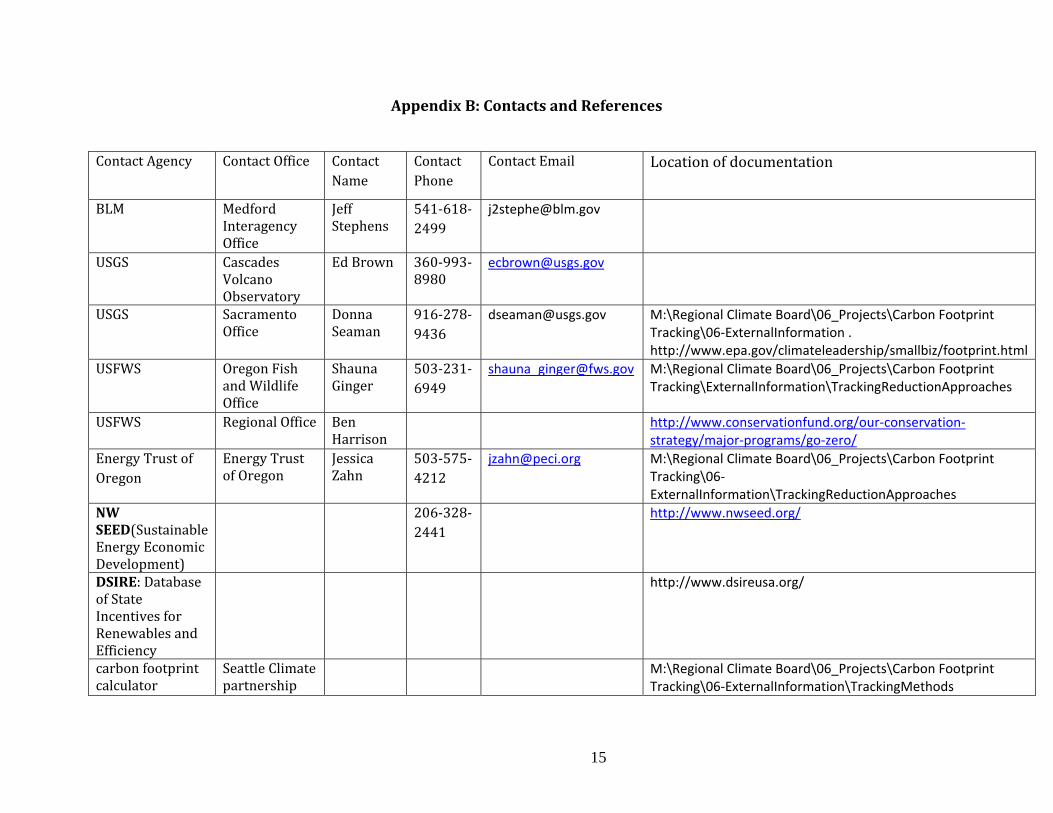
AppendixB:ContactsandReferences ContactAgency ContactOffice Contact
NameContactPhone
ContactEmail Locationofdocumentation
BLM MedfordInteragencyOffice
JeffStephens
541‐618‐2499
USGS CascadesVolcanoObservatory
EdBrown 360‐993‐8980
USGS SacramentoOffice
DonnaSeaman
916‐278‐9436
[email protected] M:\Regional Climate Board\06_Projects\Carbon Footprint Tracking\06‐ExternalInformation . http://www.epa.gov/climateleadership/smallbiz/footprint.html
USFWS OregonFishandWildlifeOffice
ShaunaGinger
503‐231‐6949
[email protected] M:\Regional Climate Board\06_Projects\Carbon Footprint Tracking\ExternalInformation\TrackingReductionApproaches
USFWS RegionalOffice BenHarrison
http://www.conservationfund.org/our‐conservation‐strategy/major‐programs/go‐zero/
EnergyTrustofOregon
EnergyTrustofOregon
JessicaZahn
503‐575‐4212
[email protected] M:\Regional Climate Board\06_Projects\Carbon Footprint Tracking\06‐ExternalInformation\TrackingReductionApproaches
NWSEED(SustainableEnergyEconomicDevelopment)
206‐328‐2441
http://www.nwseed.org/
DSIRE:DatabaseofStateIncentivesforRenewablesandEfficiency
http://www.dsireusa.org/
carbonfootprintcalculator
SeattleClimatepartnership
M:\Regional Climate Board\06_Projects\Carbon Footprint Tracking\06‐ExternalInformation\TrackingMethods

16
AppendixC:CRFPOCarbonFootprintGoalsandActions CRFPO footprint goals and actions to be included in this Appendix are pending the outcome of a meeting yet to be held with the CRFPO Executive Team. When available, these will be appended to the final report.

17
U.S. Fish and Wildlife Service Columbia River Fisheries Program Office 1211 SE Cardinal Court, Suite 100 Vancouver, WA 98683
June 2014