Crestwood Elementary School Review of Data School Improvement Process October 26, 2009.
45
Crestwood Elementary School Review of Data School Improvement Process October 26, 2009
-
Upload
kaley-stacks -
Category
Documents
-
view
216 -
download
0
Transcript of Crestwood Elementary School Review of Data School Improvement Process October 26, 2009.

Crestwood Elementary School
Review of DataSchool Improvement Process
October 26, 2009

We’ll begin with student demographic data.

How has the overall enrollment changed across time?
375 386 401 387 390 386 375399
0
50
100
150
200
250
300
350
400
450
500
2002-03 2003-04 2004-05 2005-06 2006-07 2007-08 2008-09 2009-10
Crestwoodenrollment

What do we know about our students?ENROLLMENT BY LOW INCOME AT CRESTWOOD

How does Crestwood’s level of economically disadvantaged students compare to the District and State?
33.6
46.9
37.6
0 20 40 60 80 100
% ofeconomically
disadvantagedstudents -
2008-09
WI
MMSD
Crestwood

This Year’s Enrollment by Low Income: MMSDSeptember, 2009
0
10
20
30
40
50
60
70
80
90
100
% Low Income
District Elementary Avg. = 49%

This Year’s Enrollment by Low Income: MMSDSeptember, 2009
0
10
20
30
40
50
60
70
80
90
100
% Low Income
District Elementary Avg. = 49%

Data on our students…RACIAL/ETHNIC DIVERSITY AT Crestwood

How does Crestwood’s diversity of students compare to the District and State?
61
48
74
18
24
12
12
17
10 4
11
9
0% 20% 40% 60% 80% 100%
Crestwood
MMSD
WI
White
Afr-Amer
Hispanic
Asian
2008-09 School Year

Data on our students…
1915
1815 14
24
0
5
10
15
20
25
30
35
40
45
50
2006-07
2007-08
2008-09
Mobility -MMSDElementarySchools
Mobility -Crestwood
14
SpecialEducationStudents
Non-SpecialEducationStudents
IN COMPARISON TO THE DISTRICT, CRESTWOOD HAD LOWER MOBILITY LEVEL AND HAS A SIMILAR DENSITY OF SPECIAL EDUCATION STUDENTS
Mobility rate: move in/out per 100 students
CURRENT SPECIAL EDUCATION DENSITY

What about student engagement data?

What do we know about how our students are engaged?
90
91
92
93
94
95
96
97
98
2005-06 2006-07 2007-08
CRESTWOOD
MMSD ElementarySchools
ATTENDANCE RATES FOR ALL STUDENTS:
CRESTWOOD AND MMSD ELEMENTARY SCHOOLS
The District’s goal is 94% attendance rate for all students…

While the overall attendance data is above the 94% goal, it’s been a mixed story for our African-American students across the District…
88
89
90
91
92
93
94
95
96
97
98
2006-07 2007-08 2008-09
CRESTWOOD
MMSD ElementarySchools
ATTENDANCE RATES FOR AFRICAN-AMERICAN STUDENTS: CRESTWOOD AND MMSD ELEMENTARY SCHOOLS
…and all student groups at Crestwood
Last year:
Hispanic = 94.1%
Asian = 94.8%
White = 95.8%

What do we know about how our students are engaged?
0
1
2
3
4
5
6
7
8
9
10
2005-06 2006-07 2007-08 2008-09
CRESTWOOD
MMSD ElementarySchools
SUSPENSION RATES FOR ALL STUDENTS:
CRESTWOOD AND MMSD ELEMENTARY SCHOOLS
Rates are based upon number of suspensions per 100 students

What about student learning data?

How do our students’ primary reading test scores compare to the District averages?
75
8378
71 70 70
0
10
20
30
40
50
60
70
80
90
100
PLAA: KindergartenTRL
PLAA: First Grade TRL PLAA: Second GradeTRL
Crestwood % prof. adv.
MMSD % Proficient/Advanced
PRIMARY READING TESTS, SPRING 2009

Does an achievement gap exist when we consider our primary reading test scores for minority students? When does it appear? become more significant?
50 53
70
9094
85
0
10
20
30
40
50
60
70
80
90
100
PLAA:Kindergarten
TRL
PLAA: FirstGrade TRL
PLAA: SecondGrade TRL
African-Am. %Proficient/Advanced
White %Proficient/Advanced
PRIMARY READING TESTS, SPRING 2009

Does an achievement gap exist when we consider our primary reading test scores for low-income students? When does it appear? become more significant?
8995 94
42
66
45
0
10
20
30
40
50
60
70
80
90
100
PLAA:Kindergarten
TRL
PLAA: FirstGrade TRL
PLAA: SecondGrade TRL
Not Low Income %Proficient/AdvancedLow Income %Proficient/Advanced
PRIMARY READING TESTS, SPRING 2009

Adequate Yearly Progress
Reading Math
Starting Point 2001-02 61% 37%
2002-03 61% 37%
2003-04 61% 37%
Intermediate Goal 2004-05 67.5% 47.5%
(Begin new 3-8 tests) 2005-06 67.5% 47.5%
2006-07 67.5% 47.5%
Intermediate Goal 2007-08 74% 58%
2008-09 74% 58%
2009-10 74% 58%
Intermediate Goal 2010-11 80.5% 68.5%
Intermediate Goal 2011-12 87% 79%
Intermediate Goal 2012-13 93.5% 89.5%
Goal: All Proficient 2013-14 100% 100%
Annual Measurable Objectives
% P
rofi
cie
nt/
Ad
van
ced

When we consider the “high stakes” test for reading, how did our students perform?
9786
96
0%
10%
20%
30%
40%
50%
60%
70%
80%
90%
100%
Third Grade Fourth Grade Fifth Grade
Basic/Minimal
Proficient/Advanced
WKCE - Reading: November, 2008
Criteria that determines a school’s status (AYP):
Reading – 74%

How do our Proficiency/Advanced levels compare to the District and State?
97
86
96
7276 74
79 82 81
0
10
20
30
40
50
60
70
80
90
100
Third Grade %Prof/Adv
Fourth Grade %Prof/Adv
Fifth Grade %Prof/Adv
Crestwood
MMSD
WI
WKCE – Reading, 2008: Proficiency/Advanced %

What have been the long-term trends in reading achievement?
8995 93
86
0
10
20
30
40
50
60
70
80
90
100
Fourth Grade % Prof/Adv
2005
2006
2007
2008
WKCE - Reading, 2005-08: Fourth Grade Proficiency/Advanced %

When we disaggregate the reading data by various groups of students, what are our Proficiency/Advanced levels ? We’ll start with gender…
100 100 9796
72
96
0
10
20
30
40
50
60
70
80
90
100
Third Grade %Prof/Adv
Fourth Grade %Prof/Adv
Fifth Grade %Prof/Adv
Girls
Boys
WKCE - Reading, 2008: Proficiency/Advanced %

Then we’ll look at race/ethnicity…
100 96 10090
55
72
0
10
20
30
40
50
60
70
80
90
100
Third Grade %Prof/Adv
Fourth Grade% Prof/Adv
Fifth Grade %Prof/Adv
White
Combined - Other
WKCE - Reading, 2008: Proficiency/Advanced %

…and Economic Status.
50
8893
98
0
10
20
30
40
50
60
70
80
90
100
Third Grade %Prof/Adv
Fourth Grade% Prof/Adv
Fifth Grade %Prof/Adv
EconomicallyDisadvantaged
Not EconomicallyDisadvantaged
WKCE – Reading, 2008: Proficiency/Advanced %
Third grade low income students: two small of a group to make a comparison

When we compare the students that we could instructionally impact (FAY) to Wisconsin schools with similar levels of economic disadvantage, how did we do in bringing our students up to proficiency in reading?

A 3 Year Comparison of Crestwood 5th Grade WKCE
Reading Scores
0%
10%20%
30%40%
50%60%
70%80%
Advanced Basic
Fall 06
Fall 07
Fall 08

When we consider the “high stakes” test for mathematics, how did our students perform?
81 86 87
0%
10%
20%
30%
40%
50%
60%
70%
80%
90%
100%
Third Grade Fourth Grade Fifth Grade
Basic/Minimal
Proficient/Advanced
WKCE - Mathematics: November, 2008
Criteria that determines a school’s status (AYP):
Math – 58%
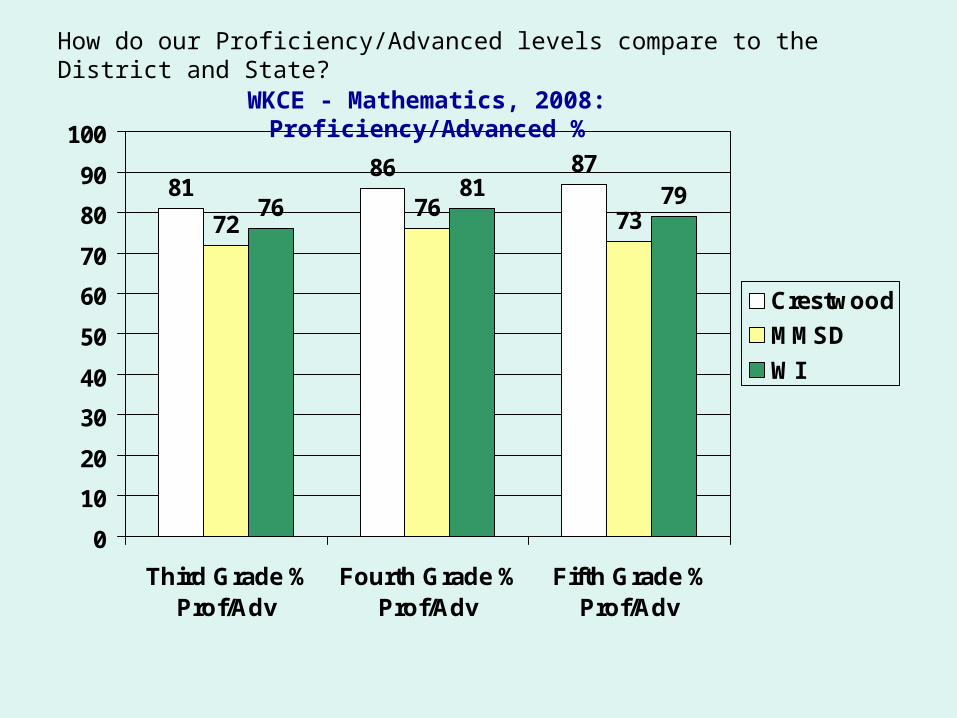
How do our Proficiency/Advanced levels compare to the District and State?
8186 87
7276 7376
81 79
0
10
20
30
40
50
60
70
80
90
100
Third Grade %Prof/Adv
Fourth Grade %Prof/Adv
Fifth Grade %Prof/Adv
Crestwood
MMSD
WI
WKCE - Mathematics, 2008: Proficiency/Advanced %

What have been the long-term trends in mathematics achievement?
90 89 89 86
0
10
20
30
40
50
60
70
80
90
100
Fourth Grade % Prof/Adv
2005
2006
2007
2008
WKCE - Mathematics, 2005-08

When we disaggregate the math data by various groups of students, what are our Proficiency/Advanced levels ? We’ll start with gender…
80
95
8581 78
91
0
10
20
30
40
50
60
70
80
90
100
Third Grade %Prof/Adv
Fourth Grade %Prof/Adv
Fifth Grade %Prof/Adv
Girls
Boys
WKCE – Mathematics, 2008: Proficiency/Advanced %

Then we’ll look at race/ethnicity…
8892 92
6067
58
0
10
20
30
40
50
60
70
80
90
100
Third Grade %Prof/Adv
Fourth Grade% Prof/Adv
Fifth Grade %Prof/Adv
White
Combined-Other
WKCE - Mathematics, 2008: Proficiency/Advanced %

…and Economic Status.
6763
90 93
0
10
20
30
40
50
60
70
80
90
100
Third Grade %Prof/Adv
Fourth Grade% Prof/Adv
Fifth Grade %Prof/Adv
EconomicallyDisadvantaged
Not EconomicallyDisadvantaged
WKCE – Mathematics, 2008: Proficiency/Advanced %
Third grade low income students: two small of a group to make a comparison

When we compare the students that we could instructionally impact (FAY) to Wisconsin schools with similar levels of economic disadvantage, how did we do in bringing our students up to proficiency in math?

Although not yet factored into AYP and other considerations, the importance of science achievement measured through the WKCE will soon increase. How do our Proficiency/Advanced levels compare to the District and State?
85
68
76
0
10
20
30
40
50
60
70
80
90
100
Fourth Grade % Prof/Adv
Crestwood
MMSD
WI
WKCE - Science, 2008: Proficiency/Advanced %

Six-Trait Scores: Fifth Grade

Six-Trait Scores: Fifth Grade

Finally, what relationships data do
we have?

Parents/guardians participate in school activities…
Crestwood District
No Opinion/
Don’t Know
0% 4%
Strongly Agree
54% 30%
Agree 43% 55%
Disagree 3% 10%
Strongly Disagree
0% 1.%
Crestwood Elementary School vs. District Elementary Schools-Staff Survey

Crestwood Elementary School vs. District Elementary Schools-Staff Survey
Crestwood District
No Opinion/
Don’t Know
0% 1%
Strongly Agree 66% 45%
Agree 31% 45%
Disagree 3% 8%
Strongly Disagree
0% 2%
Our school culture values caring, celebration, and humor.

Our school has traditions and recognition events that are meaningful to staff.
Crestwood Elementary School vs. District Elementary Schools-Staff Survey
Crestwood District
No Opinion/
Don’t Know
0% 5%
Strongly Agree 43% 24%
Agree 51% 51%
Disagree 6% 18%
Strongly Disagree
0% 2%

Crestwood Elementary School vs. District Elementary Schools-Staff Survey
Crestwood District
No Opinion/
Don’t Know
3% 6%
Strongly Agree 18% 7%
Agree 50% 38%
Disagree 29% 45%
Strongly Disagree
0% 4%
Students in this school are free from bullying.

• Conclusions from our Data • Crestwood’s student achievement as measured by the state standardized
test scores (WKCE) in reading, math, science, and social studies have historically been high and they remain so.
• When compared to other Wisconsin schools with similar demographics Crestwood students rank among the highest on the WKCE in reading.
• There is a significant achievement gap as measured by the WKCE between our white students and our students of color.
• The number of minority students, particularly African- American students at our school has increased significantly over the past few years.
• Our school’s suspension rate is significantly lower than the district average. • Our school’s attendance rate among African- American is lower than the
average for the district.• Our school’s poverty rate has risen fairly dramatically over the past few
years.

Goal #1:
Consistent and systematic collaboration among staff will improve our academic program and raise the percentage of minority students who are proficient in reading, language arts, and math by 3% at the end of 2 years.
Madison Metropolitan School DistrictSchool Improvement Process:
Action PlanSchool: CrestwoodYear: 09-10Principal: Howard FriedDate Developed: 10/09

Goal #2:
Develop a series of initiatives which utilizes Crestwoods’ ongoing strengths and at the same time prepares us for the inevitable changes that our future will bring.