Crested Butte Real Estate Market Report - Ski Season 2014-2015
6
CHRIS KOPF PREVIEWS® PROPERTY SPECIALIST COLDWELL BANKER BIGHORN REALTY cell: 970.209.5405 [email protected] www.chriskopf.com CRESTED BUTTE REAL ESTATE MARKET REPORT SKI SEASON RESULTS 2014 -2015 SEASON PREPARED BY CHRIS KOPF YTD SOLD PROPERTIES 2013 2014 2015 2013 2014 2015 YTD TOTAL VOLUME CONDO MEDIAN SALES PRICE The data represents all Single Family Homes, Condos, Townhomes and Land sales in the North End of the Gunnison Valley, including Almont, CB South, Irwin, Crested Butte, Rural Crested Butte, Mt. Crested Butte and Rural Mt. Crested Butte as shown in the Gunnison Country Association of Realtors MLS. Information contained herein deemed reliable, but not guaranteed. SOLD DOM 2012-13 2013-14 2014-15 306 387 324 Q: WHAT IS YOUR HOME WORTH? A: CALL ME.
-
Upload
chris-kopf -
Category
Real Estate
-
view
17 -
download
1
Transcript of Crested Butte Real Estate Market Report - Ski Season 2014-2015

The data represents all Single Family Homes, Condos, Townhomes and Land sales in the North End of the Gunnison Valley, including Almont, CB South, Irwin, Crested Butte, Rural Crested Butte, Mt. Crested Butte and Rural Mt. Crested Butte as shown in the Gunnison Country Association of Realtors MLS. Information contained herein deemed reliable, but not guaranteed.
CHRIS KOPF PREVIEWS® PROPERTY SPECIALIST COLDWELL BANKER BIGHORN REALTY cell: 970.209.5405 [email protected] www.chriskopf.com
CRESTED BUTTE REAL ESTATE MARKET REPORT SKI SEASON RESULTS 2014 -2015 SEASON
PREPARED BY CHRIS KOPF
YTD SOLDPROPERTIES
2013 2014 2015 2013 2014 2015
CONDO & TOWN HOME MEDIAN SALES PRICE
YTD TOTALVOLUME
CONDO MEDIAN SALES PRICE
The data represents all Single Family Homes, Condos, Townhomes and Land sales in the North End of the Gunnison Valley, including Almont, CB South, Irwin, Crested Butte, Rural Crested Butte, Mt. Crested Butte and Rural Mt. Crested Butte as shown in the Gunnison Country Association of Realtors MLS. Information contained herein deemed reliable, but not guaranteed.
SOLD DOM 2012-13 2013-14 2014-15
306 387 324
Q: WHAT IS YOUR HOME WORTH? A: CALL ME.

The data represents all Single Family Homes, Condos, Townhomes and Land sales in the North End of the Gunnison Valley, including Almont, CB South, Irwin, Crested Butte, Rural Crested Butte, Mt. Crested Butte and Rural Mt. Crested Butte as shown in the Gunnison Country Association of Realtors MLS. Information contained herein deemed reliable, but not guaranteed.
CHRIS KOPF PREVIEWS® PROPERTY SPECIALIST COLDWELL BANKER BIGHORN REALTY cell: 970.209.5405 [email protected] www.chriskopf.com
CRESTED BUTTE REAL ESTATE MARKET REPORT SKI SEASON RESULTS 2014 -2015 SEASON
PREPARED BY CHRIS KOPF
Ski-Season"Total $ Volume of Properties Sold
Ski-Season"Total # of "
Properties Sold
Comparing Total $ Volume by Month
Crested Butte Real Estate | Ski-Season Results Ski-Season Results for 2014-2015 are Up but below 2012-2013 We did not have a great snow year, but visitors, skier days, lodging and sales tax revenue were all up (as much as 16% in Crested Butte through February) compared to last year. Visitors brings interest and activity to real estate and Crested Butte real estate market saw an overall rise in total transactions and volume as well. As long-term renter demand has increased, there seems to be a lack of affordable or “lower-end” single family homes available with only six homes available between $400,000 - $500,000. There nearly 40 condos for sale under $250,000 but all come with higher burden of HOA fees. If you look further in this report you will see that there is not a significant rise in single family home prices, or price per sq. ft., but there is a lack of inventory available for sale at the lower end of the market right now which is why we have seen a significant number of lots sold, 45 vs 19 last year, and 27 two years ago. Average Days on Market (DOM) for all properties was 324 and 307 for SF Homes. The Assessor has sent out updated property valuations – and some have seen an increase in their property value which will lead to an increase in taxes. Remember that the revaluation, or reappraisal, occurs in odd-numbered years, and the property valuation notices sent out are based on transactions that occurred between July 1, 2009 and June 30, 2014. The Assessor uses an automated Multiple Regression Analysis comparison approach and not an individual property analysis. There is an appeal or protest process – see http://www.gunnisoncounty.org/132/Assessors-Office
Month 2011-2012 2012-2013 2013-2014 2014-2015DEC $4,850,500 $7,695,600 $6,041,000 $7,050,825JAN $13,923,750 $8,751,700 $5,773,686 $4,107,500FEB $4,545,898 $8,671,475 $7,026,450 $8,097,000MAR $6,600,200 $10,261,486 $3,803,000 $11,866,000APR $8,032,800 $17,126,400 $8,187,800 $9,568,000
Totals $37,953,148 $52,506,661 $30,831,936 $40,689,325
Ski Season

The data represents all Single Family Homes, Condos, Townhomes and Land sales in the North End of the Gunnison Valley, including Almont, CB South, Irwin, Crested Butte, Rural Crested Butte, Mt. Crested Butte and Rural Mt. Crested Butte as shown in the Gunnison Country Association of Realtors MLS. Information contained herein deemed reliable, but not guaranteed.
CHRIS KOPF PREVIEWS® PROPERTY SPECIALIST COLDWELL BANKER BIGHORN REALTY cell: 970.209.5405 [email protected] www.chriskopf.com
CRESTED BUTTE REAL ESTATE MARKET REPORT SKI SEASON RESULTS 2014 -2015 SEASON
PREPARED BY CHRIS KOPF Ski-Season Single Family Homes "
$ Per Sq. Ft. Averages(for($(per(sq.(ft.(for(Single(Family(Homes(Flat,((Condos(see(Slight(Rise( Average Price per square foot is a useful metric to compare properties and it is especially useful to analyze data to identify patterns and trends. It also is a helpful metric many people use when considering building vs. buying an existing home. As the current data shows we have a fairly flat trend year over year with regard to the overall price per sq. ft. Single Family homes are up 10% from the same period last year, which is interesting considering the higher priced Luxury Homes do not make up much of the mix sold this year (3 sold vs. last year over $1M). Condos & Town Homes saw a 10% decline in price per sq. ft. when compared to the same period last year, but up compared to prior years. What Real Estate is Selling in the Crested Butte area? As the table shows Condos & Townhomes lead the pack at39% (compared to 56% last year) of the total count, but only 25% (vs. 46% last year) of the volume. Single Family Homes are 25% of the count and 54% of the volume. Luxury Properties over $1M (typically purchased by the Second Homeowner) represent only a 7% share of the number of transactions, but 28% of the total dollar volume.
Ski-Season Condo & Town Homes "$ Per Sq. Ft.
2014-2015 SKI-SEASON TOTALS - CATEGORY
$ Volume of Properties Sold
% of TotalCount of # Properties
Sold% of Total
Total All Sales $40,296,550 122 Condos & Townhomes $10,156,900 25% 47 39%Single Family Homes $21,688,650 54% 30 25%Mt. Crested Butte $12,757,400 32% 45 37%Mt. CB Single Family Homes $3,857,000 10% 5 4%Crested Butte Single Family Homes $9,773,900 24% 11 9%Skyland Single Family Homes $1,535,000 4% 2 2%CB South Single Family Homes $2,762,250 7% 7 6%Almont $0 0% 0 0%Land/Lots $8,451,000 21% 45 37%SF Homes Sold > $1M $11,095,000 28% 9 7%

The data represents all Single Family Homes, Condos, Townhomes and Land sales in the North End of the Gunnison Valley, including Almont, CB South, Irwin, Crested Butte, Rural Crested Butte, Mt. Crested Butte and Rural Mt. Crested Butte as shown in the Gunnison Country Association of Realtors MLS. Information contained herein deemed reliable, but not guaranteed.
CHRIS KOPF PREVIEWS® PROPERTY SPECIALIST COLDWELL BANKER BIGHORN REALTY cell: 970.209.5405 [email protected] www.chriskopf.com
CRESTED BUTTE REAL ESTATE MARKET REPORT SKI SEASON RESULTS 2014 -2015 SEASON
PREPARED BY CHRIS KOPF The detail below represents the past three years data by category. The % Difference Asking Price vs. Sold Price by Category, on average 8% for all property types.
2014 - 2015 Ski Season Totals
Total Sold by Category
Average Sold Price
Total Asking Price by Category
Average Asking Price
Total Original Price by Category
Average Original
Price
% Difference Original Price vs. Sold Price
% Difference Asking Price
vs. Sold Price
Average Price Per Sq. Foot
Count of # Properties
Sold
Total All Sales $40,296,550 330,300 $43,800,599 359,021 45,942,700 376,580 -12.29% -8.00% 122Condos & Townhomes $10,156,900 216,104 $10,756,499 228,862 11,090,000 235,957 -8.41% -5.57% $224 47Single Family Homes $21,688,650 722,955 $23,168,300 772,277 24,222,600 807,420 -10.46% -6.39% $327 30Mt. Crested Butte $12,757,400 283,498 $14,239,399 316,431 13,830,400 307,342 -7.76% -10.41% 45Mt. CB Single Family Homes $3,857,000 771,400 $4,116,500 823,300 4,444,000 888,800 -13.21% -6.30% $309 5Crested Butte Single Family Homes $9,773,900 888,536 $10,391,900 944,718 10,681,800 971,073 -8.50% -5.95% $438 11Skyland Single Family Homes $1,535,000 767,500 $1,618,000 809,000 1,734,000 867,000 -11.48% -5.13% $252 2CB South Single Family Homes $2,762,250 394,607 $2,958,000 422,571 3,222,900 460,414 -14.29% -6.62% $196 7Almont $0 0Land/Lots $8,451,000 187,800 $9,875,800 219,462 9,273,700 206,082 -8.87% -14.43% 45SF Homes Sold > $1M $11,095,000 1,232,778 $11,929,000 1,325,444 12,334,900 1,370,544 -10.05% -6.99% $366 9
2013 - 2014 Ski Season Totals
Total Sold by Category
Average Sold Price
Total Asking Price by Category
Average Asking Price
Total Original Price by Category
Average Original
Price
% Difference Original Price vs. Sold Price
% Difference Asking Price
vs. Sold Price
Average Price Per Sq. Foot
Count of # Properties
SoldTotal All Sales $31,841,761 353,797 $34,218,550 380,206 36,328,850 403,654 -12.35% -6.95% 90Condos & Townhomes $14,576,261 291,525 $15,661,850 313,237 16,283,250 325,665 -10.48% -6.93% $249 50Single Family Homes $14,109,400 671,876 $14,971,200 712,914 15,678,600 746,600 -10.01% -5.76% $297 21Mt. Crested Butte $12,384,100 302,051 $13,328,350 325,082 13,359,600 325,844 -7.30% -7.08% 41Mt. CB Single Family Homes $2,864,400 477,400 $3,061,300 510,217 3,490,700 581,783 -17.94% -6.43% $182 6Crested Butte Single Family Homes $4,990,000 998,000 $5,268,000 1,053,600 5,268,000 1,053,600 -5.28% -5.28% $466 5Skyland Single Family Homes $1,925,000 1,925,000 $1,950,000 1,950,000 1,950,000 1,950,000 -1.28% -1.28% $403 1CB South Single Family Homes $1,900,000 475,000 $1,988,000 497,000 2,017,000 504,250 -5.80% -4.43% $194 4Almont $294,000 98,000 $374,000 124,667 1,983,000 661,000 -85.17% -21.39% 3Land/Lots $3,156,100 166,111 $3,585,500 188,711 5,299,000 278,895 -40.44% -11.98% 19SF Homes Sold > $1M $4,810,000 1,603,333 $5,050,000 1,683,333 5,199,000 1,733,000 -7.48% -4.75% $366 3
2012 - 2013 Ski Season Totals
Total Sold by Category
Average Sold Price
Total Asking Price by Category
Average Asking Price
Total Original Price by Category
Average Original
Price
% Difference Original Price vs. Sold Price
% Difference Asking Price
vs. Sold Price
Average Price Per Sq. Foot
Count of # Properties
SoldTotal All Sales $50,852,061 406,816 $56,081,149 448,649 62,455,349 499,643 -18.58% -9.32% 125Condos & Townhomes $16,566,620 276,110 $18,335,550 305,593 19,015,200 316,920 -12.88% -9.65% $208 60Single Family Homes $30,129,955 792,894 $32,796,799 863,074 37,075,699 975,676 -18.73% -8.13% $282 38Mt. Crested Butte $17,304,412 332,777 $19,161,699 368,494 21,312,700 409,860 -18.81% -9.69% 52Mt. CB Single Family Homes $5,600,000 800,000 $6,062,499 866,071 6,858,499 979,786 -18.35% -7.63% $285 7Crested Butte Single Family Homes $6,906,005 863,251 $7,256,900 907,113 7,561,400 945,175 -8.67% -4.84% $417 8Skyland Single Family Homes $3,154,000 1,051,333 $3,344,000 1,114,667 4,074,000 1,358,000 -22.58% -5.68% $330 3CB South Single Family Homes $647,900 323,950 $664,800 332,400 719,900 359,950 -10.00% -2.54% $150 2Almont $695,550 347,775 $730,500 365,250 818,500 409,250 -15.02% -4.78% 2Land/Lots $4,155,486 153,907 $4,948,800 183,289 5,143,550 190,502 -19.21% -16.03% 27SF Homes Sold > $1M $17,018,000 1,418,167 $18,864,999 1,572,083 21,094,999 1,757,917 -19.33% -9.79% $366 12

The data represents all Single Family Homes, Condos, Townhomes and Land sales in the North End of the Gunnison Valley, including Almont, CB South, Irwin, Crested Butte, Rural Crested Butte, Mt. Crested Butte and Rural Mt. Crested Butte as shown in the Gunnison Country Association of Realtors MLS. Information contained herein deemed reliable, but not guaranteed.
CHRIS KOPF PREVIEWS® PROPERTY SPECIALIST COLDWELL BANKER BIGHORN REALTY cell: 970.209.5405 [email protected] www.chriskopf.com
CRESTED BUTTE REAL ESTATE MARKET REPORT SKI SEASON RESULTS 2014 -2015 SEASON
PREPARED BY CHRIS KOPF
Condo Median Sales Price Single Family Home Median Sales Price
Condo Average Sales Price Single Family Home Average Sales Price
Trends show Prices for Single Family Homes Rise and Condos & Townhomes show slight Fall Single Family (SF) homes – Comparing Ski-Season results from 2014-2015 to prior years we see that the Median Price for Single Family homes is flat at $542,000 and actually down from the ski-season from 2012-2013. We do see the Average SF Home price has risen to $723,000 and except for the sharp rise in 2012-2013 ski season it shows an increasing trend. As noted – we are not working with a huge sample set for the ski-season this may be a result of the quality and location of homes sold as there are not many luxury homes in the mix. Given the history of the Crested Butte area – there are still many areas where there is a 30 year old home that has not been updated, and a new 5 year old home right next door. This is the reason to reach out to a quality real estate agent for help understanding the values in the market. Also see 2014 In Review Market Report for 12 month analysis. Condos & Townhomes –prices continue to be fairly flat in this segment of the market. The Median Price for Condos and Townhomes was $175,000 compared with $183,000 last year, and the Average Price was down.
Crested Butte Luxury Real Estate Market - $1 Million + As the table shows there have been 9 Single Family homes Sold for $1M or more during this 2014 – 2015 Ski-Season compared with only 3 during this same period last year, and 12 Sold in 2012-2013. Average sold price for these homes was $1.2M, Average Price per sq. ft. was $387. The 7% Discount from Asking Price to Selling Price is lower than the rest of the market.
2014 - 2015 Ski Season Luxury
Properties $1M+ Sold
Total Sold by Category
Average Sold Price
% Difference Asking Price
vs. Sold Price
Average Price Per Sq. Foot
Count of # Properties
Sold
Total All Sales $11,095,000 $1,232,778 -6.99% 9Condos & Townhomes $0 0Single Family Homes $11,095,000 $1,232,778 -6.99% $387 9Mt. Crested Butte $2,570,000 $1,285,000 -6.55% $276 2Mt. CB Single Family Homes $2,570,000 $1,285,000 -6.55% $276 2Crested Butte Single Family Homes $5,150,000 $1,287,500 -6.62% $559 4Skyland Single Family Homes $1,000,000 $1,000,000 -6.45% $233 1Land/Lots $0 0
The data represents all Single Family Homes, Condos, Townhomes and Land sales in the North End of the Gunnison Valley, including Almont, CB South, Irwin, Crested Butte, Rural Crested Butte, Mt. Crested Butte and Rural Mt. Crested Butte as shown in the Gunnison Country Association of Realtors MLS. Information contained herein deemed reliable, but not guaranteed.
CHRIS KOPF PREVIEWS® PROPERTY SPECIALIST COLDWELL BANKER BIGHORN REALTY cell: 970.209.5405 [email protected] www.chriskopf.com
CRESTED BUTTE REAL ESTATE MARKET REPORT SKI SEASON RESULTS 2014 -2015 SEASON
PREPARED BY CHRIS KOPF
!
Optimistic for Summer Crested Butte Real Estate All indicators are that this will be an active Summer for Real Estate transactions. We have had really good numbers the past two years, and there are no significant external forces that lead me to believe that 2015 will not replicate. Interest rates are still low, there are national numbers supporting a renewed interest in Vacation Real Estate, there are lots of events again scheduled for the summer (including the Enduro World Series mountain bike series stop in Crested Butte). Compared with so many other mountain towns Crested Butte is a special place, and represents a great value in real estate. There has been a lot of banter about short-term property rentals as “the reason” there is a lack of long-term rentals available especially in town. There is also talk of taking property rights away from homeowners who have invested in Crested Butte – not good. Short-term rental add to the charm of visiting our town. We have deed restrictions in place. We are a tourism and real estate economy – an increase in occupied short-term rentals is a good thing, and proof that people want to come here, rent a house, ski, bike, hike, fly fish, relax, shop and eat. All Good! How can I help you? This Crested Butte Real Estate Market report and the level of detail is representative of what you can expect from me as your Real Estate Agent. If you are interested in finding out what your existing property is worth, or considering me to represent you as a Buyer, I would appreciate the opportunity to earn your business (or that of a friend you think I could help). To see featured properties or search the MLS – visit www.chriskopf.com. Contact me at: (970) 209-5405, or [email protected] Thanks,
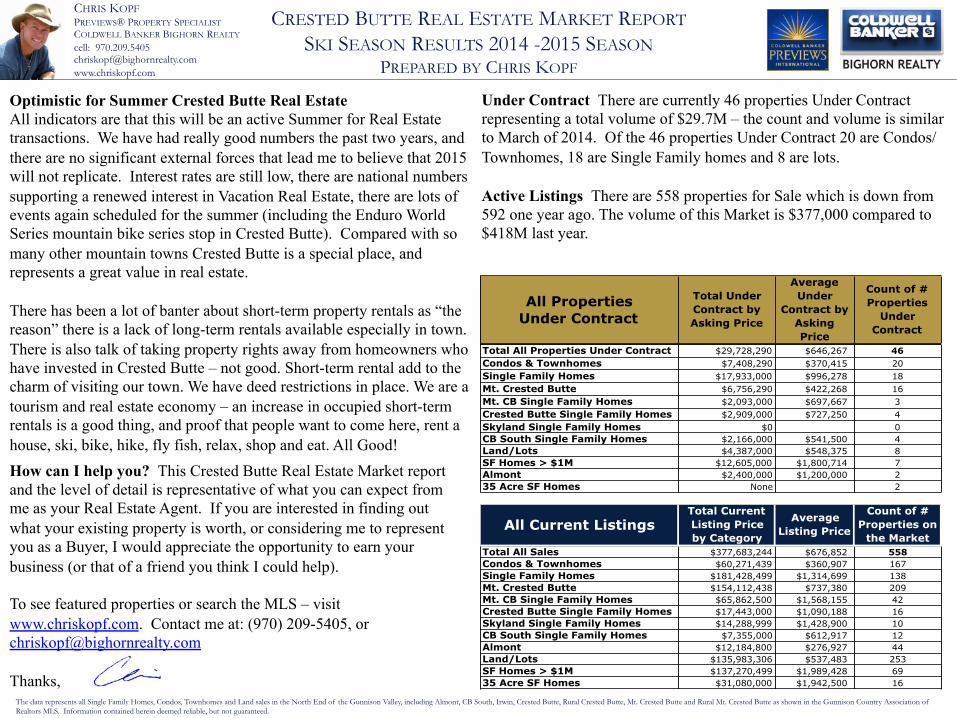
Under Contract There are currently 46 properties Under Contract representing a total volume of $29.7M – the count and volume is similar to March of 2014. Of the 46 properties Under Contract 20 are Condos/Townhomes, 18 are Single Family homes and 8 are lots. Active Listings There are 558 properties for Sale which is down from 592 one year ago. The volume of this Market is $377,000 compared to $418M last year.
All Properties Under Contract
Total Under Contract by Asking Price
Average Under
Contract by Asking Price
Count of # Properties
Under Contract
Total All Properties Under Contract $29,728,290 $646,267 46Condos & Townhomes $7,408,290 $370,415 20Single Family Homes $17,933,000 $996,278 18Mt. Crested Butte $6,756,290 $422,268 16Mt. CB Single Family Homes $2,093,000 $697,667 3Crested Butte Single Family Homes $2,909,000 $727,250 4Skyland Single Family Homes $0 0CB South Single Family Homes $2,166,000 $541,500 4Land/Lots $4,387,000 $548,375 8SF Homes > $1M $12,605,000 $1,800,714 7Almont $2,400,000 $1,200,000 235 Acre SF Homes None 2
All Current ListingsTotal Current Listing Price by Category
Average Listing Price
Count of # Properties on
the MarketTotal All Sales $377,683,244 $676,852 558Condos & Townhomes $60,271,439 $360,907 167Single Family Homes $181,428,499 $1,314,699 138Mt. Crested Butte $154,112,438 $737,380 209Mt. CB Single Family Homes $65,862,500 $1,568,155 42Crested Butte Single Family Homes $17,443,000 $1,090,188 16Skyland Single Family Homes $14,288,999 $1,428,900 10CB South Single Family Homes $7,355,000 $612,917 12Almont $12,184,800 $276,927 44Land/Lots $135,983,306 $537,483 253SF Homes > $1M $137,270,499 $1,989,428 6935 Acre SF Homes $31,080,000 $1,942,500 16