Creep and Shrinkage of High Performance Concrete · · 2014-06-24CREEP AND SHRINKAGE OF HIGH...
90
Technical Report Documentation Page [1. Report No. 2. Government Accession No. 3. Recipient's Catalog No. 1 FHWA/fX-98/580-5 1 4. Title and Subtitle 5. Report Date CREEP AND SHRINKAGE OF HIGH PERFORMANCE CONCRETE February 1996 6. Performing Organization Code 7. Author( s) 8. Performing Organization Report No. Erik W. Farrington, Ned H. Burns, and R. L. Carrasquillo 580-5 9. Performing Organization Name and Address 10. Work Unit No. (TRAIS) Center for Transportation Research The University of Texas at Austin 11. Contract or Grant No. 3208 Red River, Suite 200 Austin, TX 78705-2650 Project 9-580 12. Sponsoring Agency Name and Address 13. Type of Report and Period Covered Texas Department of Transportation Research Report Construction Division/Research Section P.O. Box 5080 14. Sponsoring Agency Code Austin, TX 78763-5080 15. Supplementary Notes Project conducted in cooperation with the U.S. Department of Transportation, Federal Highway Administration. 16. Abstract This study examines the creep and shrinkage of a high performance concrete having an ultimate compressive strength of 90 MPa. The effects of curing temperature, age at loading, and stress level were examined. The testing process involved two sets of 1 00-mm-by-600-mm cylindrical specimens cured at different temperatures. For each set of specimens, loads of 6.9, 20.7, and 34.5 MPa were applied at 1, 2, and 28 days. Companion shrinkage specimens were placed in the same environment as were the creep specimens. Strain measurements were taken up to 120 days after casting using a mechanical strain gauge. The recorded data were compared with predictions of creep and shrinkage values made using ACI Committee 209 procedures. These procedures were found to overestimate the values of creep and shrinkage. The data were also used to make predictions of ultimate values for creep and shrinkage for the high performance concrete used in this study. 1 17. Key Words 18. Distribution Statement High performance concrete, bridges, curing No restrictions. This document is available to the public through the temperature, loading age, stress, concrete creep, National Technical Information Service, Springfield, Virginia 22161. concrete shrinkage. 19. Security Classif. (of report) 20. Security Classif. (of this page) 21. No. of pages 22. Price Unclassified Unclassified 90 Form DOT F 1700.7 (8-72) Reproduction of completed page authorized
Transcript of Creep and Shrinkage of High Performance Concrete · · 2014-06-24CREEP AND SHRINKAGE OF HIGH...

Technical Report Documentation Page
[1. Report No. 2. Government Accession No. 3. Recipient's Catalog No. 1 FHW A/fX-98/580-5 1 4. Title and Subtitle 5. Report Date
CREEP AND SHRINKAGE OF HIGH PERFORMANCE CONCRETE February 1996
6. Performing Organization Code
7. Author( s) 8. Performing Organization Report No.
Erik W. Farrington, Ned H. Burns, and R. L. Carrasquillo 580-5
9. Performing Organization Name and Address 10. Work Unit No. (TRAIS)
Center for Transportation Research The University of Texas at Austin
11. Contract or Grant No. 3208 Red River, Suite 200 Austin, TX 78705-2650 Project 9-580
12. Sponsoring Agency Name and Address 13. Type of Report and Period Covered
Texas Department of Transportation Research Report Construction Division/Research Section P.O. Box 5080 14. Sponsoring Agency Code
Austin, TX 78763-5080
15. Supplementary Notes
Project conducted in cooperation with the U.S. Department of Transportation, Federal Highway Administration.
16. Abstract
This study examines the creep and shrinkage of a high performance concrete having an ultimate compressive strength of 90 MPa. The effects of curing temperature, age at loading, and stress level were examined. The testing process involved two sets of 1 00-mm-by-600-mm cylindrical specimens cured at different temperatures. For each set of specimens, loads of 6.9, 20.7, and 34.5 MPa were applied at 1, 2, and 28 days. Companion shrinkage specimens were placed in the same environment as were the creep specimens. Strain measurements were taken up to 120 days after casting using a mechanical strain gauge.
The recorded data were compared with predictions of creep and shrinkage values made using ACI Committee 209 procedures. These procedures were found to overestimate the values of creep and shrinkage. The data were also used to make predictions of ultimate values for creep and shrinkage for the high performance concrete used in this study.
1 17. Key Words 18. Distribution Statement
High performance concrete, bridges, curing No restrictions. This document is available to the public through the temperature, loading age, stress, concrete creep, National Technical Information Service, Springfield, Virginia 22161. concrete shrinkage.
19. Security Classif. (of report) 20. Security Classif. (of this page) 21. No. of pages 22. Price
Unclassified Unclassified 90
Form DOT F 1700.7 (8-72) Reproduction of completed page authorized


CREEP AND SHRINKAGE OF HIGH PERFORMANCE CONCRETE
by
Erik Wayne Farrington,
Ned H. Bums,
and
Ramon L. Carrasquillo
Research Report Number 580-5
Research Project 9-580
Design and Construction of Extra High Strength Concrete Bridges
conducted for the
Texas Department of Transportation
in cooperation with the
U.S. DEPARTMENT OF TRANSPORTATION
Federal Highway Administration
by the
CENTER FOR TRANSPORTATION RESEARCH
Bureau of Engineering Research
THE UNIVERSITY OF TEXAS AT AUSTIN
February 1996

ii

IMPLEMENTATION STATEMENT
The research and testing documented in this report detail the creep and shrinkage properties of high performance concrete having a compressive strength of 90 MPa. It has been determined that the ultimate shrinkage stra1ns and the ultimate creep coefficient for this concrete are significantly lower than those for normal strength concrete. These findings are directly applicable to the use of high performance, high strength concrete in the Louetta Road Overpass in Houston, Texas.
Prepared in cooperation with the Texas Department of Transportation and the U.S. Department of Transportation, Federal Highway Administration.
DISCLAIMERS
The contents of this report reflect the views of the authors, who are responsible for the facts and the accuracy of the data presented herein. The contents do not necessarily reflect the official views or policies of the Federal Highway Administration or the Texas Department of Transportation. This report does not constitute a standard, specification, or regulation.
There was no invention or discovery conceived or first actually reduced to practice in the course of or under this contract, including any art, method, process, machine, manufacture, design or composition of matter, or any new and useful improvement thereof, or any variety of plant, which is or may be patentable under the patent laws of the United States of America or any foreign country.
NOT INTENDED FOR CONSTRUCTION, BIDDING, OR PERMIT PURPOSES
Ramon L. Carrasquillo, P.E. (Texas No. 63881) Research Supervisor
ACKNOWLEGMENTS
The researchers would like to acknowledge the assistance provided by the Texas Department of Transportation project director, Ms. Mary Lou Ralls (MAT), as well as the guidance provided by the other members of the project monitoring committee, which included A Cohen (DES), W. R. Cox (CMD), D. Harley (FHW A), G. Lankes (MAT), L. Lawrence (MAT), D. van Landuyt (DES), J. Vogel (HOU), L. Wolf (DES), and T. Yarbrough (CSTR).
111

IV

TABLE OF CONTENTS
CHAPTER 1. INTRODUCTION ................................................................................................... 1
1.1 Research Significance ................................................................................................... 1
1.2 Long-Term Deflections in Concrete .............................................................................. 1
1.3 Objectives and Scope of the Research .......................................................................... 2
1.4 Research Plan ................................................................................................................ 3
1.5 Format ........................................................................................................................... 3
CHAPTER 2. LITERATURE REVIEW ........................................................................................ 5
2.1 Introduction ................................................................................................................... 5
2.2 Effect of Curing Temperature on Shrinkage ................................................................. 5
2.3 Effect of Curing Temperature on Creep ........................................................................ 5
2.4 Effect of Age at Loading on Creep ............................................................................... 5
2.5 Effect of Stress Level on Creep ..................................................................................... 6
2.6 ACI 209 Prediction of Creep ......................................................................................... 6
CHAPTER 3. TEST PROGRAM ................................................................................................. 13
3.1 Introduction ................................................................................................................. 13
3.2 Concrete Mix Design .................................................................................................. 13
3.3 Curing Procedure ......................................................................................................... 13
3.4 Test Procedures ........................................................................................................... 14
CHAPTER 4. PRESENTATION OF TEST RESULTS ............................................................... 19
4.1 Introduction ................................................................................................................. 19
4.2 Strength and Modulus of Elasticity ............................................................................. 19
4.3 Shrinkage ..................................................................................................................... 19
4.4 Creep ........................................................................................................................... 21
CHAPTER 5. DISCUSSION OF TEST RESULTS ..................................................................... 29
5.1 Introduction ................................................................................................................. 29
5.2 Shrinkage Results ........................................................................................................ 29
v

5.3 Creep Results ............................................................................................................... 33
CHAPTER 6. SUMMARY AND CONCLUSIONS .................................................................... 49
6.1 Summary ..................................................................................................................... 49
6.2 Conclusions ................................................................................................................. 49
REFERENCES .............................................................................................................................. 51
APPENDIX A. MEASURED STRAINS ...................................................................................... 53 APPENDIX B. AVERAGE STRAINS ON INDIVIDUAL SIDES
OF LOADED SPECIMENS ............................................................................................. 69
vi

SUMMARY
High performance concrete is a wide-ranging description of concretes having special physical properties. This study considers the creep and shrinkage properties of a high performance concrete having an ultimate strength of 90 MPa. Specifically in this study, we looked at such variables as the effects of curing temperature, age at loading, and stress level.
We used strain measurements taken through 120 days, along with curve-fitting techniques, to estimate the ultimate creep coefficient and ultimate shrinkage strains of the concrete. We also compared the recorded data with predictions made using ACI Committee 209 recommendations.
vii

Vlll

CHAPTER!
INTRODUCTION
1.1 RESEARCH SIGNIFICANCE
High performance concrete is a wide-ranging description of concretes having special physical properties. These properties include durability, scaling resistance, abrasion resistance, chloride permeability, strength, elasticity, shrinkage, and creep. Ranges of values for these properties have been presented by the Federal Highway Administration (FHW A)(1). Special testing procedures are also in the process of being created by the FHW A. This study considers a high performance concrete with high ultimate strength.
Researchers have been creating increasingly higher strength concretes for the past twenty years. Ultimate strengths reaching up to 130 MPa have been achieved. These new, stronger concretes are making an impact on the concrete construction industry, especially in prestressed construction. Higher strengths in the concrete allow for larger spans, shallower cross sections, and larger beam spacings. Other improvements in the prestress industry, such as 15-mm diameter seven-wire prestressing strands, amplify the effectiveness of high strength concrete. In essence, high strength concrete can reduce construction costs and allow designers more flexibility.
Although advancements in material quality have been occurring rapidly, similar advancements in construction have been slow. Because design procedures were created using normal strength concrete, their application to higher strength concretes is in doubt. As a result, researchers across the nation are involved with projects concerning several aspects of high strength concrete construction.
One such project is "Design and Construction of Extra High-Strength Concrete Bridges," funded by the Federal Highway Administration and the Texas Department of Transportation. This project involves the design and construction of the northbound and southbound Louetta Road Overpass on Texas State Highway 249, in Houston, Texas. The high strength concrete for this project has required compressive strengths at transfer up to 68 MPa and required 56-day compressive strengths up to 90 MPa (2). The creep and shrinkage study described in this report is part of this project. The high performance concrete studied was made from the same mix design used for the high strength prestressed beams. The results of the creep and shrinkage study will be used for the overall project in determining the prestress losses in the beams.
1.2 LONG-TERM DEFLECTIONS IN CONCRETE
When concrete is subjected to a load, several deformations take place. The initial deformation, or instantaneous elastic strain, takes place immediately upon loading. It is dependent upon the elastic properties of the concrete and the level of stress applied. If the load is continuously held on the concrete, additional long-term deformation will take place.
1

2
This long-term deformation occurs primarily as a result of the effects of shrinkage and creep properties of the concrete.
1.2.1 Definition of Shrinkage
Shrinkage is defined as a change in length or volume of concrete that is not caused by external stress. The change in volume of concrete corresponds with a loss of moisture. This loss of moisture can occur while the concrete is still fresh, in which case it is termed "plastic shrinkage," or after the concrete has hardened, in which case it is termed "drying shrinkage." These shrinkage deformations are independent of the stress in the concrete. This study deals with only the drying shrinkage of the high performance concrete used in this study.
Although drying shrinkage is caused by the loss of water not utilized in the hydration of the cement in concrete, the change in volume does not equal the volume of water lost. The loss of water from the capillaries in the concrete does not cause any shrinkage. Once all the water has left the capillaries, absorbed water begins to leave the cement paste, causing the concrete to shrink.
Another form of shrinkage is called "carbonation shrinkage." Hardened cement paste reacts with the carbon dioxide in the air, causing a volume reduction. The Ca(OHh carbonates to CaC03 and free water. This water can escape, as in drying shrinkage, causing shrinkage of the concrete (3).
1.2.2 Definition of Creep
Creep is defined as the gradual increase in strain under sustained stress. Relaxation is the term used to describe a decrease in stress under the application of a constant strain. Although the effects of creep have been referred to as many things (i.e., plastic flow, plastic deformations, etc.), the term creep is widely acknowledged as the proper description of the phenomenon. The creep strains that occur in concrete can sometimes be larger than the elastic strains that occur at loading. It is for this reason that determining the creep properties for a material is extremely important.
Creep and shrinkage are inter-related properties, although the assumption made in most studies of these properties is that creep is a deformation that is additive to the shrinkage deformation (3). The nature of creep is a controversial topic. There are several theories about the nature of creep, one of which involves the notion of absorbed water being forced into the capillaries of hardened concrete. However, because there is evidence that counters this hypothesis, the exact mechanism of creep remains unknown (3). What is known is that a sustained compressive stress applied to concrete will cause a time-dependent strain, which varies with the level of the applied stress.
1.3 OBJECTIVES AND SCOPE OF THE RESEARCH
The primary objective of this study is to determine the creep and shrinkage properties of the high performance concrete mix used in the high strength prestressed beams created for the Louetta Road Overpass project. In terms of the Louetta project, these properties will be

3
used in determining the prestress losses in the high strength concrete beams. Modifications to the existing procedures for determining creep and shrinkage in concrete can be made using the results of this study. The scope of this research study includes the following variables: curing temperature, level of stress, and age at loading.
1.4 RESEARCH PLAN
This study includes two sets of high performance concrete specimens that use the same design mix as was used for the Louetta Road Overpass project. One set was cured at high temperatures and the second was cured at low temperatures. The 28-day strength of the mix is approximately 90 MPa. Specimens for each set were loaded to 6.9, 20.7, and 34.5 MPa. For each level of stress, there were specimens loaded at 1, 2, and 28 days. Shrinkage specimens were kept in the same environment as the creep specimens. Strains were measured over a 120-day period for the data depicted here. Later readings will be made for use in further phases of the project.
1.5 FORMAT
This report is divided into six chapters. A review of the literature and research concerning this study can be found in Chapter 2. Chapter 3 contains a description of the test program. The test results are described in Chapter 4. Chapter 5 is a discussion of the results. Chapter 6 contains a summary, conclusions, and recommendations.

4

2.1 INTRODUCTION
CHAPTER2
LITERATURE REVIEW
This chapter reviews the ex1stmg literature on creep and shrinkage of high performance concrete. Where no information could be found on a subject pertaining to high performance concrete, the relevant information for normal strength concrete is discussed.
2.2 EFFECT OF CURING TEMPERATURE ON SHRINKAGE
Curing temperature is the temperature that the concrete experiences during the curing period. It has been found that shrinkage is reduced when concrete is cured at higher temperatures. ACI Committee 517 and Hanson (4, 5) report significant reductions in shrinkage when normal strength concrete is cured at elevated temperatures. The accelerated hydration and moisture loss both contribute to this reduction, which is noted immediately upon removing the specimens from the elevated temperatures. Carbonation shrinkage is not affected by the increased curing temperature (5). It is assumed that these conclusions can be applied to high performance concrete as well, since it is portland cement concrete.
The effect of curing temperature on the shrinkage of high performance concrete is important to this study because of the geometry of the high strength prestressed beams. Thin webs and massive endblocks cause temperature differentials throughout the beam during curing. While these differences are not large, their effect on the shrinkage of the concrete could be significant.
2.3 EFFECT OF CURING TEMPERATURE ON CREEP
It has been found that creep is also reduced when concrete is subjected to higher curing temperatures. Creep and shrinkage are inter-related properties of concrete, so this similarity should be expected. Hanson reports ( 4) that the accelerated curing methods reduce creep between 30% and 50%. Again, these studies involved normal strength concretes, but a correlation to high performance concrete can be made. The effect of curing temperature on creep is important for the same reasons as stated above.
2.4 EFFECT OF AGE AT LOADING ON CREEP
The concrete in a prestressed beam undergoes several loading stages. Load at transfer, addition of slab dead load, and addition of curb dead load all occur at different times in the life of the concrete. The difference in time between these events could range from a week to a month to half a year. When attempting to determine the prestress losses, the creep resulting from each of these loading stages needs to be taken into account. The amount of creep for each stage will differ not only because of different load levels, but also because of the age of the concrete at which loading occurs.
5

6
The earlier a concrete specimen is subjected to load, the more creep will occur in that specimen. This has been well established for normal strength concrete. Swamy and Anand (6) found that high performance concrete specimens loaded at 7 days experience approximately 25% less creep compared to specimens loaded at one day. This same trend is expected to occur for the high performance concrete being studied here.
2.5 EFFECT OF STRESS LEVEL ON CREEP
Very little information exists concerning the effect of stress level on the creep of high performance concrete with strengths of approximately 90 MPa. The relationship of stress and creep for normal strength concrete is directly proportional for stresses in the range of 0.3 f' c to 0.6 fc (3). Stresses in excess of 0.8fc produce creep strains that reach the ultimate value of strain for concrete. Although a linear relationship gives acceptable results up to about 0.6f c, Mindess and Young suggest a nonlinear relationship that is a thermally activated process (7).
The information available for high performance concrete concerns concretes with strengths in the range of 55 to 69 MPa. The proportionality limit for concretes in this category has been found to be approximately 0.7fc (8, 9, 10). The data presented here seem to support a trend of higher strength concrete having higher proportionality limits for creep of concrete.
2.6 ACI 209 PREDICTION OF CREEP (11)
ACI Committee 209 presents a general theoretical procedure for determining creep and shrinkage in concrete. This procedure refers to concrete under "normal" conditions, as listed in Table 2.1 (see Page 7). The Committee also gives factors to use when "normal" conditions are not met. There are no recommendations for high performance concrete, however. The following is an illustration of the theory and procedures set forth by ACI
Committee 209.
2.6.1 Theoretical Prediction of Creep and Shrinkage
The creep coefficient is a measure of the creep in concrete. This coefficient is obtained by dividing the creep strain at a particular time by the elastic strain. The ultimate creep coefficient is then the ultimate creep strain divided by the elastic strain. The functions that are used for determining the creep coefficient and shrinkage strains are the following:
t"' v = v
t d+t"' u Eq. 2-1
Eq. 2-2

where: f (in days), d (in days), \jf, a, are constants for a given member shape and size v t is the creep coefficient at time t Vu is the ultimate creep coefficient (Esh)t is the shrinkage strain at timet (Esh)u is the ultimate shrinkage strain t is the time (in days) after loading for Eq 2-1 and after curing for Eq 2-2
7
Ranges for the constants in Equations 2-1 and 2-2 under normal conditions have been found to be:
'V = 0.40 to 0.80
d 6 to 30 days
Vu 1.30 to 4.15
a = 0.90 to 1.10
f 20 to 130 days
2.6.2 ACI Recommended Procedure for Determining Creep and Shrinkage
Using the theoretical formulas above, the Committee determined the following equations for determining creep and shrinkage under standard conditions. The conditions termed "standard" are listed in Table 2.1.
Table 2.1
Standard conditions for ACI Committee 209 creep and shrinkage predictions
Variables Considered Standard Conditions Type of cement Type I and III Slump I 70mm Air Content <6% Fine A~,gregate Percentage 50% Cement Content 279 to 446 kg/m3 Moist Cured 7 days, 23 + 2C, RH > 95% Steam Cured 1 to 3 days, < lOOC, RH > 95% Concrete Temperature 23+2C Ambient Relative Humidity 40% Volume - Surface Ratio 38mm Age at Loading (Moist Cured) 7 days Age at Loading (Steam Cured) 1 to 3 days Stress/Strength Ratio <50%

8
The creep coefficient at time t for both moist-cured and steam-cured concrete is given in Equation 2-3. Figure 2.1 shows a representation of the form of Equation 2-3.
t0.60
v = v t 10+ t0.60 u
Eq. 2-3
0.9
0.8
0.7
0.6 = ~0.5 ;>
0.4
0.3
0.2
0.1
0
0 200 400 600 800 1000 1200 1400 1600 1800 2000
Time (days)
Figure 2.1 General form of Equation 2-3
The shrinkage strain at time t following 7 days of moist curing is given in Equation 2-4.
Eq. 2-4
The shrinkage strain at timet following 1 to 3 days of steam curing is given in Equation 2-5. Figure 2.2 shows a representation of the form of Equations 2-4 and 2-5.
Eq. 2-5
In order to determine the amounts of creep and shrinkage that occur in concrete not subject to the standard conditions listed above, modifiers have been created to be applied to the ultimate values of both creep and shrinkage. These modifiers are denoted by the symbol ywith a subscript related to the effect in question.

9
0.9
0.8
"0.7 """' ;n 0.6 '-' ::0.5 ,...., ~ 0.4 ~
'-"o.3
0.2 -+-Equation 24
0.1 -ilf- Equation 2-5
0
0 200 400 600 800 1000 1200 1400 1600 1800 2000
Time (days)
Figure 2.2 General form of Equations 2-4 and 2-5
2.6.2.1 Loading Age: There are two equations that can be used to determine the modifier for loading age (Y1a). Should the load be placed on the concrete at a time greater than
7 days for moist-cured concrete, Equation 2-6 should be used.
-0.118 Creep Yia = 1.25 ( t1J Eq. 2-6
Should the load be placed at a time greater than 1 - 3 days for steam-cured concrete, Equation 2- 7 should be used.
-0.094 Creep Yla = 1.13 ( tla)
where t1a is the loading age in days.
Eq. 2-7
2.6.2.2 Initial Moist Curing: The standard duration for moist curing concrete is 7 days. When this duration is not used the amount of shrinkage that occurs changes. In order to account for this change in shrinkage, the values found in Table 2.2 may be applied to the ultimate shrinkage strain.
Table 2.2 Shrinkage correction factors for initial moist curing
Moist Curing Duration, days Shrinkage Yep
1 1.2 3 1.1 7 1.0 14 0.93 28 0.86 90 0.75

10
2.6.2.3 Ambient Relative Humidity: Relative humidity is an important environmental factor affecting creep and shrinkage. When the concrete is subjected to ambient relative humidities (A) greater than 40%, the following equations should be used to determine the ambient relative humidity modifier (YA.).
Creep 'YA. = 1.27 - 0.0067A, for A > 40
Shrinkage 'YA. = 1.40 - 0.010A, for 40 ~ A < 80
'YA. = 3.00- 0.030A, for 80 ~A< 100
Eq. 2-8
Eq. 2-9
Eq. 2-10
2.6.2.4 Volume-Suiface Ratio: Member size affects both the ultimate values of creep and shrinkage and the time function followed by both. The volume-surface ratio modifier equations, where vis is measured in mm, are:
Creepyvts = 2/3 (1 + 1.13 e(..o.ozl3 vts))
Shrink 'V _ 1 2 (-0.00472 v/s)) age 1vts- . e
Eq. 2-11
Eq. 2-12
2.6.2.5 Temperature Other Than 70 Degrees: Temperature is another important environmental factor affecting creep and shrinkage. Often its effects are ignored because the temperatures ranges experienced by a structure are rarely large and most structures do not experience very high temperatures for long periods of time. Data have been found that show creep strains for creep tests conducted with the temperature maintained at 50°C (122°F) to be approximately 2 to 3 times larger than creep strains for tests conducted at temperatures around 21°C (70°F) (11).
2.6.2.6 Concrete Composition: Slump, percent of fine aggregate, cement, and air percentage all have an affect on creep and shrinkage. Equations 2-13 to 2-20 (11) give the modification factors that correspond with each of these mix parameters. There are two important facets of the concrete composition factors. The first is that the modification factors are useful only if the mix design is known. During the design process the actual mix design for the concrete is not always known. Without the actual composition of the concrete these factors cannot be applied. The second facet is that, under certain conditions, these factors can be ignored. When the concrete's slump is less than 130 mm, the fme aggregate percent is between 40% and 60%, the cement content is between 279 and 445 kg/m3
, and the air content is less than 8%, these factors work out to about 1.0.
2.6.2.6.1 Slump: The modification factors corresponding to slump are:
Creep Ys = 0.82 + 0.00264s
Shrinkage Ys = 0.89 + 0.00161s where s is the slump in millimeters.
Eq. 2-13
Eq. 2-14

11
2.6.2.6.2 Fine Aggregate Percentage: The modification factors corresponding to fine aggregate percentage are:
Creep Yv = 0.88 + 0.0024'V
Shrinkage Yv = 0.30 + 0.014'V for 'V <50%
'Yv = 0. 90 + 0.002\V for 'V > 50%
Eq. 2-15
Eq. 2-16
Eq. 2-17
where lJf is the ratio of the fine aggregate to the total aggregate by weight expressed as a percentage.
2.6.2.6.3 Cement Content: The cement content has a negligible effect on the creep of concrete. The modification factor that can be applied to the ultimate shrinkage is:
Shrinkage 'Yc 0.75 + 0.00061c
where cis the cement content in kg/m3•
Eq. 2-18
2.6.2.6.4 Air Content: The modification factors corresponding with air content are:
Creep 'Ya. = 0.46 + 0.09a 'Ya. > 1.0
Shrinkage 'Ya. = 0.95 + 0.008a where a is the air content in percent.
Eq. 2-19
Eq. 2-20

12

3.1 INTRODUCTION
CHAPTER3
TEST PROGRAM
A test program was implemented to determine the creep and shrinkage properties of the high performance concrete used for the Louetta Road Overpass project. Creep tests were conducted on high performance concrete specimens over a period of 120 days. Shrinkage tests were conducted in parallel. This chapter contains detailed information concerning the test program as well as information on the materials and procedures that were used.
3.2 CONCRETE MIX DESIGN
The concrete used in this testing procedure is the high performance concrete mix used by Texas Concrete Company in the high strength prestressed beams that were cast for the Louetta Road Overpass project. The required compressive strength at transfer for this concrete is 68 MPa. The required 56-day compressive strength for this concrete is 90 MPa. Table 3.1 gives the details of this mix design.
Table 3.1 Mix design
Material Description Producer Cement 1131
kg/m3 Type III Capitol Cement Co.
Fly Ash 533 3 Deely Type "B" Deely Fly Ash Co. (Class C) kg/m (ASTM Cl. C*)
Fine Aggregate 1829 3 The Fordyce Co. (Natural) kg/m
Coarse Aggregate 3233 kglm
3 1-1/4 em Crushed Pioneer Concrete Co. Limestone
Water 322 kgtm
3 City of Victoria
Retarder 1.04 Lim 3 Pozzollith 300R Master Builders
HRWR 6.89 Lim
3 Rheobuild 1000 Master Builders
*With additional requirements per TxDOT's Departmental Materials Specification D-9-8900.
3.3 CURING PROCEDURE
Owing to the geometry of the high strength prestressed beams being used in the Louetta Road Overpass project, the curing temperature experienced by the high performance concrete varied throughout the beam. Massive endblocks and thin webs caused temperature variation during the hydration of the concrete. The following test procedure does not follow the exact differences in curing temperature recorded in the beams. This portion of the
13

14
experiment is limited to the minor differential temperature experienced by the specimens as a result of two different curing methods.
In order to study the effect of differences in curing temperature on the creep and shrinkage properties of the high performance concrete, two sets of specimens were made. The first set of specimens was wrapped in plastic but was otherwise left exposed to ambient temperatures in the laboratory. The resulting curing temperatures that the high performance concrete experienced can be seen in Figure 3 .1.
35
30
10
5
0~-----+------~------~-----r----~+======+~==~~ 0.00 2.00 4.00 6.00 8.00 10.00 12.00 14.00
Time (hours)
Figure 3.1 Temperature history for low-temperature-cured specimens
The second set of specimens was placed next to high performance concrete beams that had been poured the same day. The beams and the specimens were insulated to allow their temperatures to remain high throughout the curing time. The curing temperatures experienced by the second set of high performance concrete specimens are illustrated in Figure 3.2. This second curing procedure was used in order to best mimic the curing conditions of the concrete in the webs and bottom flange of the high performance concrete beams.
3.4 TEST PROCEDURES
The scope of this research project was to study the effects of curing temperature, age at loading, and level of stress on the creep and shrinkage of high performance concrete. In order to accomplish this, an intricate testing program needed to be devised. To determine the effects of curing temperature on the creep and shrinkage of high performance concrete, two sets of specimens were created, as mentioned above. Each of these was cured at different temperatures. An identical group of tests, described below, would be run on each set of specimens.

15
A factor that greatly affects creep is the age of the concrete at loading. In order to determine the effects of this factor, creep cylinders were loaded to the same stress level on 1, 2, and 28 days after casting. Differing sustained stress levels also have an effect on the creep of concrete. Three different levels of sustained stress were used- 6.9, 20.7, and 34.5 MPa - to determine this effect.
20
10
o+.---~---4-----~r-----4------+-----~----~
0 2 4 6 8 10 12 14
Time (hours)
Figure 3.2 Temperature history for high-temperature-cured specimens
To keep track of what specimen was being tested for what purpose, a coding system was used. The first portion of the code tells what the specimen is being subjected to: C stands for creep, S stands for shrinkage, T stands for temperature. The next portion of the code tells what stress is placed on the specimen in pound per square inch. The third portion of the code tells what age, in days, the concrete was when it was loaded. The final portion of the code tells how the concrete was cured. For an example, one of the specimens would be labeled CST-3000-28-HT. This specimen is being subjected to creep, shrinkage, temperature, and a stress of 20.7 MPa, or 3,000 pounds per square inch. The specimen was cured at higher temperatures and was loaded when it was 28 days old. An example of another type oflabel is ST-10-HT. This specimen is subjected to shrinkage and temperature, has no load applied, and is in the high-temperature-cured specimen group. In the case of shrinkage specimens, the number, 10 in this example, is a specimen designation, since there is no other way to tell the shrinkage specimens apart.
3.4.1 Specimen Preparation
To avoid complications with loading three 100-mm-by-200-mm cylinders stacked one on top of another, a 100-mm-by-600-mm specimen was used. These specimens would decrease eccentricities in loading and enhance the stability of the specimens in the creep

16
racks. In order to form the 600-mm-long specimens, 100-mm (4-in.) ID PVC pipe was used. The pipe was cut to length and placed in a rack that was designed to hold twenty forms. The bottom ends of the pipe were plugged with aluminum disks to keep the concrete in place during curing.
Once the specimen had been cured for about 14 hours, the PVC pipe was cut off using a hand grinder. The ends of the specimens were capped with a sulfur capping compound. This was done to ensure an even transfer of load from the steel plates of the creep rack to the specimen.
In order to record the strains of the specimens, a mechanical strain-measuring device, known as a Demec gauge, was used. This device and its use are described in Section 3.4.4. In order to use the Demec gauge a series of fifteen Demec points were affixed to three sides of each cylinder at 120-degree intervals. Each set of five points was placed parallel to the longitudinal axis at each of the 120-degree intervals so that three readings could be taken for each side of the specimen (see Figure 3.3).
Height 600mm
Diameter
Demec points
Gauge length (200 mm)
Figure 3.3 Demec point layout

17
3.4.2 Creep Tests
Eighteen of the 600-mm-long cylinders were used for creep testing. Each cylinder was placed in a creep rack, as shown in Figure 3.4. A predetermined load was applied to the specimen through the use of a hydraulic ram. The load was sustained by springs that were situated between the bottom two plates. As the specimen length decreased owing to creep and shrinkage, the springs elongated, maintaining the load. The spring constant had been determined earlier so that by measuring the elongation of the springs, the amount of load lost could be calculated. When the loss in load was 2% of the predetermined load, the hydraulic ram was replaced into the system and the load was brought back up to the required level. This creep test procedure conforms to ASTM C512, "Standard Test Method for Creep of Concrete in Compression" (12).
pump
hydraulic ram
,......_ _ __.........___......,-----bearing plate
a:::=----- railroad spring
SECTION A-A SECTION B-B
Figure 3.4 Continuous load creep rack
3.4.3 Shrinkage Tests
In this test procedure, temperature and relative humidity were not controlled. Therefore, what are called shrinkage specimens for this test are actually unloaded specimens that experienced temperature and relative humidity effects as well as shrinkage effects. This

18
is important later in the comparisons of results, where the temperature and humidity were measured as data were recorded but were not controlled values. The same 600-mm specimens used in the creep tests were also used for the shrinkage tests. These specimens had Demec points affixed in a manner similar to that used for the creep specimens. Strains resulting from shrinkage and temperature were measured using the same system described in Section 3.4.4. The specimens were exposed to the same environmental conditions as were the creep specimens, so that the temperature and relative humidity effects would be the same for both creep and shrinkage specimens. Therefore, when the average shrinkage specimen strains were subtracted from the creep specimen strains, the temperature and relative humidity effect would be removed from the creep data.
3.4.4 Measurement of Strains
The strains of all the specimens were measured using a Demec gauge with a 200 mm gauge length, as shown in Figure 3.3. The Demec gauge has a dial gauge mounted on a frame with a gauge length of approximately 200 mm. This device measures the strain in the specimen directly. In order to obtain an average strain for a specific specimen, a series of strains were measured and then averaged. Strain measurements were taken on three sides of each specimen. Three readings were taken from each side. The nine readings were then averaged, giving the average strain for the specimen.
Nine initial readings were taken for each specimen using the Demec gauge. These readings were then averaged and the average reading was considered the zero mark (or baseline). As time progressed, average Demec readings were recorded. To determine the average strain at a particular day, the difference between the average Demec reading for that day and the initial average Demec reading was determined. This difference was then multiplied by the gauge factor, in this case 8.1, resulting in the average strain.
To keep eccentricities in the axial load to a minimum, the average strain for each of the three sides were determined and compared. Since it is impossible to load without any eccentricities, the object was to keep them as small as possible. Periodically, the measured strains would be plotted. If the eccentricities in the strains seemed to be large, then on the next reloading for that specimen a correction would be made. This would be accomplished by placing the loading ram slightly off center in the direction of the lower strains.
3.4.5 Strength Tests
Strength tests of the high performance concrete were conducted for the hightemperature-cured and the low-temperature-cured specimens. Cylinders with 100 mm diameters and 200 mm lengths were used to determine strength and modulus of elasticity over the course of the 120-day creep test. Specimens were tested at 1, 2, 3, 5, 7, 14, 28, 56, and 120 days. The data obtained from the strength tests were not used as a part of this report but were recorded for others to use in the overall test program.

CHAPTER4
PRESENTATION OF TEST RESULTS
4.1 INTRODUCTION
The results of this study are found in this chapter. The data from the strength and modulus tests are presented in graphical form. The measured strains taken from the shrinkage specimens are plotted. Two types of creep data - creep coefficient and specific creep - are also presented in graphical form. More specific data not presented in this chapter can be found in the appendices.
4.2 STRENGTH AND MODULUS OF ELASTICITY
Strength and modulus tests were conducted on the 100-mm-by-200-mm cylinders. These tests were made at 1, 2, 3, 5, 7, 14, 28, 56, and 120 days. The results of these tests are shown in Figure 4.1 and Figure 4.2. Note that the strength gain for the high-temperaturecured specimens is faster than that for the low-temperature-cured specimens although the ultimate compressive strength of the high-temperature-cured concrete is lower.
100
80
70
'i ro
6 50 u .... 40
30
2D
10
0
0 2D 40 ro 80 100 120
Tnre(days)
Figure 4.1 Strength vs. time plot for high performance concrete mixes
4.3 SHRINKAGE
As discussed in Chapter 3, the shrinkage strains were measured from the unloaded specimens. Although the strains that these specimens were subjected to were affected by shrinkage, temperature, and relative humidity, they will be considered as shrinkage strains for this study. The measured strain versus time plots for each of the unloaded specimens
19

20
(shrinkage specimens) can be found in Appendix A. The average shrinkage strain versus time plots for the low-temperature-cured and high-temperature-cured specimens are shown in Figure 4.3. Note that the strains for each of the curing temperatures are noticeably different.
45 ~
40 v 35
30
~ 25
6 20 ~
15
10 -+-low Tet"fllEll'l!lUr Cured Spedrmns
5
0 l --High T et"fllEll'l!1Ur Cured Specirmns
0 20 40 80 100 120
TIIIl: (days)
Figure 4.2 Modulus of elasticity vs. time plot for high performance concrete mixes
·~ .b :g .. ~
4~
400
350
:ro
250
::ro
~ -+-LoNTerperab..re Q.n:d ~rnns ········~
_ _._ HgJ Terperab..re Q.n:d ~rnns . 0~--~~~--~~~-----+======~======~====~
0 40 ro
Ture(~)
100
Figure 4.3 Average strain of unloaded specimens

21
4.4 CREEP
The strains occurring in the loaded specimens were measured as discussed in Chapter 3. The total strain measured for each specimen is the combination of elastic strain and the strains resulting from creep, shrinkage, and temperature. In order to determine the creep strain, the shrinkage and temperature strains were subtracted from the total strain. This corrected the measured creep data to remove the shrinkage and temperature effect that is included in the creep strain raw data. The results of this process can be seen in the individual measured strain versus time plots for each of the creep specimens. These plots are for the measured data and they are located in Appendix A. No elastic strain was subtracted out of the creep strain raw data, as the elastic strain is a separate calculation that is performed independently of shrinkage and creep strain measurements. The creep coefficient, used later, is the ratio of the creep strain to the elastic strain.
As also stated in Chapter 3, an attempt was made to control the eccentricities of the axial load applied to the creep specimens. Since it is physically impossible to have zero eccentricity in an axially applied load, the correction procedures also described in Chapter 3 were required. Figure 4.4 shows a typical relationship between the average strains on each side of a loaded cylinder. Figure 4.5 shows the worst case that was encountered for the LT series. The same influence of eccentricity is noted for specimens in the HT series (see Figures B.6, B.7, and B.8). A plot for each specimen tested is located in Appendix B.
There are two measures of creep that will be examined. The first is the creep coefficient. This is obtained by taking the creep strain and dividing by the elastic strain. The creep coefficient for each of the creep specimens has been determined and plotted in Figure 4.6 through Figure 4.11. The second measure of creep that will be examined is the specific creep. This is the creep strain divided by the applied axial stress. The specific creep for each creep specimen has been plotted in Figure 4.12 through Figure 4.17.

22
200}
1800
1600
1400
·~ 1200
= "' loo:l e ~ 800
600
400
200
0
0 20 40 ro
Ture(days)
80 100 120
Figure 4.4 Average measured strain on each side of loaded cylinder - Typical case
CST -3000-1-HT
700
600
500
"' '<ij 400 til 0 tl ~300
200
100
0
0 20 40 ro
Ture(days)
80 100 120
Figure 4.5 Average measured strain on each side of loaded cylinder - Worst case CST-
1000-28-LT

1.80
1.00
1.40
= 1.20 ·M E 1.00 " 0
~ 0.80 ~ u o.oo
0.40
0.20
0.00
0 20 40 oo
Ture(days)
80
I -+-1;~~ • -ll-2day I L _._28day I
100
23
120
Figure 4.6 Creep coefficient - lligh-temperature-cured specimens loaded to 6.9 MPa
1.80
1.00
1.40
·~ 1.20
E 1.00 ·
8 "'0.80 ~ u o.oo
0.40
0.20
0.00
0 20 40 oo 80 100 120 140
Ture(days)
Figure 4. 7 Creep coefficient - lligh-temperature-cured specimens loaded to 20.7 MPa

24
1.80
1.60
1.40
" 1.20 " ·;:;
i:E 1.00 " 0
~0.80 " " u 0.60
0.40
0.20
0.00
0 20 40 60 80 100 120 140
Ture (days)
Figure 4.8 Creep coefficient - High-temperature-cured specimens loaded to 34.5 MPa
1.80
1.60
1.40
t: 1.20 " ·;:; i5 1.00 g u
0.80 Q.
" ~ u 0.60
0.40 -+-1 day
0.20 -ll-2day
--.-28day 0.00
0 20 40 60 80 100 120
Ture(days)
Figure 4.9 Creep coefficient- Low-temperature-cured specimens loaded to 6.9 MPa

25
1.80
1.ro
1.40
" 1.20 ·~ !6 1.00 " 0
~O.&l " !:l u o.ro
0.40
0.20
0.00
0
Ture(days)
Figure 4.10 Creep coefficient -Low-temperature-cured specimens loaded to 20.7 MPa
1.80
I.ro
1.40
1.20
-~ 1.00 " !6 8 O.&l u Q.
" o.ro !:l u 0.40
0.20
0.00
-D.20
'I'i:rre (days)
Figure 4.11 Creep coefficient- Low-temperature-cured specimens loaded to 34.5 MPa

26
0.04
0.005
'2 p.. O.Q3
] 0.025 l;!
8 .;,: 5
0.02
0. 0.015 ~ u
0.01 <.> :!3 & 0.005
"' 0
-{).005
Tnre(days)
Figure 4.12 Specific creep -High-temperature-cured specimens loaded to 6.9 MPa
0.04
0.035
'2 0.03
~ 0.025 ~ 8
0.02 ! c. 0.0!5 "' 1l u
O.ol " t;::
l 0.005
"' 0
-0.005
Tnre (days)
Figure 4.13 Specific creep- High-temperature-cured specimens loaded to 20.7 MPa

0.<»
0.035
~ 1 0.03
1;l 0.025
-~ 0.02 g 8' 0.015 a u O.oi
u:: ·c; [ 0.005 til
0
-D.005
27
Tmx:(days)
Figure 4.14 Specific creep -High-temperature-cured specimens loaded to 34.5 MPa
0.~
0.035
~
1 0.03
l:l 0.025
8 ~ 0.02
0. O.Ql5 Q
e u 0.01 u
!B a 0.005 til
0
-D.005
Tmx:(days)
Figure 4.15 Specific creep- Low-temperature-cured specimens loaded to 6.9 MPa

28
0.04
0.035 '2
~ 0.00
~ 0.025
l 0.02 c..
~ 0.015 <.>
u:: o.m ·;:; &
<t.> OJXJ5
0
0
Tllll.l(days)
Figure 4.16 Specific creep - Low-temperature-cured specimens loaded to 20.7 MPa
0.04
0.035
'2 0.03
~ .,. 0.025
~ 0
l c.. 0.015 . ~ u
..g 0.01
·g 0.005 c..
<l.l
0
-0.005
Tllll.l(days)
Figure 4.17 Specific creep - Low-temperature-cured specimens loaded to 34.5 MPa

5.1 INTRODUCTION
CHAPTERS
DISCUSSION OF TEST RESLTL TS
The results of the experiment are analyzed and discussed in this chapter. The effects of the variables - curing temperature, age at loading, and stress level - on creep and shrinkage are examined. Ultimate creep and shrinkage values for the material are determined using the measured data. The creep and shrinkage results are also compared with ACI Committee 209 prediction equations.
5.2 SHRINKAGE RESULTS
The following is a discussion of the results of the shrinkage tests run on the high performance concrete used in this study. The average strains measured from the unloaded specimens for the high-temperature-cured and low-temperature-cured specimen groups were used to determine the effects of curing temperature on the shrinkage of the high performance concrete. The average strains were also compared to the ACI predictions and modified ACI predictions.
5.2.1 Effect of Curing Temperature on Shrinkage
The amount of shrinkage occurring in concrete is affected by the type of curing that is used. As discussed in Chapter 2, the higher the curing temperature, the faster the hydration of the concrete. This means that less shrinkage can be expected to occur in specimens that have been cured at higher temperatures.
The average total strains for the two sets of shrinkage specimens can be seen in Figure 4.3. The high-temperature-cured specimens have a 120-day shrinkage of approximately 400 microstrains, while the low-temperature-cured specimens have a 120-day shrinkage of approximately 250 microstrains. These results do not support the conclusions made in Chapter 2.
The most likely reason for this occurrence comes from the environment in which the specimens were kept Since this environment was not controlled, the temperature and relative humidities that the specimens were subject to varied. The high-temperature cure tests also did not run simultaneously with the low temperature cure tests. The average ambient temperatures for the high temperature cure and low-temperature cure tests were 29.7° C (85.5°F) and 28°C (82.3°F), respectively. The relative humidities for the two tests were 55.4% and 60.5%, respectively. This higher temperature and lower humidity would naturally cause more shrinkage for the high temperature cured specimens as noted in Figure 4.3.
29

30
5.2.2 Comparison of Shrinkage Results and ACI Predictions
When designing with concrete it is important to know the long-term deformations. Having the ability to make a viable estimate of the total shrinkage of the concrete is one step toward determining the long-term deformations. Section 2.6 described the ACI Committee 209 procedure for determining the shrinkage of concrete. Since high performance concrete of this type was never part of the data used by ACI Committee 209 to create their procedures, it is doubtful that they can be applied.
In order to determine the usefulness of the ACI procedures for predicting the shrinkage strains of this high performance concrete, the measured shrinkage strains were compared to strains predicted using the recommendations of ACI Committee 209. The first comparison will be with a standard prediction. In order to get these values, the ACI recommendations were followed as explained in Chapter 2. The conditions that affect shrinkage, along with the adjustment factors to be applied to the ultimate shrinkage values, are shown in Table 5.1. Although this process was never expected to yield extremely accurate predictions, the amount of error in these predictions was of interest.
The results of this prediction can be seen in Figure 5.1 and Figure 5 .2. The predicted ultimate shrinkage for the high-temperature-cured and low-temperature-cured specimens, following ACI Committee 209 (shown as ACI Equation), are 829 and 779 microstrain, respectively. The predicted strain versus time plots were created using the predicted ultimate shrinkage and Equation 2.4. The shrinkage at 120 days from the ACI Equation was shown in Figure 2.2. to be approximately 75% of the ultimate shrinkage value. As seen in the figures, this prediction results in values 63% and 131% larger than those actually measured at 120 days for the high-temperature-cured and low-temperature-cured specimens, respectively.
Table 5.1 Adjustment factors for prediction of shrinkage using ACI Committee 209
predictions
Factor affecting shrinkage High-Temperature Low-Temperature
Cured Cured
RH= 55.4% RH=60.5%
Initial moist curing, 1 day 1.2 1.2
Relative humidity 0.85 0.80
Volume-to-surface ratio = 1 1.19 1.19
Slump= 150 mm 1.136 1.136
Fine aggregate percentage = 36% 0.806 0.806 3
Cement factor= 398 kg/m' 0.992 0.992
Air content = 2% 0.966 0.966

700
600
500
·~400 l:J
~ ·s:m
200
100
0
0 20 40 60
Tim';! (days)
Measured Shrinkage
-11- Mldified ACI Equation
-+-ACI
80 100 120
Figure 5.1 Average measured shrinkage strains and predicted shrinkage strains: High-temperature-cured specimens
700
tro
500
= •<;~ 400 l:J "' e " 3(X) ·s
200
100 [;-
... ACIM:xlified~
-11- Averat;p Measured Strains I -+-ACI uation !
. ~·~~~··-~.~ Q.
0 20 40 80 100 120
Figure 5.2 Average measured shrinkage strains and predicted shrinkage strains: Low-temperature-cured specimens
31
To obtain a more accurate prediction of the ultimate shrinkage strains, a curve-fitting process was used to match the prediction equation with the measured values. Predicted values were calculated for times corresponding to measured values. The error between these values was determined and squared. This error value was then multiplied by the time, in days, squared. This procedure makes points with larger time values have a larger impact on the

32
predicted time function, which was important because the slopes at 120 days for the two plots need to match in order to obtain an accurate prediction of the ultimate shrinkage strain. The sum of the error values was then determined.
In Equation 2-2 there are three variables,/, a, and (t:sh)w that can be altered to change
the shape of the curve. To simplify the curve-fitting process, only f and ( Esh)u were altered,
leaving a equal to 1 as in Equation 2-4 and Equation 2-5. To determine the best fit, a value for f was estimated. Values for ( Esh)u were then plugged into the equation until the error value
for the curve was minimized. The error value corresponding to that f and ( t:8h)u was recorded.
The value off was then changed and the whole process was repeated until the combination of f and ( Esh)u having the smallest error value was found.
The best-fit predictions are plotted in Figure 5.1 and Figure 5.2 and are noted to be "ACI-Modified Equation." In order to use these functions to predict a value for (t:sh)w an
assumption must be made that the behavior of the specimens will continue to follow the trends observed during the first 120 days of recorded data. Under this assumption, the best-fit predictions yield values that are considered to be the best estimate of ( t:sh)u for the specimens.
The f and (t:sh)u values are given in Table 5.2 and Table 5.3 as Best Fit 1 Prediction. Also in
Tables 5.2 and 5.3 are curve-fitted values of (t:sh)u that correspond to f equal to 35. These are
referred to as Best Fit 2 Predictions and are not plotted in either Figure 5.1 or 5.2. These data are presented in order to show what value of (t:sh)u would be obtained using this curve-fitting
process if only ( Esh)u were varied. The reason this specific prediction was not plotted is that it
is only a best fit, not the best fit.
Table 5.2 Comparison of ACI predicted and best-fit values for shrinkage: High-temperature-cured specimens
f (Esh)u ACI Prediction 35 829
Best Fit 1 Prediction 19 450 Best Fit 2 Prediction 35 520
Table 5.3 Comparison of ACI predicted and best-fit values for shrinkage: Low-temperature-cured specimens
f (Esh)u
ACI Prediction 35 779 Best Fit 1 Prediction 3 276 Best Fit 2 Prediction 35 505

33
As stated above, the ACI prediction overestimates the 120-day shrinkage strains by 63% and 131% for the high-temperature-cured and low-temperature-cured specimens, respectively. Using the predictions above, the best estimate of (esh)u is approximately 450 microstrains for the high-temperature-cured specimens and 276 microstrains for the lowtemperature-cured specimens. Using these predicted ultimate values shows that approximately 90% of the shrinkage strain takes place in the first four months. The data in Tables 5.2 and 5.3 show that the ACI prediction of (esh)u is 84% higher (829/450=1.84) for the high temperature cured specimens and 184% higher (779/276=2.82) for the lowtemperature-cured specimens. Curve fitting Equation 2-4 results in overestimating the ultimate shrinkage strains by 16% for the high-temperature-cured specimens (520/450=1.16) and 83% for the low-temperature-cured specimens (505/276=1.83).
These results support the idea that modifying Equation 2-4 is the best way to predict the ultimate shrinkage strains for this high performance concrete. Simply applying a curve fitting process will not give accurate values of ( esh)u. When attempting to predict the shrinkage strains of other high performance concretes having high compressive strengths, the values off and ( esh)u used in Equation 2-4 should be reduced. Since there is still little data regarding these types of concretes, the exact amount of reduction is unknown.
5.3 CREEP RESULTS
The following is a discussion of the results of the creep tests of the high performance concrete used in this study. In order to make comparisons of the creep data, the 92-day measured values for the specimens loaded at 1 and 2 days were used. These values could then be compared to the 120-day measured values of the specimens loaded at 28 days, which were under load for 92 days. Most of the comparisons use the measured creep coefficients, as defined in Section 2.6.1. These comparisons are used to determine the effects of curing temperature on creep, the effect of age at loading on creep, and the effect of the level of stress on creep. Comparisons of the measured creep data are also made with ACI predictions and modifications of the ACI predictions.
5.3.1 Effect of Curing Temperature on Creep
The temperature at which concrete is cured has an effect on the creep of the concrete. As shown in Chapter 2, higher curing temperatures will cause normal strength concrete to have less creep. Considering the effect of curing temperature on the creep of concrete is important in this study because there is some curing temperature variation throughout the prestressed beams being constructed with this high performance concrete.
The 92-day creep coefficients for the high-temperature-cured and low-temperaturecured concretes are shown in Tables 5.4 and 5.5, respectively. These data show that lowtemperature-cured specimens had a 92-day creep coefficient of 1.13, which is lower than the average 92-day creep coefficient of 1.15 for the high-temperature-cured specimens. These results are contradictory to what was expected. As with the shrinkage results, this

34
discrepancy is most likely related to the environmental differences experienced by the two groups of specimens.
The 92-day values for creep coefficients at the individual stress levels for lowtemperature specimens (Table 5.5) are consistently lower than the corresponding values in the high-temperature specimens (Table 5.4). The average values reflect this trend, as noted above.
Table 5.4 Creep coefficients recorded at 92 days:
High-temperature-cured specimens
Stress Level Loading Time 1 day 2 days 28 days
6895 kPa 1.57 1.45 0.94 20685 kPa 1.19 1.19 0.64 34475 kPa 1.37 1.29 0.66
Average Creep Coefficient 1.38 1.31 0.75 Overall Average 1.15
Table 5.5 Creep coefficients recorded at 92 days:
Low-temperature-cured specimens
Stress Level Loading Time 1 day 2days 28 days
6895 kPa 1.54 1.44 0.81 20685 kPa 1.05 1.40 0.64 34475 kPa 1.24 I 1.44 0.68
Average Creep Coefficient 1.30 1.38 0.71 Overall Average 1.13
5.3.2 Effect of Age at Loading on Creep
As described in Chapter 2, the earlier a specimen is loaded, the greater the creep that will occur. This is very important in the area of prestressing because transfer usually occurs within 24 hours. Because of this early loading, the concrete can be subject to very high creep strains. Multiple loading stages need to be taken into account because loads applied later in the life of the concrete will cause less creep.
The 92 day creep coefficients presented in Table 5.4 and 5.5 support this theory. The high-temperature-cured specimens loaded at two days showed a 5% decrease in creep from those loaded at one day. The specimens loaded at 28 days showed a 36% decrease. The lowtemperature specimens loaded at two days showed an anomalous increase in creep of 6.5% from those loaded at one day, while the specimens loaded at 28 days experienced a 45%

35
decrease in creep. These trends for the individual specimens can be seen in Figures 4.6 through 4.17.
5.3.3 Effect of Stress Level on Creep
The relationship between stress and creep is well established for normal strength concrete. There is a linear relationship between creep strain and the level of stress for stresses up to about 60% of ultimate. This means that a stress level equal to 60% off' c will cause twice as much creep as a stress level equal to 30% off' c. The stress levels used in this study were not high enough to determine the extent of the linear relationship for this high performance concrete. However, confirming the linearity of the relationship in the lower stress ranges was possible. As seen in Figure 5.3, the relationship between the creep strain and the level of stress is nearly linear up to loading at a maximum of about 0.4 f'c. Since no tests were made at levels higher than 0.4 f'c, the study did not explore the limit of linearity. It appears to be above this value, but the 0.4 f' c level was the limit of test loadings in this study.
IOOJ
900
800 c ·~ 700
g 000 .;!
6 500 ·~ .b 400 Vl 0.
E 300 u 200
100
0
0 0.05 0.1 0.15 0.2 0.25 0.3 0.35 0.4
Stress Level (%fc)
Figure 5.3 Creep strain at 92 days vs. level of stress
Another relation between creep and stress is the specific creep. Specific creep is defined as the creep strain per unit of sustained stress. The specific creeps recorded at 92 days for the high-temperature-cured and low-temperature-cured specimens are summarized in Table 5.6 and 5.7. The specific creep for specimens loaded at 1 and 2 days is approximately 0.03 microstrain/k:Pa (~a), while the specific creep for the specimens loaded at 28 days is much lower, at approximately 0.017 ~a. This descrease of approximately 40% is due to

36
the fact that the specimens loaded at 28 days experienced much less creep than those loaded earlier.
Table 5.6 Specific creep values (~Pa) recorded at 92 days:
High-temperature-cured specimens
Stress Level Loading Time 1 day 2 day 28 day
6895 k:Pa 0.036 0.032 0.023 20685 k:Pa 0.031 0.027 0.016 34475 k:Pa 0.032 0.032 0.019
Average Specific Creep 0.033 0.030 O.D19
Table 5.7 Specific creep values (~Pa) recorded at 92 days:
Low-temperature-cured specimens
Stress Level Loading Time 1 day 2 day 28 day
6895 k:Pa 0.034 0.030 0.015 20685 k:Pa 0.026 0.031 0.013 34475 k:Pa 0.029 I 0.035 0.014
Average Specific Creep 0.030 0.031 0.014
5.3.4 Comparison of Creep Results and ACI Predictions
As stated earlier, it is important to be able to predict the long-term deformations of concrete when designing prestressed concrete members. Making an estimate of the ultimate creep deformations is another step in determining the total long-term deformations. ACI Committee 209 has recommended a procedure for determining creep as described in Section 2.6. As with shrinkage, this procedure needs to be examined to determine if it is capable of predicting the ultimate creep of this high performance concrete.
The measured creep coefficients were compared with creep coefficients predicted using the ACI procedures. The first comparison was made with coefficients determined by following the procedure exactly as described in Chapter 2. The conditions that affect creep, along with the adjustment factors that were applied to the ultimate creep coefficient, are shown in Table 5.8. As with shrinkage, this process was not necessarily expected to yield extremely accurate results; nevertheless, the error was of interest.

Table 5.8 Values for prediction of creep coefficient using ACI Committee 209
predictions
Factor affecting shrinkage High Temperature Low Temperature Cured Cured
RH=55.4% RH= 60.5% Loading age 1 day 1.25 1.25
2day 1.15 1.15 28day 0.84 0.84
Relative humidity 0.90 0.86 Volume-to-surface ratio= I 1.40 1.40 Slump= 150 mm 1.22 1.22 Fine aggregate percentage = 36% 0.967 0.967 Air content = 2% 1.0 1.0
37
A predicted ultimate creep coefficient was determined for each loading age for each of the high-temperature-cured and low-temperature-cured specimen groups. These values can be found in Table 5.9. These ultimate creep coefficients were plugged into Equation 2-3 in order to create the plots in Figures 5.4 through 5.21. The ACI Equation notation refers to standard conditions as given in Table 2.1 on the basis of ACI Committee 209. A comparison of the predicted 120-day creep coefficients and the measured 120-day values was made. This comparison was made using only specimens loaded at 1 or 2 days. Specimens loaded at 28 days would not have 120-day values so they were not included. The predictions were an average of 84% higher for both the high-temperature-cured and low-temperature-cured specimens.
2.50
5 2.00 ·o
I ·~)~ u 1.00
0.50 .• -+-l\lleasured
_... Mx!ified ACI
......_ ACI 6 ualion 0.00 ·----+---...:..._;._,_ ____ -+---....6="'F~~~~'F==='----i
0 20 40 00
TII!ll (days)
80
Figure 5.4 Creep coefficient- CST-1000-1-LT
100 120

38
2.50
2.00
<! .:!:1 " 1.50
!E ... 0 u fr 1.00 e u
-+-Measured
0.50 --11-!Vodified ACI Equation
......_ ACI Equation
0.00
0 20 40 60 80 100 120
Tnre(days)
Figure 5.5 Creep coefficient- CST-1000-2-LT
1.80
1.60
1.40
;:; .£
1.20 u
15 1.00 g u
0.80 fr e u 0.00
0.40 -+-Measured
0.20 --11-!Vodified ACI Equation _._ACl ·on
0.00
0 20 40 80 100 120
Tnre(days)
Figure 5.6 Creep coefficient- CST-1000-28-LT

39
3.00.
2.50
l:! .!I
2.00
" IE 8 1.50 u .,. " 1:? u 1.00
! -+-Measured 0.50 -4-Mxlified ACI Equation
• -+-~1 Equation
0.00
0 20 40 60 80 100 120
Ttm::(days)
Figure 5.7 Creep coefficient- CST -3000-1-L T
250
2.00
.~ 1.50 " IE
8 u .,. " 1.00 c
0.50
~ ·············--·
! -+-Measu:.:::J • -4-Mxlified JlCI Equation
i -+- N::J. Equation ·~'--,---------,-----0.00
0 20 40 60 80 100 120
Ttm:: (days}
Figure 5.8 Creep coefficient- CST-3000-2-LT

40
1.80
1.60
1.40
i:! "
1.20 "<:l IE 1.00 g u
0.80 fr a 0.60
0.40 -+-Measured
0.20 ~ M:xified ACI Equation E
0.00
0 20 40 60 80 100 120
Ture(days)
Figure 5.9 Creep coefficient- CST -3000-28-LT
2.50
2.00
= 1.50 " "<:l
IE !! 1.00 u "" ~ -+-M:lasured u 0.50 -tt-~ M:xified ACl Equation
...,._. ACI Equation
0.00
ro so 100
-0.50
Ture(days)
Figure 5.10 Creep coefficient- CST-5000-2A-LT

2.00
5 ;g 1.50
8 u @' 1.00 d
0.50
~·
-+- M3asured
i -ill- Mxlified ACI Equation
I _..,_. ACI Equation~-~
0.00 .------+-----+-·-----l-----t-----+------1
0 20 40 80 100 120
TJme (days)
Figure 5.11 Creep coefficient- CST-5000-2B-LT
1.80
1.00
1.40
·~ 1.20
l5 LOO ' !! u 0.80 <
"" " I: u 0.00
0.40 -+-Measured
0.20 j -ill- Mxlified ACI Equation i _..,_. ~J;q!,Jation ....... .
0.00 <
0 20 40 80 100 120
TJme (days)
Figure 5.12 Creep coefficient- CST-5000-28-LT
41

42
3.00
2.50.
5 2.00 ·a 83 g 1.50 u ~ u 1.00 -+-Measured
-Ill- Mldified ACI Equation 0.50 -lr-ACI Equation
0.00
0 20 40 60 BO 100 120
Figure 5.13 Creep coefficient- CST -1000-1-HT
250
200
c " ~ 1.50 g u .,. " 1.00 d
0.50
0.00
0 20 40 ro 80 100 120
Ture(days)
Figure 5.14 Creep coefficient- CST-1000-2-HT

1.80
t.ro
1.40
= 1.20 () ·o
!.:::: 1.00 "'"' 8 u
0.80 ""' ~ u o.ro
0.40 ~·
0.20
0.00.
0
3.00
2.50
E 2.00
~ "' 1.50 0 u ""' ~ u 1.00
0.50
0.00
0
20 40
Ture(days)
GMea.sured--i ~ ACI Equation I ACigquation
80 100
Figure 5.15 Creep coefficient- CST-1000-28-HT
20 40 60
Thre(days)
j --Measured
I ----~ ACI Equation ~~ ACI Eq_,.uati_·on ___ __;
80 100
Figure 5.16 Creep coefficient- CST-3000-1-HT
43
120
120

44
2.50
2.00
1:! ·0 1.50 i:E 0 0 u @' 1.00 u
0.50
0.00
0 20 40 60
Titre (days)
--+--1\iBasured
-II-Mxilied ACI Equation
-+-ACI Equation
80 100
Figure 5.17 Creep coefficient- CST-3000-2-HT
120
1.80 ~------------------------·-·-·-·-~-,
1.60
1.40
§ 1.20 '<l e 1.00
8 0. 0.80
Ue
0.60
0.40 --+--1\iBasured
0.20 -II-Mxilied /!CI Equation -+-ACI Equation
0.00 ................. !IHHHHf---'---+---.:__--t.......:..---==t=====~===----1 0 20 40 80 100 120
TIID:l (days)
Figure 5.18 Creep coefficient- CST-5000-28-HT

45
3.00
2.50
" 2.00 -~ !S ...
1.50 0 u "'" ~ u 1.00
0.50
0.00
0 20 40 60 80 100 120
TIITl! (days)
Figure 5.19 Creep coefficient- CST-5000-1-HT
2.50
2.00
§ "tl 1.50 !S 8 u il' 1.00 e u
0.50
~- ~-l
-+-Measured ! -II- fl.b:lified ACI Equation
......_ ACI Equali~--~ 0.00
0 20 40 80 100 120
TIITl! (days)
Figure 5.20 Creep coefficient- CST-5000-2-HT

46
1.80
1.60
1.40
5 1.20
~ g 1.00
~ 0.80
~ 0.60
0.40
0.20
0 20 40 60 80 100 120
Tnne(days)
Figure 5.21 Creep coefficient- CST -5000-28-HT
To obtain a more accurate prediction of the ultimate creep coefficient, the same curve-fitting process used in Section 5.2.2 was implemented. In Equation 2-1 there are three variables, d, ¥J, Vw that can be altered to change the shape of the curve. In order to simplify the curve-fitting process, only d and Vu were altered. The value of 1jl was left equal to 0.6 as in Equation 2-3. Following the process described in Section 5.2.2, values of d and Vu were found for each of the creep specimens.
These best-fit predictions are plotted in Figures 5.4 through 5.21. As with shrinkage, an assumption is made that the behavior of the specimens will continue to follow the trends observed in the first 120 days of recorded data. Under this assumption, the best-fit predictions yield values that are considered to be the best estimate of Vu for the specimens. The d and Vu
values are given in Table 5.9 as Best Fit 1 Prediction. Also in Table 5.9 are curve-fitted values of Vu that correspond to d equal to 10. These are referred to as Best Fit 2 Predictions. These data are presented in order to show what value of Vu would be obtained using this curve fitting process if only Vu were varied. Again, the Best Fit 2 Prediction is not plotted because it is only a best fit, not the best fit.
As stated earlier, using the ACI prediction overestimates the 120-day creep coefficient by 84% for both the high-temperature-cured and low-temperature-cured specimens. Average values of Vu for the specimens loaded at 1 and 2 days and the specimens loaded at 28 days are 1.87 and 1.51, respectively. Using these predicted ultimate values shows that approximately 60% of the creep strain takes place in the first four months.

47
Table 5.9 Comparison of measured, predicted, and best-tit values of Vu
Best Fit 2
Specimen ACI Prediction Best Fit 1 d d=10
CST-1000-1-LT 4.07 2.05 I 5 2.58
CST-1000-2-LT 3.75 2.37 10 2.37
CST-1000-28-LT 2.75 1.31 8 1.44
CST-3000-1-LT 4.07 1.33 4 1.76
CST-3000-2-LT 3.75 1.86 5 2.34
CST-3000-28-LT 2.75 1.48
~ CST-5000-2A-LT 3.75 1.48
CST-5000-2B-LT 3.75 1.61 2
8
CST-5000-28-LT 2.75 1.18 11 1.13
CST -1000-1-HT 4.23 2.31 7 2.64
CST-1000-2-HT 3.90 2.41 [Jo 2.41
CST -1000-28-HT 2.85 2.40 18 1.77
CST-3000-1-HT 4.23 1.75 7 1.89
CST -3000-2-HT 3.90 1.65 6 2.10
CST -3000-28-HT 2.85 1.41 14 1.20
CST-5000-1-HT 4.23 1.84=R 2.3I
CST-5000-2-HT 3.90 1.81 6 2.16
CST-5000-28-HT 2.85 1.31 II 1.25
The data presented in Table 5.9 show that the ACI prediction overestimates Vu by an
average of 101% for the high-temperature-cured specimens and 122% for the lowtemperature-cured specimens. The data in Table 5.9 also show that curve fitting with Equation 2-3 overestimates the ultimate creep coefficient by an average of 5.4% for the hightemperature-cured specimens and 18.5% for the low-temperature-cured specimens. These values are slightly misleading because the prediction actually underestimated the ultimate values for the specimens loaded at 28 days.
The results from this study suggest that in order to accurately predict the behavior of the creep coefficient curve for high performance concretes with high compressive strengths, the values of d and Vu in Equation 2-3 need to be reduced. As with shrinkage, there is still
little data regarding these types of concretes; consequently, the exact amount of reduction for these variables is unknown.

48

6.1 SUMMARY
CHAPTER6
SUMMARY AND CONCLUSIONS
This study determined the creep and shrinkage properties of a high performance concrete with a compressive strength of approximately 90 MPa. The effects of curing temperature, age at loading, and stress level were examined. The recorded data were compared with predictions of creep and shrinkage values made using ACI Committee 209 procedures. The data were also used to make predictions of ultimate values for creep and shrinkage for this high performance concrete.
The testing process involved two sets of 100-mm-by-600-mm cylindrical specimens. Each set was cured at a different temperature. For each set of specimens, cylinders were placed in a continuous load creep rack. Loads of 6.9, 20.7, and 34.5 MPa were placed on the specimens at 1, 2, and 28 days. Companion shrinkage specimens were placed in the same environment as the creep specimens. Strains were measured using a Demec mechanical strain gauge up to 120 days after casting.
6.2 CONCLUSIONS
The following conclusions about the creep and shrinkage properties of high performance concrete with a compressive strength of 90 MPa were made:
1) Based on the data collected over 120 days and the best-fit curves used in this study, the ultimate shrinkage strain was, on average, 55% lower than what would have been expected for normal strength concrete based on the ACI Committee 209 report (11 ).
2) Based on the data collected over 120 days and on the best-fit curves used in this study, the ultimate creep coefficient was, on average, 60% lower than what would have been expected for normal strength concrete, based on the ACI Committee 209 report (11).
3) There is a linear relationship between creep strain and level of stress for stresses up to about 40% off' c.
4) A higher age at loading will result in less creep.
The following conclusions about creep and shrinkage properties of the specific concrete used in this study were made:
1) The best estimates of ( t:shJu are 450 microstrain for the high-temperature-cured specimens and 276 microstrains for the low-temperature-cured specimens.
49

50
Relative humidity during the testing period was 55.4% for high-temperature specimens and 60.5% for low-temperature specimens.
2) Specific creep values for the specimens loaded at 1 and 2 days were approximately 0.03 J!EikPa. Specific creep values for the specimens loaded at 28 days were 0.017 J!EikPa.
3) The average ultimate creep coefficient was 1.87 for specimens loaded at 1 and 2 days and 1.51 for specimens loaded at 28 days.

REFERENCES
1. Goodspeed, C. H., Vanikar, S., and Cook, R., Untitled memo "RE: Circulation of HPC Definition Version 1.0 Oct. 1995," University of New Hampshire, Durham, September 1995.
2. Barrios, A. 0., "Behavior of High Strength Concrete Pretensioned Girders during Transfer of Prestressing Forces," Master's Thesis, The University of Texas at Austin, May 1994.
3. Neville, A. M., Properties of Concrete, Pitman Publishing, Inc., Marshfield, Massachusetts, 1981.
4. Hanson, J. A., "Prestress Loss as Affected by Type of Curing," PC! Journal, Vol. 9, No. 2, April1964, pp. 69-93.
5. ACI Committee 517, "Low Pressure Steam Curing," ACI Report Title No. 60-48, American Concrete Institute, Detroit, 1963.
6. Swamy, R.N., and Anand, K. L.," Shrinkage and Creep Properties of High-Strength Structural Concrete," Civil Engineering and Public Works Review (London), Vol. 68, No. 80, October 1973, pp. 859-868.
7. Mindess, S., and Young, J. F., Concrete, Prentice-Hall, Inc., Englewood Cliffs, New Jersey, 1981.
7. Collins, T. M., "Proportioning High-Strength Concrete to Control Creep and Shrinkage," ACI Materials Journal, Vol. 86, No. 6, November/December 1989, pp. 576-580.
9. Smadi, M. M., Slate, F. 0., and Nilson, A. H., .. Shrinkage and Creep of High-, Medium-, and Low-Strength Concretes, Including Overloads," ACI Materials Journal, Vol. 84, No.3, May/June 1987, pp. 224-234.
10. Ngab, A. S., Nilson, A. H., and Slate, F. 0., "Shrinkage and Creep of High Strength Concrete," ACI Journal, Vol. 78, No.4, July/August 1981, pp. 255-261.
11. ACI Committee 209, "Prediction of Creep, Shrinkage, and Temperature Effects in Concrete Structures," Designing for Creep and Shrinkage in Concrete Structures, SP-76, American Concrete Institute, Detroit, 1971.
51

52
12. American Society for Testing and Materials, Annual Book of ASTM Standards, "Standard Test Method for Creep of Concrete in Compression," ASTM C512, 1987.
13. Sennour, M. L., and Carrasquillo, R. L., "Creep and Shrinkage Properties in Concrete Containing Fly Ash," Research Report 481-6, Center for Transportation Research, The University of Texas at Austin, November 1989.
14. El Hindy, E., Miao, B., Chaallal, 0., and Aitcin, P., "Drying Shrinkage of Ready-Mixed High-Performance Concrete," ACI Structural Journal, Vol. 91, No. 3, May/June 1994, pp. 300-305.
15. Nasser, K. W., and Al-Manaseer, A. A., "Creep of Concrete Containing Fly Ash and Superplasticizer at Different Stress/Strength Ratios," ACI Journal, VoL 83, No. 4, July/August 1986, pp. 668-673.
16. Russell, H. G., and Larson, S. C., "Thirteen Years of Deformations in Water Tower Place," ACI Structural Journal, Vol. 86, No. 2, March/April 1989, pp. 182-191.
17. Neville, A. M., in collaboration with W. Dilger, Creep of Concrete: Plain, Reinforced, and Prestressed, North Holland Publishing Company, Amsterdam, 1970.

APPENDIX A
MEASURED STRAINS
53

54
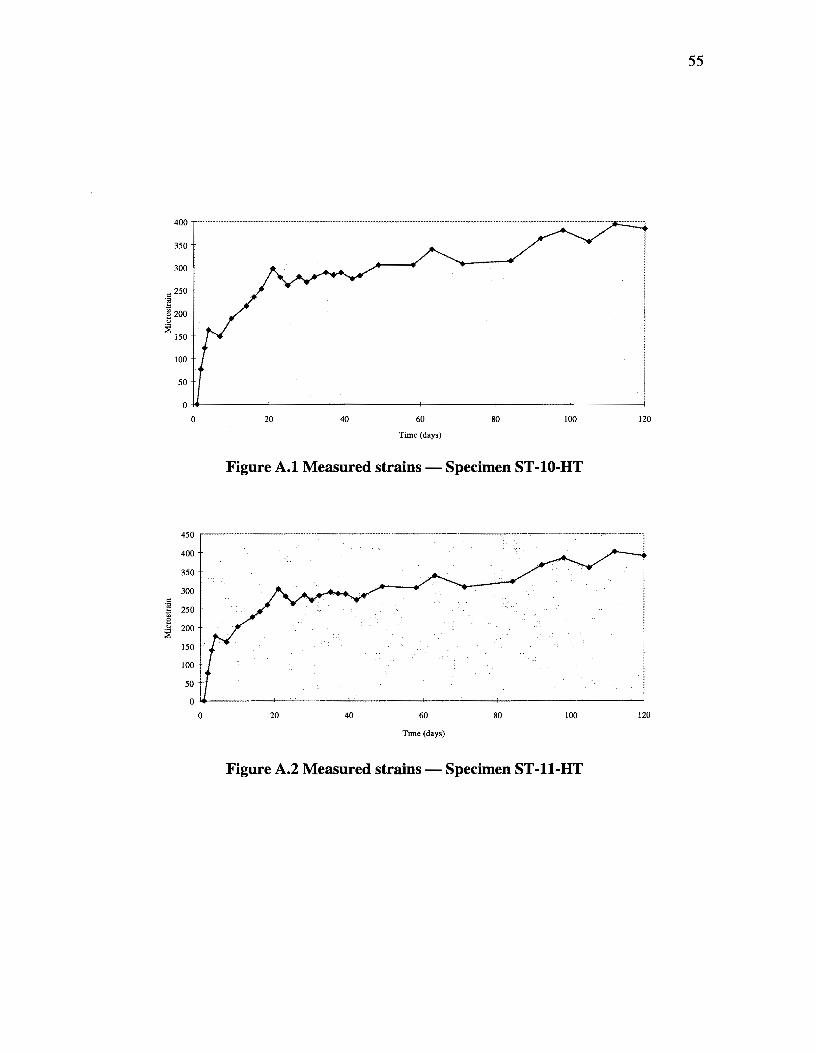
55
350
300
100
50
0~--------+---------~--------~-------------------+--------~
0 20 40 60 80 100 120
Time (days)
Figure A.l Measured strains- Specimen ST-10-HT
450
400
350
300
" -~ 250 e -~ 200 ::;;
150
100
50
20 40 60 80 100 120
Time (days)
Figure A.2 Measured strains - Specimen ST -11-HT

56
400
350
300
" 250 ... ~ 200
~ 150
100
so
0
0 20 40 60 80 100 120
Time (days)
Figure A.3 Measured strains - Specimen ST -12-HT
450
400
350
300 c ·;; !:> 250
-~ 200 ;:;: 150
100
50
0
0 20 40 60 80 100 120
Time (days)
Figure A.4 Measured strains- Specimen ST-14-HT

57
450
400
350
300
" "iii 250
~ ~ 200
150
100
50
0
0 20 40 60 80 100 120
Time (days)
Figure A.5 Measured strains- Specimen ST-15-HT
0 20 40 60 80 100 120
Time (days)
Figure A.6 Measured strains- Specimen ST-16-HT

58
300
250
200 c g e 150
~ 100
50
0
0 20 40 60 80 100 120
Time (days)
Figure A.7 Measured strains- Specimen ST-13-LT
300
250
200 c ·r; e 150 u jj
100
50
0
0 20 40 60 80 100 120
Time (days)
Figure A.8 Measured strains- Specimen ST-14-LT

59
300
250
200
" ·a ~ !50 <>
::;: 100
50
0
0 20 40 60 80 100 120
Time (days)
Figure A.9 Measured strains - Specimen ST -15-LT
300
250
200
" ·a !il
!50 8 -~ ::E
100
50
Time (days)
Figure A.10 Measured strains- Specimen ST-16-LT

60
900
800
700
600
·~ 500 e ~ 400
300
200
100
0
0 20 40 60 80 100 120
Time(days)
Figure A.11 Measured strains- Specimen CST-1000-1-HT
800
700
600
" 500 ·~
400 e .~ ::E
300
200
100
0
0 20 40 60 80 100 !20
Time (days)
Figure A.12 Measured strains- Specimen CST-1000-2-HT

61
700
600
500
" 400 ...
l:l
8 300
·" ::.; 200
100
0
60 80 100
Time (days)
Figure A.13 Measured strains- Specimen CST -1000-28-HT
1800
1600
1400
1200
·§ ~ 1000 e
.$< 800 ::.; 600
400
200 -+-Total Strain
-ti- Elastic and Creep Strain 0
0 20 40 60 80 100 120
Time (days)
Figure A.14 Measured strains- Specimen CST-3000-1-HT

62
1600
1400
1200
.g 1000
~ 800 0
~ 600
400
--Total Strain 200
--Elastic and Creep Strain
0
0 20 40 60 80 100 120
Time(days)
Figure A.15 Measured strains - Specimen CST ~3000~2-HT
1200
1000
800
" -~ 600
-~ 400 ::;;
200 --Total Strain
--Elastic and Creep Strain
0
60 80 100 ·200
Time (days)
Figure A.16 Measured strains -Specimen CST -3000-28-HT

63
2500
2000
~ 1500 ·~
.~ ::;: 1000
500 -+-Total Strain
-til- Elastic and Creep Strain 0
0 20 40 60 80 100 120
Time (days)
Figure A.17 Measured strains- Specimen CST-5000-1-HT
2500
2000
·~ 1500
~ 1000
500 L _;:::.Total Strain
-til- Elasti<;:"and Creep Strain
0
0 20 40 60 80 100 120
Time (days)
Figure A.18 Measured strains- Specimen CST-5000-2-HT

64
2000
1800
1600
1400
1200
" ·a !;; 1000 8
~ 800
600
400
200
0
-200
Time(days}
Figure A.19 Measured strains -Specimen CST -5000-28-HT
700
600
500
" ·~ 400
j 300
200
100 -+-Total Strain
-- Elastic and Creep Strain 0
0 20 60 80 100 120
Time(days}
Figure A.20 Measured strains- Specimen CST-1000-1-LT

65
700
600
500
" ';j 400 J;i 8 u
300 ::E
200
100
0
0 20 40 60 80 100 120
Time (days)
Figure A.21 Measured strains- Specimen CST-1000-2-LT
Time (days)
Figure A.22 Measured strains- Specimen CST-1000-28-LT

66
1400
1200
1000
" ·a 800 l:l
§ 600 ~
200
0
0 20 60 80 100 120
Time (days)
Figure A.23 Measured strains- Specimen CST-3000-1-LT
1400
1200
1000
" ·g 800
g 600 :i 400
200 --Total Strain
-R- Elastic and Creep Strain 0
0 20 60 80 100 120
Time (days)
Figure A.24 Measured strains- Specimen CST-3000-2-LT

67
1000
900
800
700
" 600 ·a
~ 500
::§ 400
300
200
100
60 80 100 120
Time (days)
Figure A.25 Measured strains- Specimen CST-3000-28-LT
2500
2000
1500
-~
~ 1000
" ::§
500
0
60
-500
Time (days)
Figure A.26 Measured strains- Specimen CST~S000-2A-LT

68
2500
2000
c: 1500 ·a b
8 ~ !000
500 --Total Strain --Elastic and Creep Strain
0
0 20 40 60 80 100 120
Time (days)
Figure A.27 Measured strains -Specimen CST -5000-28-LT
1600
1400
1200
1000
" .OJ 800 l:l
j 600
400
200
0
-200
Time (days)
Figure A.28 Measured strains- Specimen CST -5000-28-L T

APPENDIXB
AVERAGE STRAINS ON INDIVIDUAL SIDES OF
LOADED SPECIMENS
69

70

" ·g "' 0 t;
::E
" ·a iil 0
i
1200
100)
800
600
400
200
o· 0 40 ro 80 100
1200
100)
800
600
400
200
0
Tnre(days)
Figure B.1 Average strains on individual sides - Specimen
0 20
CST-1000-1-HT
40 ro
Ture(days)
80
· --sd;;1l -li-Side2 ! ........ Side3
100
Figure B.2 Average strains on individual sides - Specimen
CST -1000-2-HT
71
120
120

72
800
700
(ffi
" 500
"<;l .b
2400 ~
300
200
100
0
2DOO
1800
1<ffi
1400
" 1200 "<;l
tl 1000 8
~ 800
(ffi
400
200
0
0 40 ro
Ture(days)
80 100
Figure B.3 Average strains on individual sides - Specimen
CST-1000-28-HT
0 20 40 ro 80 100
Tnm(days)
Figure B.4 Average strains on individual sides- Specimen
CST-3000-1-HT
12£)
120

]80)
](ffl
1400
1200 0:: ·a ]!XX) til e ~ 80)
(ffl
400
200
0
]80)
](ffl
1400
1200 0:: ·a ]!XX) til 0 ... ~ 80J
(ffl
400
200
0
0 40 60
'Iiire (days)
......... Side3
80 100
Figure B.5 Average strains on individual sides - Specimen
CST -3000-2-HT
-+-Side 1
-i'I-Side2
......... Side3
0 40 60 80 100
Ture(days)
Figure B.6 Average strains on individual sides - Specimen
CST -3000-28-HT
73
12D
12D

74
4()))
3500
3(00
= 2500 1~ e20Xl ~
1500
100)
500
0
0 20 40
Tum (days)
Figure B. 7 Average strains on individual sides - Specimen
CST-5000-1-HT
3500 .... ········ ........................ . ..........................................................•..•. ., .......................................................................................................................... .
Figure B.S Average strains on individual sides - Specimen
CST -5000-2-HT

75
= 1500 "!<I lil 0 ... . :< :::E 100)
500 -+-Side 1
-II-Side2
-+-Side3 0
0 20 (j) 80 100 120
Ttrrr (days)
Figure B.9 Average strains on individual sides - Specimen
CST -5000-28-HT
800
700
(ffi
= 500 "!<I til
400 0 ts ~
300
200
100
0
0 20 40 (j) 80 100 120
T!Ill: (days)
Figure B.10 Average strains on individual sides- Specimen
CST-1000-1-LT
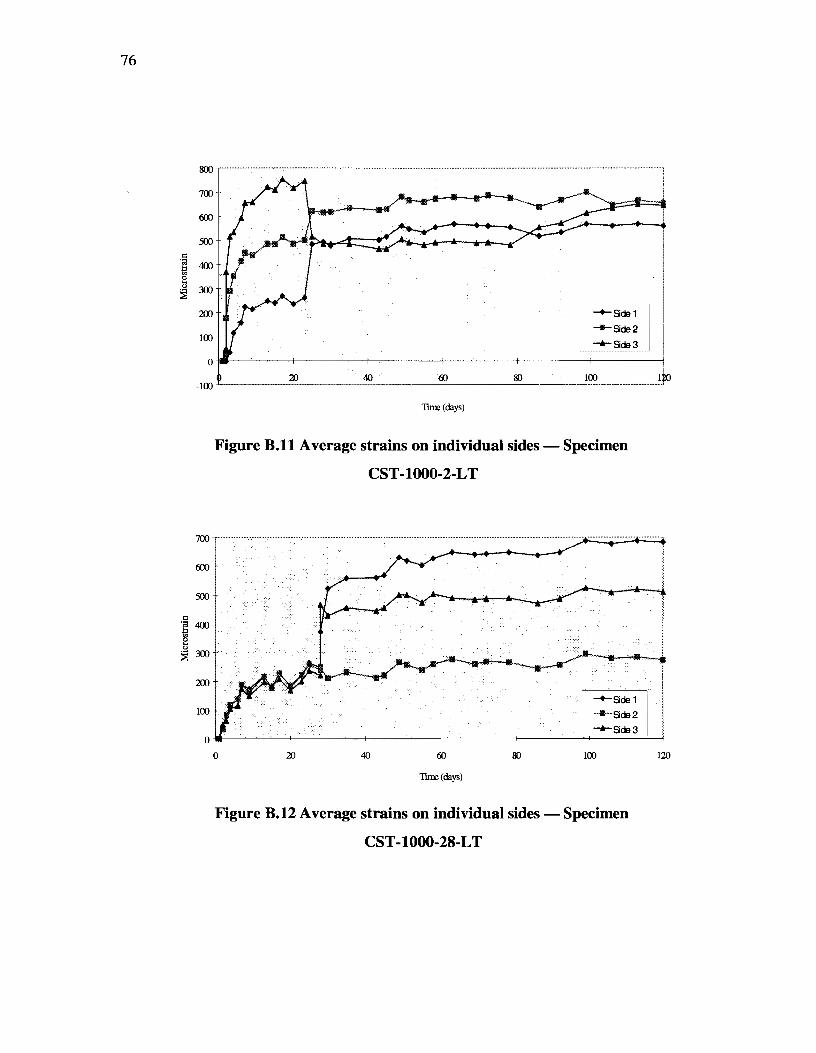
76
" ·a lil e 0
~
m
700•
!U)
500
400
300
200
100
0
-100
-+-Side1
--Side2 ..,.._Side3
40 100
Ture(days)
Figure B.ll Average strains on individual sides - Specimen
CST-1000-2-LT
Ture(days)
Figure B.12 Average strains on individual sides - Specimen
CST-1000-28-LT

= ·~ "' c ....
i
= ·a tl 0 !J
::E
ltffi
1400
1200
lUX)
800
(ill
400
200
2000
1800
1lill
1400
1200
lUX)
800
roo
400
200
0
0 40 ro
Ture(days}
-+-Side3
80 100
Figure B.13 Average strains on individual sides- Specimen
CST -3000-1-L T
--Side1
---Side2 -+-Side3
0 20 40 ro 80 100
TUIE(days}
Figure B.14 Average strains on individual sides - Specimen
CST-3000-2-LT
77
120
120

78
1200 .. . ........... .. .. . ... ............... ...... . .... ········ .... ·····~
l(XX)
80.)
" ·a tl
(ill 8 ~
400
-+-Side1 200
-§-·- Side 2
-t-Side3 i 0
0 20 40 60 80 100 120
Titre (days)
Figure B.lS Average strains on individual sides - Specimen
CST-3000-28-LT
" 1500 ·a tl 0 ... ~ 1000
500 -+-Side1
-+-Side2
-t-Side3 0
0 20 40 60 80 100 120
Titre (days)
Figure B.16 Average strains on individual sides- Specimen
CST-5000-2A-LT

79
3500
300)
2500
" -~ 200)
2 0
~ 1500
100l
500 !-+-Side1
I -fii-Sied2
_._Side3 0
40 ro 80 100 120
Ture(days)
Figure B.17 Average strains on individual sides- Specimen
CST -5000-2B-LT
" 1500 ... tl 2
~ 100l
500
0
0 20 40 80 100 120
Thre (days)
Figure B.18 Average strains on individual sides - Specimen
CST -5000-28-L T

80