Credit Unions in Chile: What is their Role? · Social Economy and Associativity Division...
30
1 Credit Unions in Chile: What is their Role? Antonio Lemus Cristian Rojas § Abstract This paper questions the role that credit unions play in the Chilean financial system, particularly if they allow financial inclusion. For this purpose, using unique statistical information existing at the CMF, the credit and savings behavior of credit unions’ members is studied, with granularity at the individual level. The results indicate that credit unions effectively contribute to financial inclusion, providing financial services mostly to people with low incomes, elderly, women, and inhabitants of small communities, far from the large urban centers. Keywords: credit unions, financial inclusion, credit JEL Classification: G21, G28, P13 We thank Ximena Quesada and EconomiX CNRS Université Paris Nanterre anonymous referees for their comments and suggestions, to Marcelo Chávez for access to statistical information, and seminar participants at the Universidad de Chile Business School and the Financial Market Commission (or “Comisión para el Mercado Financiero” (CMF) in Spanish) Research Department. Remaining errors and omissions are the responsibility of the authors and do not necessarily represent the opinion of the CMF. CMF Research Department and EconomiX CNRS Université Paris Nanterre, [email protected] § CMF Research Department, [email protected]
Transcript of Credit Unions in Chile: What is their Role? · Social Economy and Associativity Division...

1
Credit Unions in Chile: What is their Role?
Antonio Lemus Cristian Rojas§
Abstract
This paper questions the role that credit unions play in the Chilean financial system, particularly if they allow financial inclusion. For this purpose, using unique statistical information existing at the CMF, the credit and savings behavior of credit unions’ members is studied, with granularity at the individual level. The results indicate that credit unions effectively contribute to financial inclusion, providing financial services mostly to people with low incomes, elderly, women, and inhabitants of small communities, far from the large urban centers.
Keywords: credit unions, financial inclusion, credit JEL Classification: G21, G28, P13
We thank Ximena Quesada and EconomiX CNRS Université Paris Nanterre anonymous referees for their comments and suggestions, to Marcelo Chávez for access to statistical information, and seminar participants at the Universidad de Chile Business School and the Financial Market Commission (or “Comisión para el Mercado Financiero” (CMF) in Spanish) Research Department. Remaining errors and omissions are the responsibility of the authors and do not necessarily represent the opinion of the CMF. CMF Research Department and EconomiX CNRS Université Paris Nanterre, [email protected] § CMF Research Department, [email protected]

2
1. Introduction Credit unions (“Cooperativas de Ahorro y Crédito” in Spanish) have small participation in the Chilean financial system, in terms of assets, liabilities, and equity (around 2%). Then, it is valid to ask why credit unions exist and what function they accomplish that do not carry out other financial institutions, banks in particular. When discussing the role that credit unions have in the Chilean financial system, often is argued that they fulfill a “social role,” understood as financial inclusion, assigning credit to individuals excluded by banks and other financial institutions. Such a hypothesis seems to lack an answer in Chile’s economic literature. Then, this document goal is to contribute to responding, based on statistically robust economic evidence, to this question. The economic literature that has studied the credit unions in Chile has mostly focused on providing historical background, describing their market, discussing the regulation, taken as given the “social role.” Regarding this last point, the related literature (Téllez, 2007; Hernández, 2008; Matus et al., 2010; Potin, 2012; Minecon, 2014; BCCh, 2017) argues that credit unions give access to financial services to individuals who would be excluded otherwise, though not providing robust evidence.1 Credit unions are a specific type of cooperative that according to the General Law of Cooperatives of 2004 (LGC, 2004) are defined as: “cooperatives whose unique and exclusive purpose is to provide financial intermediation services for the benefit of their partners.”2 In Chile, credit unions are governed by the Decree N ° 5 (“Decreto con Fuerza de Ley” in Spanish) of 2003, the articles 86 to 90 of the LGC (2004), the Chapter III.C.2 of the Central Bank of Chile (BCCh), and the Guideline 108 of the Financial Market Commission (CMF). Specifically, the Article 87 of the LGC (2004) establishes that meanwhile, all those credit unions whose equity exceed 400,000 UF (“Unidad de Fomento” in Spanish) are under the regulation of the CMF, those not complying with this criterion are responsibility of the Social Economy and Associativity Division (“División de Economía Social y Asociatividad” in Spanish, and “DAES” hereafter) of the Ministry of Economy.3 This paper focuses on the credit unions regulated by the CMF as they represent more than 90% of the total assets, liabilities, and equity of the sector and the data available in the CMF allow us to have information with a granularity at the credit unions’ member, not previously used, allowing us to respond to the hypotheses motivating this paper.
1 Appendix A details the concepts in favor of credit unions’ “social role” in the related literature. 2 The LGC of 2004 defines cooperatives as “associations that, in accordance with the principle of mutual aid, aim to improve the living conditions of their members, having fundamental characteristics as: (i) their members have equal rights and obligations; (ii) membership and retirement of members is voluntary; (iii) they must distribute the surplus corresponding to their transactions with their members; (iv) they must observe political and religious neutrality, develop cooperative education activities and seek to establish among them federative and inter-cooperative relations”. 3 The UF is a unit of account indexed according to the inflation.

3
Our main results indicate that compared to banks, credit unions offer credit to low-income individuals, elderly, women, and residents of regions other than Santiago (Chile’s capital), particularly to small communities far from the country’s main urban areas. Also, there is a notable heterogeneity among customers, depending on whether they engage with banks, only with credit unions, or simultaneously with both types of institutions. The rest of this document is structured as follows. Section 2 reviews the related literature. Section 3 presents the historical, market, and regulatory background. Section 4 characterizes the credit unions under CMF supervision. Section 5 responds to the hypothesis motivating this paper, i.e., credit unions financial inclusion role. Finally, Section 6 concludes. 2. Related literature Credit unions are not homogenous institutions, having great diversity among them that depends on the cultural, historical, and economic context (Mckillop and Wilson, 2011). Nevertheless, credit unions also follow certain universal principles, and their study cannot be separated from the social, economic, and institutional environment in which they operate (Ojong, 2014). Meanwhile, credit unions in developed countries include members from various and heterogeneous economic segments (offering a wide range of financial services and having assets for several billion dollars), those in developing countries mainly concentrate on people excluded from the financial system (offering essential savings and credit services). Although credit unions emerged as a need for credit access of the unbanked, authors such as Jones (2008), argue that the cooperative model is changing, going from being focused on low-income sectors to a broad spectrum of customers, competing directly with other financial institutions such as banks and insurance companies. Regarding the financial inclusion role of credit unions, for the Caribbean economies, Lemus and Wong (2012) argue that the credit unions play a decisive role in their financial system. As, by 2010, Caribbean credit unions had assets of about 13% of the regional GDP, a membership rate of 40%, and an essential financial intermediation role, reaching low and middle-income sectors with difficulties accessing credit. In the same vein, in Latin America, Barham et al. (1996) for Guatemala and Rojas et al. (2018) for Costa Rica, find that credit unions help to close the gaps in traditional banking, increasing the efficiency of local markets, and serving individuals rejected by banks. Regarding the credit unions’ resilience to economic downturns and the consequences in credit risk, Smith and Woodbury (2010) conclude that compared to other financial institutions, credit unions are more resilient to economic cycle contractions, exhibiting lower delinquency as well. Furthermore, Roelants et al. (2012) suggest that credit unions respond better to adverse economic cycles as their members are firmly committed with the administration and success of these institutions. In this line, Armendáriz de Aghion and Morduch (2004) point out that credit unions members’ have lower delinquency and a more significant commitment to pay their loans as their resources are involved in the credit union

4
performance, and diligent payments assuring future financing. Lastly, McKillop and Wilson (2011) suggest that belonging to a similar social group increases the knowledge of credit behavior, allowing better identification of who could default. The Chilean literature that has studied the credit unions is relatively scarce, probably due to the general view that banks determine credit. Nevertheless, we can mention contributions by Téllez (2007), Hernández (2008), Larraín and Larraín (2010), Potín (2012), Minecon (2014), and BCCh (2017). Minecon (2014) reviews all type of cooperatives in Chile, describing the cooperative sector broadly, examining its origin and evolution, and presenting their main characteristics (including credit unions) at the sector and regional level, and their economic importance. Regarding the credit unions, Téllez (2007) provides an overview of those supervised by the CMF, in terms of their market, leading figures, and financial indicators. After, Hernández (2008) makes a brief historical contextualization, giving an overview of Chile’s credit unions, the regulatory framework in which they operate, and their impact on the society. Larraín and Larraín (2010) and BCCh (2017) focus on the regulatory issue. Meanwhile the first analyzes the regulatory differences between the credit unions and banks, finding legal differences diffuse, the second suggests that credit unions participation in the financial system can imply economic and social benefits if prudential regulation guides their development. Closer to this paper, questioning the credit unions role on financial inclusion, Potin (2012) seeks to understand the role of credit unions’ consumer loans, in particular, the specificity of the credit granted by credit unions and how it differs from the issued by other financial institutions. 3. Credit unions’ background 3.1 Historical perspective Since its inception, Chilean credit unions have experienced periods of marked boom and bust. The first credit unions in Chile have their origins in 1947 consequence of the active role of the Catholic Church and the initiative of small groups of individuals with common interests such as workers, merchants and public servants (Hernández, 2008). While in the sixties credit unions experienced strong support by the State, in the seventies and eighties, they suffered a strong decapitalization as a result of successive and deep economic crises, and high unemployment that they affected their members (Potin, 2012). During the nineties and the present century, credit unions once again have seen a boom, achieving business consolidation, covering large geographical areas, providing financial services to social sectors that private banks typically do not serve (Hernández, 2008).

5
3.2 Credit unions in the World and in Chile Credit unions are financial institutions existent in almost every country in the world. According to data from the World Council of Credit Unions (WOCCU) in 2017, there were more than 89 thousand credit unions in the world, with 260 million members, representing 9.1% of the global workforce. In terms of assets and liabilities, credit unions total deposits and capital for US$ 1.7 trillion and total loans for US$ 1.5 trillion. Credit unions level of development and market penetration (number of members over the total active population) varies in geographic terms, with the presence of credit unions (penetration) led by North America with 52%, the Caribbean with 30%, Latin America with 11%, and Africa with 9%. It is worth to note the case of North America, which includes the United States and Canada two developed and high-income countries according to the World Bank, indicates that the credit unions’ phenomenon could not be specific of low and medium-income countries (where financial markets are less developed). The credit unions’ phenomenon relates to the historical and idiosyncratic background of each country. In Chile, and emerging and high-income country according to the IMF and the World Bank, the participation of credit unions reaches 10.9% of the total active population (Figure 1), similar participation to the average Latin America country.
Figure 1. Credit unions participation and income level (2017)
Source: Authors calculations based on World Bank and WOCCU. Note: Each point represents a country. CHL: Chile. 3.3 Who regulates the credit unions in Chile? By 2018, 45 credit unions were registered in Chile. Credit unions supervision by the DAES or the CMF depends on a threshold amount (400,000 UF) of equity established by the LGC
CHL
0
20
40
60
80
100
Pen
etra
tio
n (
Per
cen
tage
po
ints
)
0 20000 40000 60000 80000GDP per Capita, PPP (USD)

6
of 2004. The number of credit unions not reaching the 400,000 UF limit of equity are 38 and supervised by the DAES. Meanwhile, the seven remaining with equity over 400,000 UF and regulated by the CMF. Currently, the credit unions regulated by the CMF are Coocretal, Coopeuch, Oriencoop, Capual, Detacoop, Ahorrocoop and Lautaro Rosas. Coopeuch is the leading credit union of the system, with assets, liabilities, and equity, equivalent to 82.4%, 82.0%, and 83.3%, respectively, by December 2017. It means that the “biggest” credit unions of the system are under the CMF supervision. Figure 2 shows the credit unions supervised by the CMF (dots in red) and those supervised by the DAES (dots in blue).
Figure 2. Assets and equity (2017)
Source: CMF and DAES. Note: Dots in red and blue indicate CMF or DAES supervision, respectively. The dotted lines represent the thresholds of assets and equity that separates the credit unions supervised either by the CMF or DAES. The data corresponds to the last year available. Coopeuch, the most significant credit union in Chile, is excluded for comparability purposes.
3.4 Requirements to credit unions and their financial services Among the legal requirements that all Chilean cooperatives must meet are: having the facilities, human resources, technology, procedures, and controls necessary to adequately develop their functions and operations and have equity not less than 10% of their weighted risk assets. Additionally, credit unions must have a ratio of equity over total assets of at least 5% and are subject to the General Banks Act (“Ley General de Bancos” in Spanish, hereafter “LGB”).

7
The financial services that credit unions provide are: (i) Receive deposits from their members partners and third parties; (ii) Issue bonds and other types of securities open to public; (iii) Contract loans with domestic or foreign financial institutions; (iv) Acquire, preserve and dispose bonds issued by the State; (v) Grant loans to their members and, in general, provide credit, with or without guarantee, adjustable or not adjustable; (vi) Discount their members, bills, promissory notes and other documents that represent payment obligations; (vii) Grant loans to its members, who are covered by mortgage collateral, and mutual endorsable mortgages; and (viii) Manage mutual endorsable mortgages.4 4. Characterization of the credit unions supervised by the CMF As already mentioned, this paper focuses on the credit unions under the supervision of the CMF, for two reasons. First, these credit unions concentrate about 90% of the loans, assets, debt, and equity of the sector, therefore being highly representative. Second, the CMF has unique data, not previously used in the literature, with a level of granularity at the member/individual, allowing the study of credit and savings with a socio-demographic view. Hereafter, when we refer to credit unions in Chile, we are talking about the seven credit unions supervised by the CMF. The data we use in this paper is administrative, including detail at the financial institution (banks and credit unions) and individual level (bank customer and credit union member). The administrative nature of the data we use makes it possible to have a detailed characterization of credit unions and their members. Meanwhile, at the financial institution level, the data corresponds to the yearly credit unions balance sheets for the period 2007-2018, the data at the member level corresponds to 2017. Using time-series at the credit union level allow us controlling by idiosyncratic characteristics affecting a specific credit union. Table 1 presents preliminary data of credit unions members and banks customers. By 2018 credit unions members reached more than one million two hundred thousand people, meaning that every four banks customers (about five million) there was one credit union member.
Table 1. Number of credit unions members and banks customers
Credit unions Banks Ratio
2015Q4 1,165,497 4,646,364 25.1% 2016Q2 1,172,266 4,676,523 25.1% 2016Q4 1,188,192 4,723,361 25.2% 2017Q2 1,205,583 4,814,919 25.0% 2017Q4 1,224,307 4,927,535 24.9% 2018Q2 1,253,028 4,980,805 25.2%
Source: Authors calculations based on CMF. Note: If an individual is a member of more than one credit union, it has been considered only once. The same logic applies for banks regarding their clients.
4 Further detail of the financial operations allowed to the credit unions supervised by the CMF, is available in Appendix B.

8
Credit unions in the financial sector are small both in terms of assets and liabilities, representing in each case less than 1% of the total banking system (Table 2). However, in terms of equity, credit unions have about 3% of the total banking sector. In pesos, in 2018, the credit unions totaled assets for $ 1,959 billion, liabilities for $ 1,423 billion, and equity for $ 535 billion.
Table 2. Credit unions balance sheet variables
(Percentage of banks’ balance sheets) Assets Liabilities Equity
2007 0.98% 0.74% 3.57% 2008 0.98% 0.76% 3.70% 2009 1.19% 0.94% 3.99% 2010 1.18% 0.93% 4.08% 2011 1.10% 0.86% 3.87% 2012 1.05% 0.84% 3.43% 2013 0.98% 0.77% 3.27% 2014 0.90% 0.69% 3.16% 2015 0.86% 0.65% 3.21% 2016 0.90% 0.69% 3.00% 2017 0.88% 0.70% 2.75% 2018 0.88% 0.70% 2.60%
Source: Authors calculations based on CMF. Note: Data to December of each year. Table 3 shows the main financial products that credit unions’ members use. On the assets side, savings and deposits are the preferred instruments by credit unions members. Indeed one out of four credit unions members has a savings account. On the liabilities side, consumer loans discounted in the payroll are the preferred type of financial service by credit unions members (about one out of five members has this type of financial instrument).5
Table 3. Main financial instruments of credit unions members (December 2017)
Assets Number of members
having the instrument % of the total
members
Sight deposit 85,117 6.95% Time deposits 27,990 2.29% Savings accounts 346,743 28.32% Other 35,961 2.94%
Liabilities
Consumer loans in installments with direct payment 104,342 8.52% Consumer loans in installments with a payroll discount 220,081 17.98% Credit cards 41,749 3.41% Mortgage 14,306 1.17% Other 5 0.00%
Total members 1,224,307 Source: Authors calculations based on CMF.
5 It is worth to note that credit unions do not provide current accounts or cash management.

9
5. Do credit unions play a role in financial inclusion? Considering the limited participation that credit unions have in the total assets, liabilities, and equity of the Chilean financial system (Table 2), it is valid to ask what role credit unions fulfill that other financial institutions do not comply with, mainly banks. To answer this question, subsection 5.1 lists and highlights the main differences, between credit unions and banks, both from a legal and a market perspective.6 Then, building on the information available at the CMF, an analysis of distribution and density functions is carried out (subsection 5.2). Next, subsection 5.3 estimates models for discrete dependent variables (Logit/Probit type). These results allow answering if credit unions play a role in financial inclusion. Ex-ante, if credit unions play a role in financial inclusion, we should find that they provide financial services to a social and economic population in disadvantage, as individuals with low income and living far from the main urban areas. Thus, we first compare the income distributions of credit unions members and banks customers, to then characterize them according to their age, gender, and region where they live. Finally, we use Logit and Probit models to answer which variables determine the probability that an individual has a debt with a credit union. Hereafter we understand “debt” as any credit supplied by either credit unions or banks, meaning consumer and commercial credits, and mortgages. In terms of products, they correspond to credit cards, consumer loans, credit account credit lines, mortgages in letters of credit, and mutual endorsable and non-endorsable mortgages. 5.1 Comparing credit unions and banks This subsection highlights the differences between credit unions and banks, from a legal and a market perspective, characterizing the debt profile of credit unions members and banks customers. Consequently, Table 4 points out that meanwhile, credit unions are not-for-profit banks do, that the minimum capital required for both types of financial institutions differs significantly, and that credit unions and banks compete in the deposits and loans markets.
6 An aggregate view of assets, liabilities, and equity, tends to bias the analysis. Consequently, we have decided to focus on specific products where credit unions and banks compete.
10
Table 4. Main differences between credit unions and banks Credit Unions Banks
Law LGC (2004) LGB (2019) Business purpose Non-profit For-profit Owners Members Shareholders Participation One member one vote Proportional to the number of
shares Profits Distributed according to the
participation quota of each member
Distributed according to the number of shares
Loans Only to members Restriction to owners Minimum capital required to operate
3,000 UF 800,000 UF
Allowed financial operations
Deposits and loans Deposits, loans, derivatives, etc.
Source: Authors elaboration based on CMF.
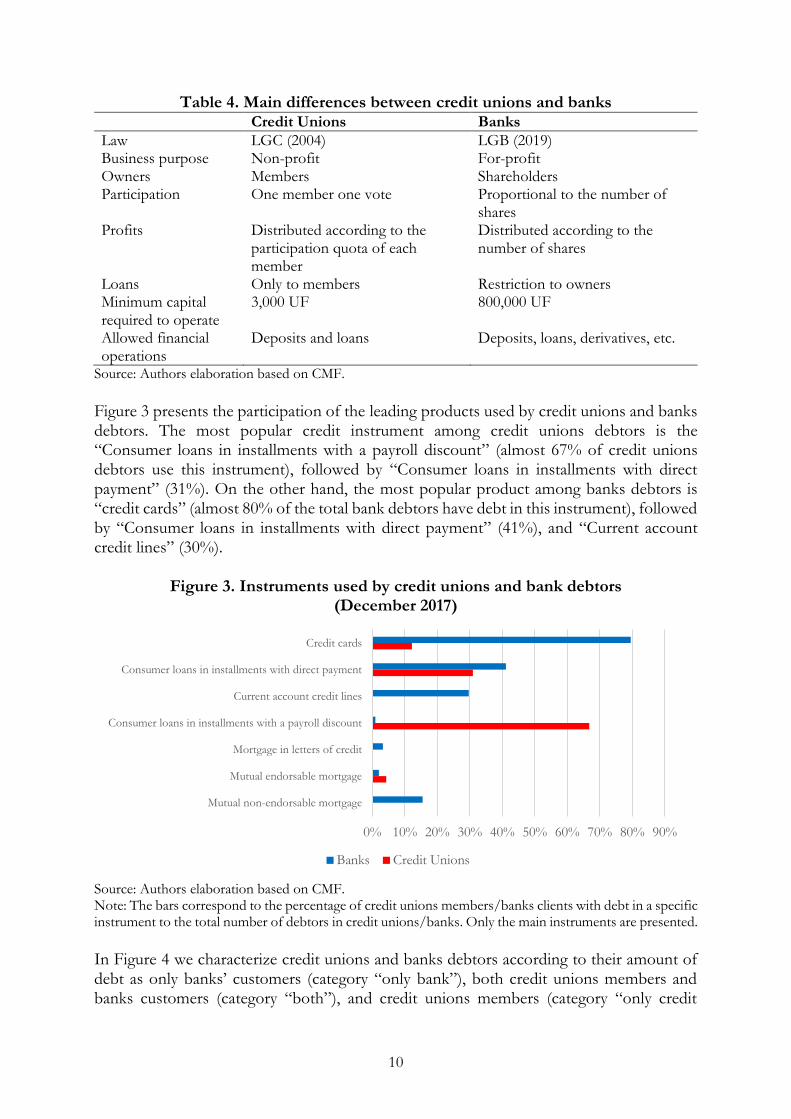
Figure 3 presents the participation of the leading products used by credit unions and banks debtors. The most popular credit instrument among credit unions debtors is the “Consumer loans in installments with a payroll discount” (almost 67% of credit unions debtors use this instrument), followed by “Consumer loans in installments with direct payment” (31%). On the other hand, the most popular product among banks debtors is “credit cards” (almost 80% of the total bank debtors have debt in this instrument), followed by “Consumer loans in installments with direct payment” (41%), and “Current account credit lines” (30%).
Figure 3. Instruments used by credit unions and bank debtors (December 2017)
Source: Authors elaboration based on CMF. Note: The bars correspond to the percentage of credit unions members/banks clients with debt in a specific instrument to the total number of debtors in credit unions/banks. Only the main instruments are presented.
In Figure 4 we characterize credit unions and banks debtors according to their amount of debt as only banks’ customers (category “only bank”), both credit unions members and banks customers (category “both”), and credit unions members (category “only credit
0% 10% 20% 30% 40% 50% 60% 70% 80% 90%
Credit cards
Consumer loans in installments with direct payment
Current account credit lines
Consumer loans in installments with a payroll discount
Mortgage in letters of credit
Mutual endorsable mortgage
Mutual non-endorsable mortgage
Banks Credit Unions

11
union”), showing their percentiles distribution.7 8 Figure 4 shows that the type of debtor who reaches a higher level of debt is who has debt at the same time with credit unions and banks. Also, we can infer that the debt by “only credit union” debtors is higher compared to those “only bank.” The exception is those debtors concentrated on the 70th percentile or higher. It seems that the lack of funds explains the difficulty of credit unions to provide a high amount of loans to multiple members, as credit unions loans are directly related to their deposits. In other words, the credit unions members’ deposits directly relate to the loans these institutions provide.
Figure 4. Debt percentiles (December 2017)
Source: Authors calculations based on CMF.
5.2 Analysis by income, age, gender, and region In this subsection, we compare credit unions members and banks customers, according to their income, age, gender, and region where they live. As in the previous subsection, beside the categories “only bank” and “only credit union,” we include the third category composed by those individuals who simultaneously are credit unions members and banks customers. If the credit unions have a role in financial inclusion, we expect to find that they have members with a lower income (for example young people unemployed or seniors retired), women (with a lower labor participation than men), and individuals living in isolated areas different to cities (having a greater difficulty accessing to financial services).
7 Appendix C provides the same information as Figure 4 in a table format. 8 As of December 2017, total credit unions debtors reached 347 thousand people. Of these, 40% had debt only in credit unions, and the remaining 60% also had debt with a bank. Debtors only with banks reached 4.7 million people.
0
10
20
30
40
Mill
ion
s o
f p
eso
s
10 20 30 40 50 60 70 80 90Percentile
Only bank Only credit union Both

12
Figure 5 characterizes “only bank”, “both”, and “only credit union” members/customers, according to their income, showing that for all percentiles, credit unions members observe lower income than the banks’ customers and the individuals belonging to the category “both”.9 When comparing banks customers with individuals in the category “both” we find that while in the low-income percentiles, 60th percentile and lower, banks’ customers observe lower-income, the opposite occurs for high-income, 60th percentile and above, with banks customers having a higher income. A plausible explanation is that high-income banks customers are more likely to be sophisticated financial clients, demanding diversified financial instruments, not provided by credit unions.10 Additionally, when we observe the distribution of banks customers, credit unions members, and the individuals in both categories (Figure 5), we find that almost 50% of credit unions members have an income lower than the national median ($349 thousand), while for customers in the categories “both” and “only bank” this threshold is achieved at the percentile 20th and 30th, respectively. Furthermore, about 30% of credit unions members have a monthly income below the minimum wage ($276 thousand in 2017).
Figure 5. Income percentiles (December 2017)
Source: Authors calculations based on CMF.
This statistical evidence allows us to infer that: (i) credit unions provide financial services to individuals with lower income than banks customers (both categories, “only bank” and “both”); (ii) the percentage of only credit unions debtors’ with an income lower than the national median is higher than for banks’ customers (both categories, “only banks” and “both”); and (iii) about 30% of debtors having a debt only in credit unions have an income
9 Appendix D provides the same information as Figure 5 in a table format. 10 In fact, for example, credit unions do not provide current accounts.
0
10
20
30
40
Mill
ion
s o
f p
eso
s
10 20 30 40 50 60 70 80 90Percentile
Only bank Only credit union Both

13
level below the minimum wage. Overall, the level of income evidence establishes that credit unions focus more on low-income individuals, vis-à-vis banks, and consequently contributing to financial inclusion. Regarding the age variable, Figure 6 shows that for all percentiles, credit unions members are older than banks customers.11 In particular, Figure 6 shows that the debtors of credit unions, compared to the other two types of clients (“only bank” and “both”), show a high concentration among elderly individuals, in particular in the retired segment. Thus, credit unions would tend to provide financial services to retired and older people, not attractive as customers for banks, constituting a new argument in favor of the financial inclusion role that credit unions seem to fulfill.
Figure 6. Age percentiles (December 2017)
Source: Authors calculations based on CMF.
One of the objectives declared by credit unions is their intention to give access to people to financial products are not a business attractive for banks. In this sense, it is worth asking, what is the scope of credit unions and banks in Chile at the regional level? To do so, we consider the number of commercial offices (offices) as a proxy variable for the presence of credit unions and banks in each region of Chile.12 Figure 7 presents the number of offices that credit unions, private banks, and the Chilean State bank, have in each region of Chile.
11 Appendix E provides the same information as Figure 6 in a table format. 12 Offices include: head offices, branches, auxiliary branches, and support offices.
30
40
50
60
70
Age
10 20 30 40 50 60 70 80 90Percentile
Only bank Only credit union Both

14
Figure 7. Number of commercial offices per region (December 2017)
Source: Authors elaboration based on CMF.
Our proxy variable “offices” notes that credit unions reach their most extensive presence in the Maule region with 22% (27 offices) of the total number of offices in the region (123 offices). It is followed by the regions of Aysén and O’Higgins with participations of 17% and 15%, respectively. In the Metropolitan Region (MR), the 38 credit unions’ offices represent only 4% of the total (1,073 offices). Whereas private banks only have 49% of their offices outside the MR, the State bank has 69% and credit unions have 80%. These results indicate that credit unions have a significant presence in Chile’s regions different from the MR. In terms of gender, information from the CMF indicates that the percentage of women debtors in credit unions (59% women versus 41% men) exceeds the share they have in banks (49% of women versus 51% of men). In particular, in almost all the counties in Chile, the ratio of debt of women in credit unions to the total debt of women is higher than in the case of men (Figure 8). Particularly interesting could be this information to study the gender gap in the credit system, and how credit unions could help to reduce them.
4 7 5 10 30 1627
21 10 11 33 4 3
38
7 1510 21
46
2924
46 29 284
513 5
126
39 7430 53
19465 72
142 64 63 1122
27 13
909
0%
10%
20%
30%
40%
50%
60%
70%
80%
90%
100%
Credit unions State bank Private banking

15
Figure 8. Debt in credit unions to total debt by gender and county (Percentage, December 2017)
Source: Authors calculations based on CMF. Note: Each point represents a county. The axes represent how much of the total debt each gender has in credit unions.
Next, considering the gender and regional dimension, we analyze the debt and savings at
the regional/county level by gender that people have in credit unions. Figure 9 presents
the results. Panel (a) defines the ratio between the debt in credit unions to total debt, and
panel (b) expresses the ratio between the savings in credit unions to total savings.
0.1
.2.3
.4.5
Wom
en
0 .1 .2 .3 .4 .5Men

16
Figure 9. Debt and saving in credit unions (Percentage)
(December 2017)
(a) Debt in credit unions per region and county
(b) Savings in credit unions per region and county
Source: Authors elaboration based on CMF.
Note: The bars denote the regions of Chile. The points correspond to counties where there is a more
significant impact of credit unions in terms of funding and savings. These outliers represent extreme cases
of high debt/savings ratio. Statistically, defined as: “the value smaller than the lower quartile minus 1.5 times
the interquartile range, or larger than the upper quartile plus 1.5 times the interquartile range”.
Panel (a) of Figure 9 shows that credit unions have a high presence of debt in regions of the center-south of Chile. On the contrary, the debt in credit unions in the MR is significantly lower than the debt on all the other Chilean regions. The panel (a) also shows
0
.1
.2
.3
.4
.5C
red
it u
nio
n d
ebt
/ T
ota
l d
ebt
Men Women
Tar
apacá
An
tofa
gast
aA
taca
ma
Co
quim
bo
Val
par
aiso
O'H
iggi
ns
Mau
leB
iobío
Ara
uca
nía
Lo
s L
ago
sA
ysén
Mag
alla
nes
Met
rop
olit
ana
Lo
s Río
sA
rica
y P
arin
aco
ta
Tar
apacá
An
tofa
gast
aA
taca
ma
Co
quim
bo
Val
par
aiso
O'H
iggi
ns
Mau
leB
iobío
Ara
uca
nía
Lo
s L
ago
sA
ysén
Mag
alla
nes
Met
rop
olit
ana
Lo
s Río
sA
rica
y P
arin
aco
ta
0
.1
.2
.3
Cre
dit
un
ion
sav
e /
To
tal sa
ve
Men Women
Tar
apacá
An
tofa
gast
aA
taca
ma
Co
quim
bo
Val
par
aíso
O’H
iggi
ns
Mau
leB
iobío
Ara
uca
nía
Lo
s L
ago
sA
ysén
Mag
alla
nes
Met
rop
olit
ana
Lo
s Río
sA
rica
y P
arin
aco
ta
Tar
apacá
An
tofa
gast
aA
taca
ma
Co
quim
bo
Val
par
aíso
O’H
iggi
ns
Mau
leB
iobío
Ara
uca
nía
Lo
s L
ago
sA
ysén
Mag
alla
nes
Met
rop
olit
ana
Lo
s Río
sA
rica
y P
arin
aco
ta

17
that in almost all regions, women have a higher percentage of debt with credit unions, compared to men. While the average debt of women in credit unions is around 4% in credit unions, in the case of men, this percentage reaches about 1.8%. Hence, we infer that women give much more intensive use of credit unions, compared to men. In the case of savings (panel (b) of Figure 9), we find a similar behavior to that of debt, but less accentuated. Savings in credit unions also are concentrated in the south-central regions of Chile, with women saving more in credit unions than men. In brief, the credit unions would fulfill financial inclusion by giving access to debt and savings to women in regions different than the MR. To reinforce the previous point, Figure 10 presents debt information in credit unions with greater detail, by county and number of inhabitants, distinguishing between those counties in the MR (dots in red) and those in the other regions of Chile (dots in blue). It is easy to observe that the share of debt in credit unions concentrates in those counties whose number of inhabitants is less than 5 thousand and different than those in the MR. Such a phenomenon confirms the role of financial inclusion that credit unions play in small counties where commercial banks are not available. Figure 10. Debt in credit unions (percentage) by county and inhabitants (number)
(December 2017)
Source. Authors elaboration based on CMF.
This subsection presents evidence indicating that people with lower incomes, older, preferably women, and living in small counties far from the main urban areas, are the ones
0.1
.2.3
%
0 200000 400000 600000Inhabitants of the county
Other MR

18
who tend to participate more actively in credit unions.13 In brief, we conclude that credit unions in Chile effectively contribute to financial inclusion. 5.3 What factors determine to belong to a credit union? This subsection complements the previous one by estimating the probability of having debt only in a credit union, using a binary variable. The data used in the estimation correspond to the same previously used, meaning information of the total debtors in credit unions and/or banks by December 2017, implying a cross-section analysis. In our estimates, we follow the methodology in Cameron and Trivedi (2009). The estimates consider a basic binary choice model where the existence of a latent variable depends on observable variables and an error term (equation (1)).
𝑦𝑖∗ = 𝑥𝑖𝛽 + 𝜀𝑖 (1)
Where it is only observed:
𝑦𝑖 = {1, 𝑖𝑓 𝑦𝑖
∗ > 0;
0, 𝑖𝑓 𝑦𝑖∗ ≤ 0
Then in our case, the probability that an individual is a member in a credit union is:
𝐸[𝑦𝑖|𝑥𝑖] = 𝑃𝑟[𝑦𝑖 = 1|𝑥𝑖] = 𝑃𝑟[𝑥𝑖𝛽 + 𝜀𝑖|𝑥𝑖] = 𝐹(𝑥𝑖𝛽) (2) Where F (∙) is the cumulative probability function. The specification of the accumulated function is tested using Logit and Probit models. From here, the models estimated have the form:
𝑃𝑟(𝑦 = 1 | 𝑋) = Φ(𝛽1 + 𝛽2𝐿𝑛(𝐼𝑛𝑐𝑜𝑚𝑒) + 𝛽3𝐴𝑔𝑒 + 𝛽4𝐺𝑒𝑛𝑑𝑒𝑟 + 𝛽5𝑅𝑒𝑔𝑖𝑜𝑛) (3) The exogenous variables included are income, age, gender, and region. Other variables could explain the dependent variable, for example, the level of debt, however, its inclusion could lead to reverse causality, as being a member of credit unions could determine the level of debt. The estimated models seek to test the statistical significance of each variable in a joint model and observe whether if in a system of equations they are still significant when an individual belongs to a credit union or not. Table 8 presents the results.
13 The results presented in this subsection are robust to the exclusion of the biggest credit union in the system (Coopeuch) from the study sample. These results are available in Appendixes F (debt, income and age of credit unions members), G (credit unions and banks offices), H (debt in credit unions to total debt, by gender and county), I (debt and savings in credit unions), and J (debt in credit unions by county and number of inhabitants).

19
Table 5. Probability of having debt only in credit unions and member characteristics
Variables Probit Logit
Ln(Income) -0.0278*** -0.0424*** (0.0006) (0.0012) Age 0.0106*** 0.0234*** (0.0000) (0.0002) Gender (Male=0, Female=1) 0.2240*** 0.4970*** (0.0025) (0.0052) Region Tarapacá 0.919*** 2.141*** (0.0087) (0.0179) Antofagasta 0.877*** 2.056*** (0.0065) (0.0138) Atacama 1.135*** 2.569*** (0.0083) (0.0163) Coquimbo 0.882*** 2.066*** (0.0062) (0.0131) Valparaíso 0.996*** 2.288*** (0.0041) (0.0089) O’Higgins 0.923*** 2.152*** (0.0056) (0.0119) Maule 1.466*** 3.183*** (0.0042) (0.0085) Biobío 1.060*** 2.423*** (0.0039) (0.0084) Araucanía 1.052*** 2.405*** (0.0054) (0.0111) Los Lagos 1.065*** 2.435*** (0.0056) (0.0115) Aysén 0.987*** 2.271*** (0.0131) (0.0266) Magallanes 1.017*** 2.334*** (0.0102) (0.0205) Los Ríos 0.518*** 1.273*** (0.0088) (0.0201) Arica y Parinacota 0.788*** 1.869*** (0.0099) (0.0210) Constant -2.812*** -5.928*** (0.0114) (0.0227) Observations 4,706,372 4,706,372 R-squared 0.1568 0.1586
Source: Authors calculations based on CMF. Note: The number of observations corresponds to clients either with debt with banks, credit unions, or in both. The binary dependent variable takes the value one when the debtor is only in credit unions, and zero otherwise. The MR is the comparison region. Robust standard errors in parentheses. *, **, ***, indicate statistical significance at 10%, 5%, and 1%, respectively.

20
Table 5 presents the explanatory variables (first column), the results of the Probit model (column 2) and the Logit model (column 3). The dependent variable takes the value 1 when the client has debt only in credit unions, while it takes the value 0 when it has debt in credit unions and banks or only in banks. The results indicate that while income has a negative coefficient, both age and gender have a positive effect on the dependent variable. In other words, the higher the income, the less likely that an individual has debt only in credit unions. On its hand, age and gender have a negative effect on the probability of being a debtor only in a credit union (results are robust to the exclusion of Coopeuch from the study sample, see Appendix K). These results are consistent with our findings in subsection 5.2.14 Finally, we note that the variables denoting the regions all exhibit positive coefficients, meaning that if a person lives in a region other than the MR, it is more likely that it has a debt only with credit unions. In other words, if a client lives in the MR is less likely, indebted only with a credit union.
6. Conclusions
Considering the small participation that credit unions have in the Chilean financial system (about 2% of total assets, liabilities, and equity), this document questions which role credit unions play that other entities, mainly banks, do not accomplish. We question whether the credit unions have a role in financial inclusion. Using unique statistical information, existing in the CMF, we study the credit unions loans and savings with granularity at their member/individual level. The results indicate that credit unions have a role on financial inclusion as they mostly provide financial services to people of lower-income, older, women, and small counties inhabitants, far from large cities, without access to financial services otherwise. Our results confirm that credit unions play a role on financial inclusion in Chile, as previously argued but not formalized in the related literature (Téllez, 2007, Hernández, 2008, Matus et al., 2010, Potin, 2012, Minecon, 2014, BCCh, 2017). Possible areas of further research are: (i) analysis of the delinquency, i.e., are credit unions members effectively better payers than banks customers, given the same amount and type of loan?; (ii) why exists a significant group of individuals having debt with both credit unions and banks? is it because the current asymmetry of information allows them having a higher total debt?; (iii) is it true that credit unions provide loans to individuals who cannot access to banks’ credit?.
14 These models do not provide probabilities directly through their parameters; the technique that does this is partial effects.

21
References
1. Armendáriz de Aghion B. and J. Morduch, 2004, “The Economics of Microfinance”, The MIT Press, (Cambridge Massachusetts).
2. Banco Central de Chile, 2017, “Posibilidades de perfeccionamiento del marco regulatorio y supervisor de las cooperativas de ahorro y crédito en Chile”, in Informe de Estabilidad Financiera, Second Semester 2017, (Santiago).
3. Barajas, A., L. Luna, and J. Restrepo, 2008, “Macroeconomic Fluctuations and Bank Behavior in Chile”, Revista de Análisis Económico, Vol. 23, N°2, pp. 21-56, December 2008.
4. Barham, B. L., S. Boucher, and M. R. Carter, 1996, “Credit constraints, credit unions, and small-scale producers in Guatemala”, World Development, 24(5), pp. 793-806.
5. Biron, M., F. Córdova, and A. Lemus, 2019, “Banks’ Business Model and Credit Supply in Chile: The Role of a State-Owned Bank”, BIS Working Paper 800, (Basel).
6. Cameron, A. and P. Trivedi, 2005, “Microeconometrics: methods and applications”, Cambridge University Press.
7. Dirección de Asociatividad y Economía Social, 2018, “Directorio de Cooperativas Supervisadas”, Ministerio de Economía, (Santiago).
8. Hernández, L., 2008, “Trayectoria y situación actual de las cooperativas de ahorro y crédito en Chile”, in J. P. Martí (ed.) Cooperativas e integración regional. La trayectoria de las cooperativas agropecuarias de ahorro y crédito en el MERCOSUR.
9. Jones, P. A., 2008, “From tackling poverty to achieving financial inclusion - The changing role of British credit unions in low income communities”, The Journal of Socio-Economics, 37(6), pp. 2141-2154.
10. Lagos, L. F. and M. Tapia, 2014, “Credit Stabilization through Public Banks: The Case of Banco Estado”, Working Paper N° 740, Central Bank of Chile, (Santiago).
11. Larraín, G. and M. Larraín, 2013, “Asimetrías regulatorias: Cooperativas de ahorro y crédito, bancos y las cajas de compensaciones”, Centro de Regulación y Estabilidad Macro financiera, Facultad de Economía y Negocios - Universidad de Chile, (Santiago).
12. Lemus, A. and Y. Wong, “Credit Unions in the ECCU: Prospects and Challenges”, in Eastern Caribbean Currency Union: Selected Issues, IMF Country Report No. 12/130, June 2012, (Washington D.C.)
13. Matus, J. M., N. Silva, A. Marinovic, and K. Flores, 2010, “Una Visión Global de la Deuda Financiera de los Hogares Chilenos en la Última Década”, Estudios Económicos Estadísticos N° 81, Banco Central de Chile, (Santiago).
14. McKillop, D. and J. Wilson, 2011, “Credit Unions: A Theoretical and Empirical Overview”, Financial Markets, Institutions and Instruments, 20(3), pp. 79-123.
15. Ministerio de Economía, Fomento y Turismo, 2004, “Ley General de Cooperativas”, Decreto con Fuerza de Ley 5, February 2004, (Santiago).
16. Ministerio de Economía, Fomento y Turismo, 2014, “El cooperativismo en Chile”, Unidad de Estudios, July 2014, mimeo.
17. Mullins, W. and P. Toro, 2018, “Credit Guarantees and New Bank Relationships”, Working Papers N° 820, Central Bank of Chile, (Santiago).
18. Ojong, N., 2014, “Credit Unions as Conduits for Microfinance Delivery in Cameroon”, Annals of Public and Cooperative Economics, 85:2, pp. 287-304.
19. Potin, F., 2012, “La transformación de las cooperativas de ahorro y crédito”, en J. Ossandón (ed.), Opening up the Black Box: Sociologies of Consumer Credits in Chile, Instituto de Investigación en Ciencias Sociales, Universidad Diego Portales, (Santiago).

22
20. Roelants, B., D. Dovgan, H. Eum, and E. Terrasi, 2012, “The resilience of the cooperative model. How Worker Cooperatives, Social Cooperatives and other Worker-owned Enterprises Respond to the Crisis and its Consequences”, CECOP, (Brussels).
21. Rojas, M., S. Deschênes, L. Ramboarisata, and A. Leclerc, 2019, “The competitive edge of credit unions in Costa Rica: From financial repression to the risks of a new financial environment”, Canadian journal of nonprofit and social economy research, 9(2).
22. Smith, D. and S. Woodbury, 2010, “Withstanding a financial firestorm: credit unions vs. banks”, Filene Research Institute, (Madison Wisconsin).
23. Téllez, M., 2007, “Análisis de Cooperativas de Ahorro y Crédito supervisadas por la Superintendencia de Bancos e Instituciones Financieras”, Serie Técnica de Estudios N° 10, (Santiago).
24. World Council of Credit Union's, 2017, “2017 Statistical Report”, retrieved from: https://www.woccu.org/documents/2017_Statistical_Report-Revised_Nov_2018

23
Appendix
A. Related literature and the “social role”
Author
The concepts about the credit unions’ “social role”
Téllez (2007) “The target market of credit unions, focus on medium and low
socioeconomic segments of people and small businesses (micro-
credits), being the main product offered consumer loans.”
Hernández (2008) “At the local level, credit unions play a fundamental role in the
economic revitalization of the territories where they are inserted,
allowing access to social groups postponed by the rest of the
financial system, supporting the entrepreneurship of micro and
small economic units.”
Matus et al. (2010) “Credit unions have their focus in low-income households, where
the average amounts of credit granted tend to be lower than in
other institutions of the system.” “Despite focusing on low-income
debtors, credit unions members belong, mainly, to public sector
companies, where debt payments are through payroll discounts,
helping to mitigate credit risk.”
Potin (2012) “Credit unions still are considered as oriented to the most
vulnerable segments of the population within the consumer credit
industry”…“However, when credit unions began they had a clear
social connotation as banks were the main financial institutions
providing them only to individuals with a certain level of economic
resources, with that the focus of credit unions were low-income
people. Currently, the situation is different, at least in formal terms
the credit granted by credit unions does not differ from consumer
loans from other financial institutions.”
Minecon (2014) “Credit unions generate opportunities for people who cannot easily
access to the financial system, as the requirements to access, risk
policies defined, among others, leave many individuals and firms
out of the financial market.”
BCCh (2017) “In the case of the cooperatives whose purpose includes financial
intermediation activities, their contribution to financial inclusion is
added, by granting services to people who do not necessarily have
access to credit.”
Source: Authors elaboration.

24
B. Financial operations allowed to the credit unions supervised by the CMF
1. Receive deposits from partners and third parties.
2. Issue bonds and other public offering securities.
3. Contract loans with national or foreign financial institutions.
4. Acquire, preserve, and dispose of national debt bonds and any other type of documents
issued in series, representing the obligations of the State.
5. Grant loans to their members and, in general, celebrate credit operations with money,
with or without collateral, adjustable and not readjusted.
6. Discount to members, bills, promissory notes and other documents that represent
payment obligations.
7. Lend to members, covered by mortgage collateral and endorsable mortgage loans.
8. Issue letters, orders of payment and drafts against their own offices or correspondents.
9. With the authorization of the CMF, grant to members, loans in national currency,
through the issuance of letters of credit, following the provisions of Title XIII of the
decree with force of law N° 3 of 1997, containing the LGB.
10. Acquire, assign, and transfer commercial effects.
11. Carry out collections, payments, and transfers of funds.
12. Acquire, conserve, build, and dispose of the real estate necessary for their operations.
They can give in a lease the properties, not in use.
13. Acquire, preserve, and dispose of the physical property need for credit unions services
or the maintenance of their investments.
14. Issue and operate credit cards for their members.
15. Prior authorization from the respective regulatory body and complying with the general
requirements established for the specific purpose, the credit unions can be shareholders
or have shares in a subsidiary or in supporting cooperatives.
16. Grant financial services to their clients on behalf of third parties, in the manner and
conditions determined by the respective oversight body.
17. Other operations authorized by the BCCh. The operations mentioned above may only
be executed under the conditions, requirements, and modalities established by the
BCCh.
Source: LGC (2004).

25
C. Debt (in pesos) (December 2017)
Percentile Only
bank Both Only credit union
10 12,986 1,190,871 254,676
20 103,094 2,324,047 517,266
30 267,001 3,513,397 892,955
40 614,973 4,887,271 1,375,977
50 1,320,629 6,566,956 2,019,383
60 2,680,833 8,808,363 2,756,873
70 5,120,645 12,186,712 3,632,424
80 11,036,706 18,328,999 5,149,116
90 35,631,787 33,407,582 8,288,431
Source: Authors calculations based on CMF.
D. Income (monthly in pesos) (December 2017)
Percentile Only
bank Both Only credit union
10 214,834 261,497 174,363
20 273,921 333,918 223,520
30 346,322 406,356 260,894
40 437,617 480,596 307,182
50 544,400 559,966 357,678
60 682,744 650,226 421,564
70 874,844 763,323 507,226
80 1,204,444 925,337 625,421
90 1,915,842 1,236,089 818,676
Source: Authors calculations based on CMF.
E. Age (years) (December 2017)
Percentile Only
bank Both Only credit union
10 28 32 29
20 32 36 34
30 36 39 38
40 40 43 43
50 45 47 48
60 49 51 53
70 54 55 57
80 59 59 63
90 66 65 71
Source: Authors calculations based on CMF.

26
F. Debt, income, and age, of credit unions members other than Coopeuch (December 2017)
Debt (in pesos)
Debt percentiles
Percentile Only
bank Both
Only credit
union
10 12,986 77,838 149,596
20 103,094 392,564 284,776
30 267,001 907,916 437,937
40 614,973 1,684,692 614,053
50 1,320,629 2,797,236 871,595
60 2,680,833 4,353,463 1,150,820
70 5,120,645 6,670,661 1,612,370
80 11,036,706 10,956,403 2,409,383
90 35,631,787 24,574,247 4,054,987
Income (monthly in pesos)
Income percentiles
Percentile Only
bank Both
Only credit
union
10 214,834 261,497 142,160
20 273,921 333,918 206,853
30 346,322 406,356 215,725
40 437,617 480,596 242,420
50 544,400 559,966 283,550
60 682,744 650,226 333,163
70 874,844 763,323 411,170
80 1,204,444 925,337 533,552
90 1,915,842 1,236,089 734,333
Age (years) Age percentiles
Percentile Only
bank Both
Only credit
union
10 28 32 33
20 32 36 41
30 36 39 48
40 40 43 53
50 45 47 58
60 49 51 62
70 54 55 67
80 59 59 72
90 66 65 78
Source: Authors calculations based on CMF. Note: “Only credit union” denotes credit unions’ member other than Coopeuch.
0
10
20
30
40
Mill
ion
s o
f p
eso
s
10 20 30 40 50 60 70 80 90Percentile
Only bank Only credit union Both
0
.5
1
1.5
2
Mill
ion
s o
f p
eso
s
10 20 30 40 50 60 70 80 90Percentile
Only bank Only credit union Both
30
40
50
60
70
80
Age
10 20 30 40 50 60 70 80 90Percentile
Only bank Only credit union Both

27
G. Offices of banks and credit unions, other than Coopeuch (December 2017)
Source: Authors elaboration based on CMF. Note: The offices consider: head offices, branches, auxiliary branches, and support offices.
H. Debt stock in credit unions, other than Coopeuch, to total debt by county and
gender (Percentage, 2017)
Source: Authors elaboration based on CMF. Note: Each point represents a county. The axes present how much of the total debt is in credit unions debt by gender.
2 3 2 5 20 1120
11 3 6 1 1 12
212 4 3 5 10
57
10 7 5 22 3
1
17
7 15
10 2146
2924
4629 28
4
513 5
126
39 7430 53
19465 72
14264 63 11
2227 13
909
0%
10%
20%
30%
40%
50%
60%
70%
80%
90%
100%
Other credit unions Coopeuch State bank Private banking
0.0
5.1
.15
Wo
men
0 .05 .1 .15Men

28
I. Debt and savings in credit unions other than Coopeuch (Percentage, December 2017)
(a) Debt ratio in credit unions per region and county
(b) Savings ratio in credit unions per region and county
Source: Authors elaboration based on CMF. Note: The bars denote the regions of Chile. The points correspond to counties where there is a more
significant impact of credit unions in terms of funding and savings. These outliers represent extreme cases
of high debt/savings ratio. Statistically, defined as: “the value smaller than the lower quartile minus 1.5 times
the interquartile range, or larger than the upper quartile plus 1.5 times the interquartile range.”
0
.05
.1
.15
Cre
dit
un
ion
deb
t /
To
tal d
ebt
Men Women
Tar
apacá
An
tofa
gast
aA
taca
ma
Co
quim
bo
Val
par
aiso
O'H
iggi
ns
Mau
leB
iobío
Ara
uca
nía
Lo
s L
ago
sA
ysén
Mag
alla
nes
Met
rop
olit
ana
Lo
s Río
sA
rica
y P
arin
aco
ta
Tar
apacá
An
tofa
gast
aA
taca
ma
Co
quim
bo
Val
par
aiso
O'H
iggi
ns
Mau
leB
iobío
Ara
uca
nía
Lo
s L
ago
sA
ysén
Mag
alla
nes
Met
rop
olit
ana
Lo
s Río
sA
rica
y P
arin
aco
ta
0
.0005
.001
.0015
Cre
dit
un
ion
sav
ings
/ T
ota
l sa
vin
gs
Men Women
Tar
apacá
An
tofa
gast
a
Ata
cam
a
Co
quim
bo
Val
par
aíso
O’H
iggi
ns
Mau
le
Bio
bío
Ara
uca
nía
Lo
s L
ago
s
Met
rop
olit
ana
Lo
s Río
s
Ari
ca y
Par
inac
ota
Tar
apacá
An
tofa
gast
a
Ata
cam
a
Co
quim
bo
Val
par
aíso
O’H
iggi
ns
Mau
le
Bio
bío
Ara
uca
nía
Lo
s L
ago
s
Met
rop
olit
ana
Lo
s Río
s
Ari
ca y
Par
inac
ota
29
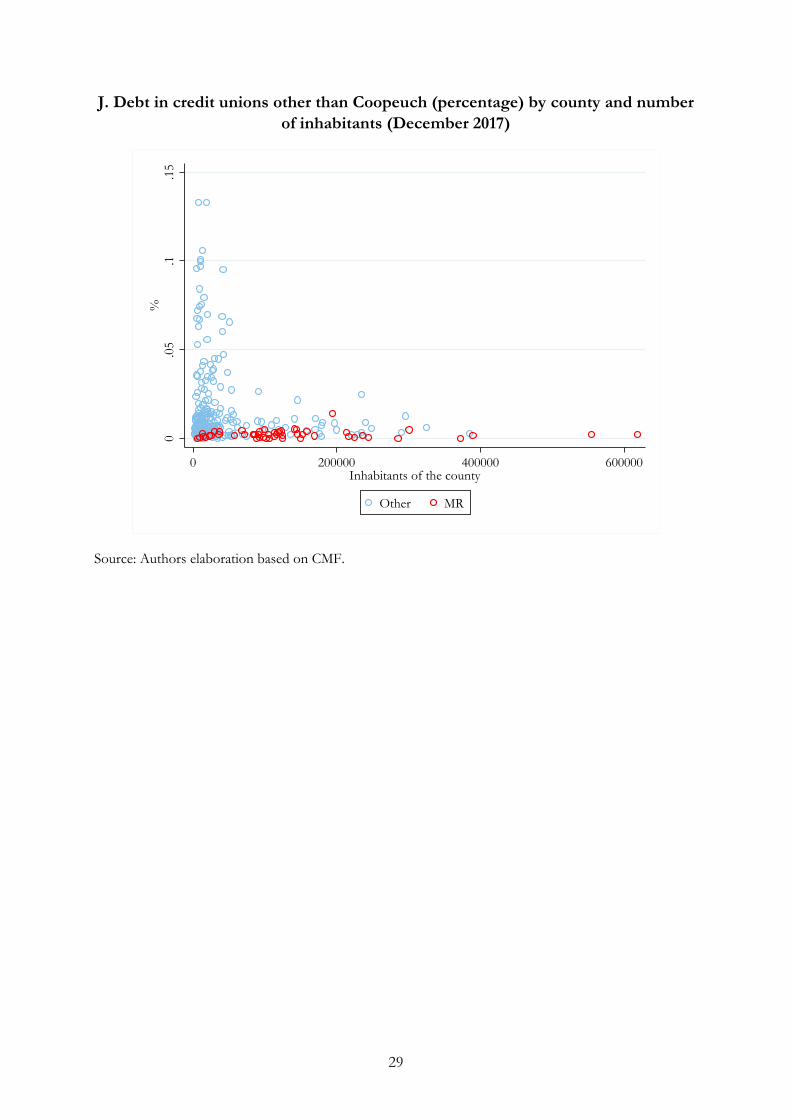
J. Debt in credit unions other than Coopeuch (percentage) by county and number
of inhabitants (December 2017)
Source: Authors elaboration based on CMF.
0.0
5.1
.15
%
0 200000 400000 600000Inhabitants of the county
Other MR

30
K. Probability of having debt only in credit unions and members characteristics (Data by 2017)
Variables Probit Logit
Ln(Income) -0.0889*** -0.1860*** (0.0008) (0.0018) Age 0.0235*** 0.0599*** (0.0002) (0.0004) Gender (Male=0, Female=1) -0.0157*** 0.0092 (0.0048) (0.0115) Region Tarapacá 0.624*** 1.815*** (0.0188) (0.0493) Antofagasta 0.411*** 1.202*** (0.0175) (0.0484) Atacama 0.414*** 1.221*** (0.0253) (0.0699) Coquimbo 0.290*** 0.908*** (0.0181) (0.0516) Valparaíso 0.652*** 1.825*** (0.0090) (0.0239) O’Higgins 0.831*** 2.308*** (0.0106) (0.0272) Maule 1.712*** 4.261*** (0.0067) (0.0166) Biobío 0.995*** 2.651*** (0.0074) (0.0193) Araucanía 0.632*** 1.796*** (0.0126) (0.0334) Los Lagos 0.585*** 1.679*** (0.0139) (0.0375) Aysén 0.305*** 0.833*** (0.0457) (0.1330) Magallanes 0.344*** 1.032*** (0.0310) (0.0872) Los Ríos 0.254*** 0.756*** (0.0221) (0.0630) Arica y Parinacota 0.496*** 1.454*** (0.0226) (0.0613) Constant -3.024*** -7.184*** (0.0180) (0.0428) Observations 4,706,372 4,706,372 R-squared 0.2538 0.2574
Source: Authors elaboration based on CMF. Note: The number of observations corresponds to clients either with debt with banks, credit unions, or in both. The binary dependent variable takes the value one when the debtor is only in credit unions other than Coopeuch, and zero otherwise. The MR is the comparison region. Robust standard errors in parentheses. *, **, ***, indicate statistical significance at 10%, 5%, and 1%, respectively.