Credit Suisse Financial Services Conference February 9, … · Credit Suisse Financial Services...
24
February 9, 2016 Citi | Investor Relations Naveed Sultan Global Head of Treasury & Trade Solutions Credit Suisse Financial Services Conference
Transcript of Credit Suisse Financial Services Conference February 9, … · Credit Suisse Financial Services...

February 9, 2016
Citi | Investor Relations
Naveed Sultan
Global Head of Treasury & Trade Solutions
Credit Suisse Financial Services Conference

Introduction
2
Treasury & Trade Solutions (TTS) at Citi
- Leading cash management and trade solutions provider
- Unique, seamless network in roughly 100 countries
- Efficient business with attractive returns
- Generates high-quality operating deposits
- Drives significant adjacent product revenues
Well-positioned for fundamental growth
- Facilitating global trade and capital flows
- Serving client demand for integrated global solutions
- Enabling client strategies through digitization
Technology-driven franchise
- Delivering integrated end-to-end digital solutions
- Driving corporate mobile banking initiatives
- Innovation labs for next generation technology

What We Do
3
Delivering comprehensive solutions on a global basis
• Receivables
• Payments
• Liquidity management
• Commercial cards
• Trade services
• Trade finance
• Working capital finance
• Export agency finance
Key Product Lines
Cash
Management
Annual
Revenues: $6.3B
2015 Highlights
Note: Annual figures reflect full year 2015, and end-of-period amounts are as of December 31, 2015.
• Facilitating ~$3 trillion of payment flows daily in
over 135 currencies
• $392 billion of deposits
• Serving >80% of Global Fortune 500 companies
• >360,000 online corporate banking users in 95
countries in 25 languages
• Mobile corporate banking live in 92 countries
supporting 16 languages
• ~5 million commercial card accounts with ~$35
billion of annual purchase volume
• Over $165 billion of annual trade finance
originations
• Providing over 1,000 supply chain finance
programs globally
Cli
en
t A
cc
es
s C
ha
nn
els
Trade
Annual
Revenues: $1.5B
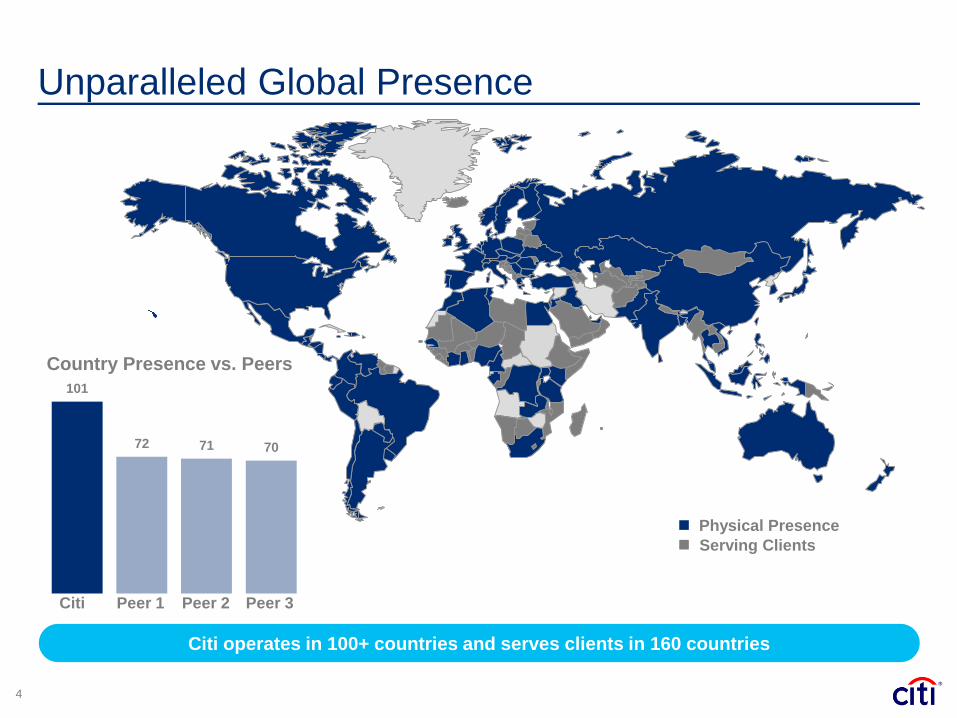
101
72 71 70
Unparalleled Global Presence
4
Physical Presence
Serving Clients
Citi operates in 100+ countries and serves clients in 160 countries
Citi Peer 1 Peer 2 Peer 3
Country Presence vs. Peers

How TTS Provides Value to Our Clients
5
TTS is a technology-driven franchise, integral to our clients’ operating models
Facilitating Working Capital Efficiency for Corporate Clients: (~65% Revenues)
Facilitating Flows for Financial Institutions: (~25% Revenues)
Facilitating Efficiency and Economic Growth Agenda for Public Sector: (~10% Revenues)
• Deliver operating and working capital efficiencies
• Balance sheet solutions leveraging cash and trade capabilities
• Risk mitigation in facilitating commercial and trade flows
• Embedded banking infrastructure or platform provider
• Trusted advisor for market access, regulatory knowledge and technical skills
• Distribute trade assets to help Financial Institutions meet balance sheet objectives
• Enable deployment of technology-driven solutions and efficiencies
• Provide greater visibility and control over financial flows
• Support local economy through supplier finance and EAF structures

Integral to our Clients’ Core Banking Needs
6
Corporate Client
• Capital structuring
• Debt and equity issuance
• Rating agency management
• Exposure management
• Portfolio investment
• M&A
• Liquidity management
• Working capital management
• Short-term financing,
investing and transactional FX
• Trade financing and services
• Bank relationship
management
• FX, commodity and interest rate
risk management
• Contingency and stress testing
• Insurance and officers liability,
workers compensation, etc.
• Policy and limit setting
Corporate Finance Liquidity OptimizationRisk Management
CorporateFinance Working
Capital Management
Capital Markets &
Banking
Treasury & Trade
Solutions

How TTS Drives Results for Citi
16%
44%
11%17%
84%
56%
89%83%
Assets Deposits Revenues Net Income(2) (2)
$1,657 $68 $16$901
Contribution to CiticorpHighlights
($B)
TTS Other Citicorp
7
(1) (1)
• Growing, diversified revenue base
• Highly efficient business with attractive returns
• High quality loan origination platform
• Significant generator of operating deposits
• Driver of significant adjacent revenue
opportunities
• Center for technology / digital innovation
Note: Other Citicorp includes Global Consumer Banking, the Institutional Clients Group ex TTS and Corporate / Other.
(1) As of December 31, 2015.
(2) Full year 2015 adjusted results excluding, as applicable, CVA / DVA in all periods. Adjusted results, as used throughout this presentation, are non-GAAP financial
measures. For a reconciliation of the adjusted results to reported results, please refer to Slide 24.

$7.0 $7.0 $7.1 $7.1 $7.2 $7.2 $7.3 $7.5 $7.6
4Q'13 1Q'14 2Q'14 3Q'14 4Q'14 1Q'15 2Q'15 3Q'15 4Q'15
(0.5)%2.9%
0.6% 2.2%4.8% 4.0% 4.6% 6.6%
9.5%
North America
31%
EMEA30%
Asia23%
Latam16%
Growing, Diversified Revenue Base
8
Stable and Growing Annual Revenues (LTM) Diversified by Product
Liquidity Management
50%Payments / Receivables
23%
Trade19%
Commercial Cards / Other
8%
Diversified by Geography
Quarterly YoY Growth:
(in Constant $B)
Note: LTM: latest twelve months. Constant dollar excludes the impact of foreign exchange translation into U.S. dollars for reporting purposes. Constant dollar reporting is a non-
GAAP financial measure. Please refer to Slide 24 for a reconciliation of this information to reported results.
CAGR:
4%

46.0%
56.7% 57.1%
TTS ICG Citicorp
27.5%
12.1%9.2%
TTS ICG Citigroup
Highly Efficient with Attractive Returns
9
Drivers 2015 Operating Efficiency Ratio(1)
2015 Return on Assets(1) 2015 Return on Allocated TCE(1,2)
(bps)
• Efficiencies of scale
• Technology and digitization
• High quality assets with attractive RWA content
(mostly HQLA and short-term financings)
• Capital-efficient
• Well-positioned for higher interest rates
107
73
94
TTS ICG Citigroup
Note: RWA: risk-weighted assets. HQLA: high quality liquid assets.
(1) Adjusted results, which exclude, as applicable, CVA / DVA. Please refer to Slide 24 for a reconciliation of this information to reported results.
(2) Return on Tangible Common Equity (RoTCE) is a non-GAAP financial measure. For additional information on this measure, please refer to Slides 23 and 24.

$80 $82 $82 $74 $73 $73 $73 $73 $71
4Q'13 1Q'14 2Q'14 3Q'14 4Q'14 1Q'15 2Q'15 3Q'15 4Q'15
North America25%
Brazil11%
Ireland8%India
6%
UK 5%China 4%Singapore 3%
Taiwan 3%
Turkey 3%
Japan 3%
Other EMEA11%
Other LATAM12%
Other Asia6%
High Quality Loan Origination Platform
10
TTS Loan Balances TTS Loan Details
(EOP, in Constant $B)
Diversified by Geography
(4Q’15 EOP Loans)
(6)% CAGR
• Total loans declined as we have continued to
support clients, while reducing balance sheet by
selling a greater portion of trade loan originations
• ~80% investment grade, reflecting focus on large
multi-national clients
• Typically short-term (< 6 months) and self-
liquidating
• Low historical loss rates (average ~10 bps)(1)
Note: Constant dollar excludes the impact of foreign exchange translation into U.S. dollars for reporting purposes. Constant dollar reporting is a non-GAAP financial measure.
Please refer to Slide 24 for a reconciliation of this information to reported results.
(1) Average annual loss rate over past five years.
Asset Sale Trends
17%
22%25%
30%28%
33% 32% 32%35%
4Q'13 1Q'14 2Q'14 3Q'14 4Q'14 1Q'15 2Q'15 3Q'15 4Q'15
Sales / Origination

Note: Constant dollar excludes the impact of foreign exchange translation into U.S. dollars for reporting purposes. Please refer to Slide 24 for a reconciliation of this information
to reported results.
(1) As of December 31, 2015.
1.26%1.22%
1.27%1.26%
1.24%1.27%1.29%
1.26%
1.32%
4Q'13 1Q'14 2Q'14 3Q'14 4Q'14 1Q'15 2Q'15 3Q'15 4Q'15
Significant Source of Operating Deposits
11
Growing, Diversified Deposit Base High Quality Composition(Avg, in Constant $B)
Stabilizing Net Interest Spreads
94 102 96 100 106 113 114 115 112
103 106 103 104
111 108 113 110 112
108 105
105 106 107 110
112 117 120
42 45 48 47
46 46 48 50 52 $348
$357 $352 $357 $370 $376
$388 $393 $396
4Q'13 1Q'14 2Q'14 3Q'14 4Q'14 1Q'15 2Q'15 3Q'15 4Q'15
7% CAGR
North America EMEA Asia Latam • Diversified across regions
• Deposit-taking as part of comprehensive,
integrated client solutions
• Strong LCR liquidity value at 68%(1)
• 100% run-off deposits under LCR reduced to 7%
of total deposits(1)

TTS Revenue
12
2007 2008 2009 2010 2011 2012 2014 20152013
ICG Revenue
Leveraging the TTS platform to deepen relationships and enable client strategies
($MM)
ME- Africa
AsiaLatAm
Global
Europe Long-
standing
relationships
contributing
to ICG and
TTS revenue
growth
North America
Illustrative Client Example – Adjacent RevenuesD
ep
th o
f R
ela
tio
nsh
ip
Cash &
Liquidity
Management
Trade
Services
Commercial
CardsCommercial
Cards
Trade
Finance
Trade
Finance
Trade
Services Cash &
Liquidity
Management Cash
Management
Trade
Finance
Commercial
Cards
Trade
Finance
Trade
Services
Commercial
CardsTrade
Finance
Trade
Services
Cash
Management
Trade
Finance
Card
Acquiring
Commercial
CardsCash
Management
Cash &
Liquidity
Management
Cash &
Liquidity
Management Commercial
Cards
Trade
Finance
Cash
Management
Cash
Management
Cash
Management
Cash
Management
Cash
Management
Cash
Management
Liquidity
Management
Commercial
Cards
Cash
Management
Cash
Management
Commercial
Cards
Liquidity
Management
Cash
Management
Commercial
Cards
Fixed
Income
DerivativesFixed
Income
Derivatives
Equity
Underwriting Fixed
Income
Derivatives
Commercial Cards
Trade
Services
Commercial
Cards
Commercial
Cards
Cash
Management
Cash
Management
Cash
Management
Cash
Management
Cash
Management
Cash
Management
Cash
Management
$43
$57
$24
$42

13
Emerging
Markets
• Growth in global trade and capital flows
• Development of both DM-EM and EM-EM flow corridors
• Growing base of multi-national corporates
• Cross-border M&A
• Drive for efficiency of liquidity and working capital across markets
• Digitizing core banking to enable client strategies and execution
• Adoption of mobile corporate banking solutions
• Emergence of new platforms and technologies
• Potential for value chain disruption
Macro Themes
Globalization
Digitization
Drivers of TTS Industry Revenue Pool Growth
Citi is well-positioned to continue capturing share of a growing revenue pool

Well Positioned to Capitalize on Substantial Flows
14
New flow opportunities demand global platforms
2014 Intra and Inter-Regional Merchandise Trade Flows: $18.5 Trillion
North
America: $2.5
Europe: $6.8
Latin
America:$0.7
Russia(1): $0.7
Africa: $0.5
Middle East: $1.3 Asia: $5.9
Internal TradeExternal Trade
Source: World Trade Organization (WTO) International Trade Statistics
(1) Represents total for Commonwealth of Independent States.
50% 50%
69%
32%18%
82%
52% 48%
9%
91%18%
82%26%
74%

Our Target Clients Become More Global Every Day
($B)
9%
32%
2005 2015
15 Note: EM: Emerging Markets. DM: Developed Markets
(1) Source: Dealogic. Based on deal value at announcement. Cross-border M&A includes transactions where acquirer and target are located in different countries.
EM Companies as % of Fortune 500 Global
Increasing client demand for integrated global solutions
3.4x
Cross-Border M&A Growth(1)
530
1,075
142
121
57
214
70
144
$799
$1,555
2005 2015
1.9x
DM to DM
DM to EM
EM to EMEM to DM

25 languages
360k+ users
Digitizing banking from origination to execution, starting with our CitiDirect BE platform
Digitizing Banking to Enable Global Client Strategies
• Digitizing processes:
‒ Account opening
‒ Implementation
‒ Servicing
‒ Client experience
• Client access anytime, anywhere
• Optimize liquidity and working capital
• Initiate trade and payment transactions
• Manage foreign currency exposures
• Access supplier finance and letters of credit
• Account management and analytics
• Seamless connectivity online and mobile
16
135+ currencies
Seamless, Internet-based Global PlatformsCitiDirect BE
95 countries

CitiDirect BE – Transforming Client Experience
17
Channels work together to provide integrated solutions that allow full visibility and control
Initiate Transactions via
CitiDirect BE
Send files via CitiConnect
Or via CitiDirect BE file upload
Approve and Release Transactions
via CitiDirect BE Mobile
via CitiDirect BE Tablet
via CitiDirect BE
View Reports/ Analytics/
Inquiries via CitiDirect BE Tablet
via CitiDirect BE
via ERP
Citi ERP
Integrator

Concept Design Pilot Launch Commercialize
7 Countries 44 Countries
9 Languages
92 Countries
16 Languages
$1B
$228B
$32B
$1T
2012 2013 2014 20152011
Clients monitor balances, execute payments and authorize trade transactions on mobile devices
CitiDirect BE Mobile – Rapid Client Adoption
Aggregate
Payment
Volumes
18

Investing in technology innovations with potential to transform our business
Payment
Volumes
19
Deliver Innovation
Portfolios1
Client Showcase &
Solutions Center2
Facilitate Regional
Innovation3
DIGITAL
BANKING
WORKING CAPITAL
SOLUTIONS
CLIENT
EXPERIENCE
Innovation Labs Drive Next Generation Solutions
Accelerators4

Key Takeaways
20
TTS has unparalleled global reach and diversification
- Leading cash management and trade solutions provider with unique footprint
- Revenue base diversified by client, product and geography
- Efficient business with attractive returns, generating high-quality deposits
Well-positioned for fundamental growth
- Able to leverage scale on behalf of clients, facilitating global commercial and
financial flows
- Significant adjacent product revenue opportunities with target clients
- Well-positioned to capture share of growing cash management and trade
revenue pool
- Serving client demand for integrated end-to-end global solutions
Technology-driven franchise
- Enabling client strategies through digitization
- Innovation labs for next generation technology

Certain statements in this presentation are “forward-looking statements”
within the meaning of the U.S. Private Securities Litigation Reform Act of
1995. These statements are based on management’s current
expectations and are subject to uncertainty and changes in circumstances.
These statements are not guarantees of future results or occurrences.
Actual results and capital and other financial condition may differ materially
from those included in these statements due to a variety of factors,
including, among others, the precautionary statements included in this
presentation and those contained in Citigroup’s filings with the U.S.
Securities and Exchange Commission, including without limitation the
“Risk Factors” section of Citigroup’s 2014 Form 10-K. Any forward-looking
statements made by or on behalf of Citigroup speak only as to the date
they are made, and Citi does not undertake to update forward-looking
statements to reflect the impact of circumstances or events that arise after
the date the forward-looking statements were made.
21
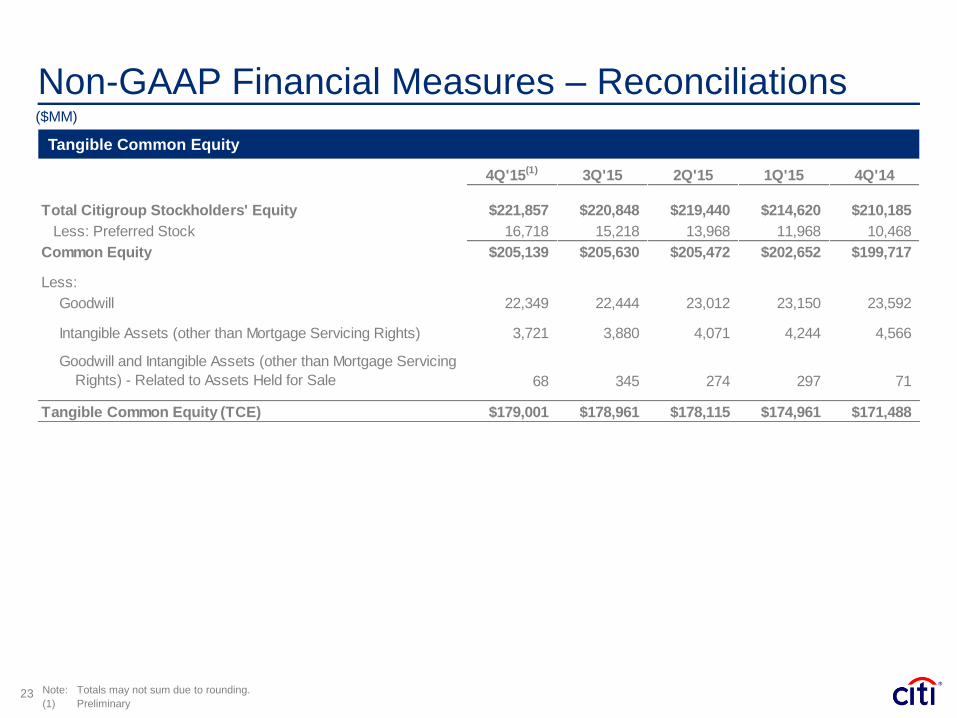
Non-GAAP Financial Measures – Reconciliations
23
Tangible Common Equity
($MM)
Note: Totals may not sum due to rounding.
(1) Preliminary
4Q'15(1) 3Q'15 2Q'15 1Q'15 4Q'14
Total Citigroup Stockholders' Equity $221,857 $220,848 $219,440 $214,620 $210,185
Less: Preferred Stock 16,718 15,218 13,968 11,968 10,468
Common Equity $205,139 $205,630 $205,472 $202,652 $199,717
Less:
Goodwill 22,349 22,444 23,012 23,150 23,592
Intangible Assets (other than Mortgage Servicing Rights) 3,721 3,880 4,071 4,244 4,566
Goodwill and Intangible Assets (other than Mortgage Servicing
Rights) - Related to Assets Held for Sale 68 345 274 297 71
Tangible Common Equity (TCE) $179,001 $178,961 $178,115 $174,961 $171,488

Non-GAAP Financial Measures – Reconciliations
24 Note: Totals may not sum due to rounding. LTM: Last twelve months.
Treasury and Trade Solutions 4Q'15 3Q'15 2Q'15 1Q'15 4Q'14 3Q'14 2Q'14 1Q'14 4Q'13
Reported EOP Loans $71 $73 $75 $75 $76 $78 $87 $87 $86
Impact of FX Translation - (0) (2) (1) (3) (4) (5) (5) (5)
EOP Loans in Constant Dollars $71 $73 $73 $73 $73 $74 $82 $82 $80
Reported Average Deposits $396 $395 $394 $382 $384 $377 $375 $379 $372
Impact of FX Translation - (2) (6) (6) (14) (21) (23) (22) (25)
Average Deposits in Constant Dollars $396 $393 $388 $376 $370 $357 $352 $357 $348
Treasury and Trade Solutions 4Q'15 3Q'15 2Q'15 1Q'15 4Q'14 3Q'14 2Q'14 1Q'14 4Q'13
Reported LTM Revenues (GAAP) $7,767 $7,709 $7,710 $7,735 $7,767 $7,750 $7,739 $7,740 $7,720
Impact of:
FX Translation (143) (257) (377) (486) (589) (655) (683) (694) (724)
LTM Revenues in Constant Dollars $7,624 $7,452 $7,333 $7,249 $7,178 $7,095 $7,056 $7,046 $6,996
Citigroup 2015
Reported Net Income (GAAP) $17,242
Impact of:
CVA / DVA 162
Adjusted Net Income $17,080
Preferred Dividends 769
Adjusted Net Income to Common $16,311
Average Assets ($B) $1,824
Adjusted ROA 0.94%
Average TCE $176,505
Adjusted RoTCE 9.2%
Citicorp 2015
Reported Revenues (GAAP) $68,517
Impact of:
CVA / DVA 269
Adjusted Revenues $68,248
Reported Net Income (GAAP) $16,195
Impact of:
CVA / DVA 172
Adjusted Net Income $16,023
Institutional Clients Group 2015
Reported Revenues (GAAP) $33,748
Impact of:
CVA / DVA 269
Adjusted Revenues $33,479
Reported Net Income (GAAP) $9,399
Impact of:
CVA / DVA 172
Adjusted Net Income $9,227
($MM, except balance sheet items in $B)
Treasury and Trade Solutions - EMEA 4Q'15 3Q'15 2Q'15 1Q'15 4Q'14 3Q'14 2Q'14 1Q'14 4Q'13
Reported Average Deposits $112 $112 $115 $110 $119 $115 $116 $119 $118
Impact of FX Translation - (1) (2) (2) (8) (11) (13) (13) (14)
Average Deposits in Constant Dollars $112 $110 $113 $108 $111 $104 $103 $106 $103
Treasury and Trade Solutions - Asia 4Q'15 3Q'15 2Q'15 1Q'15 4Q'14 3Q'14 2Q'14 1Q'14 4Q'13
Reported Average Deposits $120 $117 $115 $113 $111 $112 $112 $111 $114
Impact of FX Translation - (0) (2) (3) (4) (6) (7) (6) (7)
Average Deposits in Constant Dollars $120 $117 $112 $110 $107 $106 $105 $105 $108
Treasury and Trade Solutions - Latam 4Q'15 3Q'15 2Q'15 1Q'15 4Q'14 3Q'14 2Q'14 1Q'14 4Q'13
Reported Average Deposits $52 $51 $49 $47 $48 $49 $51 $47 $46
Impact of FX Translation - (0) (1) (1) (2) (3) (3) (3) (3)
Average Deposits in Constant Dollars $52 $50 $48 $46 $46 $47 $48 $45 $42


