Credit ratings and the pricing of sovereign debt during ... · [email protected] Michael M....
38
NBER WORKING PAPER SERIES CREDIT RATINGS AND THE PRICING OF SOVEREIGN DEBT DURING THE EURO CRISIS Joshua Aizenman Mahir Binici Michael M. Hutchison Working Paper 19125 http://www.nber.org/papers/w19125 NATIONAL BUREAU OF ECONOMIC RESEARCH 1050 Massachusetts Avenue Cambridge, MA 02138 June 2013 We thank conference participants at the Oxford Review of Economic Policy Seminar at the Saïd Business School, Oxford, especially Christoffer Koch and Christopher Bowdler, and seminar participants at INSEAD, the Central Bank of Turkey, and Sveriges Riksbank for very helpful comments. The views expressed herein are those of the authors and do not necessarily reflect the views of the National Bureau of Economic Research. NBER working papers are circulated for discussion and comment purposes. They have not been peer- reviewed or been subject to the review by the NBER Board of Directors that accompanies official NBER publications. © 2013 by Joshua Aizenman, Mahir Binici, and Michael M. Hutchison. All rights reserved. Short sections of text, not to exceed two paragraphs, may be quoted without explicit permission provided that full credit, including © notice, is given to the source.
Transcript of Credit ratings and the pricing of sovereign debt during ... · [email protected] Michael M....

NBER WORKING PAPER SERIES
CREDIT RATINGS AND THE PRICING OF SOVEREIGN DEBT DURING THEEURO CRISIS
Joshua AizenmanMahir Binici
Michael M. Hutchison
Working Paper 19125http://www.nber.org/papers/w19125
NATIONAL BUREAU OF ECONOMIC RESEARCH1050 Massachusetts Avenue
Cambridge, MA 02138June 2013
We thank conference participants at the Oxford Review of Economic Policy Seminar at the Saïd BusinessSchool, Oxford, especially Christoffer Koch and Christopher Bowdler, and seminar participants atINSEAD, the Central Bank of Turkey, and Sveriges Riksbank for very helpful comments. The viewsexpressed herein are those of the authors and do not necessarily reflect the views of the National Bureauof Economic Research.
NBER working papers are circulated for discussion and comment purposes. They have not been peer-reviewed or been subject to the review by the NBER Board of Directors that accompanies officialNBER publications.
© 2013 by Joshua Aizenman, Mahir Binici, and Michael M. Hutchison. All rights reserved. Shortsections of text, not to exceed two paragraphs, may be quoted without explicit permission providedthat full credit, including © notice, is given to the source.
Credit Ratings and the Pricing of Sovereign Debt during the Euro CrisisJoshua Aizenman, Mahir Binici, and Michael M. HutchisonNBER Working Paper No. 19125June 2013JEL No. F30,F34,G01,G24,H63
ABSTRACT
This paper investigates the impact of credit rating changes on the sovereign spreads in the EuropeanUnion and investigates the macro and financial factors that account for the time varying effects ofa given credit rating change. We find that changes of ratings are informative, economically importantand highly statistically significant in panel models even after controlling for a host of domestic andglobal fundamental factors and investigating various functional forms, time and country groupingsand dynamic structures. Dynamic panel model estimates indicate that a credit rating upgrade decreasesCDS spreads by about 45 basis points, on average, for EU countries. However, the association betweencredit rating changes and spreads shifted markedly between the pre-crisis and crisis periods. Europeancountries had quite similar CDS responses to credit rating changes during the pre-crisis period, butthat large differences emerged during the crisis period between the now highly-sensitive GIIPS groupand other European country groupings (EU and Euro Area excluding GIIPS, and the non-EU area).We also find a complicated non-linear pattern dependent on the level of the credit rating. The resultsare robust to the including credit “outlook” or “watch” signals by credit rating agencies. In addition,contagion from rating downgrades in GIIPS to other euro countries is not evident once own-countrycredit rating changes are taken into account.
Joshua AizenmanEconomics and SIRUniversity of Southern CaliforniaUniversity ParkLos Angeles, CA 90089-0043and [email protected]
Mahir BiniciCentral Bank of TurkeyIstiklal Cad. No : 10 Ulus06100 [email protected]
Michael M. HutchisonDepartment of EconomicsE2University of CaliforniaSanta Cruz, CA [email protected]

2
1. Introduction and Overview
Concerns about the information content of credit ratings and their association with
sovereign spreads and default risk were mostly muted during the Great Moderation period. The
global crisis of 2008-9, and especially the on-going Euro crisis, again put to the fore these issues
at the time of an unprecedented rise in volatility. A number of issues arise in this context,
foremost among them are whether credit rating agency (CRA) rating changes systemically
provide markets with new information on the likelihood of sovereign default and how risk
pricing responds. Do credit rating agencies have superior information on current or likely future
fundamentals and/or provide value by coordinating disparate market views on credit worthiness
such that rating changes have an economically important? Has the information value of credit
ratings perceived by the markets been diminished since the advent of the global financial crisis
(GFC) and their failure to adequately judge default risk of mortgage back securities and other
derivative products at that time?
The impact of credit rating changes on sovereign bonds, and the impact on credit default
swap (CDS) pricing, seems particularly important in the European context for several reasons.
First, the first sovereign default in EU history occurred when Greece defaulted on government
bonds in 2012. Prior to the default many public officials and others had expressed frustration that
the credit rating agencies (CRAs) and market participants pricing CDS were betting on a Greek
default, in their view putting in motion a process driving down bond prices, causing the cost of
public funding to rise and creating a self-fulfilling prophesy leading to default. Second, the
GIIPS group (Greece-Italy-Ireland-Portugal-Spain), a subset of the EU, all of which participate
in the Eurozone, have been particularly affected by credit downgrades, with one or more CRA
rating Greece, Portugal, and Ireland to "junk" status since spring 2010. Many officials publically
stated that these downgrades accelerated a burgeoning Eurozone sovereign debt crisis and, partly
in response to this criticism, several new regulations and rules on CRAs have been put in place1.
A recent EC memo explaining new rules states: “CRAs have a major impact on today's financial
markets, with rating actions being closely followed and impacting on investors, borrowers,
issuers and governments: e.g. sovereign ratings play a crucial role for the rated country, since a
1These are commonly referred to as CRA I Regulation and CRA II regulation. New rules were also adopted in early 2013: http://ec.europa.eu/internal_market/securities/agencies/index_en.htm.

3
downgrading has the immediate effect of making a country's borrowing more expensive.”
(European Commission, 2013). Third, there are concerns that the EU, and the Eurozone in
particular, is being divided into two distinct groups, one of which whereby sovereign risk is
priced fairly and by international norms, and another group (GIIPS), which is subject to
“excessive” pricing and sensitivity to economic development, in turn putting at risk the solvency
of public finances.2
To address these issues, we investigate how changes in credit ratings and economic factors
have influenced CDS spreads in Europe in the context of the recent crisis. Specifically, we use
monthly data, January 2005 to August 2012, for 26 EU countries, to evaluate the transmission of
credit rating changes on sovereign CDS spreads, while controlling for country-specific and
global economic factors, in the context of a dynamic panel model with fixed effects. We examine
possible time-varying responses to credit ratings, especially price sensitivity before and after the
GFC, and whether pricing responses and pricing dynamics differ between GIIPs and others in the
EU. In addition, we explore whether the response of CDS to rating changes depends upon the
initial level of credit rating, and hence whether non-linearity and particular threshold points (e.g.
investment grade credit rating point) are apparent in the pricing of risk. Finally, we investigate
cross-border transmission of credit rating changes from GIIPS to others in the EU, and the
degree to which these associations are time dependent and nonlinear.
The focus on Europe allows us to investigate the concern that market pricing of sovereign
risk during the crisis may not be justified by economic fundamentals, and whether the
association between credit ratings the pricing of sovereign debt is influenced by participation in
the Euro Zone. In addition, contrasting the crisis period (and heighted volatility of shocks) with
the preceding period of relative market tranquility provides sharper identification of these
linkages.
We find that changes in credit ratings are informative, significant economically, and
robust, even after controlling for conventional economic fundamentals. Specifically, an upgrade
decreases CDS spreads by about 45 basis points, while a one percent rise in the domestic stock
price index lowers CDS spreads by 1.5 to 2.0 basis points. World commodity and oil price
increases also consistently decrease CDS spreads, likely because world economic conditions are 2This is sometimes referred to in the European context as self-fulfilling “bad” expectations equilibrium (e.g. DeGrauwe and Yi, 2013).

4
generally strong when these prices are rising. By contrast, a rise in global market uncertainty,
proxied by the VIX index, increases domestic CDS spreads. These effects are sizable: a one
standard deviation rise in credit ratings lowers CDS spreads by 0.15 of a standard deviation,
similar to the effect of a one standard deviation rise in equity prices. Standardized changes in
commodity prices, oil prices or the VIX, have smaller effects on CDS spreads. The main result is
robust and persistent: credit rating changes have important statistical and economic effects on
CDS spreads, even when controlling for a host of domestic and economic variables. However,
these responses are not stable over time or consistent across groups. CDS sensitivity to credit
rating changes was modest during the pre-crisis period and similar across the GIIPS and other
EU countries, but rose markedly during the crisis period, especially in the GIIPS group.
Moreover, CDS pricing dynamics changed from moderate to very low persistent between the
crisis and non-crisis periods.
As the credit rating scale does not correspond in any rigid way to economic fundamentals,
there is no prior reason to expect it to be linked in a linear manner to actual sovereign spreads.
Indeed, we find that the association between credit rating changes and spreads follows a
complicated non-linear pattern dependent on the level of the credit rating. Applying a non-linear
“spline” regression, we find high sensitivity (large change in spreads for a given change in
ratings) at the very low end of credit ratings and then a U shape—ratings at the moderately low
end (B-) and very high end of credit levels (above A) are fairly insensitive, while middle ratings
are quite sensitive to credit rating changes (with the highest sensitivity at the BB+ level--the
cutoff between speculative and low investment grade bonds). Although the response is largest in
magnitude at the lowest credit rating, this effect appears to emerge mainly during the crisis
period when the risk of sovereign default rises and markets price risk more aggressively. Our
results are robust to the inclusion of “outlook” and “watch” changes by the credit rating agencies
which may precede actual credit rating changes. In addition, contagion from changing the
ranking of the GIIPS on other euro countries, initially evident, disappears when own-country
credit rating changes are taken into account.
We start with a brief overview of the background literature (section 2) and the data (section
3), continue with the empirical analysis (section 4, with five sub-sections) and close with
concluding remarks.

5
2. Literature Review
The debate about the role and functioning of the credit rating agencies pre-dates the global crisis
of 2008-9 and its aftermath. While the great moderation period dampened the intensity of the
debate about the efficacy of the credit rating agencies, the global crisis of 2008-9, and the euro
crisis since 2010, again put to the fore concerns about the information content of, and the market
impact of credit ratings. A fundamental benevolent interpretation of the rating agencies is as
aggregators of costly information, ameliorating the market failure induced by costly information,
a market failure highlighted by Grossman and Stiglitz (1980)’s seminal paper. This view,
however, is challenged by the need to design the proper incentive structure for the rating
agencies, needed in order to deliver efficient outcomes. The design of such an incentive system
is a non-trivial challenge, and the welfare effects of the rating agencies remains a contestable
issue [see Kashyap and Kovrijnykh (2013)].3 Indeed, questions dealing with the economic
rationale for the design and the functioning of the rating industry are probably as old as the rating
industry itself.
Cantor and Packer (1994) pointed out that although credit ratings provide accurate rank-
orderings of default risk, the meaning of specific letter grades varies over time and across
agencies. Noting that current regulations do not explicitly adjust for agency differences, the
authors argue that a reassessment of the use of ratings and the adequacy of public oversight is
overdue. In their follow up paper, Cantor and Packer (1997) noted that regulations incorporate
private sector credit ratings to determine investment prohibitions and capital requirements for
institutional portfolio investments. These regulations implicitly assume that different agencies
have equivalent rating scales, despite the fact that some agencies assign systematically higher
ratings than others. They tested whether observed rating differences reflect different rating scales
or simply result from sample selection bias, and found only limited evidence of selection bias.
Partnoy (1999) also outlines a legalistic critical view of the role credit rating agencies in
providing information about bonds. The "reputational capital" view of credit rating agencies is
that the agencies have survived and prospered since the early 1900s based on their ability to
accumulate and retain good reputations by providing valuable information about the bonds they
rate. Partnoy argues, however, that this view fails to explain, and is inconsistent with, estimation 3 They analyze the optimal compensation schemes for the rating agencies that differ depending on whether a social planner, the firm, or investors order the ratings. They find that rating errors are larger when the firm orders it than when investors do. However, investors ask for ratings inefficiently often. They also show that competition among credit rating agencies causes them to reduce their fees, put in less effort, thus leading to less accurate ratings.
6
of credit spreads, the number of credit ratings-driven transactions, and the explosion in use
of credit derivatives. In place of the reputational capital view, he offers a "regulatory license"
view of rating agencies as generating value, not by providing valuable information, but by
enabling issuers and investors to satisfy certain regulatory requirements.
The heightened volatility and turbulence associated with the crises during the late 2000s
provided new and rich information, propagating insightful research. Alsakka and Gwilym
(2010a) analyzed lead–lag relationships in sovereign ratings across five agencies, and finds
evidence of interdependence in rating actions. Upgrade (downgrade) probabilities are much
higher, and downgrade (upgrade) probabilities are much lower for a sovereign issuer with a
recent upgrade (downgrade) by another agency. They find complex intertemporal patterns, where
lagged ranking changes by a rating agency tend to impact the future ranking changes of other
agencies. S&P tends to demonstrate the least dependence on other agencies, and Moody’s tends
to be the first mover in upgrades. Rating actions by Japanese agencies tend to lag those of the
larger agencies, although there is some evidence that they lead Moody’s downgrades. In a paper
that focuses on emerging markets, Alsakka and Gwilym (2010b) find that split-rated sovereigns
are prone to be upgraded (downgraded) by the agency from whom a lower (higher) rating exists.
In particular, they find that the harsher is the split ratings between two agencies, the greater the
effect on probabilities of future rating changes. The rating dynamics of Capital Intelligence,
Japan Credit Rating Agency and Japan Rating & Investment Information are affected by their
rating disagreements with the larger agencies. Only Moody's upgrade decisions are influenced by
rating differentials with the smaller agencies.
Some studies applied the event, case study methodology. Ismailescu and Kazemi (2010)
studied the effect of sovereign credit rating change announcements on the CDS spreads of the
event countries, and their spillover effects on other emerging economies’ CDS premiums. They
find that positive credit rating events have a greater impact on CDS markets in the two-day
period surrounding the event, and are more likely to spill over to other emerging countries. CDS
markets anticipate negative events, and previous changes in CDS premiums can be used to
estimate the probability of a negative credit event. A generic downside of event analyses is that
such studies are not informative regarding the longer term adjustments induced by rating
changes. This concern motivates us to focus on a monthly frequency in the empirical part of this
paper.

7
Bergman et al. (2013) consider daily CDS data for GIIPS countries and estimate the effects
of EU-wide and national monetary, fiscal and financial stability policy announcements. They
find that these announcements have economically important and statistically significant effects
on CDS spreads. Lucas et al. (2013) also consider the effects of several EU policy
announcements on CDS spreads. They find significant time-variation in distress dependence and
spill-over effects for sovereign default risk. The foreign exchange market reaction to of credit
ratings has been investigated by Alsakka and Gwilym (2013). They found that rating agencies’
signals do affect the own-country exchange rate and propagate spillover effects to other
countries’ exchange rates in the region. Furthermore, the impact of outlook and watch signals is
stronger than the impact of actual rating changes. Market reactions and spillovers are far stronger
during the financial crisis period, 2006-2010, than pre-crisis, 2000–2006. They also find
differential effects of the various agencies. Negative news from all three major agencies has an
impact, whereas only Moody’s positive news produces a reaction. Negative news from Fitch
tends to have the strongest effect. We will revisit these issues in our analysis, controlling for the
possible impact of “outlook” or “watch” signals on future ranking changes.
In terms of the broader literature on sovereign risk and CDS spreads, the crisis of 2008-9
also heralded renewed interest in the area and, perhaps, hitherto underpriced vulnerabilities.
Arghyroua and Kontonikasb (2012) focus on the Euro sovereign debt crisis. They find a shift in
market pricing behavior. Prior to the global credit crunch (January 1999 – July 2007) they find
that markets priced neither macro fundamentals nor the very low at the time international risk
factor. Markets, however, apparently changed the pricing mode to one driven by macro-
fundamentals and international risk during the crisis period. They also find evidence consistent
with contagion, particularly among euro periphery countries. Unlike the early stages of the euro
crisis, where contagion was mainly originating from Greece, the latter stages of the euro crisis
involved multiple sources of contagion.
Longstaff et al. (2011) find that most of sovereign credit risk appears related to global
rather than country-specific factors. In particular, they find that CDS spreads are more closely
related to US stock and high-yield markets than to local economic measures. Palladini and Portes
(2011) investigate sovereign CDS and bond pricing dynamics in the Eurozone and find that the
CDS market moves ahead of the bond market in terms of price discovery.
8
Aizenman et al. (2013), looking at the euro debt crisis in the context of the pricing of
sovereign debt of 50 countries, find a complex and time-varying environment, with a key role of
fiscal space in pricing sovereign risk, controlling for other relevant macro variables. A structural
break occurred during the turbulent 2008–10 crisis episode -- during the crisis, pricing of risk is
largely decoupled fiscal space measures, and the TED spread (a proxy for market volatility)
emerged as a key pricing factor in the crisis. The risk of default in the euro periphery countries
group appeared to be somewhat “underpriced” relative to international norms in the period prior
to the global financial crisis and substantially “overpriced” countries during and after the crisis,
especially in 2010, with actual CDS values much higher than the model predicts given
fundamentals.4
These results are also in line with Beirne and Fratzscher (2013), who showed that a
deterioration in countries' fundamentals and a sharp rise in the sensitivity of financial markets to
fundamentals were the main explanations for the rise in sovereign yield spreads and CDS spreads
during the crisis, not only for euro area countries but globally. Yet, empirical models with
economic fundamentals generally do a poor job in explaining sovereign risk in the pre-crisis
period for European economies, suggesting that the market pricing of sovereign risk may not
have been fully reflecting fundamentals prior to the crisis.
Against the background of this literature, we turn to evaluate the credit ratings and the
pricing of sovereign debt during the Euro crisis.
3. Data and Descriptive Statistics
We use monthly data in our analysis ranging from January 2005 to August 2012 for the
longest sample. Daily data on CDS prices taken from Markit5 is averaged into monthly values.
4 A potential explanation for the switch from under- to over-pricing of default risk is that markets were forward looking, not pricing entirely on current fundamentals but on expected further deterioration in future fundamentals, especially in the realm of fiscal space. Alternatively, the results are consistent with multiple equilibrium with an abrupt switch from a “good” (optimistic) expectations equilibrium in the Euro Area – to a “bad” (pessimistic) expectations equilibrium in these same countries – with high expected default rates and high interest rates where fiscal positions are not sustainable. While concerns about multiple equilbria in the euro zone pre-dated the euro crisis, the developments in the late 2000s sharpened the apprehensions about the fiscal lapses of the euro zone, and focused attention on the incompleteness of the euro project [see Morris and Shinn (2000) for the importance of agents’ uncertainty about economic fundamentals and the uncertainty about others' beliefs in explaining susceptibility to multiple equlibria]. 5 Markit receives contributed CDS data from market makers from their official books and records. According to the company, Markit “cleans” this data, testing it “…for stale, flat curves, outliers and inconsistent data.” If a

9
The data are five-year on-the-run CDS spreads in USD on sovereign bonds. The quoting
convention for CDSs is the annual premium payment as a percentage of the notional amount of
the reference obligation. The sovereign CDS spreads are reported in basis points, with a basis
point equals to $1,000 to insure $10 million of debt.6 The description, transformation and source
for each of the variables used in the empirical analysis is given the data appendix.
Table 1 provides summary statistics on the CDS spreads for the European countries in our
sample, showing country means, medians, standard deviations, minimum and maximum values
and the number of observations. The countries in our sample include all of the twenty-seven
European Union countries excepting Luxembourg. CDS data is not available for Luxembourg.
Table 1 shows the wide divergence in CDS spreads across EU countries, with the low end of the
spectrum (in terms of mean, median and standard deviations) represented by Finland and
Germany and the high end of the spectrum represented by Greece and, to a much lesser extent,
Cyprus and Portugal.7 Greece is the only country in the sample to have had a “credit event”
(partial or full default) on March 9, 2012 that triggered CDS payments.8
Figure 1 shows the evolution of CDS spreads for four groups of countries: EU members,
Euro Zone members, EU members that do not participate in the Euro Zone and the GIIPS
(Greece, Italy, Ireland, Portugal and Spain). Average values for each group are shown in the
figure. The GIIPS countries are dominating the sharp run-up in CDS spreads starting in 2010 for
the EU and Euro Area. The average over the full 2005-12 sample for GIIPS was 310 basis
points, while only 154 basis points for the Euro Area (83 for the Euro Area less GIIPS) and 134
basis points for the other EU (non-Euro Area). It is noteworthy that the non-Euro countries saw
only modest increases over the sample period.
contribution fails any one of these tests, they discard it. Markit states that they ensure superior data quality for an accurate mark-to-market and market surveillance. 6 For example, a spread of 197 basis points for a 10-year tenor means that it costs 197,000 USD to insure against 10,000,000 in sovereign debt for 10 years; 1.97% of notional amount needs to be paid each year, so 0.0197 x 10 million = $197,000 per year. 7 Interestingly, Finland has a lower average CDS spread and standard deviation than Germany. This may reflect the relatively stronger fiscal position of Finland, its successful resolution of a major banking crisis in the early 1990s and the perception that Germany may be politically pressured to provide particularly large amounts to fund EU-wide banking and fiscal bailouts. 8The International Swaps and Derivatives Association (ISDA), which determines whether a credit event has occurred, said the use of "collective action clauses (CACs) to amend the terms of Greek law governed bonds issued by The Hellenic Republic such that the right of all holders of the Affected Bonds to receive payments has been reduced." (Reported in Reuters, March 9, 2012).

10
The credit ratings are taken from Standard and Poor’s and Fitch, which apply an ordinal-
alphabetic scale reflecting an opinion about credit risk, i.e. the agency’s judgment about the
ability and willingness of a debtor to meet its obligations in full and on time. For example,
Standard and Poor’s provide 25 rating categories ranging from “AAA”, described as “extremely
strong capacity to meet financial commitments,” to “D”, described as “payment default on
financial commitments.” In their description of the credit ratings, Standard and Poor’ notes that
likelihood of default is the single most important factor in their assessment of creditworthiness,
but that reasons for ratings adjustments vary, and may be broadly related to overall shifts in the
economy or business environment or more narrowly focused on circumstances affecting a
specific industry, entity, or individual debt issue, e.g. the creditworthiness of a state or
municipality may be impacted by population shifts or lower incomes of taxpayers, which reduce
tax receipts and ability to repay debt (Standard and Poor’s, 2013). In terms of sovereign ratings,
Standard and Poor’s states that five factors form the foundation of their sovereign credit analysis:
institutional effectiveness and political risks; economic structure and growth prospects; external
liquidity and international investment position; fiscal performance and flexibility, as well as debt
burden; and monetary flexibility (Standard and Poor’s, 2012).
The alphabetic rating scales of the rating agencies together with our numerical rating
transformation are given in Table 2. The high end of the rating scale of both Fitch and Standard
and Poor’s is AAA, and is given the numerical index of 25. Seven countries in the sample -
Denmark, Finland, Germany, Luxembourg, Netherlands, Sweden and the U.K.- had the highest
rating (AAA) from both credit rating agencies for the entire sample period. The low end of the
ratings spectrum is D for Fitch at a numerical rating of 1. DD for Fitch and D for Standard and
Poor’s (their lowest rating) is numerical rated at 2. In our sample, however, the lowest rated
country is Greece, which ranges from A+ (numerical rating 21) for both credit rating agencies in
January 2004 to CCC (numerical rating 8) in August 2012. The average rating for Greece over
the sample period given by Fitch was 17.29 and given by Standard and Poor’s was 16.67.
The rating levels as well as changes in ratings and dates are given in Table 3. The ratings
used in the empirical analysis are the average ratings between each of the two numerical scales
for Standard Poor’s and Fitch. Usually these ratings coincide but not always. For example,
Ireland was rated BBB+ by Fitch and A by Standard and Poor’s in December 2010, but both
agencies rated Ireland BBB+ in August 2012. Greece and Bulgaria had the lowest average

11
ratings over the sample period. Greece had the largest number of downgrades during the sample
period (8), followed by Portugal (5). Bulgaria has only one downgrade as its rating was amongst
the lowest for the entire sample period. A number of countries had 4 downgrades over the
sample period. Several countries also had upgrades, in some cases on two occasions (Estonia,
Slovak Republic, Czech Republic, and Romania).
For illustrative purposes, Figure 2 shows the evolution of CDS spreads in Greece together
with vertical lines showing the dates of credit rating downgrades. The Greek CDS data runs until
the credit event announcement in March 2012. The announcement of CDS credit downgrades
appear to significantly increase Greek CDS spreads. The very high level of CDS in February
2012 in Greece clearly indicated the high expectation of an imminent credit event that would
result in CDS payments.
Figure 3 shows a scatter diagram of CDS spreads and credit ratings for the four groups of
EU countries—total EU, Euro Zone, GIIPS and EU less Euro Zone. The average CDS spread
and credit rating value for each country-month observation for the group is plotted in the figure.
A clear negative relationship between the credit rating level and CDS spreads is evident. CDS
spreads are much lower for highly rated sovereign bonds, indicating that market pricing is
expecting less likelihood of default. The relationship is particular evident for the GIIPS and, to a
lesser extent, for the Euro Area. This inverse relation is less strong for the non-Euro Area EU
countries. A credit rating of 16 in the GIIPS group appears consistent with two CDS pricing
equilibrium, 500 basis points and 2000 basis points. This is consistent with a “two equilibrium”
interpretation of broader empirical results discussed below. (The Euro group follows a similar
pattern, reflecting the pattern of the GIIPS members).
4. Empirical Results
4.1 Baseline Specification
This section presents our basic empirical results where we test the effect of changes in
credit rating changes on changes in CDS spreads, controlling for a host of country-specific and
global economic factors. We estimate dynamic panel regressions for 26 EU countries over
January 2005-August 2012 using monthly data. We estimate an equation of the form:
∆ , (1)

12
where is the change in the credit default swap spread (in basis points),
is the change in the credit rating scale variable, is a vector of country specific and global
control variables, and indicates country fixed effects.
Given that the error term and lagged dependent variable is correlated by construction, thus
introducing biased estimators, we estimate the dynamic model and use the Arellano and Bond
(1991) generalized method of moment (GMM) approach. The estimators are obtained from
moment equations constructed from further lagged levels of dependent variable and the first-
differenced errors. Given the endogeneity problem introduced by the lagged dependent variable,
further lags of ∆ are used as instruments (the number of lag is determined by 2 .
The Arellano and Bond (1991) procedure allows the introduction of other endogenous
variables. We treat contemporaneous credit rating changes endogenously in
our dynamic panel setting, and use its first lag as an instrument. Although the flexibility of GMM
estimation in dynamic panel model is favorable, this estimator is designed for datasets with a
large number of cross-section units (large N) and few time periods (T). The opposite case (large
T, small N) implies a large number of instruments, and may generate an over identification
problem. Given that our GMM dynamic panel model results are largely comparable with static
panel model, and the persistency in CDS changes is small, we can also utilize the GMM
estimators that incorporate the dynamic adjustment in CDS spreads9. We report robust standard
errors to control for heteroskedasticity and autocorrelation.
We have pre-tested with a number of possible country-specific and global control variables
including foreign exchange reserves, inflation, industrial production and unemployment. We
only report the control variables that are consistently statistically significant. The main result
linking change in credit ratings to change in CDS spreads is robust to every specification of the
equation irrespective of the included control variables.
We report the estimates from the baseline formulation of the model in Table 4. A one unit
rise in the average credit rating (ΔCreditRating) decreases CDS spreads within a very narrow
range for all of the seven estimated equations, ranging from -42 to -46 basis points. The
coefficient estimates are robust to inclusion of various controls, and all are significant at the 5
9 The static model estimates are not reported for brevity but are available upon request.

13
percent level of confidence.10 The control variables are also statistically significant at the one
percent level of confidence with the expected signs. A one percent rise in the domestic stock
price index lowers CDS spreads by -1.5 to -2.0 basis points. World commodity and oil price
increases also consistently decrease CDS spreads, likely because world economic conditions are
generally strong when these prices are rising. By contrast, a rise in the VIX index, reflecting
global market uncertainty, generally increases domestic CDS spreads. There is highly significant
but low persistence, with the lagged dependent variable coefficient estimates ranging from -0.03
to -0.05. The total observations range from 2338 to 2344 across model specifications.
To get a sense of the relative economic significance of these variables we show the results
of standardized variables in Table 5. Table 5 shows the previous results (Table 4) using
standardized coefficients (where the data is normalized as unit standard deviations around the
mean). The significance levels of the coefficients are not affected by this variable normalization.
This procedure indicates that a one standard deviation rise in credit ratings lowers CDS spreads
by -0.15 to -0.16 of a standard deviation, not dissimilar to the effect of a one standard deviation
rise in equity prices (-0.11 to -0.15). Standardized changes in commodity prices and oil prices
have smaller effects on CDS spreads, ranging from -0.07 to -0.12, while the VIX coefficients
range from 0.03 to 0.10. Clearly, credit rating changes have economically important effects on
CDS spreads, as well as statistically significant, even when controlling for domestic and global
economic variables.
4.2 Differential responses over time and across country-groupings
An important issue in the European sovereign debt crisis context is whether CDS pricing
has changed over time, or is different across EU countries. To address this issue we consider
differential responses over time, i.e. between the tranquil (2005-07) period and global crisis
(2008-12) period, and across country groups. The basic model specification for the EU is given
in the first panel of Table 6a with the heading “EU, including GIIPS.” This panel shows
estimates of the model for the full sample of EU countries, estimated for the pre-crisis and crisis
periods. While the model estimates for the global crisis period are virtually identical to the full
sample period (-42 point estimate), the estimates are very different for the pre-crisis sample. In
particular, a one notch credit rating rise is estimated to have increased CDS spreads by only 1.8 10 This range of coefficient estimates, -42 to -46, is very close to the -43 to -47 range of estimates in the static panel estimates. The results are robust throughout the various specifications to differences in estimation procedure.

14
basis points during 2005-07, but by 42.2 basis points during 2008-12. All estimates are
statistically significant at the 5% level or higher.
The other panels in Tables 6a and 6b report our investigation of systematic differences in
the response of CDS spreads to credit rating changes in particular country groupings, as well as
across pre-crisis and crisis periods. The second and third panels of Table 6a consider the Euro
Area group (16 countries) and the non-Euro EU group (10 countries), respectively. The
coefficient estimates on ΔCreditRating for the Euro group and non-Euro group indicate low
responsiveness of similar orders of magnitude during the pre-crisis period, at -0.62 and -1.93
respectively. (All estimates are statistically significant.) Divergences emerge during the crisis
period, however, with responsiveness rising in both groups but to a much larger extent in the
Euro Area. In particular, the sensitivity of spreads to credit ratings for the Euro Area (-45.2) is
estimated to be four times larger than the non-Euro Area (-11.4) the crisis period. This difference
explains the divergence in responsiveness between the two groups also evident in the coefficients
estimated for the full sample period.
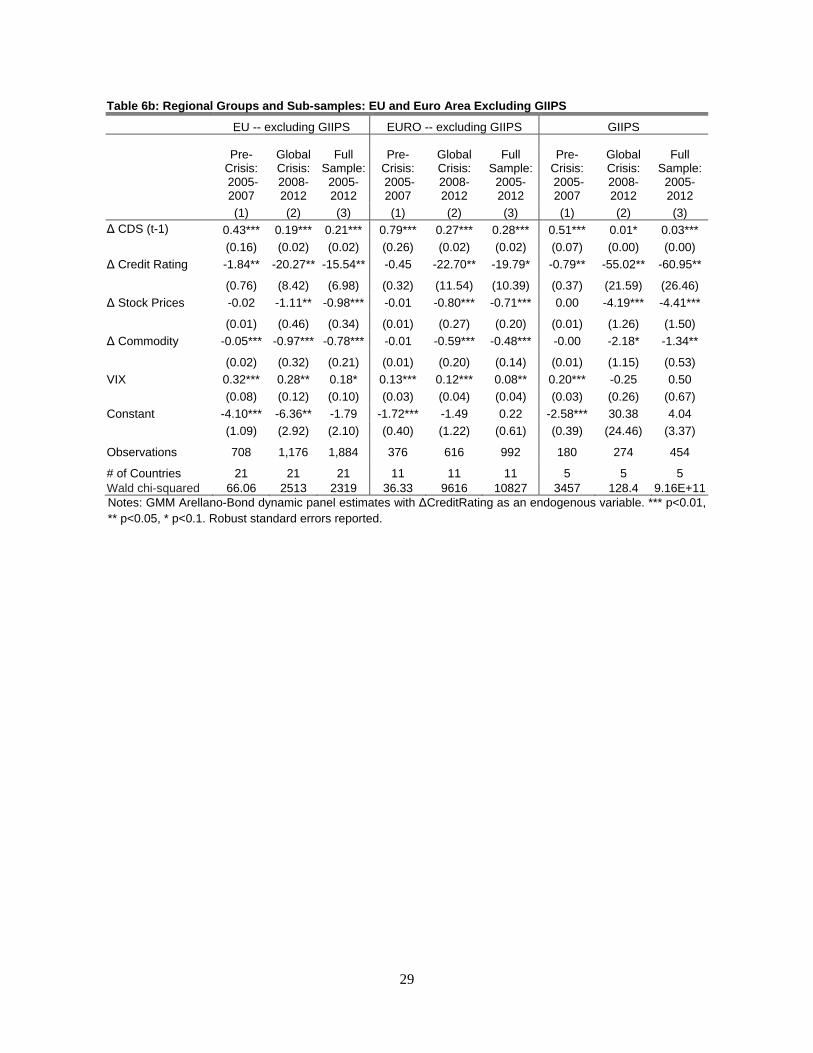
Table 6b reports a similar exercise but with the GIIPS group excluded from the EU and
Euro Area sample of countries in the first and second panels, and model estimates for the GIIPS
group separately reported in the third panel. The sensitivity to credit rating changes rise
markedly between the pre-crisis and crisis period for every country grouping. The EU and Euro
(excluding GIIPS) coefficient estimates for credit ratings are very similar in the crisis period, at
-20.2 and -22.7, respectively. This responsiveness is less than half of that of the GIIPS group
(-55.0). The lowest sensitivity, however, is that of the non-Euro group (third panel of Table 6a)--
the ten countries not participating in the Euro area, but members of the EU (Bulgaria, Czech
Republic, Denmark, Hungary, Latvia, Lithuania, Poland, Romania, Sweden, United Kingdom).
This indicates that the non-Euro EU group responded quite differently than the Euro Area
countries to changes in credit ratings.
Two other features of Tables 6a and 6b are noteworthy. First, the estimated degree of
persistence in CDS spreads drops markedly from the pre-crisis to crisis periods. The estimated
coefficient on the lagged dependent variable for the EU group (Table 6a, first panel) for the pre-
crisis sample is 0.43 and virtually zero for the crisis sample. Sharp declines in persistence
between the pre-crisis and crisis periods are evident in all of the country-group estimates. (The

15
smallest decline, from 0.35 to 0.14, is in the non-Euro group). This suggests much more
randomness and less predictability of CDS spreads during the crisis. Second, CDS responses to
changes in the control variables also shift between the two periods. Generally, domestic stock
and global commodity price fluctuations play a much larger in CDS pricing during the crisis
period across the various country groupings. Fluctuations in VIX, by contrast, seem to play a
consistent role in CDS pricing across the pre-crisis and crisis samples (positive and significant,
with similar estimated magnitudes).
These results indicate that two different pricing mechanisms were at work in the pre-crisis
and crisis periods—highly sensitive responses during the crisis period and fairly muted responses
during the “tranquil” pre-crisis period. This supports work by Aizenman et al. (2013) and De
Grauwe and Ji (2013) and others and may support a “good” (pre-crisis) and “bad” (crisis)
equilibrium interpretation of events.
4.3 Nonlinearity
One issue raised in the context of the European sovereign debt crisis is whether the
response of market risk perceptions, as reflected in CDS spreads, to credit rating changes might
be conditional upon the level of the credit rating. That is, do CDS spreads in countries with lower
credit ratings respond more to credit rating downgrades than do spreads in countries with higher
credit ratings? We test for these non-linear effects in Table 7. In these specifications we include
an interaction term that multiplies the change in the credit rating by the credit rating level
( ∗ ). Combining the two coefficients and the level of credit ratings
therefore allows us to test and measure whether the CDS response changes systematically with
the level of the credit rating at the time of the downgrade (or upgrade). The specific functional
form is given by:
∆ ∆ , ∗
(2)
The results reported in Table 7 are again statistically significant with the expected signs of
the coefficients, and are robust and stable. In particular, the negative term (-282 to -288) on
indicates the fall in CDS spreads for a country with an initial credit rate of
zero. The coefficient on ∗ , ranging from 14.1 to 14.4, is

16
interpreted as the marginal effect on the response for a given level of initial credit. The higher the
initial credit rating level, the less is the response of credit rating upgrades (downgrades). For
example, our estimates (using model 7) suggest that a rise in the credit rating of a country (e.g.
Greece) from CCC (8) to CCC+ (9) would result in a reduction in the CDS spread by -170 points
(= -282.51+14.23*8), while a rise in credit rating for a country (e.g. Romania) with an initial
rating of BBB- (16) to BBB (17) would decrease CDS spreads by -55 points. Clearly, the CDS
response of credit rating changes to initially lower rated credits are much stronger than higher
rated credits. In addition, the significance levels, signs and magnitudes of all of the control
variables in the regressions of Table 7 are virtually identical to Table 4, indicating a set of stable
and robust results.
One issue that arises with the specification of our interaction term for the regressions in
Table 7 is that the linear specification gives unrealistic estimates once the level of credit ratings
reach 20 and beyond (using regression model seven of Table 7). At this point, very small
estimated negative effects (the expected effect a priori) turn to positive estimated effects of a
rating rise. To address this issue, we considered several non-linear functional response forms11,
the most promising of which is the piecewise linear regression model using the “spline”
functional form12. The spline function allows several step discrete changes in the response of
CDS ratings to credit rating changes. In particular, the effect on CDS spreads from a one unit rise
in credit ratings may generally be declining the higher is the level of the credit rating, but there
may also be several distinct threshold points (knots) where the marginal changes shift.
Spline estimation requires selection of the number of knots as well as the threshold points
(placement of knots). As an initial starting point to begin the estimation we chose two knots
since the country ratings are located mainly in three regions, namely As, Bs and Cs.13 In order to
find optimal location of these knots, we follow a two-stage procedure. First, we regress rating
changes on level of rating by arbitrarily choosing initial knots of rating cut-offs 19 (A- and
above) and 10 (B- and above), which gives the following equation:
∆ 10 19 . (3)
11 We also considered ΔCreditRating squared to capture non-linear effects and different effects for each level of credit rating. These results are omitted for brevity but are available from the authors upon request. 12 See Green (2012; pages 158-160) for an excellent discussion of this technique. 13 We also extended the work to three knots. The third knot threshold was not statistically significant.

17
Second, using the initial parameters and knot values, we implement a non-linear
optimization for spline placement.14 The non-linear estimation of the model is an iterative, grid
search process, where the residuals sum of squares at each combination of parameter values are
evaluated to determine the set of parameter values producing the lowest residual sum of squares.
∆ , 0
, 0 , (4)
where the initial values for each alpha are corresponding betas from first equation. For knot
placement, we again start with initial values of 10 and 19 for x1 and x2. We have also tried
different initial values for knot placement at both first and second equation. The estimation
results from second model gives k1=8.65 (between CCC and CCC+) and k2=14.5 (between BB
and BB+). Finally, using these two knot placements, we estimate the fixed effect model
involving the interaction of rating changes and rating level that we call spline estimation in
equation (5).
The spline function estimated and presented in the tables is given by:
∆ ∆ , 3 ∗
8.65
14.5 , (5)
where d1 = 1 if rating >= 8.65, zero otherwise; and d2 = 1 if rating >=14.5, zero otherwise.
We report the spline function form in Table 8 and graph the estimated responses for each
credit level for the full period in Figures 4a and 4b.
Figure 4a indicates that the response to a credit rate change is very large at the lowest
credit ratings in our sample, with an estimated CDS response of -150 basis points associated
when a credit rating of CCC- (scale 7) is upgraded to CCC (scale 8). However, the CDS response
becomes much less sensitive (less negative) at somewhat higher ratings, implausibly positive in
the 9-11 basis point range, and then gradually increasing. The shift from large negative to
14 We use nl command in Stata to implement nonlinear estimation. The nl estimation fits the non-linear function by least squares using the alternative iterative methods including gradient method, Newton and Marquardt method, etc. For further details on non-linear estimation implemented, see Davidson and McKinnon (2004, ch.6).

18
slightly positive is probably due to the large role played by Greece at the low end of the
spectrum, making the results fragile in this range. The relevant range of credit ratings, excluding
the low end of the range only occupied by Greece during our sample period, is shown in Figure
4b. This figure shows insensitivity of response at a B+ rating (scale of 12), reaching at maximum
negative point of around -40 basis points at a BB+ credit rating (scale of 15) and gradually
becoming less sensitive for higher credit ratings. A credit rating rise from AA- (22), for example,
results in almost no change in CDS spread. The local maximum (-40) estimated at the BB+
rating may be attributable to the fact that this level represent the cutoff point between high
speculative grade (BB+) and low investment grade (BBB-) bond ratings. Regulatory restrictions
on portfolios, or portfolio habitat preference, may make this threshold points especially
important for risk assessment and pricing of bonds.
4.4 Outlook and Watch Changes Our general objective in this research paper is to evaluate the information value provided by
credit rating agencies in the market pricing of sovereign default risk. As in any asset market, only
“surprise” or unanticipated credit rating changes, which are also valued by the market, should
impact CDS spreads. In addition to credit ratings, however, credit rating agencies also provide
signals about the possibility of future credit rating changes. These signals, for S&P credit rating
agencies (the other CRAs have similar designations), take the form of either “outlook” or
“watch” designations. The outlook and watch designations may be positive, negative, stable or
developing (explained as uncertain as to whether the change may be positive or negative) in
terms of the likelihood of a future ratings changes. The outlook horizon is defined by S&P as six
to twenty-four months ahead, and the watch horizon is within three months.
Our estimates of the effect of credit rating changes on CDS spreads may be bias downwards
to the extent that an actual credit rating change incorporates an expected component (signaled
previously by a outlook or watch change) and an unexpected component. In principal, only the
unexpected component presumably would affect CDS spreads. Since actual credit rating changes
include both components, the net effect would be the average of expected and unexpected, and
tend to bias downwards the estimated effect.
We include changes in outlook or watch signals from S&P and Fitch in our basic regressions
in order to control for this potential source of bias. These results are reported in Table 9. Various

19
specifications of the basic model are reported and the results are robust to the different forms. In
particular, a negative change in a signal (from stable to negative, or from positive to stable)
raises CDS spreads by 15-25 basis points, while a positive change in the signal (from steady to
positive or negative to steady) has no measurable impact. Most important for the purposes of our
study, however, is that the effect of credit rating changes on CDS spreads does not change when
changes in the signals are included in the regression (the point estimates remain in the -41 to -43
range and are significant at the five percent level of confidence).
4.5 Contagion
An issue that frequently arises in the context of the European sovereign debt crisis is to
what extent might there be contagion from the GIIPS group to other countries in the EU. Several
recent papers have addressed the issue of contagion using CDS spreads or sovereign yields (e.g.
Beirne and Fratzscher, 2013).15 We are concerned in this section, by contrast, with the
transmission of changes in credit ratings in the GIIPS area with changes in CDS spreads in other
areas outside of GIIPS. We measure GIIPS rating changes in two ways. The first method
(“Aggregate GIIPS Rating Index”) measures the sum of the GIIPS rating changes in a given
month, e.g. in a given month, if three of the GIIPS countries are downgraded one notch, one
GIIPS country is downgraded by two notches, and one country is not downgraded, then the
indicator would register a five notch change. The second method (“Maximum GIIPS Rating
Index”) measures the maximum of the changes in GIIPS, e.g. if during a given month, one
country was downgraded by two notches, and the others by one notch, then the indicator would
register a two notch change.
The results are shown in Table 10. The results on the Euro Area (less GIIPS) are given in
columns (1)-(2) for the aggregate method and (5)-(6) for the maximum method. The results for
transmission from GIIPS credit rating changes to the non-Euro EU group are given in columns
(3)-(4) for the aggregate method, and in columns (7)-(8) for the maximum method.
15 A number of studies have considered various aspects of contagion. For example, Mink and De Haan (2013) consider how Greece “news” during the crisis in 2010 transmitted to 48 banks in Greece and elsewhere in Europe. Beetsma et al. (2013) explore co-movements among interest spreads vis-à-vis Germany on European public debt and spillovers in response to macroeconomic and financial news. They investigate both how “news” affected domestic interest spreads and how it was propagated to other countries during the recent crisis period, thereby distinguishing between the so-called GIIPS countries (Greece, Italy, Ireland, Portugal and Spain) and other European countries.

20
Both measurement methods give consistent results. There is initially evidence of contagion
from GIIPS to other countries in the Euro Area, but this effect disappears when own-country
credit rating changes are taken into account. Evidence of contagion from GIIPS rating changes to
CDS spreads in the non-Euro group is even weaker—no significant transmission is found
regardless of the specification of the model or measurement of GIIPS index rating. This evidence
indicates that concerns about contagion from the GIIPS to other countries in the EU may be
exaggerated.
5. Conclusion
Risk assessments on sovereign bonds by credit rating agencies bonds are a systematically
important determinant of credit default swap spreads in the EU. Credit rating agencies play an
important role in the pricing of sovereign risk—rating changes are informative, significant
economically, and the marginal information value is robust to controlling for conventional
economic fundamentals.
However, our paper reveals a complex and time varying association between credit ratings
and the pricing of sovereign debt during the Euro crisis. The association between credit rating
changes and CDS spreads shifts between the pre-crisis and crisis periods. European countries had
quite similar CDS responses to credit rating changes during the pre-crisis period, but large
differences emerged during the crisis period between the now highly-sensitive GIIPS group and
other European country groupings (EU and Euro Area excluding GIIPS, and the non-EU area).
The response is largest in magnitude at the lowest credit rating but these effects appear to emerge
mainly during the crisis period when the risk of sovereign default rises and markets price risk
more aggressively.
The association between credit rating changes and CDS spreads appears to follow a
complicated non-linear pattern dependent on the level of the credit rating. Applying a non-linear
“spline” regression, we find high sensitivity (large change in spreads for a given change in
ratings) at the very low end of credit ratings and then a U shape—ratings at the moderately low
end and very high end of credit levels are fairly insensitive, while middle ratings are quite
sensitive to credit rating changes. The threshold where sovereign bond ratings climb from
speculative to low investment grade status appears particularly sensitive, perhaps because of
regulatory or preferred portfolio habitat considerations.

21
On the other hand, we do not find contagion from GIIPS credit downgrades to CDS
spreads in other Euro Area countries once own-country credit rating changes are taken into
account. This result suggests that fears of contagion may be exaggerated. Market pricing of
sovereign default risk is determined by a host of domestic and global macroeconomic factors,
including the country’s own CRA ratings, and these linkages may vary over time and have non-
linear elements. But contagion from GIIPS CRA ratings to market pricing of risk in other EU
member countries does not appear to be a critical factor.
The heightened sensitivity of markets to news and credit rating changes during the
sovereign debt crisis episode in Europe, particularly among the GIIPS, and evidence of
especially large responses when credit ratings are already at low levels, suggests a shift in the
underlying market pricing of sovereign default risk. These results are consistent with multiple
equilibrium in market pricing of sovereign default risk and raises questions about the consistency
between market perceptions of risk and assessments made by credit rating agencies. However,
this may not be a “pure” multiple equilibrium explanation with the economy alternating
randomly between “good” and “bad” states, but rather may contain an element of “rational
inattention” by investors. In the first years of EMU investors may not have focused on
fundamental asymmetries and weakness in the system that, combined with major economic
shocks such as the global financial crisis, could lead to sharply increased risk of sovereign
default. Once markets focus on these risks, it may be difficult to return to financial market
tranquility without fundamental changes in EU institutions and fiscal conditions among EMU
member states.
22
References
Aizenman, J., Hutchison, H., and Jinjarak,Y. (2013), ‘What is the Risk of European Sovereign Debt Defaults? Fiscal Space, CDS Spreads and Market Pricing of Risk’ Journal of International Money and Finance, 34, 37-59.
Alsakka, R., and ap Gwilym, O. (2010a),’Split sovereign ratings and rating migrations in emerging economies’, Emerging Markets Review 11, 79–97.
Alsakka, R., and ap Gwilym, O., (2010b), ‘Leads and lags in sovereign credit ratings’ Journal of Banking & Finance, 34, 2614–2626.
Alsakka, R., and ap Gwilym, O., (2013), ‘Rating agencies’ signals during the European sovereign debt crisis: Market impact and spillovers’, Journal of Economic Behavior & Organization, 85, 144–162.
Arellano, M., and S. Bond (1991). “Some tests of specification for panel data: Monte Carlo evidence and an application to employment equations”. Review of Economic Studies 58: 277-297.
Arghyroua, M. G., and Kontonikasb, A., (2012), ‘The EMU sovereign-debt crisis: Fundamentals, expectations and contagion’ J. of Int. Fin. Markets, Inst. and Money, 22, 658– 677.
Beetsma, R., Giuliodori,M., de Jong, F., and Widijanto, D., (2013), ‘Spread the news: The impact of news on the European sovereign bond markets during the crisis’, Journal of International Money and Finance, 34, 83-101.
Beirne, J., and Fratzscher, M., (2013), ‘The pricing of sovereign risk and contagion during the European sovereign debt crisis’, Journal of International Money and Finance, 34, 60–82.
Bergman, M., Hutchison, M. and Jensen, S., (2013), ‘Do sound public finances require fiscal rules or is market pressure enough?’, European Commission, Directorate-General for Economic and Financial Affairs, European Economy Economic Papers No 489 (April).
Cantor, R., and Packer, F., (1994), ‘The credit rating industry’, FRBNY Quarterly Review, Fall-summer, 1-26.
Cantor, R., and Packer, F., (1997), ‘Differences of opinion and selection bias in the credit rating industry’, Journal of Banking & Finance 21, 1395-1417.
Davidson, R., and MacKinnon, J. G., (2004). Econometric Theory and Methods. New York: Oxford University Press.
De Grauwe, P., and Ji, Y., (2013) ‘Self-fulfilling crises in the Eurozone: An empirical test’ Journal of International Money and Finance, 34, 15-36.
European Commission (2013), “New rules on credit rating agencies (CRAs) – frequently asked questions”, MEMO/13/13 Event Date: 16/01/2013.
Greene, W. H., (2003) Econometric Analysis. Fifth Edition, Prentice Hall (New Jersey). Grossman J. S. and J. E. Stiglitz, (1980) ‘On the Impossibility of Informationally Efficient
Markets’, American Economic Review, 70 (3): 393-408Ismailescu, I., and Kazemi, H., (2010), ‘The reaction of emerging market credit default swap spreads to sovereign credit rating changes’, Journal of Banking & Finance, 34, 2861–2873.
Kashyap, A. and N. Kovrijnykh, (2013), ‘Who Should Pay for Credit Ratings and How?’ NBER Working Paper # 18923.
Longstaff, F. A., Pan, J., Pedersen, L. H., and Singleton, K. J., (2011), ‘How Sovereign Is Sovereign Credit Risk?’, American Economic Journal: Macroeconomics, American Economic Association, vol. 3(2), pages 75-103.
Lucas, A., Schwaab, B. and Zhang, X. (2013), ‘Conditional euro area sovereign default risk’, Sveriges Riksbank Working Paper Series No. 269 (May).

23
Mink, M., and De Haan, J., (2013), ‘Contagion during the Greek sovereign debt crisis’, Journal of International Money and Finance, 34, 102-113.
Morris S. and Shin H. S., (2000), ‘Rethinking Multiple Equilibria in Macroeconomic Modeling,’ NBER Macroeconomics Annual, 15, 139-161.
Palladini, G., and Portes, R., (2011), ‘Sovereign CDS and Bond Pricing Dynamics in the Euro-area’, NBER Working Papers 17586.
Partnoy, F., (1999), ‘The Sikel and Ebert of Financial Markets? Two Thumbs down for the Credit Rating Agencies’, Washington University Law Quarterly, 77 (3) pp 619 – 718.
Standard and Poor’s (2012), “How we rate sovereigns,” in Global Ratings Portal: Ratings Direct (March 13).
Standard and Poor’s Rating Services (2013), “Credit Ratings Definitions & FAQs,” website information page: http://www.standardandpoors.com/ratings/definitions-and-faqs/en/us#def_3.

24
Table 1: Descriptive Statistics for Sovereign Credit Default Swap Spreads
Mean Median SD Minimum Maximum N
Euro Area
Austria 57.82 53.23 62.50 1.61 205.09 92
Belgium 76.32 34.03 91.48 2.05 326.52 92
Cyprus 242.76 65.08 418.86 5.70 1577.84 91
Estonia 122.37 94.87 149.45 3.93 686.72 92
Finland 24.40 19.59 24.92 1.15 83.63 92
France 50.17 23.22 62.26 1.52 211.76 92
Germany 28.82 21.26 30.45 1.38 102.02 92
Greece 812.25 52.76 2019.63 5.05 10633.20 86
Ireland 220.77 102.63 276.82 1.88 986.28 92
Italy 125.60 69.53 152.25 5.76 536.11 92
Malta 111.38 71.95 127.27 4.86 417.17 91
Netherlands 37.93 32.63 38.10 1.15 121.42 83
Portugal 262.29 53.72 396.86 4.11 1323.36 92
Slovak Republic 76.29 61.38 81.35 5.67 295.33 92
Slovenia 86.67 55.55 119.74 3.57 475.97 92
Spain 129.00 65.38 158.19 2.43 582.52 92
Other EU, Non-Euro
Bulgaria 186.09 198.40 151.35 13.73 610.25 92
Czech Republic 66.30 70.66 62.66 4.96 302.21 92
Denmark 36.79 30.61 42.27 1.27 131.85 92
Hungary 214.17 187.52 189.60 12.19 642.22 92
Latvia 247.60 224.02 251.82 5.63 1038.80 92
Lithuania 187.92 201.09 183.16 5.90 766.59 92
Poland 104.16 99.48 91.17 7.98 362.81 92
Romania 215.62 221.41 174.26 17.22 712.40 92
Sweden 29.04 24.25 31.06 1.31 129.36 92
United Kingdom 48.25 57.99 38.03 1.25 143.73 77 Notes: The table reports summary statistics of monthly average for five-year sovereign CDS contracts for the January 2005 to August 2012 period. CDS spreads are measured in basis points.

25
Table 2: Linear Scaling of Credit Ratings
Fitch Ratings S&P Ratings Numerical Scale AAA AAA 25 AA+ AA+ 24 AA AA 23 AA- AA- 22 A+ A+ 21 A A 20 A- A- 19 BBB+ BBB+ 18 BBB BBB 17 BBB- BBB- 16 BB+ BB+ 15 BB BB 14 BB- BB- 13 B+ B+ 12 B B 11 B- B- 10 CCC+ CCC+ 9 CCC CCC 8 CCC- CCC- 7 CC CC 6 C - 5 RD R 4 DDD SD 3 DD D 2 D 1
Source: Fitch and Standard and Poor's websites, and authors’ calculations.

26
Table 3: Average Sovereign Ratings, Downgrades and Upgrades
Average Ratings Number of Downgrades Number of Upgrades
Fitch S&P Fitch S&P Fitch S&P
Austria 25.00 24.91 - 1 - -
Belgium 23.74 23.89 1 1 1 -
Cyprus 20.75 19.68 4 6 1 1
Estonia 19.76 20.17 2 1 2 2
Finland 25.00 25.00 - - - -
France 25.00 24.91 - 1 - -
Germany 25.00 25.00 - - - -
Greece 17.29 16.67 8 8 1 1
Ireland 22.88 22.98 4 6 - -
Italy 21.93 20.92 3 3 - -
Luxembourg 25.00 25.00 - - - -
Malta 20.67 19.91 - 1 1 -
Netherlands 25.00 25.00 - - - -
Portugal 21.39 20.18 5 5 - -
Slovak R. 20.45 20.29 - 1 2 2
Slovenia 22.49 22.61 3 3 1 1
Spain 24.18 23.80 4 5 - -
Bulgaria 16.42 17.16 1 1 1 2
Czech R. 20.51 19.92 - - 2 2
Denmark 25.00 25.00 - - - -
Hungary 17.30 17.13 4 4 - -
Latvia 17.08 16.70 4 5 1 2
Lithuania 18.33 18.30 3 3 1 1
Poland 18.74 18.72 - - 1 1
Romania 15.95 15.40 1 1 2 1
Sweden 25.00 25.00 - - - -
UK 25.00 25.00 - - - -
Source: Fitch and Standard and Poor's websites, and authors’ calculations.

27
Table 4: CDS Spreads and Credit Ratings
(1) (2) (3) (4) (5) (6) (7) ∆ CDS (t-1) 0.05** 0.05** 0.04** 0.04** 0.04** 0.03*** 0.04***
(0.02) (0.02) (0.02) (0.02) (0.01) (0.01) (0.02) ∆ Credit Rating -45.87** -43.07** -45.12** -43.55** -43.80** -43.85** -42.54**
(19.87) (18.94) (19.74) (19.77) (19.65) (19.63) (18.97) ∆ Stock Prices -1.96*** -1.47***
(0.57) (0.53) ∆ Commodity -1.66*** -1.31*** -0.94***
(0.32) (0.22) (0.22) VIX 1.09*** 0.70*** 0.79*** 0.37**
(0.28) (0.22) (0.29) (0.16) ∆ Oil Price -0.93***
(0.16)
Constant 5.50* 4.75 6.91** -18.16*** -8.50*** -10.70*** -2.32
(3.27) (2.99) (3.49) (3.04) (1.53) (3.33) (2.04)
Observations 2,344 2,338 2,344 2,344 2,344 2,344 2,338
# of Countries 26 26 26 26 26 26 26
Wald chi-squared 186 860 306 289 315 289 1131
Notes: GMM Arellano-Bond dynamic panel estimates with ∆CreditRating as an endogenous variable. *** p<0.01, ** p<0.05, * p<0.1. Robust standard errors reported.
Table 5: CDS Spreads and Credit Ratings: Standardized Coefficients
(1) (2) (3) (4) (5) (6) (7) ∆ CDS (t-1) 0.04* 0.04** 0.04** 0.03* 0.03** 0.03** 0.04**
(0.02) (0.02) (0.02) (0.02) (0.02) (0.01) (0.02) ∆ Credit Rating -0.16** -0.15** -0.15** -0.15** -0.15** -0.15** -0.15**
(0.07) (0.06) (0.07) (0.07) (0.07) (0.07) (0.06) ∆ Stock Prices -0.15*** -0.11***
(0.04) (0.04) ∆ Commodity -0.12*** -0.10*** -0.07***
(0.02) (0.02) (0.02) VIX 0.10*** 0.06*** 0.07*** 0.03**
(0.03) (0.02) (0.03) (0.01) ∆ Oil Price -0.08***
(0.01)
Observations 2,302 2,298 2,302 2,302 2,302 2,302 2,298
# of Countries 26 26 26 26 26 26 26
Wald chi-squared 160.1 699.8 264.1 239.7 261.5 235.6 901.3
Notes: GMM Arellano-Bond dynamic panel estimates with ∆CreditRating as an endogenous variable. *** p<0.01, ** p<0.05, * p<0.1. Robust standard errors reported.

28
Table 6a: Regional Groups and Sub-samples --EU and Euro Area Including GIIPS
EU (including GIIPS) EURO (including GIIPS) Non-Euro
Pre-Crisis: 2005-2007
Global Crisis: 2008-2012
Full Sample: 2005-2012
Pre-Crisis: 2005-2007
Global Crisis: 2008-2012
Full Sample: 2005-2012
Pre-Crisis: 2005-2007
Global Crisis: 2008-2012
Full Sample: 2005-2012
(1) (2) (3) (1) (2) (3) (1) (2) (3) ∆ CDS (t-1) 0.43*** 0.01 0.04*** 0.73*** 0.01 0.04*** 0.35** 0.14*** 0.17***
(0.16) (0.02) (0.02) (0.22) (0.01) (0.01) (0.17) (0.03) (0.02)
∆ Credit Rating -1.77** -42.16*** -42.54** -0.62*** -45.15** -48.83** -1.93* -11.41* -7.33*
(0.70) (15.52) (18.97) (0.23) (17.61) (21.95) (1.11) (6.42) (4.05)
∆ Stock Prices -0.02 -1.56*** -1.47*** -0.01 -1.80** -1.72** -0.02 -1.32 -1.19*
(0.01) (0.59) (0.53) (0.01) (0.74) (0.76) (0.02) (0.86) (0.66)
∆ Commodity -0.04*** -1.30*** -0.94*** -0.01 -1.11*** -0.79*** -0.09*** -1.46** -1.16***
(0.01) (0.38) (0.22) (0.01) (0.39) (0.20) (0.03) (0.62) (0.43)
VIX 0.30*** 0.28** 0.37** 0.15*** 0.14 0.36 0.52*** 0.54* 0.34
(0.07) (0.13) (0.16) (0.02) (0.11) (0.23) (0.15) (0.32) (0.23)
Constant -3.84*** -0.75 -2.32 -1.92*** 6.39 -0.27 -6.74*** -13.46* -5.12
(0.90) (7.28) (2.04) (0.30) (9.14) (1.55) (1.99) (7.67) (4.70)
Observations 888 1,450 2,338 556 890 1,446 332 560 892
# of Countries 26 26 26 16 16 16 10 10 10
Wald chi-squared 77.49 306.8 1131 79.43 209.1 2176 56.45 1077 1031 Notes: GMM Arellano-Bond dynamic panel estimates with ∆CreditRating as an endogenous variable. *** p<0.01, ** p<0.05, * p<0.1. Robust standard errors reported.
29
Table 6b: Regional Groups and Sub-samples: EU and Euro Area Excluding GIIPS
EU -- excluding GIIPS EURO -- excluding GIIPS GIIPS
Pre-Crisis: 2005-2007
Global Crisis: 2008-2012
Full Sample: 2005-2012
Pre-Crisis: 2005-2007
Global Crisis: 2008-2012
Full Sample: 2005-2012
Pre-Crisis: 2005-2007
Global Crisis: 2008-2012
Full Sample: 2005-2012
(1) (2) (3) (1) (2) (3) (1) (2) (3) ∆ CDS (t-1) 0.43*** 0.19*** 0.21*** 0.79*** 0.27*** 0.28*** 0.51*** 0.01* 0.03***
(0.16) (0.02) (0.02) (0.26) (0.02) (0.02) (0.07) (0.00) (0.00)
∆ Credit Rating -1.84** -20.27** -15.54** -0.45 -22.70** -19.79* -0.79** -55.02** -60.95**
(0.76) (8.42) (6.98) (0.32) (11.54) (10.39) (0.37) (21.59) (26.46)
∆ Stock Prices -0.02 -1.11** -0.98*** -0.01 -0.80*** -0.71*** 0.00 -4.19*** -4.41***
(0.01) (0.46) (0.34) (0.01) (0.27) (0.20) (0.01) (1.26) (1.50)
∆ Commodity -0.05*** -0.97*** -0.78*** -0.01 -0.59*** -0.48*** -0.00 -2.18* -1.34**
(0.02) (0.32) (0.21) (0.01) (0.20) (0.14) (0.01) (1.15) (0.53)
VIX 0.32*** 0.28** 0.18* 0.13*** 0.12*** 0.08** 0.20*** -0.25 0.50
(0.08) (0.12) (0.10) (0.03) (0.04) (0.04) (0.03) (0.26) (0.67)
Constant -4.10*** -6.36** -1.79 -1.72*** -1.49 0.22 -2.58*** 30.38 4.04
(1.09) (2.92) (2.10) (0.40) (1.22) (0.61) (0.39) (24.46) (3.37)
Observations 708 1,176 1,884 376 616 992 180 274 454
# of Countries 21 21 21 11 11 11 5 5 5 Wald chi-squared 66.06 2513 2319 36.33 9616 10827 3457 128.4 9.16E+11Notes: GMM Arellano-Bond dynamic panel estimates with ∆CreditRating as an endogenous variable. *** p<0.01, ** p<0.05, * p<0.1. Robust standard errors reported.

30
Table 7: CDS Spreads and Credit Ratings with Interaction Effects
(1) (2) (3) (4) (5) (6) (7)
∆ CDS (t-1) 0.05** 0.05*** 0.04*** 0.04** 0.04*** 0.03*** 0.04***
(0.02) (0.02) (0.01) (0.01) (0.01) (0.01) (0.01)
∆ Credit Rating -286.88*** -281.70*** -285.41*** -287.58*** -286.23*** -285.21*** -282.51***
(36.65) (36.37) (38.34) (38.88) (39.55) (40.80) (38.40)
∆Credit Rating*Crdt Level 14.29*** 14.14*** 14.25*** 14.48*** 14.38*** 14.32*** 14.23***
(2.40) (2.42) (2.51) (2.56) (2.60) (2.67) (2.55)
∆ Stock Prices -1.92*** -1.39***
(0.54) (0.46)
∆ Commodity -1.65*** -1.26*** -0.91***
(0.34) (0.21) (0.22)
VIX 1.15*** 0.77*** 0.88** 0.46*
(0.35) (0.30) (0.38) (0.23)
∆ Oil Price -0.84***
(0.18)
Constant 5.48* 4.73 6.88* -19.44*** -10.17*** -12.70** -4.25*
(3.32) (3.04) (3.56) (4.49) (3.12) (5.15) (2.36)
Observations 2,344 2,338 2,344 2,344 2,344 2,344 2,338
# of Countries 26 26 26 26 26 26 26
Wald chi-squared 1200 3064 1067 1080 912.5 808.2 2201 Notes: GMM Arellano-Bond dynamic panel estimates with ∆CreditRating and interaction terms as an endogenous variable. *** p<0.01, ** p<0.05, * p<0.1. Robust standard errors reported.

31
Table 8: CDS Spreads and Credit Ratings: Spline Function
(1) (2) (3) (4) (5) (6) (7)
∆ CDS (t-1) 0.08*** 0.07*** 0.07*** 0.06*** 0.06*** 0.06*** 0.07***
(0.02) (0.02) (0.01) (0.01) (0.01) (0.01) (0.01)
∆ Credit Rating -1,020.07***-1,010.89***-1,027.76*** -1,013.95*** -1,022.32*** -1,015.74*** -1,015.92***
(5.78) (6.71) (4.66) (5.39) (4.97) (5.07) (5.23)
∆Rating*scale 124.00*** 123.08*** 125.14*** 122.87*** 124.20*** 123.15*** 123.62***
(0.95) (0.96) (0.84) (0.95) (0.90) (0.91) (0.83)
d1*∆Rating*(scale-8.65) -141.12*** -139.76*** -142.15*** -138.72*** -140.42*** -138.75*** -139.89***
(2.49) (2.30) (2.91) (2.90) (3.09) (3.06) (2.72)
d2*∆Rating*(scale-14.49) 23.04*** 22.28*** 22.43*** 21.54*** 21.61*** 20.73*** 21.59***
(3.35) (3.31) (3.78) (3.75) (3.97) (4.04) (3.76)
∆ Stock Prices -1.90*** -1.36***
(0.52) (0.44)
∆ Commodity -1.73*** -1.38*** -1.04***
(0.41) (0.30) (0.27)
VIX 1.12*** 0.71*** 0.83** 0.40**
(0.32) (0.23) (0.33) (0.19)
∆ Oil Price -0.92***
(0.15)
Constant 5.35* 4.62 6.83* -18.96*** -8.82*** -11.60*** -3.05
(3.22) (2.95) (3.52) (3.98) (1.86) (4.10) (1.89)
Observations 2,344 2,338 2,344 2,344 2,344 2,344 2,338
# of Countries 26 26 26 26 26 26 26
Wald chi-squared 4.27E+07 1.50E+13 3.77E+07 1.16E+13 1.25E+07 4.65E+13 2.45E+07 Notes: GMM Arellano-Bond dynamic panel estimates with ∆CreditRating and interaction terms as an endogenous variable. *** p<0.01, ** p<0.05, * p<0.1. Robust standard errors reported.

32
Table 9: CDS Spreads, Credit Ratings, Outlook/Watch
(1) (2) (3) (4) (5) (6) ∆ CDS (t-1) 0.05** 0.05** 0.05** 0.04*** 0.04*** 0.04***
(0.02) (0.02) (0.02) (0.02) (0.02) (0.02) ∆ Credit Rating -42.93** -40.81** -41.24**
(19.11) (18.32) (18.51) ∆ Positive Outlook/Watch -2.46 -2.06 -10.93 -10.36
(4.23) (3.97) (8.01) (7.92) ∆ Negative Outlook/Watch 25.09** 25.08** 15.32*** 15.17***
(11.28) (11.29) (5.41) (5.33)
∆ Stock Prices -1.53*** -1.54*** -1.54*** -1.46*** -1.47*** -1.47*** (0.57) (0.57) (0.57) (0.53) (0.53) (0.53)
∆ Commodity -0.91*** -0.91*** -0.91*** -0.94*** -0.94*** -0.94*** (0.22) (0.22) (0.22) (0.21) (0.21) (0.21)
VIX 0.46** 0.42** 0.42** 0.37** 0.35** 0.35** (0.19) (0.17) (0.17) (0.16) (0.15) (0.15)
Constant -2.68 -3.16 -3.14 -2.08 -2.60 -2.36 (2.44) (2.31) (2.33) (2.10) (2.03) (2.09)
Observations 2,338 2,338 2,338 2,338 2,338 2,338 # of Countries 26 26 26 26 26 26 Wald chi-squared 637.1 579.4 641.5 1363 991.9 1245
Notes: GMM Arellano-Bond dynamic panel estimates with ∆CreditRating as an endogenous variable. *** p<0.01, ** p<0.05, * p<0.1. Robust standard errors reported.
Table 10: Contagion –Effects of GIIPS Rating Changes on Euro and Non-Euro Countries
Aggregate GIIPS Rating Index Maximum GIIPS Rating Index
Effect on Euro EUEffect on Non-Euro
EU Effect on Euro
EU Effect on Non-Euro
EU
(1) (2) (3) (4) (5) (6) (7) (8) ∆ CDS (t-1) 0.30*** 0.28*** 0.18*** 0.17*** 0.30*** 0.28*** 0.18*** 0.17***
(0.03) (0.02) (0.02) (0.02) (0.03) (0.02) (0.02) (0.02)
∆ GIIPS Credit Rating -0.61*** -0.03 0.11 0.11 -0.84** -0.42 -0.23 -0.23
(0.23) (0.35) (0.51) (0.49) (0.33) (0.26) (0.43) (0.42)
∆ Credit Rating -19.74* -7.33* -19.53* -7.32*
(10.81) (4.04) (10.44) (4.06)
∆ Stock Prices -0.77*** -0.71*** -1.20* -1.19* -0.77*** -0.72*** -1.20* -1.19*
(0.16) (0.21) (0.66) (0.66) (0.16) (0.20) (0.66) (0.66)
∆ Commodity -0.49*** -0.48*** -1.16*** -1.15*** -0.49*** -0.50*** -1.17*** -1.16***
(0.15) (0.14) (0.41) (0.41) (0.15) (0.14) (0.42) (0.42)
VIX 0.06 0.08* 0.37 0.34 0.06* 0.08* 0.36 0.33
(0.03) (0.04) (0.24) (0.24) (0.03) (0.04) (0.23) (0.23)
Constant 0.55 0.21 -5.65 -5.10 0.50 0.14 -5.70 -5.15
(1.00) (0.60) (4.61) (4.66) (0.99) (0.60) (4.61) (4.66)
Observations 992 992 892 892 992 992 892 892
# of Countries 11 11 10 10 11 11 10 10
Wald chi-squared 5517 10933 673.1 1130 6952 13225 668.2 1054 Notes: GMM Arellano-Bond dynamic panel estimates with ∆CreditRating as an endogenous variable. *** p<0.01, ** p<0.05, * p<0.1. Robust standard errors reported.

33
Figure 1: CDS Spreads: EU, Euro, Non-Euro (EU) and GIIPS
Notes: CDS spreads for Greece is not available after February 2012; therefore decline in average CDS is mainly due to Greek not being included in average.
050
010
0015
0020
0025
00
2005m1 2006m1 2007m1 2008m1 2009m1 2010m1 2011m1 2012m1
EU EuroNon_Euro GIIPS

34
Figure 2: Greek CDS Spreads and Credit Rating Downgrades
Notes: CDS spreads for Greece is not available after February 2012. Vertical lines indicate S&P and Fitch dates of downgrades.
020
0040
0060
0080
0010
000
2005m1 2006m1 2007m1 2008m1 2009m1 2010m1 2011m1 2012m1

35
Figure 3: CDS Spreads and Credit Ratings
Notes: Vertical axis has CDS spreads; horizontal axis has sovereign ratings as scaled in Table 2.
020
040
060
080
0
20 20.5 21 21.5 22
EU
020
040
060
080
010
00
20 21 22 23
Euro0
100
200
300
400
500
19.5 20 20.5
Non-Euro
050
010
0015
0020
0025
00
16 18 20 22 24
GIIPS

36
Figure 4a: Change in CDS Spread Associated with Credit Rating Change Conditional on Level of Credit Rating
Notes: Full Sample (Pre-Crisis, Crisis) graph calculated from Table 7 (Table 8), Column 7 (Columns 5, 6), spline function estimation. For credit rating level 19-25(A- to AAA), d1=d2=1; for rating level 10-18 (B- to BBB+), d1=1 and d2=0; for rating level 1-9 (CCC+ and below), d1=d2=0.
Figure 4b: Change in CDS Spread Associated with Credit Rating Change Conditional on Level
of Credit Rating, excluding the low end of the range (only occupied by Greece during our sample period)
Notes: Full Sample (Pre-Crisis, Crisis) graph calculated from Table 7 (Table 8), Column 7 (Columns 5, 6), spline function estimation. For credit rating level 19-25(A- to AAA), d1=d2=1; for rating level 10-18 (B- to BBB+), d1=1 and d2=0; for rating level 1-9 (CCC+ and below), d1=d2=0.
‐200
‐150
‐100
‐50
0
50
100
5 7 9 11 13 15 17 19 21
‐45
‐40
‐35
‐30
‐25
‐20
‐15
‐10
‐5
0
12 13 14 15 16 17 18 19 20 21 22

37
Table A1: Data Descriptions and Sources
Variable Description Source
CDS Spread Market prices for five-year sovereign CDS contracts (in a basis points), daily data is averaged into monthly values. Used as monthly basis point change in regressions.
Markit, Bloomberg
Sovereign Ratings Fitch and Standard & Poor's long-term foreign currency ratings, scaled from 1 (D) to 25 (AAA). Monthly (in unit) change
Fitch and S&P websites
Stock Prices Local Stock Market Index -- MSCI or host country. Used as monthly percentage change in regressions.
Bloomberg, Thomson Reuters Datastream
Commodity S&P Goldman Sacks Commodity Price Index (SPGSCI), US dollar. Used as monthly percentage change in regressions.
Bloomberg
Oil Price Crude oil price ($/bbl), monthly average Used as monthly percentage change in regressions.
World Bank Commodity Price Data (Pink Sheet)
VIX Chicago Board Options Exchange Market Volatility Index (implied volatility of S&P 500 index options), monthly average (of daily adjusted close)
Yahoo-Finance