Credit Rating Agency Downgrades and the Eurozone Sovereign ...fm · Credit Rating Agency Downgrades...
34
Credit Rating Agency Downgrades and the Eurozone Sovereign Debt Crises Christopher F Baum * (Boston College, DIW Berlin) Margarita Karpava (MediaCom London) Dorothea Schäfer (DIW Berlin, JIBS) Andreas Stephan (JIBS, DIW Berlin, Ratio Institute Stockholm) January 30, 2014 Abstract This paper studies the impact of credit rating agency (CRA) downgrade announcements on the value of the Euro and the yields of French, Italian, German and Spanish long-term sovereign bonds during the culmination of the Eurozone debt crisis in 2011–2012. The employed GARCH models show that CRA downgrade announcements negatively affected the value of the Euro currency and also increased its volatility. Downgrading increased the yields of French, Italian and Spanish bonds but lowered the German bond’s yields, although Germany’s rating status was never touched by CRA. There is no evidence for Granger causality from bond yields to rating announcements. We infer from these findings that CRA announcements significantly influenced crisis-time capital allocation in the Eurozone. Their downgradings caused investors to rebalance their portfolios across member countries, out of ailing states’ debt into more stable borrowers’ securities. Keywords: Credit Rating Agencies, Euro Crisis, Sovereign Debt, Euro Exchange Rate JEL classification: G24, G01, G12, G14, E42, E43, E44, F31, F42, F65 * Corresponding author: Department of Economics, Boston College, 140 Commonwealth Avenue, Chestnut Hill MA 02135 USA. Email: [email protected].
-
Upload
nguyenngoc -
Category
Documents
-
view
215 -
download
0
Transcript of Credit Rating Agency Downgrades and the Eurozone Sovereign ...fm · Credit Rating Agency Downgrades...

Credit Rating Agency Downgrades and
the Eurozone Sovereign Debt Crises
Christopher F Baum∗ (Boston College, DIW Berlin)
Margarita Karpava (MediaCom London)
Dorothea Schäfer (DIW Berlin, JIBS)
Andreas Stephan (JIBS, DIW Berlin, Ratio Institute Stockholm)
January 30, 2014
Abstract
This paper studies the impact of credit rating agency (CRA) downgrade announcements onthe value of the Euro and the yields of French, Italian, German and Spanish long-term sovereignbonds during the culmination of the Eurozone debt crisis in 2011–2012. The employed GARCHmodels show that CRA downgrade announcements negatively affected the value of the Eurocurrency and also increased its volatility. Downgrading increased the yields of French, Italianand Spanish bonds but lowered the German bond’s yields, although Germany’s rating status wasnever touched by CRA. There is no evidence for Granger causality from bond yields to ratingannouncements. We infer from these findings that CRA announcements significantly influencedcrisis-time capital allocation in the Eurozone. Their downgradings caused investors to rebalancetheir portfolios across member countries, out of ailing states’ debt into more stable borrowers’securities.
Keywords: Credit Rating Agencies, Euro Crisis, Sovereign Debt, Euro Exchange Rate
JEL classification: G24, G01, G12, G14, E42, E43, E44, F31, F42, F65
∗Corresponding author: Department of Economics, Boston College, 140 Commonwealth Avenue, Chestnut HillMA 02135 USA. Email: [email protected].

1 Introduction
In January 2012, the credit rating agency Standard & Poor’s (S&P) downgraded the sovereign debt
ratings of nine Eurozone countries, including France, which lost its previous AAA rating. S&P
also cut Austria’s triple-A rating and relegated the sovereign debt of Portugal and Cyprus to junk
status. The downgrading announcements received a great deal of public attention. Politicians in
several Eurozone countries reacted by downplaying the role of rating announcements from credit
rating agencies (CRAs) in an effort to ease the expected turbulence within the Eurozone.
The purpose of this paper is to examine the impact of CRA downgrade announcements on the
Eurozone during the sovereign debt crisis of 2011–2012. Specifically, we study the role of rating
announcements on exchange rate movements and government bond yields. We construct a database
covering nearly 150 announcements of S&P, Moody’s, and Fitch during the sovereign debt crisis.
The Euro began to depreciate in early 2009 when the large public deficits of several Euro countries
became the topic of public debate. At the same time, the major credit rating agencies started
downgrading Greek and Irish sovereign bonds due to these countries’ government budget deficits.
A series of negative watch and outlook revisions were announced by S&P and Fitch, followed by
massive downgrade announcements for Eurozone countries in early January 2012.
Financial investors, in particular banks and insurance companies, used to invest heavily in
sovereign bonds of Eurozone countries. Downgrading may therefore not only increase the likelihood
that other members of the currency union will be forced to bail out the ailing country but also weaken
its own domestic banks. Both issues may pose a threat to the sustainability of their own government
debt levels. Foreign investors may therefore interpret negative rating news on one country as a signal
of worsening fundamentals in the Eurozone as a whole and subsequently withdraw their funds. This
reaction may worsen the fundamental economic situation and trigger even further withdrawals.
The rating announcement would then become a self-full-filling prophecy and trigger a currency
crisis. Such a sequence of events was observed in the Asian crisis (Morris & Shin 1998). Moreover,
downgrades could initiate speculation against the Euro, placing even more pressure on its value.
Although some problems of the Eurozone are similar to the ones observed in the Asian crisis,
there exists one decisive difference. Eurozone member states share a common currency but each
1

country still possesses full fiscal sovereignty. This unique construction opens up the possibility to
internally reallocate a Euro-dominated portfolio. Such an option was not available in the Asian
crisis. If a CRA announcement triggered a portfolio rebalancing across member countries, from the
debt of ailing states into more stable issuers’ securities, a repricing of risks would occur within the
Eurozone but the Euro exchange rate would be rather immune to CRA announcements.
There is anecdotal evidence that such portfolio reallocation effects indeed matter. For example,
in recent months the Swedish National Bank (Riksbank) has shifted its Euro currency reserves
from Spanish and Italian bonds to German bonds.1 However, so far, little effort has been made to
systematically analyze and understand the link between downgradings of particular members, the
repricing of risk within the Eurozone and the movements of the common currency. To date, most
studies on the impact of credit rating announcements deal with stock and bond markets. To the
best of our knowledge, we are the first to analyze the relationship between sovereign credit rating
announcements, investors’ portfolio decisions and the value of the common currency of sovereign
member states during the culmination of the Eurozone crisis in 2011 and 2012.
Similar to the previous impact studies, this paper adopts an event-study methodology combined
with an econometric GARCH model in order to estimate the impact of rating announcements by
the three leading agencies (Standard & Poor’s, Moody’s, and Fitch). We use three different models
but the same econometric methodology: an exchange rate model and two CAPM models to explain
sovereign bond yields for selected countries.
Our major finding is the following. CRA watchlist and outlook events have almost no significant
impact on the value of the Euro currency. In contrast, sovereign downgrading has a statistically
significant impact, as it leads to a depreciation of the Euro against the US dollar and other ma-
jor currencies. Downgrading increases the excess yields of French, Italian and Spanish government
bonds but at the same time lowers German bond yields. In some cases CRA announcements increase
the volatilities of Euro exchange rates and sovereign bond yields, indicating higher market uncer-
tainty around the events. We find no evidence for reverse Granger causality from bonds’ yields to
CRA announcements. Overall, these findings corroborate that investors rebalanced their portfolios1See the Swedish economic newspaper Dagens Industri, June 4, 2013.
2

across member countries, out of ailing states’ debt into more stable securities. Consequently, CRA
announcements may have distributional effects.
The remainder of the paper is organized as follows. The next section describes the background
of the credit rating agency industry and reviews previous literature related to the impact of CRAs.
In Section 3, we present a brief summary of rating announcements during the European sovereign
debt crisis. Section 4 presents a comparison with the Asian financial crisis of 1997–1998. In Section
5, we develop the empirical methodology and Section 6 provides the results. Finally, Section 7
concludes.
2 Background and Previous Research
Credit rating agencies were created with the objective of solving information asymmetry problems
in financial markets as they provide an assessment of a borrower’s ability and willingness to repay
its debt securities. The role of credit rating agencies in the global financial system as well as quality
of their credit risk assessments has been widely debated. Credit rating agencies have often been
criticized for violating their primary function of minimizing information uncertainty in financial
markets. In line with this conclusion, Carlson & Hale (2005), using a global games framework, find
that the existence of credit rating agencies may threaten market stability as it increases the incidence
of multiple equilibria. Bannier & Tyrell (2005) report that a unique equilibrium can be restored by
making the rating process more transparent, enabling market participants to independently assess
quality and validity of credit ratings. The more accurate are credit rating announcements, the
greater is the efficiency of investor decisions, and hence, is the market outcome.
Rating agencies assign a grade to the bond issuer according to the relative probability of default,
which is measured by the country’s political and economic fundamentals. The credit ratings industry
is dominated by the three leading agencies: Standard & Poor’s (S&P), Moody’s Investors Service
and Fitch Ratings. Even though the three credit rating agencies use different rating scales of
measurement, there is a high degree of correspondence between them. A table with a corresponding
definition of rating grades, assigned by each CRA, is listed in Table 1.
Credit ratings tend to differ among CRAs, which can be mainly attributed to different estimation
3

methodologies and proxy variables considered in the analysis. S&P focuses mostly on the forward-
looking probability of default. Moody’s bases its rating decisions on the expected loss, which is a
function of both the probability of default and the expected recovery rate. Finally, Fitch takes into
consideration both the probability of default and the recovery rate (Elkhoury 2009).
Prior studies report that sovereign credit ratings are primarily affected by the following economic
indicators: GDP per capita, GDP growth, public debt as a percentage of GDP, budget deficit as
a percentage of GDP and inflation level within the country (Cantor & Packer 1996). A history
of sovereign default, the level of economic development and government effectiveness within the
country have also been identified as important in determining sovereign credit ratings (Afonso et al.
2012). Information as to how CRAs assign weights to each variable they consider in assessment of
the credit risk is not publically available.
The effects of sovereign credit ratings on debt and equity markets have been studied by many
researchers. Brooks et al. (2004) report that rating downgrades negatively affect stock market
returns. At the same time the dollar value of the domestic currency decreases. Kräussl (2005)
shows that negative ratings significantly increase an index of speculative market pressure which
consists of daily nominal exchange rate changes, daily short-term interest rate changes and daily
stock market changes. In contrast, rating upgrades and positive outlooks show a weak or even
insignificant impact. Kim & Wu (2008) claim that long-term credit ratings support the development
of financial markets in emerging economies.
Hooper et al. (2008) examine the impact of credit rating events on international financial markets
using a database of 42 countries over the period 1995 to 2003. They provide evidence that rating
upgrades significantly increased USD denominated stock market returns and decreased volatility.
Downgrades show the corresponding contrary effect. However the market responses for both return
and volatility are asymmetric and more pronounced for downgrades. A recent paper by Wu &
Treepongkaruna (2008) empirically tested the impact of sovereign credit rating news on volatility
of stock returns and currency markets during the Asian financial crisis. Both market measures
were found to be strongly affected by changes in sovereign credit ratings with currency markets
being more responsive to credit rating news, while changes in sovereign outlooks had much stronger
4

impact on stock price volatility than did actual rating announcements.
Several research papers also find strong contagion effects of watch and outlook changes on stock,
bond and CDS markets of nearby countries. Hamilton & Cantor (2004) and Alsati et al. (2005)
find evidence that rating events such as outlooks and watchlist assignements increase the predictive
power of sovereign credit rating announcements, as they shed light on which governments are likely
to default on their debt or to be downgraded in the foreseen future.
2.1 Credibility of CRA rating announcements
The reliability of CRA announcements in times of crisis has often been questioned. Ferri & Stiglitz
(1999) report that prior to the Asian financial crisis, credit ratings were higher than economic
fundamentals would suggest, while ex post ratings were much lower than the model predicted. This
evidence suggests a procyclical rating behavior. Reinhart (2002) confirms that rating agencies lag
behind the market. Following the markets with downgrading rather than leading it might accelerate
the panic among investors, drive money out of the country and sovereign yield spreads up (Reisen &
von Maltzan 1999). Bhatia (2002) claims that failed ratings stem from CRAs’ inclination towards
ratings stability rather than accuracy of reported announcements. Mora (2006) reports indeed
a considerable stickiness of ratings. Elkhoury (2009) also describes the assessment of the CRA
as “tend[ing] to be sticky, lagging markets, and then overreact[ing] when they do change” (p. 1).
Moreover, Ferri & Stiglitz (1999) observe that in response to a past major rating failure CRAs
tend to become overly conservative. This observation could suggest that CRA have downgraded
Eurozone member states particularly aggressively in an effort to regain the reputation which was
lost in the US sub-prime rating debacle. In the Asian crisis CRA downgrades posed a particular
threat for the stability of ailing countries’ currencies.
We take concerns of CRAs lagging behind the market into account in our analysis of the impact
of sovereign rating news on currency movements and on a subsequent adjustment of bond portfolios,
as we scrutinize the results for reverse causality effects.
5

2.2 Evidence on rating effects around the Eurozone crisis
Since the bursting of the real estate bubble in the United States in the summer of 2007, European
economies have been badly damaged by banking and sovereign debt crises. Most European member
states suffered from rapidly increasing fiscal deficits, preventing them from meeting the Maastricht
criteria for fiscal and monetary stability: public debt as a percentage of GDP below 60% and budget
deficit as a percentage of GDP below 3%. For example, public debt levels in Italy of 116.4% in
2009, 119.3% in 2010 and 120.8%, and in Greece of 129.7% in 2009, 148.3% in 2010 and 170.3%
in 2011 far exceeded GDP in the corresponding years (see Figure 1).2 In addition to this, credit
default swap (CDS) spreads experienced increased volatility during the financial crisis, resulting
in a dramatic growth of CDS premia (see Figure 2). Deb et al. (2011) report that from January
2008 to June 2010 the premia increased 850% for France, 614% for Germany, 3364% for Greece and
1394% for Spain.
Many European private banks have invested heavily in government bonds issued by the troubled
countries, which now makes the return on these investments highly uncertain. At the end of the
third quarter in 2011 German banks held 473.91 billion USD while French banks held 617.2 billion
USD in troubled foreign debt of affected countries within the Eurozone. German and French banks
were in particular invested in Italy and Spain.3 Therefore, even a partial default of one of those
sizeable countries would have significantly hurt the banking industry in the European Union as well
as its member states, since governments are usually required to support poorly capitalized banks.
Amidst this increasing uncertainty, on January 13, 2012 S&P announced credit rating down-
grades for nine EU member states, including France, which lost its “AAA” rating to “AA+”, while
Portugal and Cyprus were assigned junk-bond ratings. In addition to this, 14 countries within the
EU were given negative outlooks, whereas only Germany’s premium credit rating remained unaf-
fected. On 27 February 2012 S&P assigned “SD” grade to Greek sovereign bonds, thereby increasing
the magnitude of investor risk aversion towards European financial markets.2Eurostat 2012, http://epp.eurostat.ec.europa.eu/tgm/table.do?tab=table&init=1&
language=en&pcode=tsdde410&plugin=1.3By the end of the first quarter of 2012, German banks held claims on Italian borrowers of 133 billion USD and
on Spanish borrowers of 140 billion USD. French banks’ exposure was 347 billion USD to Italy and 128 billion USDto Spain (Bank of International Settlements 2012, http://www.bis.org/statistics/consstats.htm).
6

Existing research indicates the presence of statistically significant spillover effects of rating news
from an event country to markets of non-event countries. Duggar et al. (2009) find evidence that
sovereign defaults spread into other areas of corporate finance, leading to widespread corporate
defaults. Arezki et al. (2011) report that rating downgrades to near-speculative grade for sovereigns
are especially contagious across countries and financial markets. For example, a rating downgrade
of Greece from “A-” to “BBB+” grade, as announced by Fitch on 8 December 2009, resulted in
substantial spillover effects across members of the EMU including a 17 and 5 basis points increase
in Greek and Irish CDS spreads respectively. Afonso et al. (2012) argue that rating downgrades of
lower-rated countries have strong spillover effects on higher-rated sovereigns in the region, which is
consistent with prior studies by Gande & Parsley (2005) and Ismailescu & Kazemi (2010). They also
report statistically significant persistence effects of rating announcements: countries downgraded
(upgraded) within the last month tend to have at least 0.5% higher (lower) sovereign bond yields
for the next six months until the effect disappears. Interestingly CRA announcements by different
agencies differ in their impact. Rating announcements by Moody’s tend to have the strongest
persistence effect of 1.5% higher bond yield spread for six months following a rating downgrade.
Alsakka & ap Gwilym (2013) completed the first empirical study to test the direct impact of
sovereign credit ratings on foreign exchange markets. Their event study results revealed that cur-
rency markets of higher-rated countries were more responsive to rating downgrades during the crisis
period, while lower-rated countries’ exchange rates are mostly affected in the pre-crisis period by
sovereign ratings. Market reactions to credit rating changes and contagion effects were particularly
strong during the crisis period of 2006–2010 compared to the pre-crisis period (2000–2006). Neg-
ative news from all three major agencies were reported to have an impact but Fitch triggered the
strongest reactions. In contrast Ehrmann et al. (2013) found no effect of rating news on the Euro
from October 1st, 2009 until November 30, 2011.
Our research is closely related to Afonso et al. (2012), Alsakka & ap Gwilym (2013) and Ehrmann
et al. (2013). However, since we are interested in the impact of CRA announcements on the single
currency in times of crisis, we depart from these papers in a number of aspects. First, we concentrate
on CRA announcements (unlike Ehrmann et al. 2013). Second, we consider only the Eurozone and
7

exclusively analyze the period of the acute debt crisis (unlike Alsakka & ap Gwilym 2013 and Afonso
et al. 2012). Third, Afonso et al. (2012) focus on the impact of CRA announcements on spreads
of sovereign bond yields over German bond yields for the EU countries. In contrast, we focus on
excess bond yield from large Eurozone members since contagion effects from downgrades should be
visible either in the exchange rate or in the large countries’ yields.
3 Development of debt ratios, ratings and exchange rates
The most affected economies of the Eurozone debt crisis are Greece, Ireland, and Portugal along with
Spain and Italy (GIPSI: see Figure 1). The CRAs were late with hinting at a possibly unsustainable
debt level of Greece. The first negative credit rating announcements on Greece came to light only
in 2009. S&P published a negative watch announcement in the view of Greece’s large budget deficit
on January 9th, 2009. The actual rating downgrade from A to A- occurred shortly after on January
15th, 2009. Fitch released a negative outlook announcement on May 5th, 2009, followed by a rating
downgrade from A to A- on October 22nd, 2009. Moody’s was the last to react to the rising
Greek budget deficit by putting Greece on a negative watch list on 29 October 2009, followed by a
downgrade to A2 rating on 22 December 2009. In the 831 trading days from January 2009 through
December 2012, a total of nearly 150 rating announcements were published by S&P, Moody’s and
Fitch.
Standard and Poor’s published 57 rating announcements, which include 35 rating downgrades,
22 negative watch lists and 28 negative outlook revisions. In addition, S&P upgraded Greece
twice in 2012. Fitch Ratings, in its turn, published 43 rating announcements, which include 29
actual downgrades, 10 watch negative reviews, 25 negative outlook revisions and one upgrade when
Greece was assigned a B- rating on 13 March 2012. Moody’s made 48 public announcements,
which consist of 32 actual downgrades, 18 negative watch reviews and 30 outlook revisions. Figure
1b illustrates the downgrading activity using the example of S&P. Table 2 summarizes the most
significant announcements of the three CRAs during 2011–2012.
A different number of credit rating announcements published by each agency is not surprising as
S&P is known for its focus on the accuracy of rating announcements in the short run, which gives
8

rise to a higher frequency of public announcements over the time period under consideration. In
contrast, Fitch Ratings and Moody’s assign more value to the stability of sovereign credit ratings,
therefore, the number of their rating events is considerably lower than that of S&P.
The daily spot exchange rate movements reveal that the Euro depreciated significantly against
the US dollar at the beginning of 2009 when a series of downgrades for Greek and Irish government
bonds was announced. The pressure eased in mid-spring 2009 as a result of government assistance
to financial institutions in the Eurozone. However, in November 2009 devaluation pressure took up
again. At the beginning of June 2010 the Euro reached its lowest point within the period of the
Eurozone debt crisis: 0.8335 Euros per USD according to the closing price on 4 June 2010. This
period of extensive Euro depreciation occurred parallel to the rising public debt levels in Greece,
Ireland, Portugal and Spain and the negative sovereign rating events published by each credit rating
agency within this time frame.
The situation stabilized somewhat after Ireland and Greece were provided with a series of bailout
packages from late 2010 through the first half of 2011. The stabilizing effect did not persist, though,
as more countries of the EMU were becoming involved. Rising fears among investors of possible
spillover effects to other countries within the Eurozone put a substantial strain on the Euro. Figure
5 shows that the bailout packages were, in fact, accompanied by increased downward pressure
on the value of the common currency. The Euro lost value against the Japanese yen, the Swiss
franc and the US dollar. Around the end of 2010 to the beginning of 2011, the common currency
experienced a sudden slump in its value. At that time S&P and Fitch assigned junk bond status
to Greek government bonds. In December 2011, a series of negative watch and outlook revisions
were announced by S&P and Fitch, followed by massive downgrade announcements for Eurozone
countries in January 2012. The Euro began depreciating again in the second quarter of 2011. In
July 2011, Eurozone leaders decided in favor of a haircut of Greek bonds held by non-sovereign
lenders. In the beginning of 2012, the Euro reached a further minimum. The haircut was executed
in February 2012 accompanied by S&P’s SD (in default) rating for Greece. In the following month
the Euro recovered to some degree, but downward pressure was renewed in early summer. When
Moody’s threatened to downgrade three European AAA-rated countries in July 2012, the Euro’s
9

value was again depressed, as the Euro lost about 10 percent of its value between January 2011 and
July 2012. However, the overall change of the Euro’s value in 2011 and 2012 was tiny: For example,
against the US dollar, the Euro traded at the beginning of 2011 for 0.749 Euro per dollar. By the
end of December 2012, the exchange rate was 0.758 Euro per dollar: a loss in value of only about
one percent in two years.
4 Currency movements during the Asian crisis of 1997–1998
Table 3 shows the government debt ratios of those countries that were hit hardest during the Asian
crisis. It is obvious that the ratios of Indonesia, South Korea, Malaysia and Thailand were very low
compared with those of the GIPSI countries at the beginning of the Eurozone crisis. Even the debt
ratio of the poorest country, Indonesia, was far below 100 percent in 1997. South Korea had the
lowest debt burden in the region. The country’s gross debt ratio was only about eight percent in
1996 and 11 percent in 1997.
Despite low debt/GDP ratios, investment capital began to flee the Asian countries in spring
and summer 1997. The CRAs started downgrading Asian countries in October 1997 (Figure 3)
through March 1998. The most affected country, Indonesia, ended up with a rating of CCC+
(substantial risk). In contrast, in February 2012 Greece received the lowest possible rating grade
SD (in default). Korea’s rating grade in March 1998 was B (highly speculative). The second lowest
rating grade among the GIPSI countries was BB (speculative) given in January 2012 by S&P to
Portugal.
The period of intense downgrading was much shorter in the Asian crisis than in the Eurozone
crisis. However, the value of the domestic currencies of the affected countries in the region suffered
much more than the Euro. The Indonesian rupiah lost more than 70 percent of its value against the
US dollar in less than one year. Each of the other three regional currencies depreciated more than 30
percent. The rating agencies were considered to have contributed to a large extent to unnecessary
withdrawals of funds from the region and the subsequent depreciation of regional currencies. For
example, Radelet & Sachs (1998) accused the major ratings agencies to have “belatedly downgraded
countries in the region, triggering further withdrawals by creditors” (p. 27).
10

5 Empirical analysis
5.1 Event study methodology with GARCH models
In this paper, we investigate the rating agencies’ contribution to the trajectories of the Euro’s value
and that of selected government bond excess yields during the Eurozone crisis. We combine event
study methodology with a GARCH model. The GARCH model has the advantage that it can
quantify effects from the events both on the mean and on the volatility of exchange rates and bond
yields. The events are defined as binary variables, where event days are coded as 1 and non-event
days are coded as 0. Because the effects from the event might not only occur on the day of the
announcement, but also before and after the announcement, we define event windows including days
before and after the event, as is common in the event study literature.
We formulate three different models for the purpose of our analysis. In the first model, we study
the relationship between the Euro exchange rate and CRA events, considering a number of control
variables. In the second model we formulate a CAPM approach to explain sovereign bond yields for
the various countries. The third model is an extension of the second which also contains interaction
effects of the event dummies with the bond betas.
Model I is formulated as follows:
∆ ln euro ratet = β0 + β1eventt + β2∆(iUSD − iEUR)t + β3∆ ln(vix)t + εt,
where ∆ denotes a first differenced variable. The dependent variables which are tested with this
model are the nominal effective trade-weighted nominal euro rate (NEER) and the Euro vs. Dollar
spot rate. The NEER captures the value of the Euro against other major currencies. Higher values
of the NEER indicate that the Euro has appreciated against other major currencies. We test the
same model with the US dollar vs. Euro spot rate as a type of robustness check. As our major
control variable we include the interest rate differential, (iUSD − iEUR), in the equation. As we
do not have a trade-weighted average of interest rates of the major Eurozone trading partners, we
utilize the difference between 3-month money market rates (US LIBOR minus the EURIBOR rate)
as a proxy. The purpose of this variable is to capture uncovered interest parity effects on the Euro
11

rate. We expect that the interest rate differential to the US should be inversely related to the Euro
rate: an increase in the interest rate differential leads to a depreciation of the Euro against the US
dollar and in consequence also lowers the effective Euro rate.
Another control variable in Model I is the Chicago Board Options Exchange Volatility Index
(VIX). This index measures the implied volatility of the S&P500 stock index over a 30-day period.
In our context the variable vix is used as a proxy for the level of investor uncertainty in US equity
markets.
Model II is formulated to measure the effect of CRA announcements on government bond yields.
We hypothesize that CRA downgrades trigger reallocation of capital within the Eurozone. As gov-
ernment bonds are a key asset in many institutional portfolios, geographic rebalancing of portfolios
will affect the yields of these bonds. We expect that price changes of possible contagion effects from
downgrades will be reflected in the bond yields of large Eurozone member countries. Specifically, we
investigate the effect of ratings downgrades on the yields of France (FRA), German (GER), Italian
(ITA), and Spanish (ESP) sovereign bonds.
The basis of Model II is a CAPM formulation which explains bond excess yields with the market
excess yield. The strength and direction of this correlation is captured by the coefficient βbond. The
higher is βbond, the higher the market risk of the bond, and the higher should be its expected excess
yield. This is different from Afonso et al. (2012) who base their event study on the observed bond
yield spreads between country specific bonds and German bonds. Accordingly, the equation is
∆ (yieldt − rft )︸ ︷︷ ︸bond excess yield
= α0 + α1eventt + βbond (mktyieldt − rft )︸ ︷︷ ︸market excess yield
+α2∆cdst + α3∆ ln(vixt) + νt,
where rf denotes the risk-free yield, defined as the yield of AAA rated Eurozone sovereign bonds. We
expect that α0 = 0, as bond yields should be only related to their systematic risk. The market yield,
mktyieldt, is defined as the average yield of all government bonds of the Eurozone with tenor of five
years. The respective data are provided by the ECB. The variable cds is an index of credit default
swaps for government bonds of the respective country. We use it as a proxy variable for the perceived
investor risk for the government bonds from a specific country. We expect a positive relationship
12

between cds and bond yield, since again higher systematic default risk should be compensated
by higher expected yield. Furthermore, vix as a measure for overall uncertainty on the US stock
market is also included. Given that Eurozone government bonds constitute alternative investment
possibilities, we expect that an increase in uncertainty on US equity markets should increase the
demand for Eurozone sovereign bonds. As a consequence excess yields of government bonds should
fall.
In Model III, we propose that CRA events affect the relationship between market excess yields
and bond excess yields, as well as the relationship between systematic default risk and bond excess
yields. Thus, we conjecture in this model that CRA events have the effect of a moderator variable.
We interact these variables with the event dummy variable:
∆(yieldt − rft ) = α0 + α1eventt + βbond(mktyieldt − rft )
+γbond(mktyieldt − rft ) × eventt
+α2∆cdst + α3∆cdst × eventt + α4∆ ln(vixt) + ξt.
In each model, we assume that the CRA event may not only affect the mean equation, but also
the variance of the dependent variable (Bollerslev 1986). For instance, one could expect that during
event times we observe a higher variance of the excess yield compared to non-event times. The sim-
plest generalized autoregressive conditional heteroskedasticity model is GARCH(1,1). Diagnostic
tests indicate the presence of GARCH effects after OLS estimation. One of the primary benefits of
the GARCH specification is its parsimony in identifying the conditional variance. The GARCH for-
mulation has also the advantage that variables can be specified that enter the variance specification
collectively as multiplicative heteroskedasticity. The GARCH(1,1) conditional heteroscedasticity
equation is specified as
σ2t = (γ0 + γ1σ2t−1 + λ1ε
2t−1) × (θ1eventt + θ2 ln vixt + θ3cdst),
see Judge et al. (1985, p. 843).
13

In principle we could have utilized more complicated models such as EGARCH (Nelson 1991) but
these models often give rise to numerical estimation problems and non-convergence. Therefore we
have decided to use the simplest GARCH model. Some models’ residuals appear to be distributed
with fatter tails than those of a normal distribution. To allow for this flexibility, a generalized error
distribution (GED) model is specified (Bollerslev et al. 1994). The GED distribution includes the
normal distribution as a special case when its estimated shape parameter is 2.0.
6 Data Description and Results
6.1 Data sources
Table 4 provides a description of the variables that are employed in the analysis. Most variables
exhibit a unit root in levels, but are stationary in first differences. Credit rating announcements
published by Standard and Poor’s, Fitch Ratings, and Moody’s were obtained from the official web-
sites of each credit rating agency. We tested three types of events: watch, outlook and downgrade.
We only report estimation results for downgrades in the following section, as watch and outlook
events did not yield significant results.
The nominal effective Euro rate (NEER) for the Euro-17 countries vis-à-vis the group of trading
partners was obtained from the ECB.4 The other data series: yields of five-year government bonds,
the daily volatility index data from the CBOE (Chicago Board Options Exchange), three-month
money market rates for the US dollar and the Euro and the CDS spreads were obtained from Thom-
son Reuters Datastream. The yields of Italian government bonds were obtained from the Italian
central bank (Banca d’Italia). Figure 5 shows rating events and the development of the exchange
rates. Figure 6 illustrates movements of the CBOE VIX and US-Euro interest rate differential.
Figure 7 and Figure 2 show the evolution of excess yields of bonds and of CDS spreads respectively.4The group of 20 trading partners consists of AU Australia, CA Canada, DK Denmark, HK China Hong Kong, JP
Japan, NO Norway, SG Singapore, KR South Korea, SE Sweden, CH Switzerland, GB United Kingdom, US UnitedStates, BG Bulgaria, CZ Czech Republic, LV Latvia, LT Lithuania, HU Hungary, PL Poland, RO Romania and CNChina.
14

6.2 Results
Tables 5 and 6 provide summary statistics for the variables that are employed in the analysis. For
Model I, Table 7 shows the effect of downgrade announcements on the NEER and the Euro–US
dollar rate. The event window for the impact of the event on the Euro currency includes one day
before the event and three days after it. The results show that downgrading reduces the nominal
effective Euro rate (NEER). Thus, the Euro depreciated against major other currencies during the
events. As a robustness check, we also test the effect of CRA downgrades on the US dollar / Euro
spot rate and find basically the same results. The interest rate differential of US–Euro money market
has the expected negative sign: a positive change leads to a depreciation of the Euro. The VIX
also has the expected negative impact: in times of higher uncertainty in the US stock market, the
demand for investments in the Eurozone increases and the Euro appreciates. More risk in the US
stock market triggers higher volatility of the Euro against other currencies. The results also reveal
that downgrade events increase risk in the currency markets, remarkably increasing the volatility of
the Euro exchange rates. This is indicated by the significant coefficient for the respective variable
event in the multiplicative heteroscedasticity equation.
For Model II, Table 8 displays the estimation results for government bond yields based on the
CAPM formulation. The event window in the case of government bond yields is defined as the event
day and the day after the event. Overall, the estimated βbond coefficients are significant and have
the expected magnitude. Spain and Italy have βbond slightly above unity and thus exhibit a high
correlation with the market risk of government bonds. On the other hand, France and Germany
have much lower βbond values, with the German coefficient negative, implying that German expected
excess yields fall if the market excess yields increase. For Spain, Italy and France, CRA events have
a positive impact on the government bond yield, which means that during the event window, the
prices for these bonds fell. On the other hand, we find evidence that CRA events had a negative
impact on German yields, implying that German bonds gained in value. Notably, this effect is even
significant if only the most significant events, as defined in Table 2, are used for the construction of
the event dummy.
Regarding the impact of downgrading on the risk in the currency markets, we find that volatility
15

increases only for French bonds, but not for the others. In contrast, the variable cds increases the
volatility of government bond yields in each of the considered countries.
Finally, Model III’s results, presented in Table 9, show that the effect of CRA events is not only
of an additive nature, but that it also has an impact on βbond. In the case of Spain and France, we
see that βbond is significantly higher during the event window, implying that higher yields are also
related to a higher market risk of these bonds during CRA events.
In sum, our empirical analysis reveals that contagion exists and is visible in the bond yields
of large Eurozone members. The evidence confirms anecdotal evidence that CRA announcements
triggered considerable portfolio rebalancing across member countries, from troubled states’ sovereign
debt into more stable sovereign issues. In contrast to the Asian crisis, downgrade events did not
trigger a permanent currency depreciation. In fact, the Eurozone served as a kind of insurance
mechanism against a severe currency crisis because it allows for internal reallocation of capital
toward the liabilities of stronger sovereign borrowers. However, the protection against a severe
currency crisis comes at a price. CRA announcements tend to accentuate fluctuations in both the
Euro exchange rate and the price of sovereign bonds.
6.3 Influence of the event window
As a robustness check, we experiment with different definitions of the event window. It turns out
that the length of the event window has a strong impact on the results. For the exchange rates,
significance of the event on the dependent variables disappears if four days after the event are
included in the event window. In the case of government bond yields the effect tapers off even
faster. The event dummy becomes insignificant if more than one day after the event is included
in the window. The impact on the volatility is similar. In the case of France the impact is also
significant for longer definitions of the event window. However, in contrast to this finding, in the
case of the Euro exchange rate, we do not find effects on the volatility for shorter event windows.
16

7 Conclusions
This paper evaluates the effects of CRA announcements on the value of the Euro and the sovereign
bond yields of major Eurozone countries. We combine event study methodology with a GARCH
model to estimate the announcements’ effect from events both on the level and on the volatility of
our two main analysis variables. For sovereign bond yields, we formulate a CAPM-based model that
links bond excess yields to market excess yields. We find that downgrade events reduce the value of
the Euro and significantly affect sovereign bond yields. For Italian, French and Spanish sovereign
bonds, we find that yields increase during event times, while German sovereign bond yields decrease.
These findings are consistent with the observation that investors rebalanced their portfolios across
member countries to reduce their exposure to riskier borrowers.
These results have important policy implications. The single currency has been an effective
stabilizer against massive downward pressure triggered and fueled by repeated downgrading from
rating agencies. In contrast to the Asian crisis, CRA announcements did not accelerate the move-
ment of foreign funds out of the Eurozone and were unable to affect ailing countries’ terms of trade
in any permanent sense. The presence of stronger states within the Eurozone offered investors an
elegant way to insulate their portfolios from the allegedly higher sovereign risk signalled by rating
agencies’ announcements. They could simply reallocate their funds from weaker to stronger states
without changing the currency. However, the dampening of the adverse impact of downgrades on
the ailing countries’ terms of trade comes at a clear price. The reallocation of investors’ funds has
distributional effects, as it dramatically reduced Germany’s cost of debt service while downrated
countries have had to offer significantly better terms after downgrading events, and therefore bear
considerably higher costs when issuing new debt.
17

References
Afonso, A., Furceri, D. & Gomes, P. (2012), ‘Sovereign credit ratings and financial markets linkages:Application to european data’, Journal of International Money and Finance 31(3), 606–638.URL: http://ideas.repec.org/a/eee/jimfin/v31y2012i3p606-638.html
Alsakka, R. & ap Gwilym, O. (2013), ‘Rating agencies’ signals during the european sovereign debtcrisis: Market impact and spillovers’, Journal of Economic Behavior & Organization 85(C), 144–162.URL: http://ideas.repec.org/a/eee/jeborg/v85y2013icp144-162.html
Alsati, M., Katz, M., Leung, E. & Vazza, D. (2005), Creditwatch and ratings outlooks: Valuablepredictors of ratings behavior, Credit research, Standard and Poors.
Arezki, R., Candelon, B. & Sy, A. (2011), Sovereign rating news and financial markets spillovers:Evidence from the European debt crisis, IMFWorking Paper 11/68, International Monetary Fund.URL: http://www.imf.org/external/pubs/ft/wp/2011/wp1168.pdf
Bannier, C. & Tyrell, M. (2005), Modelling the role of credit rating agencies – Do they spark off avirtuous circle?, Working Paper Series: Accounting and Finance 165, W. Goethe-University.URL: https://opus.zbw-kiel.de/dspace/handle/10419/23425
Bhatia, A. V. (2002), Sovereign credit ratings methodology: An evaluation, IMF Working Paper02/170, International Monetary Fund.URL: http://ideas.repec.org/p/imf/imfwpa/02-170.html
Bollerslev, T. (1986), ‘Generalized autoregressive conditional heteroskedasticity’, Journal of econo-metrics 31, 307–327.URL: http://www.sciencedirect.com/science/article/pii/0304407686900631
Bollerslev, T., Engle, R. F. & Nelson, D. B. (1994), Chapter 49 arch models, Vol. 4 of Handbook ofEconometrics, Elsevier, pp. 2959 – 3038.URL: http://www.sciencedirect.com/science/article/pii/S1573441205800182
Brooks, R., Faff, R. W., Hillier, D. & Hillier, J. (2004), ‘The national market impact of sovereignrating changes’, Journal of Banking and Finance 28(1), 233–250.URL: http://linkinghub.elsevier.com/retrieve/pii/S0378426602004065
Cantor, R. & Packer, F. (1996), ‘Determinants and Impact of Sovereign Credit Ratings’, The Journalof Fixed Income 6(3), 76–91.URL: http://www.iijournals.com/doi/abs/10.3905/jfi.1996.408185
Carlson, M. & Hale, G. (2005), Courage to capital? A model of the effects of rating agencieson sovereign debt roll-over, Discussion Paper Series 1506, Cowles Foundation for Research inEconomics, Yale University.URL: http://papers.ssrn.com/sol3/papers.cfm?abstract_id=708581
Deb, P., Manning, M., Murphy, G., Penalver, A. & Toth, A. (2011), Whither the credit ratingsindustry?, Financial Stability Paper 9, Bank of England.
18

Duggar, E., Emery, K., Gates, D., Paulo, S., Lemay, Y. & Cailleteau, P. (2009), Emerging marketcorporate and sub-sovereign defaults and sovereign crises: Perspectives on country risk, Technicalreport, Moody’s Investors Service Global Credit Research.URL: https://www.moodys.com/sites/products/DefaultResearch/2007400000573849.pdf
Ehrmann, M., Osbat, C., Stráský, J. & Uusküla, L. (2013), The euro exchange rate during theeuropean sovereign debt crisis - dancing to its own tune?, Working Paper Series 1532, EuropeanCentral Bank.
Elkhoury, M. (2009), Credit rating agencies and their potential impact on developing countries,Compendium on debt sustainability and development, United Nations Conference on Trade andDevelopment.URL: http://unctad.org/en/docs/gdsddf20081_en.pdf#page=170
Ferri, L.-G. & Stiglitz, J. E. (1999), ‘The Procyclical Role of Rating Agencies: Evidence from theEast Asian Crisis’, Economic Notes 28(3), 335–355.URL: http://doi.wiley.com/10.1111/1468-0300.00016
Gande, A. & Parsley, D. C. (2005), ‘News spillovers in the sovereign debt market’, Journal ofFinancial Economics 75(3), 691–734.URL: http://linkinghub.elsevier.com/retrieve/pii/S0304405X04001576
Hamilton, D. & Cantor, R. (2004), Rating transitions and defaults conditional on watchlist, outlookand rating history, Special commment, Moody’s Investors Service Global Credit Research.URL: http://papers.ssrn.com/sol3/papers.cfm?abstract_id=529823
Hooper, V., Hume, T. & Kim, S.-J. (2008), ‘Sovereign rating changes – do they provide new infor-mation for stock markets?’, Economic Systems 32(2), 142–166.URL: http://linkinghub.elsevier.com/retrieve/pii/S0939362508000034
Ismailescu, I. & Kazemi, H. (2010), ‘The reaction of emerging market credit default swap spreadsto sovereign credit rating changes’, Journal of Banking & Finance 34(12), 2861–2873.URL: http://linkinghub.elsevier.com/retrieve/pii/S0378426610001913
Judge, G. G., Griffiths, W. E., Hill, R. C., Lütkepohl, H. & Lee, T.-C. (1985), The Theory andPractice of Econometrics, 2nd edn, Wiley.
Kim, S.-J. & Wu, E. (2008), ‘Sovereign credit ratings, capital flows and financial sector developmentin emerging markets’, Emerging Markets Review 9(1), 17–39.URL: http://linkinghub.elsevier.com/retrieve/pii/S1566014107000404
Kräussl, R. (2005), ‘Do credit rating agencies add to the dynamics of emerging market crises?’,Journal of Financial Stability 1(3), 355–385.URL: http://linkinghub.elsevier.com/retrieve/pii/S1572308905000069
Mora, N. (2006), ‘Sovereign credit ratings: Guilty beyond reasonable doubt?’, Journal of Banking& Finance 30(7), 2041–2062.URL: http://linkinghub.elsevier.com/retrieve/pii/S0378426605001354
19

Morris, S. & Shin, H. S. (1998), ‘Unique equilibrium in a model of self-fulfilling currency attacks’,American Economic Review 88(3), 587–97.
Nelson, D. B. (1991), ‘Conditional Heteroskedasticity in Asset Returns: A New Approach’, Econo-metrica 59(2), 347–370.URL: http://www.jstor.org/stable/2938260
Radelet, S. & Sachs, J. D. (1998), ‘The east asian financial crisis: Diagnosis, remedies, prospects’,Brookings Papers on Economic Activity 29(1), 1–90.
Reinhart, C. M. (2002), ‘Default, currency crises, and sovereign credit ratings’, World Bank Eco-nomic Review 16(2), 151–170.URL: http://ideas.repec.org/a/oup/wbecrv/v16y2002i2p151-170.html
Reisen, H. & von Maltzan, J. (1999), ‘Boom and Bust and Sovereign Ratings’, International Finance2(2), 273–293.URL: http://doi.wiley.com/10.1111/1468-2362.00028
Wu, E. & Treepongkaruna, S. (2008), Realizing the impacts of sovereign ratings on stock andcurrency markets, Conference paper, The European Financial Management Association.URL: http://www.efmaefm.org/0EFMAMEETINGS/EFMA ANNUAL MEETINGS/2008-athens/Treepongkaruna.pdf
20

Table 1: CRA Rating Grades and Definitions
Moody’s S&P Fitch DefinitionAaa AAA AAA PrimeAa1 AA+ AA+ High gradeAa2 AA AAAa3 AA- AA-A1 A+ A+ Upper medium gradeA2 A AA3 A- A-Baa1 BBB+ BBB+ Lower medium gradeBaa2 BBB BBBBaa3 BBB- BBB-Ba1 BB+ BB+ Non-investment gradeBa2 BB BB speculativeBa3 BB- BB-B1 B+ B+ Highly speculativeB2 B BB3 B- B-Caa1 CCC+ CCC Substantial risksCaa2 CCCCaa3 CCC-Ca CC Extremely speculative
CC SD DDD In default
DDD
21

Figure 1: Debt ratios and rating movements of selected Eurozone countries
50
100
150
200
2008 2009 2010 2011 2012Year
EU (27 countries) GermanyFrance Greece*Ireland Spain
(a) Debt to GDP Ratios, 2008–2012∗The haircut on Greek debt in early 2012 reduced the debt ratio
by the end of 2012 to about 158 percent of GDP.
SD
C
CC
CCC!
CCC
CCC+
B
BB
BBB
A
AA!AA
AAA
1/1/2009 7/1/2010 1/1/2012 7/1/2013
Spain Portugal Italy Ireland Greece
(b) GIPSI countries: Rating activities of S&P
22

Figure 2: Credit Default Swaps and CRA Downgrade Announcements, 2009–2012
Sources : Datastream, Events: S&P, Fitch or Moody’s Downgrade of Eurozone States’ SovereignDebt
23

Figure 3: Downgrades of the most affected countries in the Asian crisis
SDC
CCCCC!
CCCCCC+
B
BBBBB
AAA!
AAAAA
Jan!96 Jul!96 Jan!97 Jul!97 Jan!98 Jul!98
Indonesia Korea Malaysia Thailand
Figure 4: Currency movements of Asian crisis countries, 1997–1998
20
40
60
80
100
Jan!97 Jul!97 Jan!98 Jul!98 Jan!99
Indonesia Korea Malaysia Thailand
24
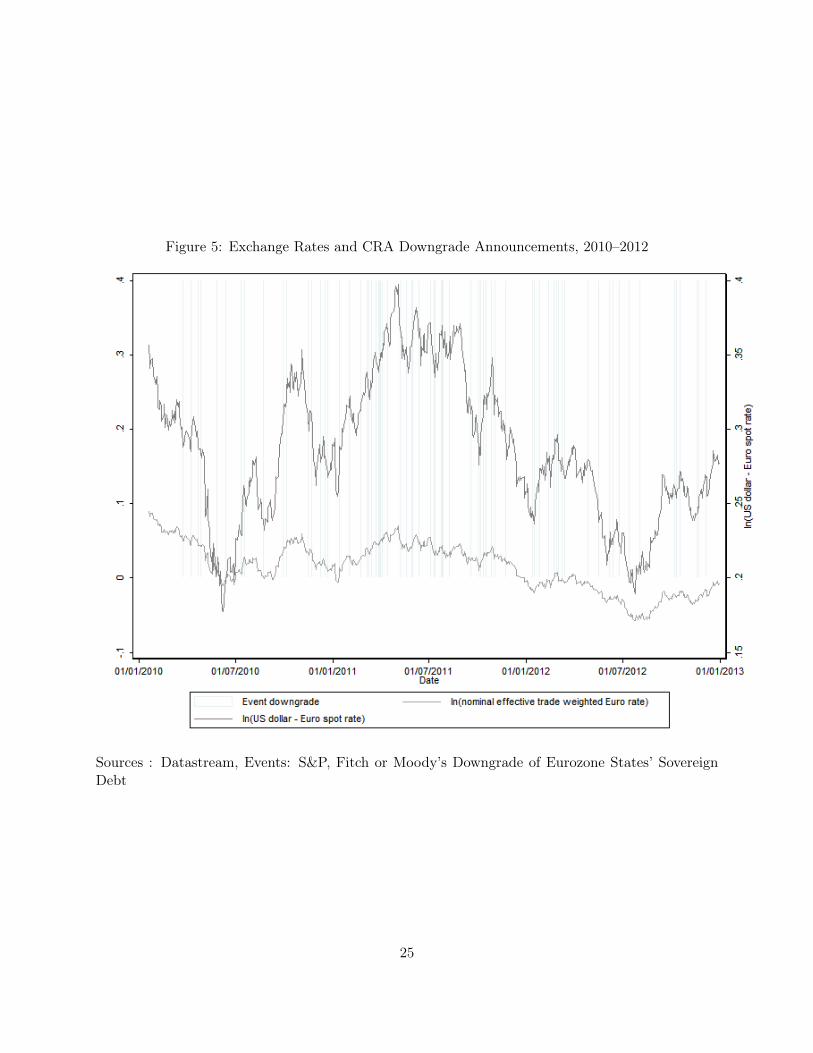
Figure 5: Exchange Rates and CRA Downgrade Announcements, 2010–2012
Sources : Datastream, Events: S&P, Fitch or Moody’s Downgrade of Eurozone States’ SovereignDebt
25

Figure 6: US/Euro Interest Rate Differential, CBOE VIX and CRA Downgrade Announcements,2010–2012
Sources : Datastream, Events: S&P, Fitch or Moody’s Downgrade of Eurozone States’ SovereignDebt
26

Figure 7: Five-year Sovereign Bond Excess Yields and CRA Downgrade Announcements, 2009–2012
Sources : Datastream, Events: S&P, Fitch or Moody’s Downgrade of Eurozone States’ SovereignDebt
27

Table 2: Significant Sovereign Debt Rating Events, 2011–2012Source Date EventStandard and Poor’s (S&P) 5 December 2011 15 Eurozone member states put on
credit watch, France among themS&P 13 January 2012 16 Eurozone countries downgraded,
France among themS&P 4 December 2012 threat to downgrade all Eurozone
(negative watch)
Moody’s 18 October 2011 threat to downgrade FranceMoody’s 13 February 2012 Downgrading of six Eurozone countries
(Italy, Malta, Portugal, Slovakia,Slovenia and Spain)
Moody’s 24 July 2012 Threat to downgrade 3 AAA-rated economiesthe next 18 months (Germany, the Netherlandsand Luxembourg) dueto developments in Spain and Greece
Moody’s 19 Nov 2012 Downgrading of France
Fitch’s Ratings 19 December 2011 Threat to downgrade France andother Eurozonecountries (Belgium, Cyprus, Ireland,Slovenia and Spain)
Fitch’s Ratings 27 January 2012 Downgrading of five Eurozone countries(Italy, Belgium, Slovenia and Cyprus)while Ireland gets a negative outlook.
Fitch’s Ratings 11 May 2012 Fitch puts all Eurozone statesnegative watch if Greece exits.
28
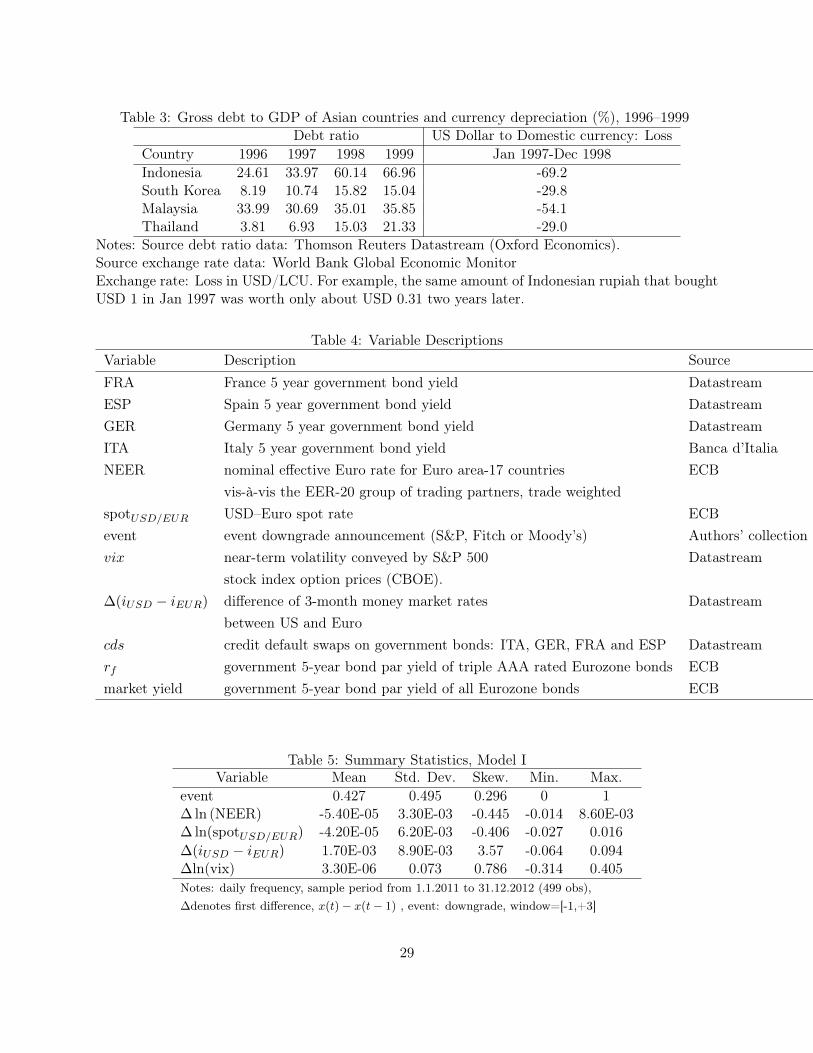
Table 3: Gross debt to GDP of Asian countries and currency depreciation (%), 1996–1999Debt ratio US Dollar to Domestic currency: Loss
Country 1996 1997 1998 1999 Jan 1997-Dec 1998Indonesia 24.61 33.97 60.14 66.96 -69.2South Korea 8.19 10.74 15.82 15.04 -29.8Malaysia 33.99 30.69 35.01 35.85 -54.1Thailand 3.81 6.93 15.03 21.33 -29.0
Notes: Source debt ratio data: Thomson Reuters Datastream (Oxford Economics).Source exchange rate data: World Bank Global Economic MonitorExchange rate: Loss in USD/LCU. For example, the same amount of Indonesian rupiah that boughtUSD 1 in Jan 1997 was worth only about USD 0.31 two years later.
Table 4: Variable DescriptionsVariable Description SourceFRA France 5 year government bond yield DatastreamESP Spain 5 year government bond yield DatastreamGER Germany 5 year government bond yield DatastreamITA Italy 5 year government bond yield Banca d’ItaliaNEER nominal effective Euro rate for Euro area-17 countries ECB
vis-à-vis the EER-20 group of trading partners, trade weightedspotUSD/EUR USD–Euro spot rate ECBevent event downgrade announcement (S&P, Fitch or Moody’s) Authors’ collectionvix near-term volatility conveyed by S&P 500 Datastream
stock index option prices (CBOE).∆(iUSD − iEUR) difference of 3-month money market rates Datastream
between US and Eurocds credit default swaps on government bonds: ITA, GER, FRA and ESP Datastreamrf government 5-year bond par yield of triple AAA rated Eurozone bonds ECBmarket yield government 5-year bond par yield of all Eurozone bonds ECB
Table 5: Summary Statistics, Model IVariable Mean Std. Dev. Skew. Min. Max.
event 0.427 0.495 0.296 0 1∆ ln (NEER) -5.40E-05 3.30E-03 -0.445 -0.014 8.60E-03∆ ln(spotUSD/EUR) -4.20E-05 6.20E-03 -0.406 -0.027 0.016∆(iUSD − iEUR) 1.70E-03 8.90E-03 3.57 -0.064 0.094∆ln(vix) 3.30E-06 0.073 0.786 -0.314 0.405Notes: daily frequency, sample period from 1.1.2011 to 31.12.2012 (499 obs),∆denotes first difference, x(t) − x(t− 1) , event: downgrade, window=[-1,+3]
29

Table 6: Summary Statistics, Model IIVariable Mean Std. Dev. Skew. Min. Max.
event 0.204 0.404 1.47 0 1∆(ESP-rf ) 2.60E-03 0.169 -0.459 -0.899 0.717∆(ITA -rf ) 2.80E-03 0.163 -0.343 -0.933 0.633∆(FRA - rf ) 2.40E-04 0.079 0.042 -0.925 0.914∆(GER - rf ) -4.30E-04 0.034 0.183 -0.155 0.171∆(market yield -rf ) 1.10E-03 0.052 -0.212 -0.225 0.167∆CDS ESP 0.046 13.6 -0.051 -60 61.3∆CDS ITA 0.172 14.8 0.365 -51.3 89.4∆CDS FRA -0.061 5.92 -0.125 -29.5 25.5∆CDS GER -0.054 2.58 0.6 -13.2 19Notes: daily frequency, sample period from 1.1.2011 to 31.12.2012 (499 obs),∆denotes first difference, x(t) − x(t− 1) , event: downgrade, window=[0,+1]
30

Table 7: Model I Results for Euro Exchange Rates∆ ln (NEER) ∆ ln (spot$/ÃŕÂ£ÅŞ)
Mean equationevent -0.0006** -0.0009*
(0.0003) (0.0005)∆ ln (vix) -0.0093*** -0.0230***
(0.0020) (0.0036)∆(iUSD − iEUR) -0.0582*** -0.1098***
(0.0129) (0.0300)constant 0.0004** 0.0006**
(0.0002) (0.0003)AR(1) -0.0659 -0.1064**
(0.0467) (0.0463)Variance equationevent 0.4095*** 0.4676***
(0.1386) (0.1347)ln (vix) 0.4662** 0.7246***
(0.2267) (0.2218)constant -12.8874*** -12.5058***
(0.7879) (0.7250)ARCH(1) 0.0085 0.0064
(0.0364) (0.0389)GARCH(1) -0.2799 -0.2495
(0.3810) (0.3225)Chi2(df) 45.6(4) 59.8(4)p-value 0.00000 0.00000Log-Likelihood 2174.6 1873.9Obs 499 499Notes: Standard errors in parentheses, *** p<0.01, ** p<0.05, * p<0.1event: downgrade, window= [-1,+3]
31

Table 8: Model II Results for Sovereign Bond Yields∆ESP ∆ITA ∆FRA ∆GER
Mean equationevent 0.0157* 0.0109* 0.0083** -0.0069**
(0.0086) (0.0063) (0.0038) (0.0032)mkt excess yield 1.1616*** 1.0983*** 0.1291*** -0.0869***
(0.0956) (0.0691) (0.0283) (0.0213)∆cds 0.0046*** 0.0048*** 0.0004 -0.0022***
(0.0004) (0.0003) (0.0003) (0.0006)∆ ln(vix) -0.0404 0.0159 -0.0089 -0.0657***
(0.0540) (0.0451) (0.0259) (0.0171)constant -0.0032 -0.0024 0.0001 0.0000
(0.0042) (0.0030) (0.0012) (0.0009)AR(1) -0.2140*** -0.1192** -0.3734*** -0.2553***
(0.0431) (0.0484) (0.0397) (0.0495)Variance equationevent -0.7299 -0.3560 1.2367*** -0.5564
(0.6958) (1.0136) (0.1539) (0.8345)cds 0.0092*** 0.0074*** 0.0041 0.0471***
(0.0013) (0.0017) (0.0036) (0.0132)ln(vix) -0.0881 0.0979 2.6515*** 0.2966
(0.3181) (0.7902) (0.4194) (0.6932)constant -8.1944*** -9.4604*** -15.2387*** -10.9075***
(1.1776) (2.1879) (0.9890) (1.7494)ARCH(1) 0.0304 0.1707*** 0.9788*** 0.1557**
(0.0424) (0.0655) (0.1420) (0.0673)GARCH(1) 0.7447*** 0.7263*** -0.0458** 0.5030***
(0.1441) (0.0875) (0.0203) (0.1924)GED shape 1.5576*** 1.5624*** 1.6935*
(0.1413) (0.1287) (0.1722)constant 0.4351*** 0.4462*** 0.5268***
(0.0880) (0.0821) (0.1017)Chi2(df) 718.2(5) 1422.4(5) 129.4(5) 110.0(5)p-value 0.00000 0.00000 0.00000 0.00000Log-Likelihood 395.9 533.5 819.4 1086.5Obs 499 499 499 499Notes: Standard errors in parentheses, *** p<0.01, ** p<0.05, * p<0.1event window= [0,+1], GER bonds: only significant events (see Table 1) [0,+2]Test GED shape parameter, H0: GED shape=2 (normal distr)
32

Table 9: Model III Results for Sovereign Bond Yields with Event Interactions∆ESP ∆ITA ∆FRA ∆GER(1) (1) (1) (1)
Mean equationevent 0.0203** 0.0078 0.0088* -0.0082**
(0.0093) (0.0064) (0.0050) (0.0038)mkt excess yield 1.1203*** 1.1026*** 0.1179*** -0.0875***
(0.0966) (0.0708) (0.0300) (0.0213)mkt excess yield ×event 0.0796 0.0008 0.0323** 0.0021
(0.0539) (0.0320) (0.0126) (0.0023)∆cds 0.0048*** 0.0048*** 0.0007** -0.0022***
(0.0004) (0.0003) (0.0003) (0.0006)∆cds× event -0.0004 0.0000 -0.0005*** 0.0001
(0.0003) (0.0002) (0.0002) (0.0002)∆ ln(vix) -0.0411 0.0187 -0.0132 -0.0644***
(0.0545) (0.0458) (0.0207) (0.0171)constant -0.0044 -0.0016 -0.0003 0.0001
(0.0044) (0.0031) (0.0011) (0.0009)AR(1) -0.2130*** -0.1228** -0.3545*** -0.2591***
(0.0437) (0.0486) (0.0421) (0.0495)Variance equationevent -0.8671 -2.4819 3.9941*** 0.1381
(2.0983) (2.6426) (0.4143) (2.1582)cds 0.0091*** 0.0059*** 0.0164*** 0.0494***
(0.0016) (0.0021) (0.0043) (0.0139)cds× event 0.0002 0.0081 -0.0301*** -0.0188
(0.0077) (0.0074) (0.0050) (0.0556)ln(vix) -0.0487 0.0141 1.4135*** 0.2081
(0.3153) (0.7809) (0.4700) (0.7107)constant -8.2548*** -8.7195*** -12.8045*** -10.7494***
(1.2095) (2.2040) (1.1146) (1.7476)ARCH(1) 0.0295 0.1769*** 0.8550*** 0.1602**
(0.0427) (0.0681) (0.1266) (0.0686)GARCH(1) 0.7439*** 0.7086*** -0.0283 0.5049***
(0.1441) (0.0912) (0.0191) (0.1859)GED shape 1.5576*** 1.5651*** 1.6970*
(0.1413) (0.1241) (0.1727)constant 0.4431*** 0.4480*** 0.5289***
(0.0907) (0.0793) (0.1018)Chi2(df) 728.8(7) 1443.3(7) 133.3(7) 112.2(7)p-value 0.00000 0.00000 0.00000 0.00000Log-Likelihood 397.2 534.8 848.9 1087.4Obs 499 499 499 499Notes: Standard errors in parentheses, *** p<0.01, ** p<0.05, * p<0.1event window= [0,+1], GER bonds: only significant events (see Table 1) [0,+2]Test GED shape parameter, H0: GED shape=2 (normal distr)
33