Credit in Rural America - USDA ERS - Home
18
T his report assesses the demand for and availabil- ity of credit in rural areas for agriculture, hous- ing, and rural development, as mandated by Section 650 of the Federal Agriculture Improvement and Reform Act of 1996. Its purpose is to provide the most recent and comprehensive information available on the performance of rural financial markets as Congress deliberates on legislation addressing agricul- tural and rural credit issues, including the availability of credit and changes in Federal credit policy. The 1996 Act specifically requested that the study be based on the most recently available data to analyze: (1) rural demand for credit from the Farm Credit System, the ability of the Farm Credit System to meet the demand, and the extent to which the Farm Credit System provides loans to satisfy the demand; (2) rural demand for credit from the United States banking system, the ability of banks to meet the demand, and the extent to which banks provide loans to satisfy the demand; (3) rural demand for credit from the Secretary, the ability of the Secretary to meet the demand, and the extent to which the Secretary provides loans to sat- isfy the demand; (4) rural demand for credit from other Federal agen- cies, the ability of the agencies to meet the demand, and the extent to which the agencies provide loans to satisfy the demand; (5) what measure or measures exist to gauge the overall demand for rural credit, the extent to which rural demand for credit is satisfied, and what the measures have demonstrated; (6) a comparison of the interest rates and terms charged by the Farm Credit System Farm Credit Banks, production credit associations, and banks for cooperatives with the rates and terms charged by the banks of the United States for credit of comparable risk and maturity; (7) the advantages and disadvantages of the mod- ernization and expansion proposals of the Farm Credit System on the Farm Credit System, the United States banking system, rural users of credit, local rural communities, and the Federal Government, including: • any added risk to the safety and soundness of the Farm Credit System that may result from approval of a proposal; and • any positive or adverse impacts on competition between the Farm Credit System and the banks of the United States in providing credit to rural users; (8) the nature and extent of the unsatisfied rural credit need that the Farm Credit System proposals are supposed to address and what aspects of the pre- sent Farm Credit System prevent the Farm Credit System from meeting the need; (9) the advantages and disadvantages of the propos- al by commercial bankers to allow banks access to the Farm Credit System as a funding source on the Farm Credit System, the United States banking sys- tem, rural users of credit, local rural communities, and the Federal Government, including: • any added risk to the safety and soundness of the Farm Credit System that may result from approval of the proposal; and • any positive or adverse impacts on competition between the Farm Credit System and the banks of the United States in providing credit to rural users; and (10) problems that commercial banks have in obtaining capital for lending in rural areas, how access to Farm Credit System funds would improve the availability of capital in rural areas in ways that Economic Research Service/USDA Credit in Rural America 1 Credit in Rural America
Transcript of Credit in Rural America - USDA ERS - Home

This report assesses the demand for and availabil-ity of credit in rural areas for agriculture, hous-ing, and rural development, as mandated by
Section 650 of the Federal Agriculture Improvementand Reform Act of 1996. Its purpose is to provide themost recent and comprehensive information availableon the performance of rural financial markets asCongress deliberates on legislation addressing agricul-tural and rural credit issues, including the availabilityof credit and changes in Federal credit policy.
The 1996 Act specifically requested that the study bebased on the most recently available data to analyze:
(1) rural demand for credit from the Farm CreditSystem, the ability of the Farm Credit System tomeet the demand, and the extent to which the FarmCredit System provides loans to satisfy the demand;
(2) rural demand for credit from the United Statesbanking system, the ability of banks to meet thedemand, and the extent to which banks provideloans to satisfy the demand;
(3) rural demand for credit from the Secretary, theability of the Secretary to meet the demand, and theextent to which the Secretary provides loans to sat-isfy the demand;
(4) rural demand for credit from other Federal agen-cies, the ability of the agencies to meet the demand,and the extent to which the agencies provide loansto satisfy the demand;
(5) what measure or measures exist to gauge theoverall demand for rural credit, the extent to whichrural demand for credit is satisfied, and what themeasures have demonstrated;
(6) a comparison of the interest rates and termscharged by the Farm Credit System Farm CreditBanks, production credit associations, and banks forcooperatives with the rates and terms charged by the
banks of the United States for credit of comparablerisk and maturity;
(7) the advantages and disadvantages of the mod-ernization and expansion proposals of the FarmCredit System on the Farm Credit System, theUnited States banking system, rural users of credit,local rural communities, and the FederalGovernment, including:
• any added risk to the safety and soundness ofthe Farm Credit System that may result fromapproval of a proposal; and
• any positive or adverse impacts on competitionbetween the Farm Credit System and the banksof the United States in providing credit to ruralusers;
(8) the nature and extent of the unsatisfied ruralcredit need that the Farm Credit System proposalsare supposed to address and what aspects of the pre-sent Farm Credit System prevent the Farm CreditSystem from meeting the need;
(9) the advantages and disadvantages of the propos-al by commercial bankers to allow banks access tothe Farm Credit System as a funding source on theFarm Credit System, the United States banking sys-tem, rural users of credit, local rural communities,and the Federal Government, including:
• any added risk to the safety and soundness ofthe Farm Credit System that may result fromapproval of the proposal; and
• any positive or adverse impacts on competitionbetween the Farm Credit System and the banksof the United States in providing credit to ruralusers; and
(10) problems that commercial banks have inobtaining capital for lending in rural areas, howaccess to Farm Credit System funds would improvethe availability of capital in rural areas in ways that
Economic Research Service/USDA Credit in Rural America 1
Credit in Rural America

cannot be achieved in the system in existence on thedate of enactment of this Act, and the possibleeffects on the viability of the Farm Credit System ofgranting banks access to Farm Credit System funds.
For a number of reasons, this study is unable torespond fully to several of these issues, at least as theyhave been posed. Time restrictions and data availabili-ty are both limiting factors. In addition, the nature ofcredit markets, where each participant’s behavior isaffected to some degree by that of its competitors,makes evaluation of individual participant performancedifficult. Nonetheless, every attempt has been made toaddress each of the issues raised, to the extent possible.
While the thrust of many of the mandate’s questions ison demand for credit, this study includes informationabout the supply of credit and credit substitutes (out-side equity capital and Federal grants) that Congressdid not specifically request in an attempt to provide amore comprehensive view of the financial landscapefaced by rural borrowers. Nonetheless, this analysisfocuses on the aggregate performance of rural financialmarkets for each of the broad classes of borrowersmentioned in the Congressional mandate rather than onthe performance of individual markets. That is, avail-able data and financial market research have beenreviewed to ascertain if rural residents face widespreadproblems in accessing competitively priced credit. Noattempt has been made to evaluate financial marketconditions in specific rural communities or to highlightany sporadic or localized financial market failures thatmay exist in rural America.
This aggregate approach is consistent with the types ofpolicy changes the Congress requested USDA toassess. Expanding the lending authority of the FarmCredit System (FCS) and the commercial banking sys-tem’s access to FCS funds are both “broad-brush” poli-cy changes aimed at increasing rural credit availability.Neither approach targets documented financial marketproblems affecting specific communities or specificgroups of borrowers. Furthermore, since the publicbenefits of both proposed policy changes accrue onlyin markets where competitive performance isimproved, neither policy change will be cost effectiveunless rural financial market problems are widespread.In contrast, cost-effective solutions to credit problemsthat are localized, sporadic, or limited to particular bor-rower groups would entail tightly targeted policy
approaches based on additional study. Examples ofsuch policies might include lowering barriers to entry,reducing the costs of serving poorly functioning mar-kets, or providing subsidies that are directly related tomarket performance.
Rural Credit Demand, Its Satisfaction, andRural Credit Supply
The legislative language requesting this report focuseson rural credit demand and the satisfaction of thatdemand. “Rural” is left undefined, and different pro-grams, studies, and data sources use different defini-tions (see box). In this study, “rural” means nonmetro-
2 Credit in Rural America Economic Research Service/USDA
“Rural” is a Matter of Perspective
For our purposes, “rural” is synonymous with “non-metropolitan.” Both terms refer here to counties thatare not part of a metropolitan statistical area as definedin 1993 (based on population and commuting datafrom the 1990 Census). The United States had 2,288nonmetropolitan counties in 1993, accounting for 83percent of the Nation’s land and 21 percent of its pop-ulation. (For a more complete description of the ruraleconomy, see Understanding Rural America, pub-lished by USDA.) While this definition is commonlyused because of the availability of county-level data, itis not universally accepted and many Federal programsand economic studies use alternative definitions.
The Census Bureau classifies open country and com-munities with populations under 2,500 located outsideurbanized* areas as “rural.” This definition includeslarge sparsely populated portions of metropolitanareas, but excludes cities in remote nonmetropolitanlocations. USDA’s rural development programs use anumber of different population size limits to determineeligibility. The Business and Industry loan programserves eligible borrowers in open country and in citiesof under 50,000. The guaranteed housing programserves open country, metropolitan cities with less than10,000 residents, and nonmetropolitan cities of lessthan 20,000. Aggregate “rural” data will differ as thedefinition changes, but since nonmetropolitan areasconstitute a major portion of each of the commonlyused definitions of “rural,” the same general patternswe report should emerge using other definitions.
* Urbanized areas are cities and built-up surrounding areas that,together, contain at least 50,000 people.

politan counties whenever data are presented.However, the literature referred to often relies on alter-native definitions. The phrase credit demandis alsoopen to interpretation. In this report, we use the eco-nomic definition: demand is the amount of credit (of acertain type, maturity, etc.) that borrowers will chooseto incur and pay for at a given price. Such decisionsdepend on both economic considerations and consumerpreferences. Economic considerations include suchfactors as the borrower’s income and the prices andqualities of other goods and services. Noneconomicconsiderations include such factors as the borrower’swillingness to defer consumption or investment untilsufficient savings can be accumulated and his or hercommunity’s view of debt. Although credit marketsare complicated because they involve transactions thatoccur over extended periods of time and involve sellerswho cannot verify that they will receive payment fortheir services, the basic economic principles apply.
The desires of potential consumers who are unwillingor unable to pay are not included in economic demand.In this way credit is no different from other goods andservices. Requests from those who are unable orunwilling to repay loans and their associated costs can-not be considered to create economic credit demand. Ifthey were, demand would quickly outpace supply, andwe would have to use a nonmarket mechanism to allo-cate the limited amount of loanable funds available.Attempts by other societies to rely heavily on nonmar-ket mechanisms for allocating credit have met withonly temporary and limited success.
The ability to satisfy credit demandis linked closely tothe definition of credit demand. As discussed, “creditdemand” refers to the relationship between the amountof credit borrowers choose to use and the price theymust pay for that credit, holding other things constant,including income and other prices. Not all demandsare satisfied in any market at any time because a priceexists below which a given good or service will not bevoluntarily traded by providers.
From a rural development policy perspective, the keyquestions concerning the satisfaction of credit demandare:
• whether the equilibrium price for credit (i.e., theeffective interest rate at which supply equalsdemand) is significantly different in rural andurban financial markets;
• whether rural lenders can respond in a timely fash-ion to changes in the level of legitimate loanrequests by creditworthy borrowers; and
• whether rural financial markets are sufficientlycompetitive to allocate credit efficiently.
A higher effective interest rate in rural areas is notproof that a rural credit market problem exists, nor areequivalent interest rates in rural and urban areas proofthat credit market problems do not exist. Interest ratesshould vary with the riskiness of the loans being madeand other lending costs. But since transactions costs,barriers to entry, and imperfect information reduce thegeographic mobility of financial capital, differences ininterest rates can also result from local financial marketimperfections. These imperfections, if they exist, areconcerned more with the supply of credit and the struc-ture of financial markets than they are with demand forcredit.
Thus, a key concern is whether rural financial marketscan quickly adjust to changes in legitimate requests bycreditworthy borrowers. Such changes may occur, forexample, because profitable investment opportunitiesarise as prices, technology, or consumer preferenceschange. The final issue is whether or not the equilibri-um level of credit in a given market is consistent withefficient economic performance. An equilibrium levelmay be inefficient if supply conditions are not competi-tive because of such factors as naturally monopolisticmarkets, legal constraints to competition, unwillingnessto provide credit to certain types of borrowers or forcertain purposes, inability of lenders to efficientlydiversify or hedge risks, and the inability of lenders tocorrectly verify the willingness and ability of borrow-ers to repay loans and interest. In assessing the perfor-mance of rural financial markets, each of these issueswill be addressed to the extent that data allow (see box,“Data Limitations”).
Measuring and Evaluating Market Performance
For the most part, this study adopts an economic efficiency framework to discuss the qualitative performance of rural markets. In an efficient capitalmarket, all borrowers having the same creditworthinesshave similar access to credit, with the cost of borrow-ing being a function of the riskiness, term to maturity,and other cost-related characteristics of the loan. The
Economic Research Service/USDA Credit in Rural America 3

4 Credit in Rural America Economic Research Service/USDA
Data limitations required significant adjustments in thefocus of the report. Definitive information pertaining tothe following issues is not available:
• economic measures of rural credit demand and itssatisfaction;
• comparisons of the cost of credit of comparablerisk and maturity from different lenders;
• accurate measures of rural financial market performance and concentration; and
• the magnitude of likely benefits from improvingthe competitive performance of rural financialmarkets through additional FCS activity.
As discussed elsewhere, measuring unsatisfied economicdemand for any good or service is difficult, but doing so isnearly impossible for financial services because of theadded dimensions of risk and informational problems.Information on the qualifications of loan applicants, loanterms, and financial market conditions is needed to com-pare market outcomes. For housing loans, the Departmentof Housing and Urban Development collects informationunder the Home Mortgage Disclosure Act (HMDA) on allapplications for mortgages (from particular institutions).While this data is not comprehensive, it does provide uni-form information on the percent of denials by type of insti-tution, location, and race of applicant. Such informationmay be helpful, but it is not conclusive because detailedinformation on an applicant’s financial status, and thuswhether an application is denied for economic or other rea-sons, is not collected. Unfortunately, HMDA informationis generally unavailable on rural credit applicants sincemany rural lenders are exempt from the reporting require-ments. Similar information is not collected on applicationsfor other types of loans from either rural or urban lenders,leaving very little direct evidence of variation in unmetdemand for credit.
While information sufficient to assess variations in thedemand for credit is not available, other indices exist forgauging the performance of rural financial markets. Byrelying on these subjective indicators and by focusing onthe ability of rural lenders to respond to increases in thedemand for credit—and the likelihood that market forceswill be conducive to their doing so—this study addressesthe underlying issue of whether additional Federal inter-vention in rural credit markets could be warranted.
Comparing credit costs across lenders for loans of compa-rable risk and maturity is also impossible with available
data. Doing so requires information linking borrowercharacteristics to loan characteristics—such as fees, matu-rity, collateral, and pricing. Although several data sourcescontain loan level interest rates on loans to agriculture,housing, and small businesses in rural areas, these sourcesdo not include important information about noninterestborrowing costs and loan riskiness. Data are unavailableon such relevant items as origination fees, stock purchaserequirements, compensating balances in deposit accounts,borrower income, debt level, and estimated repaymentcapacity. Such data are necessary to make comparisons ofcredit costs as meaningful as possible since markets varywith borrower characteristics as well as loan products;each lender type often serves a slightly different set of bor-rowers or financial service needs. In addition, to protectlender confidentiality and borrower privacy, data linkingloans to the geographic location of borrowers or lenderswere often unavailable for analysis. This data gap pre-vents analysis of the relation between market conditionsand loan characteristics.
Even determining the relevant market and the competitiveenvironment within that market is far from straightforward.The choice of potential lenders a borrower faces varieswith the size and type of loan, the size and type of borrow-er, the borrower’s location, and a host of other factors.While county or metropolitan area boundaries are oftenused to measure market concentration, they are arbitraryand potentially misleading. Furthermore, since data on thegeographic distribution of lending activity is seldom avail-able, most measures of market concentration are based ondeposits, ignoring the impact of nondepository lenderssuch as the Farm Credit System.
Finally, in weighing the costs and benefits of additionalFCS activity, an important factor is the likelihood that suchactivity will have measurable impacts on the competitiveperformance of individual credit markets. No quantitativeinformation on the link between FCS activity and creditmarket performance could be found in the literature.
Despite shortcomings in available data, the conclusions ofthis report, focusing as they do on broad trends and condi-tions, rest on a solid foundation. General knowledge offinancial markets, previously published research on finan-cial market performance and imperfections, and the empir-ical analysis completed for this report are all used torespond to the issues this study was asked to address. Thisreport strives to indicate clearly both the limits of currentknowledge of rural financial markets and what is knownwith confidence.
Data Limitations

major components of the cost of credit are the cost ofcapital and the cost of risk-bearing, neither of whichshould vary geographically in an efficient capital mar-ket.1 Variations in personnel and other costs remain,but these have a relatively minor impact on the cost ofcredit. Thus, in efficient markets, otherwise identicalborrowers face similar supply curves for credit, no mat-ter where they reside. Differences in the use of creditin such markets are a function of demand.
Competitive financial markets allocate capital efficient-ly, but not all markets are equally competitive. Whenfew competitors dominate a market, they have thepower to affect equilibrium prices and quantities. Atthe extreme, profit-maximizing monopolists restrictsupply, thereby increasing the price above that whichwould prevail in a competitive market. Market powercan be used in this way to earn extra profits, or it cansupport inefficient operations that spend more than nec-essary on salaries, buildings, or other inputs that bene-fit managers and owners but not customers. Whileinsufficient data are available to precisely measurerural financial market performance, measures of marketstructure are more readily available; and a large bodyof research exists linking structure to performance (seeGilbert, 1984; and Rhoades, 1995).
Market power can persist and local financial marketconditions vary significantly because the following fac-tors all reduce competition between lenders in differentgeographic regions and specializing in different loanproducts:
• high information and transactions costs;
• low profit potential from new entry;
• regulated, legislated, and institutionalized marketsegmentation;
• informational asymmetries; and
• cultural or personal biases (discrimination).
As a result of market segmentation, borrowers in dif-ferent markets often face different supply curves.Market segmentation refers to the division of markets(here the market for borrowed funds) into insulatedparts or submarkets. Such segmentation can occur, forexample, because of geographic isolation, transactioncosts, or legal barriers to competition. Segmentationmay limit the number of competitors in a submarketand allow them to earn greater profits or operate lessefficiently than they would in a more competitive envi-ronment. The insulation of the segments need not betotal for these effects to occur. Thus, similar loanrequests from borrowers having the same characteris-tics may be treated very differently from one communi-ty to the next, and borrowers with similar loan purpos-es or collateral may be treated differently depending onthe type of lender they approach.
In considering credit demand from commercial sources,such as the Farm Credit System or commercial banks,an economic efficiency perspective is appropriate.However, the Federal Government has intervened inrural credit markets for two reasons: to enhance eco-nomic efficiency and to address concerns about socialequity or fairness. While these two concerns oftenarise in tandem, they have very different aims andimplications for demand. Moves toward market effi-ciency add to the resources available to society, and,therefore, are potentially self-financing. Appropriatelypriced “market efficiency” program funds can be allo-cated the same as private-sector loans are to meetdemand. But programs to attain social fairness throughcredit markets tend to create economic inefficiencies,requiring public subsidies to attain program goals.
Government programs that provide subsidized creditattempt to bolster the economic activity or well-beingof those served (who may or may not qualify for com-mercial credit). Demand for subsidized credit is large-ly insatiable because of the economic benefitsbestowed on recipients through preferential loan terms.Thus, the ability of subsidized government programs tosatisfy borrower demand is irrelevant. Rather, theireffectiveness depends solely on their ability to cost-effectively satisfy their public purpose. Judging how“fair” the results are requires a set of value judgmentsabout who does and does not deserve credit and howmuch subsidy (both directly, in terms of borrowingcosts, and indirectly, in terms of forgone economicgrowth) society is willing to provide. These judgments
Economic Research Service/USDA Credit in Rural America 5
1 In an efficient market, capital is free to flow to its best use, and only risk that cannot be eliminated in an efficiently diversified investment portfolio is priced—and that price should not vary with where the loan is originated orheld. Nor should the cost of credit vary appreciably by the size of thelender. Economies of size and scope are relatively minor in the commercialbanking industry, with fairly small banks (with assets of $75 million to$300 million) exhibiting minimum average costs (Berger and Humphrey,1992).

are best addressed through the political decisionmakingprocess and are not evaluated in this study.
In addressing the 10 issues raised by Congress, thisreport first addresses the ability of the major rurallender categories to meet changes in the level ofdemand in a timely fashion and the extent to whichthey have provided rural loans for various purposes inthe recent past (addressing parts of questions 1 through4 on page 1). The study then assesses the demand forcredit by agriculture, and the rural housing, business,and community development sectors, and evaluateshow well rural financial markets appear to be satisfyingthat demand (addressing parts of questions 1 through6). Based on this research, the need for an expandedFCS role in rural financial markets is examined(addressing questions 7 through 10). This report issupplemented by several lengthy appendices whichprovide more detailed evidence on each of these issues.
Rural Lenders
Rural borrowers are served by a wide variety of finan-cial service providers. The most visible sources areregulated financial institutions—particularly commer-cial banks, savings and loans (for housing), and theFCS (for agriculture). However, other institutions andindividuals play important roles by supplying credit orby enhancing the competitiveness of rural financialmarkets. Table 1 lists the potential sources of creditand financial market support for agriculture and ruralhousing, business, and development. (Appendix A pro-vides a more detailed overview of these financial ser-vice providers and their importance in rural America,and discusses some of the trends and policy develop-ments affecting their performance.) Retail lenders areresponsible for originating loans; the degree of compe-tition among them can determine how efficiently bor-rowers are served. The type of financing supplied byretail lenders is a function of their charter (whichdefines the scope of their lending authority), safety andsoundness considerations, comparative cost and mar-keting advantages, source of funds, and alternativeinvestment opportunities. As a result, most retaillenders are not major sources of credit for all borrowercategories, and they often specialize in providing par-ticular types of loans or serving particular risk classesof borrowers within the markets they serve. The result-ing segmentation of credit markets along product, geo-
graphic, and borrower characteristic lines reduces com-petition among lenders.
In part, government-supported secondary markets andcredit enhancement programs were initiated to helpfoster greater competition for eligible loans. Theyencourage the creation of new competitors, or increasethe size of the market served by existing lenders andincrease the lending capacity of lenders within a givenmarket. Borrowers do not typically interact directlywith the institutions and entities listed on the lower halfof table 1. These organizations typically deal withretail lenders, buying eligible loans, serving as conduitsor guarantors for the sale of mortgage-backed securi-ties, providing cash advances, and guaranteeing orinsuring eligible loans originated by lenders.Nonetheless, their existence has had a marked impacton retail lender behavior and, to varying degrees, onfinancial market performance.
The Congressional request for this study specificallyasked for information on the commercial banking sys-tem, the Farm Credit System, credit programs operatedby USDA, and credit programs administered by otherFederal agencies. The remainder of this section focus-es on these lender groups, describing the markets theyserve, their current financial strengths and weaknesses,and factors affecting their abilities to respond tochanges in economic demand for credit.
Commercial Banks
By any measure, commercial banks dominate mostrural financial markets and are well positioned to pro-vide financial support to rural sectors of the economy.Since 1991, loan loss provisions and problem loanshave declined for commercial banks nationwide. Bankprofitability is high, as are interest rate margins andcapital levels. The financial condition of banks head-quartered in rural America was particularly healthygoing into 1996 (fig. 1).
Rural banks provide credit for a wide range of uses,including home mortgages, consumer loans, agriculturalloans, and commercial/industrial loans. In addition tolending, rural banks hold tax-exempt securities used tofinance State and local government activities. Loansheld by rural banks reflect the local economies theyserve. Agricultural loans are a higher share of totalloans than commercial and industrial loans, and both arefar less prevalent than home mortgages (fig. 2).
6 Credit in Rural America USDA/Economic Research Service

Commercial banks have historically provided short-and medium-term credit for agriculture and the non-farm rural business sector. Banks have preferred short-term loans and relatively liquid investments since theyrely on short-term deposits for most of their loanablefunds. Nonetheless, in recent years, agricultural realestate and home mortgages have been growing withinrural bank loan portfolios.
Loan-to-deposit ratios are a widely cited measure of abank’s liquidity and its ability to provide an adequatesupply of loanable funds. In response to an expandingeconomy, average loan-to-deposit ratios at rural bankshave grown since 1991. In the past, a high loan-to-deposit ratio might have caused many banks to reducetheir lending efforts as they put more emphasis onretaining liquidity through holdings of cash and securi-
USDA/Economic Research Service Credit in Rural America 7
Table 1—Sources of credit for agriculture and rural housing, business, and developmentCredit sources vary depending on the nature of the loan.
Type of loan
Small CommunityType of lender Agriculture Housing business development
Retail lenders: Relative importance of lenderRegulated financial institutions
Commercial banks major major major majorFarm Credit System major minor minor minorThrift institutions minor major minor minorInsurance and pension funds moderate — moderate1 minor
Unregulated lendersFinance companies moderate minor moderate —Mortgage brokers minor major — —Trade credit suppliers moderate — moderate —Nonprofits (revolving loan funds, etc.) — minor minor minorIndividuals moderate moderate moderate moderate
Government direct loan programsU.S. Department of Agriculture moderate minor — minorOther Federal agencies — minor minor —State and local agencies minor minor minor major
Secondary markets and credit enhancements:Government-sponsored enterprises
Federal National Mortgage Assn. — major — —Federal Home Loan Mortgage Corp. — major — —Federal Home Loan Bank System — major — minorFederal Agricultural Mortgage Corp. minor minor minor2 minor2
Farm Credit System (OFI lending) minor — — —Government agencies
U.S. Department of Agriculture moderate moderate minor moderateOther Federal agencies minor moderate moderate minorState and local agencies minor minor minor minor
Private sectorLoan poolers minor2 minor minor2 minor2
Loan guarantors/insurers minor moderate minor minor
Note: Precise estimates of the relative importance of specific lenders within rural credit markets are generally unavailable. Categorizationsare based on survey data, administrative records, and anecdotal evidence. See appendices A and B for details. A major participant provides orsupports more than 20 percent of the market; moderate participants handle 5 to 20 percent of the market; minor participants handle less than 5percent of the market.
1 The insurance industry’s assets include substantial commercial real estate holdings as well as corporate stocks and bonds and tax-exemptsecurities. While not considered major lenders to small independent rural business, insurance company investments may directly and indirectlyfinance the rural branch plants of large and medium-sized businesses.
2 Support is provided primarily for federally guaranteed loans.— Indicates no lending or an insignficant amount of lending.

8 Credit in Rural America Economic Research Service/USDA
1990 1991 1992 1993 1994 199550
60
70
80
90
Rural
All
1990 1991 1992 1993 1994 19952
3
4
5
Rural
All
Percent
Net interest margins
Source: Calculated by ERS from the Report of Condition and Report of Income, December 31, 1990-95.
1990 1991 1992 1993 1994 19950.0
0.5
1.0
1.5
2.0
2.5
Rural
All
Percent
Loan loss provisions/loans outstandingA healthy economy allowed banks to keep loan loss provisions at low levels in 1995.
1990 1991 1992 1993 1994 19950
5
10
15
20
25
30
Rural
All
Percent
Problem loans as a share of bank capitalBad loans continued to decline relative torural bank capital.
Net interest margins declined but remainhigh enough to support strong bank profits.
1990 1991 1992 1993 1994 19958
9
10
11
Rural
All
Percent
Capital/asset ratiosCapital grew rapidly as a proportion of assets atrural banks in 1995.
Rural bank loan ratios moderated a bitin 1995.
1990 1991 1992 1993 1994 19950.0
0.4
0.8
1.2
1.6
Rural
All
Percent
Return on bank assetsBank profits climbed slightly relative toassets in 1995.
Commercial bank finances, 1990-95Figure 1
Bank loan/deposit ratios
Percent

ties. Also of concern is the slow growth in the bankingindustry’s deposit base over the last several years.Between 1990 and 1995, total deposits at rural-head-quartered commercial banks increased only 6 percent,compared with 14 percent industrywide.2 Both growthfigures are less than robust, particularly given the trans-fer of deposits from thrifts to commercial banks inrecent years. Slow deposit growth is consistent withthe growth of mutual funds and money market funds,which bankers claim are siphoning funds away fromlocal credit markets nationwide.
Despite these trends, surveys indicate that rural bankersare not reluctant to make additional loans to creditwor-thy borrowers.3 In recent years, rural banks havegained access to a growing number of alternatives to
local deposits to fund new loans (see “CommercialBank Liquidity,” in appendix C). They can sell loansor securities from their portfolios or use them as collat-eral for short-term loans from a variety of sources.4
Many rural banks are now members of the FederalHome Loan Bank System, which allows them access to
Economic Research Service/USDA Credit in Rural America 9
Distribution of commercial bank assets and loans, 1995Figure 2
0
20
40
60
80
100
All
Rural
Percent
Agricultural Consumer Other0
10
20
30
40Percent
Asset holdings Loan portfolios
Other real
estate
Home mortgage
Com-mercial
Cash Heldsecurities
For-salesecurities
Net loans/leases
OtherFed-Fund/Repos
Source: Calculated by ERS using data from the Report of Condition and Report of Income, Dec. 31, 1995.
Rural banks hold a relatively large percentage of total assets in securities, but loans predominate.
Rural banks hold relatively fewer commercial loans but more agricultural loans.
3 Agricultural banker responses to quarterly surveys conducted by theFederal Reserve Banks of Chicago, Kansas City, Dallas, Minneapolis, andRichmond indicate an increasing percentage have more funds available forlending than they did the previous quarter. For the first two quarters of1996, a lower percentage of respondents stated that fund availability wasfalling than did in the previous year. (The Kansas City district had the high-est percentage of agricultural banks with falling availability of funds—16percent in June 1996 compared with 18 percent in June 1995.) Mostrespondents stated that their loan-to-deposit ratios were lower than desired(Walraven and Carson, 1996). Based on preliminary results from a recentnationwide survey of agricultural banks, 72 percent of respondents reportedthat deposits were growing fast enough to keep up with loan demand(American Bankers Association, 1996).4 The outright sale of government securities is less likely these days due toaccounting regulations governing the valuation of security holdings. Banksmust designate securities in their portfolios that might be sold prior to theirmaturity dates. Those securities must then be valued at their current marketvalues on quarterly financial reports, which makes bank balance sheets sub-ject to greater interest rate risk.
2 Total deposits at rural-headquartered banks reflect changes in bank struc-ture as well as changes in depositor behavior. In particular, bank mergersand the conversion of multibank holding company affiliates into bankbranches artificially inflate urban bank deposits and deflate rural bankdeposits. More troubling is the sluggish growth in the industry’s totaldeposits.

national money markets. As a result, the rural bankingsystem appears well positioned to respond to changesin economic demand for a wide range of borrowers.
While reassuring, the generally healthy financial condi-tion of the rural banking industry may not translate intoreadily accessible, affordable financing for all credit-worthy rural borrowers. Rural bank performance isoften a function of the degree of competition within thelocal financial markets in which loan decisions aremade. One simple indicator of bank market competi-tion is the number of bank organizations operatingwithin rural markets. Because of the presence ofbranch bank offices and multibank holding company(MBHC) affiliates, measuring bank market competitionrequires information on the number of independentbanking organizations operating within a market ratherthan the number of legally distinct banks headquarteredthere.5 Despite rapid consolidation within the bankingindustry nationwide, the average number of competingbanks within rural counties has remained remarkablystable over the past 15 years, perhaps because of poten-tial antitrust enforcement by the Department of Justiceand bank regulator concerns over the local impacts ofmergers.6 Still, in 1994, 27 percent of rural countieswere served by 2 or fewer banks (including the branch-es of banks headquartered elsewhere). In contrast, 40percent of urban counties were served by 10 or morebanks. The poorest counties tend to have the leastcompetitive banking markets (see appendix A, table A-2).
The connection between banking market performance(measured as profit or interest rates) and structure (con-centration) is well documented. A large body ofresearch, both in banking and the industrial sector, sup-ports this connection (Rhoades, 1995). This relation-ship is generally attributed to the existence of marketpower (Berger and Hannan, 1989 and 1994). Researchresults, that higher prices and profits tend to exist in
more concentrated markets, suggest that market imper-fections exist. As summarized by Rhoades, other evi-dence of market imperfections include:
• high levels of cost inefficiencies among groups ofbanks of all sizes;
• an observed positive relationship between marketprofit rates and market growth;
• the tendency of new market entry to reduce marketprofits especially in rural markets, suggesting thatpotential competition is insufficient to maintaincompetitive profit levels and that adjustment tolongrun profit levels is slow; and
• the general failure of bank mergers to result ingains in profitability or efficiency.
In addition to the competitiveness of local bankingmarkets, a longstanding issue in many rural areas is therole bank ownership may play in lending decisions.Some rural advocates oppose relaxing restrictions onoutside ownership of rural bank offices because theyfear that large, nonlocal banks may transfer funds fromrural offices for lending elsewhere and that nonlocalmanagers may lack information needed to evaluateloan applications fairly. Others argue in favor of out-side ownership because large banks provide more kindsof financial services, can handle larger loan requests,and are less affected by downturns in the local econo-my. Nationwide banking industry consolidation trendshave made a difference in the ownership of rural banks.About 9 percent of rural counties are served solely bylocal banking organizations (banks with no offices out-side that county), which is down significantly from1980. Nearly three-fifths of rural counties containoffices from both local and nonlocal banking organiza-tions. To date, available evidence on bank mergers andinterstate branching indicates that the availability ofcredit does not suffer as banks change owners (Rose,1993; Calem, 1994; Nakamura, 1994; Strahan andWeston, 1996) or that negative effects are limited(Keeton, 1995).
In sum, the rural banking sector appears well posi-tioned to remain the dominant source of credit for cred-itworthy borrowers. The financial health of the bank-ing sector as a whole, including rural-headquarteredbanks, is more than adequate to support expanded lend-ing activity. In addition, although banks rely heavily
10 Credit in Rural America Economic Research Service/USDA
5 Since MBHC affiliates located within the same market can operate likebranching networks, they should not be viewed as independent competitors.Almost 31 percent of insured commercial banks belonged to MBHC’s at theend of 1995.6 Proposed bank mergers are rarely rejected outright, but it is not unusualfor a merged banking firm to spin off certain bank affiliates or bank branch-es to gain approval for the merger. Also, banks are aware of JusticeDepartment guidelines concerning acceptable changes in local banking mar-ket concentration measures. Mergers between two local banks in the samerural county would rarely meet these guidelines.
on local deposits for loanable funds, nonlocal sourcesof liquidity are increasingly available. However, thelack of bank competition in many rural communitiescould foster uneven performance by the banking sys-tem, with remote rural areas at a potential disadvantagein acquiring equal access to competitively priced credit.
The Farm Credit System
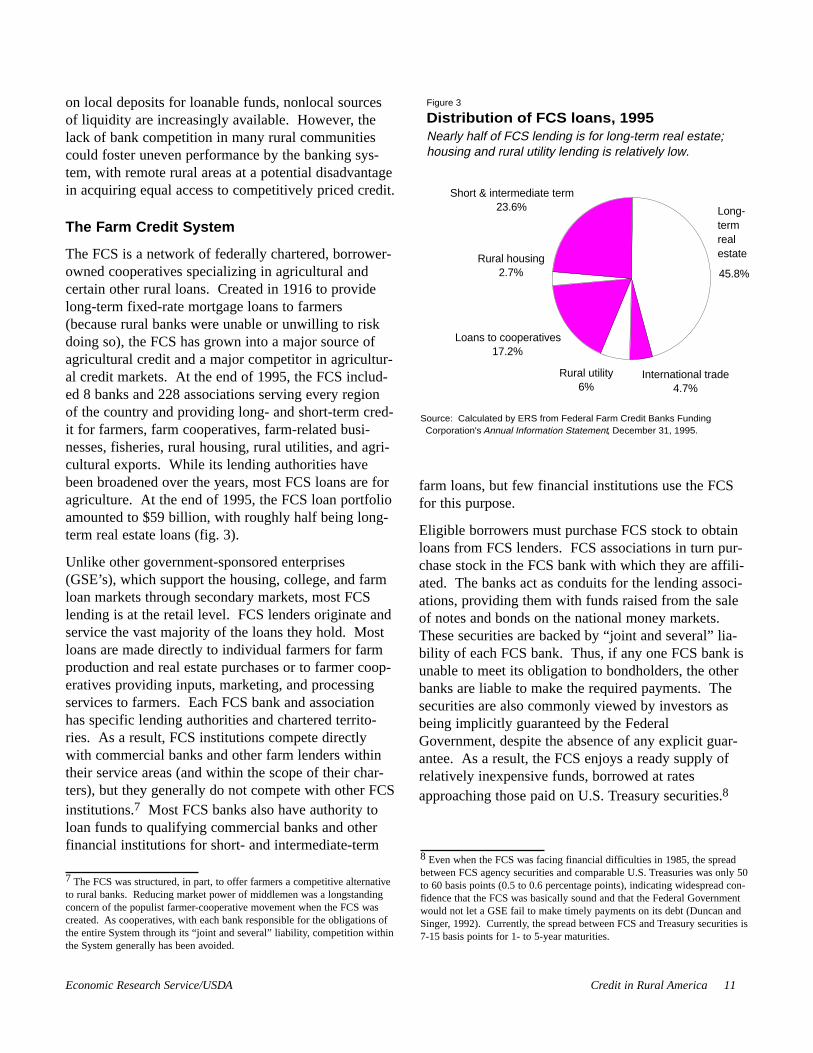
The FCS is a network of federally chartered, borrower-owned cooperatives specializing in agricultural andcertain other rural loans. Created in 1916 to providelong-term fixed-rate mortgage loans to farmers(because rural banks were unable or unwilling to riskdoing so), the FCS has grown into a major source ofagricultural credit and a major competitor in agricultur-al credit markets. At the end of 1995, the FCS includ-ed 8 banks and 228 associations serving every regionof the country and providing long- and short-term cred-it for farmers, farm cooperatives, farm-related busi-nesses, fisheries, rural housing, rural utilities, and agri-cultural exports. While its lending authorities havebeen broadened over the years, most FCS loans are foragriculture. At the end of 1995, the FCS loan portfolioamounted to $59 billion, with roughly half being long-term real estate loans (fig. 3).
Unlike other government-sponsored enterprises(GSE’s), which support the housing, college, and farmloan markets through secondary markets, most FCSlending is at the retail level. FCS lenders originate andservice the vast majority of the loans they hold. Mostloans are made directly to individual farmers for farmproduction and real estate purchases or to farmer coop-eratives providing inputs, marketing, and processingservices to farmers. Each FCS bank and associationhas specific lending authorities and chartered territo-ries. As a result, FCS institutions compete directlywith commercial banks and other farm lenders withintheir service areas (and within the scope of their char-ters), but they generally do not compete with other FCSinstitutions.7 Most FCS banks also have authority toloan funds to qualifying commercial banks and otherfinancial institutions for short- and intermediate-term
farm loans, but few financial institutions use the FCSfor this purpose.
Eligible borrowers must purchase FCS stock to obtainloans from FCS lenders. FCS associations in turn pur-chase stock in the FCS bank with which they are affili-ated. The banks act as conduits for the lending associ-ations, providing them with funds raised from the saleof notes and bonds on the national money markets.These securities are backed by “joint and several” lia-bility of each FCS bank. Thus, if any one FCS bank isunable to meet its obligation to bondholders, the otherbanks are liable to make the required payments. Thesecurities are also commonly viewed by investors asbeing implicitly guaranteed by the FederalGovernment, despite the absence of any explicit guar-antee. As a result, the FCS enjoys a ready supply ofrelatively inexpensive funds, borrowed at ratesapproaching those paid on U.S. Treasury securities.8
Economic Research Service/USDA Credit in Rural America 11
45.8%
International trade4.7%
Rural utility6%
Loans to cooperatives17.2%
Rural housing2.7%
Short & intermediate term23.6%
Distribution of FCS loans, 1995Nearly half of FCS lending is for long-term real estate; housing and rural utility lending is relatively low.
Long-termreal estate
Figure 3
Source: Calculated by ERS from Federal Farm Credit Banks Funding Corporation's Annual Information Statement, December 31, 1995.
7 The FCS was structured, in part, to offer farmers a competitive alternativeto rural banks. Reducing market power of middlemen was a longstandingconcern of the populist farmer-cooperative movement when the FCS wascreated. As cooperatives, with each bank responsible for the obligations ofthe entire System through its “joint and several” liability, competition withinthe System generally has been avoided.
8 Even when the FCS was facing financial difficulties in 1985, the spreadbetween FCS agency securities and comparable U.S. Treasuries was only 50to 60 basis points (0.5 to 0.6 percentage points), indicating widespread con-fidence that the FCS was basically sound and that the Federal Governmentwould not let a GSE fail to make timely payments on its debt (Duncan andSinger, 1992). Currently, the spread between FCS and Treasury securities is7-15 basis points for 1- to 5-year maturities.

The FCS is a specialized lender with a Federal mandateto serve as a reliable source of competitively pricedfunds for agricultural and other rural borrowers. Thismandate, in conjunction with the FCS cooperativenature and some questionable lending practices, result-ed in rapid growth in the 1970’s. But when the farmsector experienced severe financial stress in the early tomid-1980’s, the FCS contracted rapidly as creditworthyborrowers found cheaper sources of credit and stressedborrowers defaulted on their loans.9
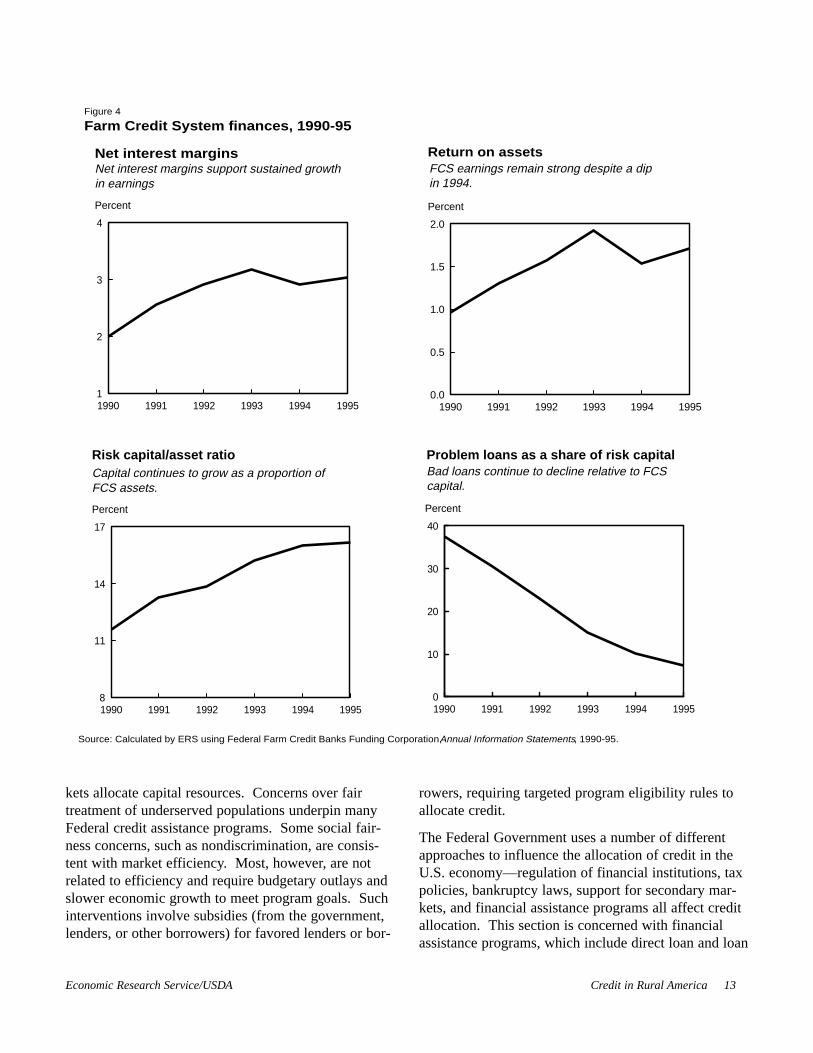
The System’s finances have since recovered, but as aresult of its earlier difficulties, the FCS has become farmore selective in its lending.10 Individual banks andassociations retain a great deal of discretion withregard to pricing, loan approval, stock purchaserequirements, dividend policies, and the like. Toensure the safety and soundness of FCS institutions, theFarm Credit Administration and the Farm CreditSystem Insurance Corporation act as regulator andinsurer of FCS obligations, respectively. In addition,FCS banks have voluntarily entered into several agree-ments with each other that provide further incentive foreach bank to maintain a strong financial position. In1995, the System’s total loan volume grew by 4.5 per-cent, its income exceeded $1 billion for the third yearin a row, and it experienced declines in provisions forloan losses and noninterest expenses (fig. 4). Its netinterest margin, at approximately 3 percent, remainshigh enough to sustain earnings (USDA, 1996a).
The FCS is well positioned to respond to increases ineconomic demand for credit from eligible borrowers.Its status as a GSE continues to provide (off-budget)Federal subsidies and access to an ample and flexiblesupply of loanable funds. Most FCS institutions holdlevels of capital well above regulatory minimums. Foractivities that the System’s various—largelyautonomous—institutions are authorized to finance,
competitively priced credit should be available to qual-ifying borrowers.
Government Programs
A largely private, competitive financial system isessential to attaining sustained economic growth (Kingand Levine, 1993; Jayaratne and Strahan, 1996). Iffunds are allocated for projects that are not among themost profitable, capital has been poorly allocated andeconomic growth rates suffer. Public sector involve-ment can improve the economic performance of finan-cial markets to the extent that market segmentation isreduced. Federal policies and programs that heightenlender competition, lower transaction costs, or improveinformation have enhanced financial market efficiency.But direct lending programs operated by the public sec-tor rarely succeed in allocating capital efficiently andare often not intended to do so.11 Rather, as discussedpreviously, subsidized government credit programsgenerally address “fairness” concerns.
An efficient, competitive financial market offers buyersof credit services equal opportunities, but even thisequality of opportunity may not yield a “socially equi-table” allocation of resources. For example, theuneven distribution of education and wealth within theU.S. population creates an uneven distribution of cred-itworthiness that may be politically unacceptable.Thus, many Government programs exist because ofdissatisfaction with the way private, competitive mar-
12 Credit in Rural America Economic Research Service/USDA
11 Indeed, one source of financial market failure can arise when too manyor too risky loans are made because of Federal subsidies. As Calomiris andHimmelberg (1993) observe:“Although governments have different (collective) objectives and deeper
pockets than private suppliers of credit, they typically do not have betterinfo or better means of detecting and punishing undesirable behavior byborrowers. If private sector credit is scarce because of the high fixed cost(in a physical sense) of establishing intermediaries, government interventionto defray these costs may be beneficial if it improves the allocation of capi-tal. If the shortage of credit is attributable to asymmetric information, and ifthe government’s information is no better than that of private credit suppli-ers, government loans, guarantees, or loan subsidies may not provide assis-tance where it is needed most and may crowd out better uses of funds.“Social costs of government credit programs need to be taken into account
as well. In particular, the distribution of funds has been motivated by politi-cal, rather than economic, goals (see Aleem, 1985; Braverman and Guasch,1986). Higher rates of default and the misallocation of credit are not theonly disadvantages of throwing money at the problem of rural credit scarci-ty. Such policies may also destabilize markets and thus make farm owner-ship even more difficult for worthy borrowers who are denied access to gov-ernment programs. Carey (1990) argues that the government-subsidizedcredit boom of the 1970s in the U.S. caused a speculative bubble in theprices of farmland that set the stage for the collapse of land values in theearly 80s....”
9 The System’s practice of charging interest rates for its loans based on theaverage cost of its operations, combined with a large stock of fixed-rate,noncallable bonds sold at high interest rates, meant that as interest ratesdeclined in the 1980’s, the FCS ceased being a low-cost source of farmcredit. The System has since adopted marginal cost pricing and has prepaidits high-cost debt, making it a strong competitor for agricultural loans.10 Based on USDA research, farm operators borrowing from the FCS tendto be more financially secure, and FCS debt is concentrated among moreestablished and larger operators. Those operators whose primary lender isthe FCS own more land, are more likely to be in higher income brackets,and are older than farmers who borrow from commercial banks or fromUSDA (Koenig and Dodson, 1995).
kets allocate capital resources. Concerns over fairtreatment of underserved populations underpin manyFederal credit assistance programs. Some social fair-ness concerns, such as nondiscrimination, are consis-tent with market efficiency. Most, however, are notrelated to efficiency and require budgetary outlays andslower economic growth to meet program goals. Suchinterventions involve subsidies (from the government,lenders, or other borrowers) for favored lenders or bor-
rowers, requiring targeted program eligibility rules toallocate credit.
The Federal Government uses a number of differentapproaches to influence the allocation of credit in theU.S. economy—regulation of financial institutions, taxpolicies, bankruptcy laws, support for secondary mar-kets, and financial assistance programs all affect creditallocation. This section is concerned with financialassistance programs, which include direct loan and loan
Economic Research Service/USDA Credit in Rural America 13
1990 1991 1992 1993 1994 19950.0
0.5
1.0
1.5
2.0
Percent
Return on assetsNet interest margins
1990 1991 1992 1993 1994 19958
11
14
17
Percent
Risk capital/asset ratio
1990 1991 1992 1993 1994 19950
10
20
30
40
Percent
Problem loans as a share of risk capital
FCS earnings remain strong despite a dipin 1994.
Bad loans continue to decline relative to FCScapital.
Farm Credit System finances, 1990-95Figure 4
Capital continues to grow as a proportion ofFCS assets.
1990 1991 1992 1993 1994 19951
2
3
4
Percent
Net interest margins support sustained growthin earnings
Source: Calculated by ERS using Federal Farm Credit Banks Funding Corporation, Annual Information Statements, 1990-95.
guarantee/insurance programs, but also involve somegrant and technical assistance programs. The bud-getary costs, contingent liabilities, administrative over-sight, and economic impacts of these approaches varywidely, both among approaches, and among programsusing the same general approach. Given their numberand diversity, this section is concerned mostly withhow each program approach can address fairness andefficiency concerns and how funds were allocated in1994 among geographic areas and borrower groups.
Grant programs. While not credit per se, grants are anobvious substitute for credit in delivering financialresources to spur rural development. Indeed, from aneconomic efficiency perspective, grants are often supe-rior to credit for dealing with fairness issues. They canprovide the subsidies needed to arrive at a “fair” alloca-tion of resources without burdening the recipient withdebt repayment obligations.12 Grants can also help
alleviate credit market inefficiencies related to hightransaction costs and provide seed funds for new com-petitors.13 Since grants are not repaid (unless the termsof the grant agreement have been violated), they havean immediate impact on the Federal budget.
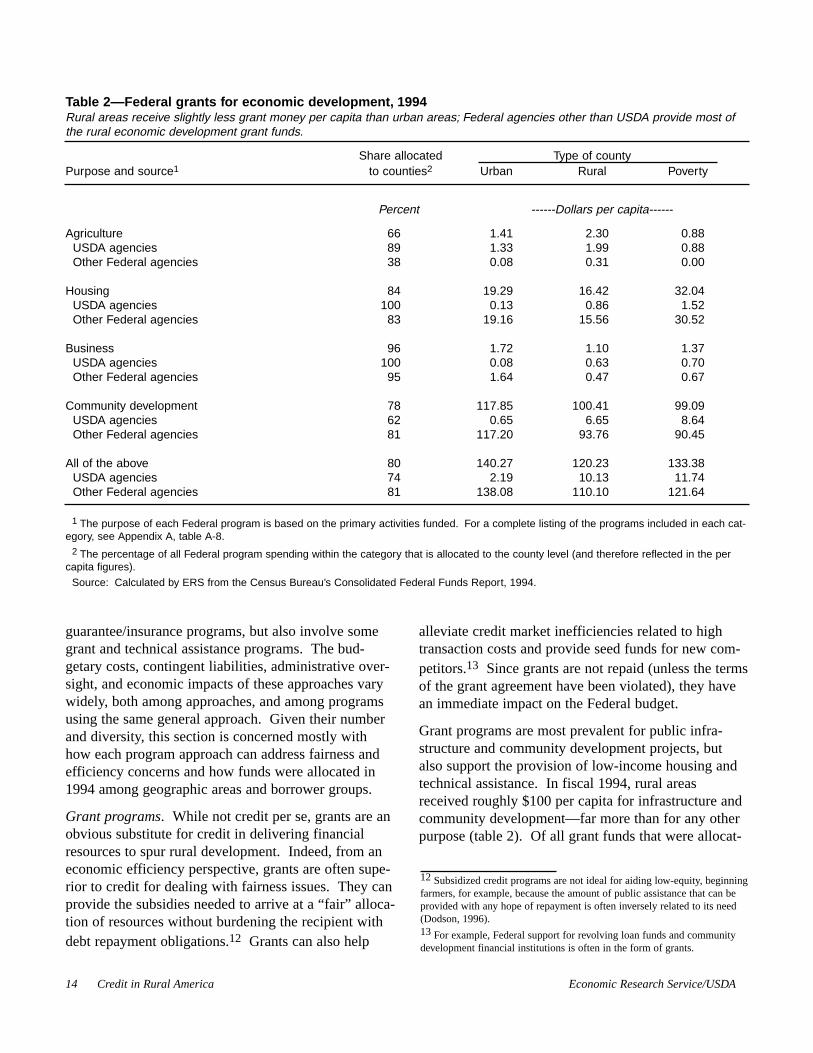
Grant programs are most prevalent for public infra-structure and community development projects, butalso support the provision of low-income housing andtechnical assistance. In fiscal 1994, rural areasreceived roughly $100 per capita for infrastructure andcommunity development—far more than for any otherpurpose (table 2). Of all grant funds that were allocat-
14 Credit in Rural America Economic Research Service/USDA
Table 2—Federal grants for economic development, 1994Rural areas receive slightly less grant money per capita than urban areas; Federal agencies other than USDA provide most ofthe rural economic development grant funds.
Share allocated Type of countyPurpose and source1 to counties2 Urban Rural Poverty
Percent ------Dollars per capita------
Agriculture 66 1.41 2.30 0.88USDA agencies 89 1.33 1.99 0.88Other Federal agencies 38 0.08 0.31 0.00
Housing 84 19.29 16.42 32.04USDA agencies 100 0.13 0.86 1.52Other Federal agencies 83 19.16 15.56 30.52
Business 96 1.72 1.10 1.37USDA agencies 100 0.08 0.63 0.70Other Federal agencies 95 1.64 0.47 0.67
Community development 78 117.85 100.41 99.09USDA agencies 62 0.65 6.65 8.64Other Federal agencies 81 117.20 93.76 90.45
All of the above 80 140.27 120.23 133.38USDA agencies 74 2.19 10.13 11.74Other Federal agencies 81 138.08 110.10 121.64
1 The purpose of each Federal program is based on the primary activities funded. For a complete listing of the programs included in each cat-egory, see Appendix A, table A-8.
2 The percentage of all Federal program spending within the category that is allocated to the county level (and therefore reflected in the percapita figures).
Source: Calculated by ERS from the Census Bureau’s Consolidated Federal Funds Report, 1994.
12 Subsidized credit programs are not ideal for aiding low-equity, beginningfarmers, for example, because the amount of public assistance that can beprovided with any hope of repayment is often inversely related to its need(Dodson, 1996).13 For example, Federal support for revolving loan funds and communitydevelopment financial institutions is often in the form of grants.

ed to the county level, rural areas received approxi-mately $120 per capita—about 85 percent of the urbanlevel.
Direct loan programs. Direct loans are those originat-ed and often serviced by a Federal agency. For the past2 decades, the Government has been reducing its directlending activities in favor of programs, such as loanguarantees, that encourage greater private sector lend-ing. However, a number of Federal agencies continueto operate direct loan programs for specific borrowersqualifying for subsidized credit, such as victims of nat-ural disasters and limited-resource borrowers. Whiledirect loan programs can require large administrativestaffs to ensure that funds are properly targeted, theyare appropriate for delivering highly subsidized creditsince, like grant programs, they maximize theGovernment’s control over allocation decisions.
Budgetary impacts depend upon the size of explicitsubsidies (mainly administrative costs and below-mar-ket interest rates) and implicit subsidies (loan losses),but are generally a sizeable fraction of the dollarsloaned.
In fiscal 1994, of the $141 per capita received by ruralborrowers through direct loan programs, over 95 per-cent came from USDA (table 3). Roughly half ofUSDA’s direct loan program funds were disbursedthrough Commodity Credit Corporation nonrecourseloans to farmers that year, but the Department alsooperated substantial direct loan programs for infrastruc-ture and housing. Direct loan programs are far lessprevalent in other Federal agencies.
Guaranteed/insured loan programs. Loan guaranteesand insurance now dominate Federal agency lending
Economic Research Service/USDA Credit in Rural America 15
Table 3—Federal direct loans for economic development, 1994Rural areas receive far more in direct loans per capita than urban areas, largely from USDA agencies.
Share allocated Type of countyPurpose and source1 to counties2 Urban Rural Poverty
Percent ------Dollars per capita------
Agriculture 99 15.08 76.49 129.06USDA agencies 99 15.08 76.49 129.06Other Federal agencies -- -- -- --
Housing 100 6.44 28.50 30.91USDA agencies3 100 6.44 28.50 30.91Other Federal agencies -- -- -- --
Business 99 19.60 6.50 8.93USDA agencies 100 0.15 0.82 1.05Other Federal agencies 99 19.45 5.68 7.88
Community development 100 3.23 29.14 26.55USDA agencies 100 3.23 29.14 26.55Other Federal agencies -- -- -- --
All of the above 99 44.35 140.63 195.45USDA agencies 99 24.90 134.95 187.57Other Federal agencies 99 19.45 5.68 7.88
1 The purpose of each Federal program is based on the primary activities funded. For a complete listing of the programs included in each cat-egory, see Appendix A, table A-9.
2 The percentage of all Federal program spending within the category that is allocated to the county level (and therefore reflected in the percapita figures).
3 The Consolidated Federal Funds Report combines USDA’s direct and guaranteed rural housing loans and reports the total as direct loans.
-- Indicates that no direct loan programs for this purpose were administered by other Federal agencies.
Source: Calculated by ERS from the Census Bureau’s Consolidated Federal Funds Report, 1994.

activities. With a loan guarantee or insurance program,the Government leaves the origination and servicingaspects to private lenders, which many believe havecomparative advantages over Government agencies inthese activities. The guarantee/insurance lowers orcompletely removes the risk of default losses on loansto qualified borrowers, increasing lenders’ willingnessto supply them with credit. The fact that the loans arebacked by the Federal Government also reduces theamount of capital that lenders are required to hold onoutstanding loans and increases their liquidity. Theincreased liquidity resulting from Federal loan guaran-tees/insurance may allow participating lenders to makemore loans—of all types—than they would otherwise.
Loan guarantee/insurance programs that do not involveexplicit interest rate subsidies need not require largeadministrative staffs, or even annual appropriations, ifthey are designed to be self-financing. If the basis ofthe program is that the private sector is not properlyevaluating creditworthy loans, then subsidized interestrates should not be necessary; fees and coinsurance canbe used to reduce or eliminate taxpayer support. If,however, the basis of the program is that a class of bor-rowers cannot afford commercial rates of interest, thensubsidized interest rates are required, as is an adminis-trative staff to ensure that program beneficiaries meeteligibility criteria. Both self-financing loan programsand guaranteed/insured loans with explicit interest ratesubsidies are relatively rare; most guaranteed andinsured loan programs fall in the middle, providingimplicit subsidies to program participants by shoulder-ing a portion of the program’s operating costs. Thebudgetary impact of guaranteed/insured loan programsdepends on how costs are shared between the govern-ment, lenders, and borrowers, and upon program eligi-bility criteria. Typically, initial program outlays are asmall fraction of loan volume, but loan losses occasion-ally increase government costs significantly.14
With few exceptions, agencies that offer direct loanprograms also offer guaranteed loan programs. In1994, rural areas received over $197 per capita in fed-erally guaranteed/insured loans—far less than the $581per capita received by urban communities (table 4).
Housing accounted for two-thirds of the rural alloca-tion, with the remainder going mostly to farms andother rural businesses. Only about 15 percent of theguaranteed/insured loan funds going to rural borrowerswas from USDA programs.
Technical assistance. In addition to financial support,various Federal agencies also provide technical assis-tance directly to farmers, businesses, and communities.Technical assistance helps borrowers plan and imple-ment economically viable development projects. Forexample, the USDA’s Extension Service provides tech-nical assistance to farmers and rural businesses andcommunities throughout the Nation, through universityextension staff and county extension agents. The U.S.Department of Commerce’s Economic DevelopmentAdministration (EDA) provides technical and businessassistance to small- and medium-size manufacturers(those whose plants have fewer than 500 employees)through its Manufacturing Extension Partnership pro-gram, which operates in over 300 locations nationwide.The Small Business Administration (SBA) helps smallbusinesses put together business plans and providesother such assistance to small businesses through itsSmall Business Development Centers.15 Technicalassistance is also provided by supervised credit pro-grams administered by Federal agencies or withFederal funds.
Technical assistance is unique as a credit-enhancementtechnique since it fundamentally improves the qualityof credit demand rather than its supply. Credit (unlessit is merely a disguised income transfer) requiresrepayment. In order to qualify for commercial credit,households, businesses, and governments must demon-strate the potential to satisfactorily make loan paymentson a timely basis. Through its technical assistance pro-grams, the Federal Government improves the ability ofrecipients to carefully manage their household, busi-ness, or public budgets, thereby improving their quali-fications for commercial loans. The supply of credit isnot altered per se, but its availability to underservedpopulations may be.
16 Credit in Rural America Economic Research Service/USDA
15 In addition to technical assistance provided directly by Federal agencies,Federal grant programs support private technical assistance providers.USDA, EDA, the Environmental Protection Agency, and SBA all operatetechnical assistance grant programs to improve the technical and managerialskills of a wide range of borrowers. While many of these programs arenational in scope, rural areas tend to benefit disproportionately from theiruse.
14 For example, a Wall Street Journalarticle claims that the default rate onthe Small Business Administration’s 7(a) guaranteed loans is expected toreach 17 percent this year, increasing program losses and budgeting outlays(Ho, 1996).

The diversity of clientele, the importance of individualprogram rules and administrative procedures, and thechanging budget authorities of Federal credit assistanceprograms make blanket statements about their ability tosatisfy the rural demand for program funds meaning-less. But then, satisfaction of demand is not the goal ofmost subsidized programs. As has already been stated,if unrestricted, demand for subsidized assistance willalways exceed supply; only by restricting program eli-gibility can subsidized credit programs avoid beinghopelessly oversubscribed. Attempts to balance theFederal budget have reduced the size of grant and sub-sidized credit programs and may raise questions aboutthe “fairness” of credit allocations, but as a generalrule, rural credit market efficiency is not likely to beadversely affected. (For a discussion of the potentialrural impacts of recent Federal spending and policy
decisions, see USDA’s Rural Conditions and Trends:Federal Programs, 1996b.) On the other hand, Federalprograms aimed at improving the efficiency of ruralfinancial markets, such as loan guarantee, insurance,and technical assistance programs, face and satisfy eco-nomic demand if they are market-based. Whetherthese programs are efficiently administered andallowed to respond to market changes is beyond thescope of this study.
Conclusion
Congress requested that this study analyze ruraldemand for credit from the Farm Credit System, theU.S. banking system, the U.S. Department ofAgriculture, and other Federal agencies, the ability ofeach of these credit providers to meet the demand, and
Economic Research Service/USDA Credit in Rural America 17
Table 4—Federal guaranteed/insured loans for economic development, 1994Rural areas receive far fewer guaranteed/insured loans per capita than urban areas; housing assistance predominates.
Share allocated Type of countyPurpose and source1 to counties2 Urban Rural Poverty
Percent ------Dollars per capita------
Agriculture 100 1.68 28.17 34.28USDA agencies 100 1.68 28.17 34.28Other Federal agencies -- -- -- --
Housing 99 547.03 132.99 72.68USDA agencies3 -- -- -- -- Other Federal agencies 99 547.03 132.99 72.68
Business 83 32.55 35.78 28.46USDA agencies 100 0.48 2.89 2.45Other Federal agencies 83 32.07 32.89 26.01
Community development 100 0.08 0.28 0.10USDA agencies 100 0.08 0.28 0.10Other Federal agencies -- -- -- --
All of the above 99 581.34 197.22 135.52USDA agencies 100 2.24 31.34 36.83Other Federal agencies 99 579.10 165.88 98.69
1 The purpose of each Federal program is based on the primary activities funded. For a complete listing of the programs included in each cat-egory, see Appendix A, table A-10.
2 The percentage of all Federal program spending within the category that is allocated to the county level (and therefore reflected in the percapita figures).
3 The Consolidated Federal Funds Report combines USDA’s direct and guaranteed rural housing loans and reports the total as direct loans.
-- Indicates that no guaranteed or insured loan programs for this purpose were active in fiscal 1994.
Source: Calculated by ERS from the Census Bureau’s Consolidated Federal Funds Report, 1994.

the extent to which they provide loans to satisfy thedemand. This report has examined the markets theselender groups serve, their current financial strengthsand weaknesses, and factors affecting their abilities torespond to changes in economic demand for credit.The level of demand for credit is not addressed here forthree primary reasons. First, as competitors, thedemand facing FCS lenders and commercial banks isnot independent where both types of institutions arechartered to make particular types of loans. Second,government-subsidized credit programs are not gener-ally intended to meet economic demand. And finally,reliable data on economic demand independent of sup-ply are not available.
Commercial banks in rural areas and FCS lenders areboth generally financially strong and able to respond toincreases in economic demand. Both groups of lendershave increased their lending in recent years and claimto be prepared to meet future demand for commercialcredit. Despite this observation, substantial evidence
exists that many rural credit markets remain imperfect-ly competitive (fig. 5). These imperfections may resultin operating inefficiencies among some rural lenders,with higher credit costs or tighter loan approval stan-dards possible for some rural borrrowers. However, noattempt has been made to evaluate the financial status,operating efficiency, or competitive performance ofspecific lenders or specific rural credit markets, so thenumber and geographic location of affected borrowersis unknown.
The effectiveness of most federally subsidized creditprograms does not depend on their ability to satisfydemand but rather is a function of how cost-effectivelythey satisfy their public purpose. Judging how “fair”the results are requires a set of value judgments aboutwho does and does not deserve credit and how muchsubsidy society is willing to provide. These judgmentsare best addressed through the political decisionmakingprocess and have not been evaluated here.
18 Credit in Rural America Economic Research Service/USDA
3 or more banks
0 - 2 banks
Metro county
Sparcely populated and poor counties have few competing banksFigure 5
Rural counties served by fewer than 3 banking firmsSparsely populated and poor counties have few competing firms.