
Credit enhancement through nancial engineering: …chitrufernando.oucreate.com/Research...
42
We thank o$cials at Freeport-McMoRan Copper and Gold Inc., especially Charles Goodyear, who stimulated our initial interest in these securities. This paper is not intended to express an opinion on the handling of any situation by Freeport McMoRan Copper and Gold Inc. or any of its a$liates. We are grateful to Gegory W. Brown, Sanjiv Das, Stephen Figlewski, Prem Jain, Kose John, Darius Miller, Thomas H. Noe, Nagpurnanand R. Prabhala, Russ Robins, Barry Schachter, G. William Schwert (the editor), Charles Smithson, Rene H Stulz, Venkat Subramaniam, Sheridan Titman, Peter Tufano, and two referees for useful comments and discussions. We thank Vladimir Gatchev for excellent research assistance. We also thank seminar participants at Boston University, Northeastern University, the 2001 American Finance Association Meetings, the 1998 FMA PACAP Meetings, the 1998 IAFE Conference, the 1998 Chicago Risk Management Conference, the 1998 San Jose Latin American Consortium, and the 1999 HBS-JFE Conference. We remain responsible for all errors. * Corresponding author. Tel.: #1-504-865-5479; fax: #1-504-865-6751. E-mail address: chiddi@tulane.edu (N.K. Chidambaran). Journal of Financial Economics 60 (2001) 487}528 Credit enhancement through "nancial engineering: Freeport McMoRan's gold-denominated depositary shares N.K. Chidambaran*, Chitru S. Fernando, Paul A. Spindt A.B. Freeman School of Business, Tulane University, 7 McAlister Drive, New Orleans, LA 70118, USA Received 3 December 1998; received in revised form 30 November 2000 Abstract In 1993 and 1994, Freeport McMoRan Copper and Gold issued two series of gold- denominated depositary shares to "nance the expansion of its mining capacity in In- donesia. The pricing of these securities re#ected their enhanced credit quality, which arose from the positive correlation between the value of the "rm and the value of the securities. This feature of the securities e!ectively bundles a gold hedge with "nancing. A bundled hedge avoids wealth transfers to senior bondholders, since junior bondholders can e!ec- tively net their bond-related claims on the "rm against their hedge-related liability to the "rm. Such securities cannot be replicated by conventional hedging strategies, and they also mitigate the asset substitution problem. 2001 Elsevier Science S.A. All rights reserved. JEL classixcation: G32; G13 Keywords: Risk management; Credit enhancement; Gold-linked; Hybrid securities 0304-405X/01/$ - see front matter 2001 Elsevier Science S.A. All rights reserved. PII: S 0 3 0 4 - 4 0 5 X ( 0 1 ) 0 0 0 5 1 - 4
Transcript of Credit enhancement through nancial engineering: …chitrufernando.oucreate.com/Research...

�We thank o$cials at Freeport-McMoRan Copper and Gold Inc., especially Charles Goodyear, whostimulated our initial interest in these securities. This paper is not intended to express an opinion on thehandling of any situation by Freeport McMoRan Copper and Gold Inc. or any of its a$liates. We aregrateful to Gegory W. Brown, Sanjiv Das, Stephen Figlewski, Prem Jain, Kose John, Darius Miller,Thomas H. Noe, Nagpurnanand R. Prabhala, Russ Robins, Barry Schachter, G. William Schwert (theeditor), Charles Smithson, ReneH Stulz, Venkat Subramaniam, Sheridan Titman, Peter Tufano, and tworeferees for useful comments and discussions. We thank Vladimir Gatchev for excellent researchassistance. We also thank seminar participants at Boston University, Northeastern University, the 2001American Finance Association Meetings, the 1998 FMA PACAP Meetings, the 1998 IAFE Conference,the 1998 Chicago Risk Management Conference, the 1998 San Jose Latin American Consortium, andthe 1999 HBS-JFE Conference. We remain responsible for all errors.
* Corresponding author. Tel.: #1-504-865-5479; fax: #1-504-865-6751.
E-mail address: [email protected] (N.K. Chidambaran).
Journal of Financial Economics 60 (2001) 487}528
Credit enhancement through "nancialengineering: Freeport McMoRan's
gold-denominated depositary shares�
N.K. Chidambaran*, Chitru S. Fernando, Paul A. Spindt
A.B. Freeman School of Business, Tulane University, 7 McAlister Drive, New Orleans, LA 70118, USA
Received 3 December 1998; received in revised form 30 November 2000
Abstract
In 1993 and 1994, Freeport McMoRan Copper and Gold issued two series of gold-denominated depositary shares to "nance the expansion of its mining capacity in In-donesia. The pricing of these securities re#ected their enhanced credit quality, which arosefrom the positive correlation between the value of the "rm and the value of the securities.This feature of the securities e!ectively bundles a gold hedge with "nancing. A bundledhedge avoids wealth transfers to senior bondholders, since junior bondholders can e!ec-tively net their bond-related claims on the "rm against their hedge-related liability to the"rm. Such securities cannot be replicated by conventional hedging strategies, and they alsomitigate the asset substitution problem. � 2001 Elsevier Science S.A. All rights reserved.
JEL classixcation: G32; G13
Keywords: Risk management; Credit enhancement; Gold-linked; Hybrid securities
0304-405X/01/$ - see front matter � 2001 Elsevier Science S.A. All rights reserved.PII: S 0 3 0 4 - 4 0 5 X ( 0 1 ) 0 0 0 5 1 - 4

1. Introduction
In 1993 and early 1994, Freeport McMoRan Copper and Gold Inc. (tickersymbol FCX) faced a substantial challenge in "nancing the expansion of itsGrasberg gold and copper mine in Irian Jaya, Indonesia. The mine, high in themountains, was the world's largest gold reserve and one of the largest copperreserves. FCX needed to invest heavily to expand mine capacity and achieve theeconomies of scale required to become more competitive. Despite a heavy debtburden and a stock that was trading below the value of its assets, FCXsuccessfully raised $359 million at a favorable "nancing cost through two seriesof gold-linked depositary shares backed by preferred stock. These claims enjoy-ed an enhanced credit quality because the link to gold prices credibly reduceddefault risk. We show that the design of the security allows the bene"ts ofthis credit enhancement to be targeted to the purchasers of the newly issuedsecurities.
The gold depositary shares issued by FCX are similar to a debt instrumentthat has all interest and principal payments in gold. Other gold-mining com-panies have also employed gold-linked "nancing to combine "nancing and riskmanagement needs. Tufano (1993) describes these instruments in general and theactivities of American Barrick in particular. The use of these hybrid instrumentscreates a liability whose value is positively correlated with the value of the "rm,thereby enhancing the credit quality of the depositary shares and enabling FCXto "nance its expansion at a lower cost despite being "nancially constrained.Reducing the costs associated with binding "nancial constraints can be valueincreasing (see Smith and Stulz, 1985; Stulz, 1990; Froot et al., 1993; Mello andParsons, 2000).
A gold-denominated depositary share is a "nancing instrument with anembedded derivative that serves to hedge the exposure to gold price risk. In thispaper, we show how this "nancially engineered security creates value beyondwhat can be achieved by conventional derivatives strategies. Our approach is asfollows. We "rst establish the credit enhancement of the gold-denominateddepositary shares relative to straight bonds. We then contrast bundled hedging,or "nancing bundled with an embedded derivative, with conventional hedging,or the standard risk management strategy of issuing a straight bond andsimultaneously initiating a hedge using derivative contracts. The e!ects of thetwo strategies appear on the surface to be identical. We show that this apparentequivalence is deceptive and that bundled hedging is vastly superior to conven-tional hedging.
The superiority of a bundled hedge arises from two e!ects. First, using"nancial engineering to bundle "nancing and hedging prevents wealth transfersto senior bondholders that arise in the case of a conventional hedge. Bundlingallows the holders of the hybrid security to (e!ectively) o!set the amount theyowe on the bundled derivative contract against the amount they stand to lose on
488 N.K. Chidambaran et al. / Journal of Financial Economics 60 (2001) 487}528

the debt contract when the "rm is in default. This netting feature circumventsthe priority order of the "rm's existing capital structure and allows the bene"tsof credit enhancement to be targeted to particular securities even if thesesecurities are junior. Wealth transfers to senior bondholders arising from creditenhancement are eliminated due to this feature. We refer to this e!ect as targetedrisk management.
Second, bundling signi"cantly mitigates the time inconsistency problem,which arises in the case of a conventional hedge because shareholders have an expost incentive for asset substitution, as shown by Smith and Stulz (1985). Smithand Stulz examine the interaction of the debt "nancing and hedging policies ofan unlevered "rm. They demonstrate that the "rm has strong incentives, oncethe "nancing is completed, to unwind the hedge, transferring wealth frombondholders to stockholders. Since bondholders know this ex ante, they will notfactor the credit enhancement into the pricing unless the "rm is able to convincethem that it will maintain the hedge after the bond sale. But it is di$cult for"rms to credibly precommit to the hedge, making this strategy time-inconsist-ent. We extend the Smith and Stulz analysis to the general case of a levered "rm,where the potential for asset substitution is even greater, exacerbating the timeinconsistency problem. Conventional hedging undertaken to enhance creditquality for new bondholders has the unintended consequence of enhancing thevalue of senior bondholders' claims, which shareholders can recapture byunwinding ex post.
A bundled hedge, however, signi"cantly reduces this problem. Since there areno wealth transfers to senior bondholders in the "rst place, there is less value tobe realized through unwinding the hedge. Unwinding a bundled hedge can alsoimpose additional costs on shareholders. The counterparty to an unwindingtransaction would be junior to existing bondholders under bankruptcy (seeTucker, 1991; Foster, 1995). The counterparty would, therefore, extract a signi"-cant part of the stockholders' surplus associated with the unwinding, via pricingof the derivative contract and/or collateral requirements, to o!set the increase inthe "rm's credit risk. Moreover, as in Mello and Parsons (1995, 2000), unwind-ing using traded short-term derivatives contracts can generate adverse cash#ows, e.g., by requiring the "rm to cover margin cash out#ows without o!settingin#ows, thereby exacerbating "nancial constraints and increasing default risk.The asset substitution problem is therefore mitigated, though not completelyeliminated, by bundled hedging. A bundled hedge also (1) locks in risk manage-ment for the duration of the debt, and (2) could impose reputational costs if the"rm tries to unhedge, further neutralizing any residual incentive the "rm mighthave to unwind the hedge.
Thus, our analysis indicates that a strategy that bundles "nancing andderivatives is superior to a strategy that separates the two transactions. Inaddition, it should be noted that the derivative contract embedded in thegold-denominated depositary shares is of a longer maturity than conventional
N.K. Chidambaran et al. / Journal of Financial Economics 60 (2001) 487}528 489
traded derivative contracts. The short maturity and mark-to-market features ofconventional derivative instruments make it di$cult to replicate the bundledsecurity through a derivatives strategy. For example, when a "rm uses a shortgold futures position together with a straight bond to replicate the gold-linkedsecurity, it will face extremely adverse cash #ow consequences associated withmarking-to-market and rolling over the gold futures positions if the gold priceincreases in the interim. Mello and Parsons (2000) focus on how liquidity andcash #ow timing problems associated with di!erent hedging strategies can a!ecta "rm's value. They argue that a hedge that does not take account of the fundingrequirements associated with it can actually compound liquidity constraintsthat the "rm might face, thereby detracting from the "rm's value instead ofadding to it, as shown by Mello and Parsons (1995) for the case of Metallgesel-lschaft. A replicating derivatives strategy is strictly sub-optimal relative to thegold-linked security.
In theory, any derivatives strategy that allows junior bondholders to have "rstclaims to the cash #ows from the hedge, and which minimizes the ex postincentive for the "rm to unwind the hedge, will achieve credit enhancement. Inpractice, the ability to satisfy these conditions is greatly limited by currentbankruptcy law, standard debt covenants designed to protect seniority, and, asemphasized by Smith and Stulz (1985), the di$culty in preventing unwinding.These constraints are especially critical for levered "rms. Bundling debt witha derivative contract satis"es the conditions for credit enhancement. Our com-parison between FCX's bundled hedge and a conventional hedge is not to showthat such securities are the only way, or even the optimal way, to manage risk.Rather, we use the comparison to highlight the principles that a successful riskmanagement strategy should embody.
Possibly with the intention of building on the success of the two gold issues,FCX later issued a series of silver-denominated shares structured similar to thegold issues. However, FCX's exposure to silver prices was signi"cantly lowerthan its exposure to gold prices as silver is a byproduct of FCX's gold miningoperations and accounts for a much smaller share of its revenue. The value of thegold shares was highly positively correlated with FCX's revenues, whereas thevalue of the silver shares was considerably less so. Nonetheless, the silver issueprovides a useful benchmark against which to gauge the credit enhancement ofthe gold issues.
We analyze the pricing of the depositary shares for evidence of credit enhance-ment using the following approach. We decompose the cash #ow of the deposi-tary shares into the cash #ow of a risky straight bond, a riskless swap for gold orsilver, and a residual component that we call the credit enhancement residual(CER) which captures the value of the option-to-net that comes into the moneywhen the "rm defaults. We benchmark our measurements by setting the CER ofthe silver issue to zero in light of FCX's low exposure to silver price risk. Sincethe gold and silver securities were issued pari passu, we assume that the risky
490 N.K. Chidambaran et al. / Journal of Financial Economics 60 (2001) 487}528

straight bond embedded in them is attributed the same credit quality by themarket. We value the swap using contemporaneous market prices and value thebond at a yield that normalizes the silver CER to zero. We "nd that the GoldSeries I depositary shares incorporate a CER of 3.15% of their market value andthe Gold Series II depositary shares incorporate a CER of 4.68% of their marketvalue.
The higher credit enhancement for the two gold securities arises due to thesigni"cantly positive correlation between the value of the "rm and the value ofthe bundled instrument. Since gold accounts for approximately a third of FCX'srevenues, this is clearly the case for the two gold securities, and as we have noted,not the case for silver. If there were no credit enhancement or if the change incredit quality due to linking were the same for all three securities, the threeCERs should have been identical. This is not what we "nd. The relative pricingof the three securities permits us to conclude that the market was able to identifythis important di!erence for FCX between gold and silver, lending support toour conceptual arguments.
We organize the rest of the paper as follows. Section 2 describes FCX'soperations and its need for new "nancing and also discusses the role of gold-linked securities in "nancing, especially in the context of risk management. Thebene"ts of bundling are highlighted in Sections 3 and 4. In Section 3, we presenta detailed example illustrating how a gold-indexed "nancing instrument issuedby a gold mining "rm can overcome wealth transfer issues associated withconventional risk management. This representative example is designed toarticulate our general conceptual points, and is not just a simpli"ed descriptionof the Freeport situation. In Section 4, we discuss why the bundling of "nancingand risk management mitigates the asset substitution problem and enhances thecredibility of the hedge. Section 5 develops a methodology for detecting creditenhancement in the depositary shares, which is then applied to FCX's gold- andsilver-denominated issues. Section 6 concludes.
2. Freeport McMoRan Copper and Gold: operations and 5nancing
FCX is a subsidiary of Freeport McMoRan Inc. (FTX). FTX came intoexistence in 1981 following the merger of Freeport Minerals Co. and McMoRanOil and Gas Co. The former began operations in 1912 in Texas as the FreeportSulphur Company to develop a newly discovered sulfur "eld on the Texas GulfCoast. The latter was founded in 1969 in Utah as McMoRan Explorations Co.to undertake oil exploration. Following the 1981 merger, FTX began acquiringoil and gas assets, geothermal properties, and phosphate mines in a $1 billionprogram to diversify away from the sulfur business, which was then in decline. In1987, Freeport McMoRan Copper & Gold Inc. and Freeport McMoRanResource Partners Inc. were formed as subsidiaries of Freeport McMoRan Inc.
N.K. Chidambaran et al. / Journal of Financial Economics 60 (2001) 487}528 491

In 1988, the "rm made two major discoveries } the Main Pass sulfur deposit inthe Gulf of Mexico and gold, silver, and copper deposits in the Indonesianprovince of Irian Jaya. Given the enormous capital costs associated withdeveloping these deposits, FTX reversed its earlier acquisition spree and spuno! its subsidiaries. FCX was formed in 1988 when FTX's copper and goldoperations were spun o! into a separate "rm. FTX retained 73.2% ownership inFCX.
FCX's principal operating subsidiary is P.T. Freeport Indonesia (PT-FI)which mines and processes copper, gold, and silver in Indonesia, and marketsworldwide the concentrates containing these metals. FCX owns 80% of theoutstanding common stock of PT-FI, with the remaining 20% split equallybetween the Government of Indonesia and an Indonesian corporation, P.T.Indocopper Investama Corporation.
2.1. FCX's mining operations and the Grasberg Mine expansion
Fig. 1 shows FCX's revenues from copper, gold, and silver for the "ve-yearperiod 1991}1995. Copper and gold are FCX's major products, with silveraccounting for less than 1% of total revenue. Mining operations in Indonesiacommenced in 1967 with the discovery of the Ertzberg mineral reserve on theIndonesian island of Irian Jaya. The Grasberg mineral reserve, currently theworld's largest single gold reserve and one of the world's three largest open pitcopper reserves, was discovered in 1988.
FCX's publicly espoused corporate philosophy was to enhance shareholdervalue by becoming an e$cient mining "rm. FCX thought that being a low-costproducer was the most e!ective way to survive the frequent price swings that theindustry experienced, since price drops force high-cost producers out of themarket, making way for a quick recovery and return to higher pro"ts for thosethat remain. FCX saw the discovery of the Grasberg mine as an opportunity toincrease substantially the throughput of its mining operations in Indonesia,thereby reducing its average mining cost.
The implementation of this low-cost philosophy through increased capacitycalled for $2 billion in capital investments to expand operations at the Grasbergmine and for accompanying infrastructure development projects such as power,housing, transportation, hospitals, and communications. In 1989, FCX initiatedthe "rst capacity expansion from 20,000 metric tons of ore per day (MTPD) to52,000 MTPD. Capital expenditure for the expansion was estimated at $507million. In August 1992, FCX approved a plan to expand production to 90,000MTPD at an estimated cost of $545 million. The third and "nal phase expandedproduction to 118,000 MTPD. The burden of operating in an uncertain politicalenvironment, coupled with the amount of money needed, caused FCX toexplore various innovative avenues for new "nancing.
492 N.K. Chidambaran et al. / Journal of Financial Economics 60 (2001) 487}528

Fig. 1. This "gure shows the dollar sales in copper, gold, and silver for FCX for the "ve-year period1991}1995. Data are from "rm's annual reports from 1992}1996.
2.2. Financing strategy and capital structure
Table 1 presents the securities FCX issued to "nance the "rst phase of theGrasberg expansion and reduce its dependence on short-term funds. AppendixA presents "nancial data for the "ve-year period 1989}1993.
FCX has two classes of common stock outstanding: Class A, held by thegeneral public, and Class B, wholly owned by FTX. Through May 1, 1993, ClassA common stockholders received cumulative quarterly dividends of 10.25 centsper share before payment of any dividends on Class B common stock. On thedebt side, FCX had traditionally used short-term debt "nancing. In 1989, the"rm obtained a line of credit to provide project "nancing up to $550 million to"nance capital expenditure. In 1991, the "rm converted the #oating rate line ofcredit into a "xed rate loan by entering into an interest rate swap agreement,resulting in a "xed rate of 8.3% on $100 million of debt through December 1999.In June 1993, the $550 million credit agreement was restructured as a three-yearrevolving line of credit followed by a three-and-a-half year reducing revolver.The "rm's management was dissatis"ed with its dependence on bank "nancingbecause of the cost and the re"nancing risk, especially as banks were nervousabout the political risk in Indonesia. FCX initiated new rounds of "nancing,seeking longer maturities to eliminate re"nancing risk and obtain a capitalstructure more in keeping with the long-term nature of its business. In theprocess, FCX also sought to free itself from the restrictive covenants attached toexisting debt, which included restrictions on current ratios, interest coverage
N.K. Chidambaran et al. / Journal of Financial Economics 60 (2001) 487}528 493

Table 1FCX's long-term capital structure (book value) as of Dec. 31, 1990 and signi"cant new "nancing-related activity through Dec. 31, 1994.
Balance as of Dec. 31, 1990: ($ million)Long-term bank debt 294Stockholders' equity 177
Changes through Dec. 31, 1994:
1991: Net issuance of long-term bank debt 103
July 91: Zero-coupon Liquid Yield Option Notes 219Face Value $1.035 billion, maturing in 2011, unsecured. Subordinatedwith a 7.75% yield to maturity. Exchangeable at holder's option for0.6015 oz. of gold or 7.505 shares of Class A common stock. Putableafter July 2, 1996 at issue price plus accrued original issue discount.
1992: Net issuance of long-term bank debt 74
July 92: Class A Common Shares� 1748.6 million shares issued
7% Convertible Exchangeable Special Preference Shares Cumulativedividends (quarterly)"$1.75 per year. After 8/1/94, can be exchangedfor a 7% Convertible subordinated debenture. Redeemable after 8/1/95at stated prices. Convertible into 0.992 shares of class A common stock.
218
1992: During 1992, zero coupon exchangeable notes with a facevalue of $326.4 million were converted into 4.55 millionClass A common stock (valued at $ 70.4 million) and$7.85 million in cash.
1993: Net issuance of long-term bank debt !361
July 93: Step-Up Convertible Preference Shares Dividends (quarterly) till 8/1/96- $1.25 per year and $1.75 per year thereafter. Redeemable after 8/1/96for 0.813 shares of Class A common stock subject to price level. After8/99 redeemable for $25.00. Convertible into 0.813 shares of ClassA common stock.
341
August 93: Gold-denominated Preferred Series I 221Face value of 0.1 oz. of gold and annual dividend of 0.0035oz. of gold, payable quarterly. Maturing on 08/01/2003.
1993: During 1993, zero coupon exchangeable notes with a facevalue of $322.6 million were converted into 4.84 million Class A com-mon shares (valued at $79.7 million). There were no redemptions forcash in 1993.
1994: Net issuance of long-term bank debt 416
494 N.K. Chidambaran et al. / Journal of Financial Economics 60 (2001) 487}528

Table 1 (continued )
Balance as of Dec. 31, 1990: ($ million)Long-term bank debt 294Stockholders' equity 177
January 94: Gold-denominated Preferred Series II 138
Face value of 0.1 oz. of gold and annual dividend of 0.00325oz. of gold, payable quarterly. Maturing on 02/01/2006.
July 94: Silver-denominated Preferred Series I 95
Face value of 4.0 oz. of silver and annual dividend of 0.165 oz. of silver,payable quarterly. Maturing on 08/01/2006.Redeemable annually at 0.5 oz. of silver/year beginning 08/01/99.
1994: During 1994, the remaining zero coupon exchangeable notes of $386million face value were converted into 5.8 millionClass A common shares (valued at $ 73.7 million) and $0.3 million in cash.
�FCX had planned to issue 10.25 million Class A shares and 6 million exchangeable shares butadjusted these amounts because of the higher demand for the exchangeable shares. (Bloomberg,7/14/92)
ratios, present value of future cash #ows to debt, and the amount of senior debtthat could be issued.
The political uncertainty in Indonesia and the enormous amount of capitalalready raised by FCX made it di$cult to tap traditional sources of capital forthe second and third phases of the expansion. On the one hand, FCX manage-ment did not want to issue new equity, since they felt that the stock wassigni"cantly undervalued relative even to existing assets. On the other hand, theexisting subordinated debt was already rated at a low B1 by Moody's, and newdebt issues would put further pressure on FCX's debt rating. Although FCX didissue three series of convertible securities during 1991}1993, as Table 1 reports,management viewed these securities as more attractive debt "nancing thanstraight debt because of the lower cash out#ow by way of coupons, and lessrestrictive covenants. From the standpoint of our analysis, they can be viewed asadding to FCX's leverage. Two of these series were later converted into commonstock but the third series remained unconverted as of Dec. 31, 1999.
In this environment, FCX proposed and issued the commodity-linked deposi-tary shares, getting much-needed credit enhancement for these securities andraising capital for its investment needs. Fig. 2 shows a plot of the split-adjustedstock price for FCX. The dates of issue of each of the three depositary shareseries are marked on the "gure. Appendix B describes the structure of thesesecurities, using the Series I gold-denominated depositary shares as the illustra-tive example.
N.K. Chidambaran et al. / Journal of Financial Economics 60 (2001) 487}528 495

Fig. 2. This "gure graphs the month-end split-adjusted stock price of FCX for the period January1991}January 1995. The points at which FCX issued the gold- and silver-denominated depositaryshares are also indicated.
� The depositary share structure was created purely to avoid exceeding the limit on outstandingpreferred shares authorized by the stockholders and thereby having to go back for stockholderapproval each time they needed to do a new issue (FCX issued "ve preferred stock series during the1992}1994 period.) Since the authorized preferred stock was of the `blank checka type, i.e., givingthe board of directors broad powers associated with setting the rights and preferences associatedwith a particular preferred stock issue, it was possible to create the depositary trust withoutstockholder approval. The depositary trust was a pure pass-through arrangement, unlike trustschemes that are used for securitization and enhancing credit quality. For example, the "rst goldissue comprised 300,000 preferred shares. If these shares were issued directly, each share would havehad a price of approximately $750, resulting in too few shares and too high a share price for broaddistribution and liquidity in the secondary market. Therefore, these 300,000 preferred shares wereused to back six million depositary shares, giving the `righta number of shares and share price.
As reported in Table 1, FCX raised nearly $500 million through the threeissues of commodity-linked depositary shares. The "rst series of 3.5% gold-denominated depositary shares was issued in August 1993 and had a maturity often years. FCX applied the proceeds of $221 million toward funding the 90,000MTPD expansion plan. The second series of 3.125% gold-denominated deposi-tary shares was issued in January 1994 and had a maturity of 12 years. The thirdseries was denominated in silver and was issued in July 1994 at a yield of4.125%. FCX used the $233 million raised through the latter two issues to helpfund the 118,000 MTPD expansion. All the depositary shares were backed bypreferred stock held in trust and carrying a Moody's B1 rating.� FCX was ableto raise these funds without restrictive covenants, despite having been placedunder a credit watch by the rating agencies at the time of the issues.
496 N.K. Chidambaran et al. / Journal of Financial Economics 60 (2001) 487}528

Table 2Three-factor model for FCX common stock returns
We estimate a three-factor model for FCX daily common stock returns. We use as factors the dailyvalue-weighted market return from the CRSP database, the daily percentage change in the LondonPM gold price "xing, and the daily percentage change in the spot price of copper on the LondonMetal Exchange (LME) for daily data from 1 January 1990 to 15 July 1993.
Variable Coe$cient(t-statistic)
INTERCEPT 0.002(2.43)�
MARKET FACTOR 0.307(2.85)�
GOLD FACTOR 0.611(6.35)�
COPPER FACTOR 0.136(2.66)�
No. of observations 856Adj. R� 5.4%F-value 17.163�
�Signi"cant at the 5% level.�Signi"cant at the 1% level.
� There is some interdependence between FCX's gold and copper risk and its political risk, whichwe have not modeled in the paper. For example, if their mines are nationalized, exposure to gold andcopper risk could change. We thank a referee for highlighting this point.
2.3. FCX's exposure to xnancial risk
As noted previously, gold and copper are FCX's two major products, sugges-ting that these two commodities were its principal sources of "nancial risk. Wecon"rm this by estimating a three-factor model for FCX's common stockreturns, which we report in Table 2. We use as factors the daily value-weightedmarket return from the CRSP database, the daily percentage change in theLondon PM gold price "xing, and the daily percentage change in the spot priceof copper on the London Metal Exchange. Silver was not a signi"cant explana-tory variable.
As in the case of other natural resource companies that operate in countrieswith political uncertainty, the other signi"cant risk faced by FCX is the politicalrisk arising from the fact that most of its assets are located in Indonesia. FCXseems to have hedged this risk by making the Indonesian government a major(10%) shareholder, by placing a further 10% of its shares with Indonesiannationals, and by a series of long-term exploration and mining agreements andguarantees that paid the Indonesian government signi"cant royalties.�
N.K. Chidambaran et al. / Journal of Financial Economics 60 (2001) 487}528 497

2.4. Risk management at FCX
FCX's policy towards hedging gold price risk varied over time. The "rmimplemented risk management in the early 1980s but reversed this policy in thelatter half of the 1980s on the premise that stockholders wanted the gold exposure.FCX reinstated its risk management program in the 1990s, adopting the objective of`separating good management from gold price risk.a The hedge bundled into thegold-linked securities was consistent with the dual policy of o!ering good manage-ment to their stockholders and being the low-cost producer in the gold market.
FCX's risk management operations in the early 1990s involved buying largepositions in gold and copper puts to set a price #oor for its output. FCX usedsequenced trades (rolling) to minimize the price impacts of its participation inthis market. The 1993 FCX annual report discloses that `PT-FI has a priceprotection program for virtually all of its estimated copper sales to be priced in1994 at an average #oor price of $0.90 per pound, while allowing full bene"tfrom prices above that amount.a This hedging program cost $6 million in 1993.FCX's Spanish subsidiary used forward contracts for approximately 61% of itsgold production and 38% of its silver production in 1994 and 1995. It alsoreported a policy of hedging the purchases of concentrate for its smelter throughthe use of forward contracts.
The lack of consistency in FCX's risk management program is not at oddswith the "ndings of Tufano's (1996) extensive study of the risk managementpractices of 48 publicly traded North American gold mining companies. Tufano(1996) shows that considerable variation exists in the hedging practices of goldmining "rms. For example, Homestake Mining sells all its production in thespot market and has taken a public position against gold price risk manage-ment, while American Barrick "rmly adheres to the policy of separating goodmanagement from gold price risk and makes its hedging program an integralpart of its business (see also Tufano, 1993).
2.5. Credit risk considerations
Gold-linked debt securities of the type issued by FCX, and similar securitiessuch as the gold "nancings undertaken by American Barrick in the 1980s(Tufano, 1993), o!er long-term exposure to gold without taking a position in thespot market, making them popular with investors who seek exposure to goldprice risk. Investors value gold and gold securities as a hedge against in#ation.In addition, some investors, known as `goldbugs,a simply like to invest in gold.Markets for spot gold and gold derivatives are incomplete because of the "nitesupply of the commodity, the control of central banks on the mined supply ofgold, and the lack of liquidity of long-term derivatives. The derivatives bundledin the gold-linked securities tend to be relatively long-term, and ful"ll the marketniche for such contracts.
498 N.K. Chidambaran et al. / Journal of Financial Economics 60 (2001) 487}528

Purchasing gold-linked securities issued by corporations exposes investors tothe issuer's default risk, which is a function of the issuer's exposure to goldprices. Consider the case when the issuer has a natural exposure to gold, as withgold mining companies. There will be a positive correlation between the issuer'sasset value and gold prices and between the issuer's revenues and gold prices.When gold prices drop, the value of the assets and cash #ows will also drop,making the issuer more vulnerable to "nancial distress. However, this risk ispartially o!set by the reduction in the issuer's liability on the bond, whichdecreases as the gold price declines. If gold prices rise, the value of the issuer'sliability is greater, but so is the issuer's ability to meet its liabilities since its assetvalue and cash #ow are also greater. Therefore, the default risk and other"nancial constraints noted by Mello and Parsons (1995, 2000) are lower fora gold-linked security issued by a gold mining "rm than for an otherwiseequivalent plain-vanilla debt instrument.
On the other hand, many gold security issuers are not naturally long in gold.For example, many industrial companies issue bonds with attached gold-linkedwarrants to take advantage of a `hota gold market. If the issuer's asset value andcash #ow are unrelated to the gold price, the gold link can signi"cantly increasethe default risk. Budd (1983) discusses the striking case of the gold-linked bonds(`Giscardsa) issued by the French government in 1973, with the gold linkapparently added to `sweetena the issue. Due to the dramatic escalation in theprice of gold, the bond appreciated more than tenfold over a ten-year period.The French government did not have a gold reserve to o!set the exposure, andthe gold price escalation led to speculation that the government might have torenegotiate the gold clause.
In the next section, we highlight the credit enhancement achieved through thebundled hedge and analyze the features of the hedge that make this creditenhancement possible. In Section 4, we discuss other bene"ts of bundling, andshow that bundling overcomes many of the shortcomings of conventional riskmanagement noted by Smith and Stulz.
3. Credit enhancement through bundling
In this section, we develop a detailed numerical example to elucidate thee!ects of bundling risk management with "nancing as in the case of gold-linkeddebt. We use the setting of a gold mining "rm with existing senior debt thatrequires additional external "nancing. The example is a representative one tofocus on our conceptual points in this section, which are not speci"c to FCX. Itis designed to highlight the following e!ects: (1) credit enhancement stemmingfrom the positive correlation between the cash in#ow to the "rm from gold salesand the cash out#ow from the "rm to holders of the gold-linked debt; (2) theimplicit netting of embedded-derivative and bond cash #ow, which, in e!ect,
N.K. Chidambaran et al. / Journal of Financial Economics 60 (2001) 487}528 499

enhances the seniority of the junior gold-linked debt on hedged cash #ow; and(3) the inability to replicate this netting e!ect through conventional derivativecontracts due to the treatment of derivatives under bankruptcy.
We contrast the embedded hedge in a gold-linked bond with a conventionalhedge using a gold forward contract. We use bankruptcy costs as a motivationfor shareholders to hedge and thereby enhance the credit quality of the claimsissued. We analyze the e!ects on cash #ow to the various claimholders underboth credit enhancement scenarios. Under conventional hedging, senior bond-holders will have priority on the increase in cash #ow. This is consistent with theinsight provided by Myers (1977). As we show, bundling greatly reduces thewealth transfers to existing bondholders that arise from credit enhancement. Werefer to this e!ect as targeted risk management. In addition, we also show thatbundling allows stockholders to capture more of the reduction in bankruptcycosts. Our example extends the analysis of Smith and Stulz (1985), and showsthat the mode of risk management a!ects the division of the bene"ts among the"rm's "nancial claimholders.
Credit enhancement through bundling will also obtain in a Modigliani-Millerworld with no bankruptcy costs. Of course, "rm and shareholder value in thatsetting are independent of the structure of "nancing used to fund investments,and shareholders would be indi!erent between the various "nancing choices. Ingeneral, hedging bene"ts shareholders by reducing "nancial constraint costs,including reductions in the costs of "nancial distress, the costs of external"nancing, and the costs of underinvestment (Mello and Parsons, 2000). In thesimpli"ed single-period context of our model, the "rm is "nancially constrainedin states of bankruptcy and hedging bene"ts arise from reduction in expectedcosts of bankruptcy. Reducing these costs bene"ts shareholders and is onepossible reason why they undertake credit enhancement through risk manage-ment.
3.1. Targeted risk management using an indexed instrument
We model a gold mining "rm that requires external "nancing to develop itsgold reserves. The "rm's assets consist solely of its gold reserves, which are"nanced by both risky debt and equity. The assumption that debt is risky allowsus to incorporate bankruptcy costs in the model. We do not, however, explicitlyincorporate the tax shield and other e!ects of debt, since our focus is on theimpact of alternate risk management strategies, and the e!ects that we identifyare independent of the speci"c amounts of debt and equity levels of the "rm. Inconjunction with the new "nancing, the "rm seeks to reduce its exposure to goldprices via a risk management program, thereby enhancing the credit quality ofthe new "nancing and reducing bankruptcy costs.
We assume that the "rm's only asset is its reserve of 1.97 million ounces ofgold. It is seeking "nancing to expand this reserve to three million ounces. The
500 N.K. Chidambaran et al. / Journal of Financial Economics 60 (2001) 487}528

value of the "rm will be linearly increasing in the price of gold, and we assumethat gold prices range from $100 to $500 per ounce and are distributed uniform-ly over that range. The "rm currently has senior debt with a face value of $500million and is proposing to raise $251 million of new "nancing, either througha new equity issue or a new subordinated debt issue. This new "nancing will payfor the expansion project. We assume that the "rm faces bankruptcy costs of $50million if it were to default on any category of debt. This assumption sets thebankruptcy cost at approximately 5.7% of "rm value, which is within the rangeof 1% to 6.6% empirically measured by Weiss (1990). We assume risk neutralclaimholders and a discount rate of zero. Table 3 presents the base case and thetwo "nancing scenarios for the "rm, assuming that no risk management isundertaken at this point. Fig. 3 graphs the value of the "rm and its liabilities asa function of the gold price, for the base case and the two "nancing scenarios.
Scenario A presents the base case of the "rm prior to the expansion. The "rmwill default on its senior debt at a gold price of $253.4/ounce. The value of the"rm is $572.8 million of which (senior) debt is worth $422.8 million and equity isworth $150 million.
Since the expected value of gold is $300/ounce, the proposed scale expansionwill have a positive net present value (NPV) of $58 million. In Scenarios B andC, the "rm raises the new "nancing of $251 million required for the expansionvia new equity and new (junior) debt, respectively. In both cases, we assume thatthe new "nancing is fairly priced.
Comparing Scenarios A and B, we observe that undertaking the expansionwith new equity creates a total value of $67.9 million ($58 million project NPVplus $9.9 million bankruptcy cost reduction) to be shared between the seniorbondholders and stockholders. The value of senior debt increases by $52.2million while the value of existing equity increases by $15.7 million. In ScenarioC (junior debt "nancing), we observe that bankruptcy costs increase by $16.7million relative to Scenario B and by $6.8 million relative to Scenario A, due tothe increase in leverage. Thus, the positive project NPV is partially o!set by thehigher bankruptcy costs. Junior debt in Scenario C defaults at the gold price of$300. The senior bondholders capture the entire net value increase due to theexpansion. This exact result arises because we set the initial reserve at 1.97million ounces in order to make the stockholders indi!erent to undertaking theexpansion project with junior debt "nancing.
We next examine the case when the "rm uses junior gold-linked debt "nanc-ing. We assume that the face value of the junior debt is equal to one millionounces of gold, which is set such that junior debt is once again worth $251million. As Scenario D in Table 4 shows, issuing the gold-linked junior debt doesnot reduce the sensitivity of the "rm's value to the gold price, but it doesdecrease the sensitivity of equity to the gold price. The junior debt in ScenarioD is safer than the junior debt in Scenario C, and it defaults at the lower goldprice of $250.
N.K. Chidambaran et al. / Journal of Financial Economics 60 (2001) 487}528 501

Table 3Values of the "rm, debt, and equity before and after expansion
This table shows the change in the value of the "rm and its capital structure components for a goldmining "rm that goes through a scale expansion. The "rm has 1.97 million ounces of gold reservesand plans to expand to three million ounces of gold in reserves. We assume that the value of the "rmis linear in the price of gold and that gold prices are distributed uniformly over the range of $100 perounce to $500 per ounce. The "rm has $500 million in senior debt and needs to raise $251.0 millionfor the expansion. The "rm faces bankruptcy costs of $50 million if it defaults. Scenarios in which the"rm issues debt and equity to "nance the expansion are analyzed as described in the panel headers.Note that the NPV of the expansion from 1.97 million ounces to three million ounces is just highenough to overcome the Myers (1977) debt overhang problem if the "rm were to raise funds byissuing junior debt as in Scenario C.
Scenario A: Gold mining xrm prior to expansion, 1.97 million oz of gold in reservesMin Sr Debt -'
PaidMax Expected
value(- Default
Gold Price 100.0 253.4 300.0 500.0Reserves, million oz 1.97 1.97 1.97 1.97Firm value 147.3 500.0 600.0 986.6 $572.8Value of senior debt 147.3 500.0 500.0 500.0 $422.8Value of Equity 0.0 0.0 200.0 486.6 $150.0
Scenario B: Gold mining xrm with expands to 3 million ounces of gold reserves.Firm raises $251 million by selling equity
Min Sr Debt-'Paid
Jr Debt'Paid
Max Expectedvalue
(- Default
Gold Price 100.0 166.67 300.0 500.0Reserves, million oz 3 3 3 3Firm value 250.0 500.0 900.0 1500.0 $891.7Value of senior debt 250.0 500.0 500.0 500.0 $475.0Value of existing equity 0.0 0.0 159.0 397.6 $165.7Value of new equity 0.0 0.0 241.0 602.4 $251.0
Scenario C: Gold mining xrm expands to 3 million ounces of gold reserves.Firm raises $251 million through junior bonds, face value $400 million
Min Sr Debt-'Paid
Jr Debt-'Paid
Max Expectedvalue
(- Default
Gold Price 100.0 183.3 300.0 500.0Reserves, million oz 3 3 3 3Firm value 250.0 500.0 900.0 1500.0 $875.0Value of senior debt 250.0 500.0 500.0 500.0 $474.0Value of junior debt 0.0 0.0 400.0 400.0 $251.0Value of equity 0.0 0.0 0.0 600.0 $150.0
502 N.K. Chidambaran et al. / Journal of Financial Economics 60 (2001) 487}528

Fig. 3. This "gure shows the value of the "rm and its capital structure components for a gold mining"rm that expands reserves from 1.97 to 3 million ounces. The value of the "rm is linear in the price ofgold prices are distributed uniformly over the range of $100 per ounce to $500 per ounce. The "rmhas $500 million in senior debt and faces bankruptcy costs of $50 million if it defaults. The "rm needsto raise $251 million to fund the expansion. Scenario B and Scenario C present the cases in which theexpansion is "nanced with new equity and with junior debt, respectively.
The price of gold at which junior debt defaults in Scenario D decreases for tworeasons. First, the face value of junior debt is lower than the face value of juniordebt in Scenario C } $300 million at current gold prices versus $400 million.Second, the value of the "rm decreases at a lower rate as a function of gold prices
N.K. Chidambaran et al. / Journal of Financial Economics 60 (2001) 487}528 503

Table 4Gains from targeted risk management
This table shows the value of the "rm and its capital structure components for a gold mining "rmthat has three million ounces of gold in reserves. We assume that the value of the "rm is linear in theprice of gold and that gold prices are distributed uniformly over the range of $100 per ounce to $500per ounce. The "rm has $500 million in senior debt and raises $251.0 million by issuing junior debt.The "rm faces bankruptcy costs of $50 million if it defaults. Two scenarios are analyzed as describedin the panel headers.
Min Sr Debt-'Paid
Jr Debt-'Paid
Max Expectedvalue
(- Default
Scenario D: Gold mining ,rm with targeted risk management.Firm sells junior gold-linked bonds of face value 1.0 million oz
Gold price 100.0 183.3 250.0 500.0Reserves, million oz 3 3 3 3Firm value 250.0 500.0 750.0 1500.0 $881.3Value of senior debt 250.0 500.0 500.0 500.0 $474.0Value of junior gold-linked debt 0.0 0.0 250.0 500.0 $251.0Value of equity 0.0 0.0 0.0 500.0 $156.3
Scenario E: Gold mining xrm with risk management at the xrm level.Firm sells junior bonds of face value $345.9 million.Firm hedges by selling a gold forward for 1.0 million oz at $300/oz
Gold Price 100.0 125.0 272.9 500.0Reserves, million oz 3 3 3 3Amount managed 1 1 1 1Residual exposure, million oz 2 2 2 2Firm value 450.0 500.00 845.9 1300.0 $878.4Value of senior debt 450.0 0.0 500.0 500.0 $498.4Value of junior debt 0.0 0.0 345.9 345.9 $251.0Value of equity 0.0 0.0 0.0 454.1 $128.9
after the bundled hedge in Scenario D as compared to the face value of thejunior debt. If the "rm had issued straight junior debt of face value $300 million,default would have occurred at a gold price of $266.67. In contrast, gold-linkeddebt of face value $300 million defaults at $250. The magnitude of the seconde!ect is captured by this price di!erence.
The credit enhancement is achieved because of the positive correlation be-tween the cash #ow of the gold-linked security and the "rm's cash #ow, as can beseen in Fig. 4, which shows the cash #ow to the various claims at di!erent goldprices. Senior debt defaults at the same price as the senior debt in ScenarioC and its value is $474 million as in Scenario C. The value of the "rm rises by$6.3 million to $881.3 million, re#ecting the reduction in expected bankruptcycosts. Stockholders capture the reduction in bankruptcy costs, and the value of
504 N.K. Chidambaran et al. / Journal of Financial Economics 60 (2001) 487}528

Fig. 4. This "gure shows the value of the "rm and its capital structure components for two riskmanagement scenarios. In Scenario D, the "rm issues gold-linked junior debt with a face value of1 million ounces. In Scenario E, the "rm sells 1 million ounces of gold forward. Values of the "rm,senior debt, junior debt, and equity are as shown in Table 4.
equity increases by $6.3 million to $156.3 million. Thus, the entire increase in thevalue of the "rm arising from a reduction in bankruptcy costs is captured by thestockholders, making them signi"cantly better o! relative to not managing risk.
As would be predicted by Myers (1977), it is important to note that gold-linked "nancing is worse than equity "nancing, by $9.4 million for the currentstockholders. Of course, this assumes that equity can be issued at its full value, in
N.K. Chidambaran et al. / Journal of Financial Economics 60 (2001) 487}528 505
� We are grateful to a referee for the important added insight gained by including the case of equity"nancing in our model. See Myers and Majluf (1984) and Smith (1986) for a discussion of some of theissues associated with the choice of security.
which case the di!erential for stockholders is 3.7% of the value of the new"nancing (FCX had ruled out a new equity issue because the stock price wasdepressed and trading well below the value of their reserves). New equity"nancing dominates all the scenarios of junior debt "nancing considered here,provided the discount on issuing new equity does not exceed its incrementalbene"t. Our example does not explain the choice of debt over equity, and givenour focus on credit enhancement conditional on debt "nancing, the morefundamental issues of the debt-equity choice are outside our model.�
We next consider the case in which the "rm seeks to enhance the credit qualityof its junior debt by conventional means. Could the "rm issue straight juniordebt and then hedge using a gold forward contract to achieve the same creditenhancement as with bundling the two? In Scenario E in Table 4, the "rmmanages the price risk associated with a third of its gold reserves, i.e., onemillion ounces, using a forward contract. Ignoring carrying costs, this riskmanagement "xes the price for this gold at $300/ounce. The gold price hedgereduces the sensitivity of "rm value to the gold price and has several conse-quences. First, the junior debt does indeed have higher credit quality (it defaultsat a lower gold price of $272.9), and the "rm needs to sell less face value of debt($345.9 million) relative to Scenario C to raise the required $251 million. Second,the existing senior debt also becomes safer (it defaults at the lower gold price of$125), increasing the value of the senior debt to $498.4 million. The value of the"rm rises by $3.4 million to $878.4 million, re#ecting the reduction in expectedbankruptcy costs. However, stockholders do not bene"t because this increase ismore than o!set by the wealth transfer to senior bondholders, and the value ofequity drops to $128.9 million from the $150 million in Scenario A. Thus,stockholders will have a strong incentive to unwind the hedge after the juniorbond issue.
The valuation di!erences between bundling and conventional risk manage-ment in Scenarios D and E in Table 4 arise because of the cash #ow di!erencesfrom the respective derivative transactions. In Scenario E, cash #ow for thederivative transaction a!ects the overall cash #ow of the "rm, and the allocationto the various claimholders takes place according to the seniority structure, i.e.,"rst to senior debt, then to junior debt, and "nally to equity. Therefore, seniorbondholders bene"t when gold prices are low and the "rm is in default becausethe "rm receives a cash in#ow from the forward contract. In Scenario D, no suchcash #ow accrues to the "rm from the bundled derivative contract when theprice of gold decreases, because junior bondholders (e!ectively) net payments tothe "rm on their bundled long forward contract when the assets of the "rm are
506 N.K. Chidambaran et al. / Journal of Financial Economics 60 (2001) 487}528
lower than the face value of the "rm's total debt. Therefore, the cash #ow fromthe bundled derivative component does not #ow through to the "rm's seniordebtors.
To further analyze the netting feature that characterizes risk managementbundled with "nancing, consider a portfolio consisting of a straight bond anda long forward contract placed with the same counterparty. When the price ofgold is below the forward price, the forward contract has a negative cash #owthat o!sets the value of the straight bond, making the value of the portfoliolower than the value of the straight bond. However, if an investor in sucha portfolio is allowed to net the value of the two securities, any shortfall in thebond proceeds due to the counterparty when the "rm is in default will be o!setagainst payments due to the "rm on the forward contract. The gold-linked bondrepresents exactly such an ability to net the potential losses on the bond againstamounts due on the long forward position.
The implicit ability to net the cash #ow on the bond and the hedge under allpossible outcomes is the crucial feature that di!erentiates a "nancing instrumentwith a bundled hedge, such as a gold-linked bond, from straight debt "nancingcoupled with a conventional hedge. The derivatives counterparty in a conven-tional hedge has no such netting privileges when the "rm hedges by trading inthe derivatives market. The bundled hedge provides a signi"cant advantage tojunior bondholders that, through the pricing of the junior bonds, can beappropriated by the stockholders. This security design has the e!ect of targetinghedging bene"ts to the junior bondholders, bypassing the traditional prioritystructure.
4. Further bene5ts of bundling
We show in this section that the gold-linked structure adopted by FCXameliorates the time inconsistency problem associated with conventional riskmanagement that gives rise to asset substitution (Smith and Stulz, 1985). Weargue that this is partially due to the adverse liquidity consequences of a conven-tional derivatives strategy required to reverse the bundled hedge (Mello andParsons, 1995, 2000). Moreover, these adverse liquidity e!ects also make itdi$cult to replicate the bundled hedge using a conventional derivatives strategy.Finally, we also discuss the advantages of linking debt to an exogenous index,such as the gold price, relative to other forms of indexation that are susceptibleto manipulation by the "rm's managers.
4.1. Asset substitution
In the Smith and Stulz framework, "rms that hedge to enhance credit qualitywhile issuing debt must convince incoming bondholders that they will maintain
N.K. Chidambaran et al. / Journal of Financial Economics 60 (2001) 487}528 507

the hedge after the bond sale in order for the bond price to re#ect the lower riskof default and for stockholders to capture the bene"ts of hedging. This problemis mitigated in the case of a "rm that employs a bundled hedge. We illustrate thisin Table 5. In Scenario F, the "rm unwinds the conventional hedge by takinga long forward position in gold to o!set the exposure arising from the previouslyestablished short forward position, and in Scenario G, the "rm attempts tosimilarly o!set the bundled short forward position.
The results for Scenario F reveal that unwinding the conventional hedge ("rstintroduced in Scenario E) increases the default risk for both classes of bond-holders, making them substantially worse o!. The value of the senior bondsdecreases by $24.5 million and the value of the junior bonds decreases by $26million. Stockholders gain by $49.4 million because higher cash #ow accrues tothem when the "rm is solvent. This wealth transfer illustrates the classic assetsubstitution problem. Firm value decreases by $1.1 million because of theincrease in distress costs associated with the higher default risk.
This illustrates the point made by Smith and Stulz that by reneging ona commitment to hedge or by unwinding an existing hedge, stockholders ina levered "rm can be made considerably better o!. The problem is clearlyexacerbated when the "rm is already levered because stockholders have anadditional incentive to unhedge stemming from the wealth transfer to seniorbondholders.
The results for Scenario G demonstrate that the e!ects of unwinding thebundled hedge ("rst introduced in Scenario D) are more complex. The counter-party in the o!setting forward transaction has a short position and, since anyforward contract obligations are junior to both classes of the "rm's debt, isexposed to the risk that the "rm will default on the forward contract when thevalue of the "rm drops below the value of its debt. The counterparty will requirecompensation through an upfront premium for the default risk. We incorporatethis as an initial cash out#ow from the "rm. The value of this premium has to bedetermined iteratively since the payment of the premium a!ects the probabilityof default and hence the size of the premium. For the parameters that character-ize Scenario G, the value of this premium is $49.6 million. This can be veri"ed bycalculating the expected cash #ow to the counterparty at this value } also $49.6million. The value of senior debt decreases by $11.4 million and junior debt by$12.8 million, which are smaller declines than for Scenario F. The increase in thevalue of equity is $20 million, also much smaller than in Scenario F. Thus,unwinding the bundled hedge results in considerably lower wealth transfers thanunwinding a conventional hedge.
The key di!erence between the cash #ow e!ects in the two scenarios is onceagain the treatment of the derivatives counterparty when the "rm is in default.In Scenario F (unwinding the conventional hedge), we assume that the counter-party holds both the long position in the transaction that initiated the hedge andthe short position that unwinds it. Under current bankruptcy regulations, the
508 N.K. Chidambaran et al. / Journal of Financial Economics 60 (2001) 487}528
counterparty is allowed to simply net the two positions and achieve priorityover the "rm's senior bondholders in states of default (see Tucker, 1991; Foster,1995). The counterparty that has the short forward position, therefore, does notlose when the "rm goes bankrupt and demands no additional compensation. InScenario G, the counterparty has a naked short position and a claim that isjunior to debt if the "rm defaults. Payments to the derivatives counterparty too!set this risk reduce the gains that stockholders can realize by unwinding.
Boot et al. (1993) show that reputational concerns can overcome any residualincentive to unhedge, especially for companies undertaking capital-intensiveprojects that require frequent re"nancing. Unwinding a bundled hedge requiresthe "rm to explicitly initiate a derivative transaction that actually increases therisk exposure of the "rm's cash #ow. Compared to the failure to undertakea conventional hedge, such a transaction would increase the reputation problembecause it is more transparent. It is harder for stockholders to justify an act ofcommission (to increase cash #ow risk) than to justify an act of omission (afailure to hedge).
Furthermore, unwinding a long-term hedge of the sort bundled in FCX'sgold-linked instruments is also likely to be constrained by the lack of appropri-ate hedging instruments and the high costs associated with creating an equiva-lent o!setting hedge. Merton (1990) advances this argument as a rationale for"nancial innovation. Indeed, Smithson and Chew (1998) argue that "rms areusing hybrid securities to complete the market and thereby capture a surpluswhen the underlying components are not individually available in the market(see also Van Horne, 1985). Each of the FCX securities had maturity periods often years or more.
Additionally, if short-term derivative contracts are used to unhedge, theycould give rise to adverse liquidity requirements, which can be a concern forcash constrained "rms (see Mello and Parsons, 1995, 2000). For example,assume that the gold-mining "rm follows a strategy of selling a sequence ofshort-term forward contracts to hedge the face value of straight debt, whichsigni"cantly exceeds the value of gold revenues realized during the term of theforward contract. If the price of gold were high at the time of the rollover fromone forward contract to the next, the "rm would have a cash de"cit associatedwith the loss on the forward position. This will be costly if the "rm has a binding"nancial constraint. The long-term bene"ts of the hedge would be immaterial insuch a scenario and the short-term cash #ow de"cit could even result inbankruptcy. These liquidity considerations are likely to be very important forFCX, which faces "nancial constraints and needs to preserve funds for theexpansion of mining operations. The gold-denominated securities o!er a cred-ible liquidity-matched credit-enhancement strategy relative to alternative strat-egies based on conventional short-term derivative contracts.
In Scenario G, we consider the case of a "rm that manages risk only via thebundled hedge. Indeed, our analysis suggests that "rms seeking to enhance
N.K. Chidambaran et al. / Journal of Financial Economics 60 (2001) 487}528 509

Tab
le5
Gai
nsfr
om
exp
ost
unw
ind
ing
of
the
hed
ge
Th
eta
ble
bel
ow
show
sth
eva
lue
oft
he"
rman
dit
sca
pita
lstr
uct
ure
com
pon
ents
for
ago
ldm
inin
g"
rmth
ath
asth
ree
mill
ion
ozo
fgo
ldin
rese
rves
and
buy
sa
forw
ard
cont
ract
ono
nem
illio
noz
.ofg
old
atth
ecu
rren
tm
arke
tpr
ice
of$3
00/o
z.W
eas
sum
eth
atth
eva
lue
ofth
e"
rmis
line
arin
the
pri
ceo
fgo
ldan
dth
atgo
ldpr
ices
are
dist
ribu
ted
uni
form
lyov
erth
era
nge
of$
100
per
ounc
eto
$500
per
oun
ce.T
he"
rmha
s$5
00m
illio
nin
sen
ior
deb
tan
dh
asra
ised
$251
.0b
yis
suin
gju
nio
rd
ebt.
Th
e"
rmfa
ces
ban
krup
tcy
cost
so
f$5
0m
illio
nif
itde
fau
lts.
Tw
osc
enar
ios
are
anal
yzed
corr
espo
nd
ing
toth
eh
edge
des
crib
edin
Scen
ario
Dan
dSc
enar
ioE
of
Tab
le4
asd
escr
ibed
inth
ep
anel
hea
der
s.
Min
SrD
ebt
-' Pai
dJr
Deb
t-' Pai
d(
-Def
ault
Max
Exp
ecte
dva
lue
Cha
nge
du
eto
unw
indi
ng
ScenarioF
:Unwinding
thetraditionalxrm-levelriskmanagement
Firmsellsjuniorbondsofface
value$345.9million
Firmhedgesbysellingagoldforwardfor1millionoz
Firmunwindsbybuying
agoldforwardfor1millionoz
Go
ldpr
ice
100.
018
3.3
282.
050
0.0
Res
erve
s3
33
3
Hed
geC
Fs
toco
un
ter-
par
ty!
200.
0!
116.
7!
18.0
200.
0U
nw
ind
ing
CF
sto
coun
ter-
part
y20
0.0
116.
718
.0!
200.
00
Net
CF
so
nth
efo
rwar
ds0.
00.
00.
00.
0
Fir
mva
lue
250.
050
0.0
845.
915
00.0
877.
3(
1.1)
Val
ueo
fse
nio
rd
ebt
250.
050
0.0
500.
050
0.0
474.
0(2
4.5)
Val
ueo
fju
nio
rd
ebt
0.0
0.0
345.
934
5.9
225.
0(2
6.0)
Eq
uit
yca
sh#
ows
0.0
0.0
0.0
654.
117
8.3
49.4
510 N.K. Chidambaran et al. / Journal of Financial Economics 60 (2001) 487}528

ScenarioG
:Unwindingthetargetedriskmanagement
Firmsellsjuniorgold-linkedbondsofface
value1.0millionoz
Firmunwindsbybuyingagoldforwardfor1.0millionozandpays$49.6million
Go
ldpr
ice
100.
019
9.9
283.
250
0.0
Res
erve
s3
33
3
Fir
mva
lue
200.
450
0.0
800.
014
50.4
877.
1(
4.2)
Val
ueo
fse
nio
rd
ebt
200.
450
0.0
500.
050
0.0
462.
6(1
1.4)
Val
ueo
fju
nio
rgo
ld-l
inke
dd
ebt
0.0
0.0
283.
250
0.0
238.
3(1
2.7)
Cas
h#
ow
saf
ter
pay
men
tsto
bo
ndh
old
ers
0.0
0.0
16.8
450.
4C
ash#
ow
sow
edto
coun
ter-
part
y20
0.0
100.
116
.8!
200.
0A
ctu
alca
sh#
ows
pai
dto
coun
ter-
part
y0.
00.
016
.8!
200.
0!
49.6
Eq
uit
yca
sh#
ows
0.0
0.0
0.0
650.
417
6.2
19.9
N.K. Chidambaran et al. / Journal of Financial Economics 60 (2001) 487}528 511

� We thank a referee for suggesting these important caveats.
credit quality through risk management should only use bundled hedging. Inpractice, however, it is possible that "rms will have a combination of bundledand conventional hedges outstanding at a given point in time. If so, the "rm canstill `unwinda a bundled hedge by actually unwinding a conventional hedge,provided this o!setting conventional hedge is done with the original counter-party, although Tufano (1993, 1996) has noted that hedging in the gold industryis primarily undertaken by gold-linked "nancings or forward sales betweenprincipals, making it more di$cult to unwind a hedge with the same counter-party. Nor can we rule out the possibility that such a `mixed hedgera mightmodify its future risk management program to use fewer conventional hedges, inorder to o!set the e!ect of a new bundled hedge.�
Thus, while the incentives to unwind are not completely eliminated when the"rm uses a bundled hedge, they are smaller and make it less likely that the "rmwill unhedge. A risk management strategy is usually not a one-time event, and aswe have previously noted, a "rm can implicitly unhedge by not implementinga future hedge. Our analysis of the market's pricing of FCX's gold-denominateddepositary shares later in the paper suggests that the market priced the securitiesas though risk management was credible, factoring in a signi"cant enhancementin the credit quality of the two issues. Nor do we "nd any evidence of explicitunhedging by FCX after these securities were placed.
4.2. Exogenous versus endogenous indexation of debt securities
Previous studies have examined the use of indexed debt and have identi"edtwo potential agency problems. The "rst is the ability of managers to manipulatethe variable chosen as the index. Second, a negative signal is possible when themanager has private information about the variable chosen as the index. Wediscuss below how these agency issues can be addressed by using a market-determined index such as the gold price.
Froot et al. (1989) examine the issue of indexing debt to observable variablesin the context of their study of LDC debt. They contrast two schemes ofindexation: (a) indexing debt to endogenous variables such as output or revenueand (b) indexing debt to exogenous variables such as the price of commodities.They conclude that since debtors can at least partially in#uence endogenousvariables such as the level of output, indexing debt to exogenous variables willavoid moral hazard problems.
McConnell and Schlarbaum (1981) examine income bonds used by railroadcompanies during their restructuring, and attribute the bonds' lack of popular-ity to the `smell of deatha associated with their usage. Income bonds allowa "rm to suspend interest payments during times of low earnings, and their issue
512 N.K. Chidambaran et al. / Journal of Financial Economics 60 (2001) 487}528
could represent a negative signal because managers have private informationabout future earnings. This feature can create the incentive for earnings manip-ulation by stockholders to the detriment of bondholders, paralleling the case ofoutput-indexed debt examined by Froot et al. (1989). McConnell and Schlar-baum, however, argue that the potential for such con#icts can be easily elimi-nated, and that it is the signal of "nancial trouble that explains the dearth ofincome bonds. Since FCX is unlikely to have private information about goldprices, such negative signaling consequences do not result from gold indexation.Despite providing FCX the ability to defer dividend payments in times ofearnings di$culty (the depositary shares are backed by FCX gold preferredstock), the gold depositary shares are not associated with a negative signal,unlike the income bonds.
5. Detecting credit enhancement in the FCX commodity-linked depositary shares
�We analyze the pricing of the gold- and silver-denominated depositary sharesto detect whether FCX was able to enhance credit quality through bundling"nancing and risk-management, as we have hypothesized. To illustrate ourapproach, we begin with a detailed analysis of the junior gold-linked bond used inthe representative example in Section 3. We decompose the cash #ow of eachdepositary share into three components: a risky straight bond, a risk-free forwardcontract, and a credit enhancement residual (CER), which will be positive if thecredit enhancement is priced. We then calculate the di!erential in the CER foreach of FCX's two gold-denominated depositary shares relative to the silver-denominated depositary shares, and we show that this is positive in both cases.
It is important to emphasize that we do not value the depositary shares inabsolute terms. Our interest here is in determining whether the market's pricingof the depositary shares re#ects the risk management bundled by FCX. Webenchmark the pricing of the depositary shares against the pricing of similarlyrated straight debt in order to achieve this result.
5.1. Decomposition of the gold-linked bond in the illustrative example
Table 6 presents the decomposition of cash #ow for the gold-linked juniorbond (Section 3, Scenario D). Given our assumptions, both the spot and forwardprices of gold are $300/ounce, and the junior bond has a face value of onemillion ounces of gold. We decompose the cash #ow to the gold-linked bond onthe assumption that it consists of a straight bond with a face value of $300million and a riskless gold forward contract. As shown in Section 3, the bundlingof "nancing and risk management allows the bondholder to net the two cash#ows in the event of a default on the straight bond. This is shown in Table 6 asthe cash #ow to the option-to-net.
N.K. Chidambaran et al. / Journal of Financial Economics 60 (2001) 487}528 513

Tab
le6
Dec
om
po
sin
gca
sh#
ow
so
fth
ego
ld-l
ink
edbo
nd
Th
ista
ble
dec
om
pos
esth
eca
sh#ow
so
fago
ld-l
inke
db
ond
into
di!
eren
tco
mp
onen
ts.T
he
com
pon
ents
that
mak
eu
pth
ego
ld-l
inke
db
on
dar
esh
ow
nto
com
pris
eca
sh#ow
sto
ast
raig
htbo
nd
wit
ha
face
valu
eeq
ual
toth
efo
rwar
dpr
ice
ofo
ne
mill
ion
oz.o
fgol
d,a
fair
-val
uego
ld-s
wap
for
the
face
valu
e,an
dth
eca
sh#ow
so
fth
ego
ld-l
inke
db
ond
hold
ers'
opt
ion
-to-
net.
We
assu
me
that
the
valu
eo
fth
e"
rmis
linea
rin
the
pric
eo
fgo
ldan
dth
atgo
ldp
rice
sar
ed
istr
ibu
ted
unifo
rmly
ove
rth
era
nge
of$
100
per
oun
ceto
$500
per
oun
ce.T
he"
rmis
suin
gth
ego
ld-l
ink
edb
ond
has
thre
em
illio
noz
.ofg
old
rese
rves
and
sen
ior
deb
to
uts
tan
din
go
ffa
ceva
lue
$500
mill
ion
.T
he
gold
-lin
ked
bon
dan
dth
eb
und
led
risk
yb
ond
bot
hd
efau
ltat
ago
ldp
rice
of
$250
/oz.
Th
eo
ptio
n-t
o-n
etca
sh#
owo
nth
efo
rwar
dag
ain
stca
sh#
ow
so
nth
eb
ond
has
posi
tive
cash#
ows
wh
enth
eb
ond
sar
ein
defa
ult
,i.e
.,fo
ral
lgo
ldp
rice
sb
elo
w$2
50/o
z.T
he"rm
face
sb
ankr
up
tcy
cost
so
f$5
0m
illio
nif
itd
efau
lts.
Min
Sr
Deb
t-'
Pai
dJr
Deb
t-'
Pai
dM
axE
xpec
ted
valu
e(
-D
efau
lt
Go
ldp
rice
Res
erve
s,m
illio
noz
100.
018
3.3
250.
025
0.0
260.
030
0.0
500
33
33
33
3
Val
ueo
fgo
ldre
serv
es30
0.0
550.
070
0.0
750.
078
0.0
900.
015
00.0
900.
0#
CF
fro
mfo
rwar
d0
00
50.0
40.0
0.0
!20
0.0
0.0
!B
ank
rupt
cyco
st!
50.0
!50
.0!
50.0
00
00
18.7
Net
valu
e25
0.0
500.
070
0.0
800.
082
0.0
900.
013
00.0
881.
3
Dec
om
po
siti
ono
fgo
ld-l
inke
db
on
d
Val
ue
of
$300
face
bon
d0.
00.
020
0.0
300.
030
0.0
300.
030
0.0
204.
1!
CF
pai
do
nfo
rwar
d!
200.
0!
116.
67!
50.0
!50
.0!
40.0
0.0
200
0.0
#O
pti
on-t
o-N
et20
0.0
116.
6750
.00.
00.
00.
00.
046
.9T
ota
l0.
00.
020
0.0
250.
026
0.0
300.
050
0.0
251.
0
CF
togo
ld-l
ink
edbo
nd
fro
mT
able
4
Val
ueo
fju
nio
rgo
ld-l
inke
dd
ebt
0.0
0.0
200.
025
0.0
260.
030
0.0
500.
025
1.0
514 N.K. Chidambaran et al. / Journal of Financial Economics 60 (2001) 487}528

Consider a gold price of $100/ounce. The "rm is in default and there is zerocash #ow to the straight bond. The "rm should receive a cash in#ow of $200million on the forward contract. However, the bondholder will exercise theoption to net the cash #ow owed to the "rm on the forward contract against thecash #ow owed by the "rm on the straight bond. Since the amount owed on theforward contract is $200 million and the straight bond has zero cash #ow, thethree components combine to yield a net cash #ow of zero, which is the cash #owto the gold-linked bond at this gold price, as shown in Table 4. As shown inTable 6, the option-to-net is positive for all gold prices below $250/ounce, whichis the price at which the "rm will default on the gold-linked bond.
Next, consider a gold price level of $260/ounce. The straight bond is worth$300 million, which is partially o!set by the cash out#ow of $40 million that thebondholder pays on the embedded forward. Thus, the net cash #ow to thebondholder is $260 million, which is the same as in Table 4. For all gold pricelevels above the default level of $250/ounce, the cash #ow to the gold-linkedsecurity is simply the sum of the cash #ow to the straight bond and the cash #owon the forward contract. At gold prices exceeding $300/ounce, the forwardcontract results in an additional cash #ow from the "rm to the bondholder,raising the value of the gold-linked bond above the value of the straight bond.As Table 6 shows, the option-to-net is zero for all gold prices above $250.
As in Section 3, the transition from solvency to default, which occurs at a goldprice of $250/ounce, is also noteworthy. The default results in a step decrease inthe "rm's value of $50 million, arising from the cost of bankruptcy. This resultsin a corresponding step increase in the value of the option-to-net, from zero to$50 million in going from solvency to default.
Table 6 shows the expected values of each of the three components and of thegold-linked bond. While the hybrid gold-linked bond is valued at $251 million,the embedded risky straight bond is worth only $204.1 million. The forwardcontract has an initial value of zero since it was undertaken at market. Theoption-to-net when the bond is in default accounts for the value di!erential of$46.9 million. The option-to-net is positive and this source of value addition tothe bundled claim is the credit enhancement residual.
We can, therefore, express the value of the gold-linked bond as the sum ofthree parts:
Value of Value of Value of Credit enhancement
gold-linked " forward # risky # residual
bond contract bond (option-to-net)
(1)
where the forward contract is sized to match the physical principal underlyingthe gold-linked bond and the face value of the risky bond is normalized at theprevailing forward price of gold.
N.K. Chidambaran et al. / Journal of Financial Economics 60 (2001) 487}528 515
When risk management is credible, the option-to-net is valuable and will benonnegative for each of the three cases analyzed here, since the embeddedderivative contracts were designed to o!set FCX's existing exposure. If thetransaction were speculative, bankruptcy costs would actually increase, in whichcase, the value of the hybrid bond will be lower than the embedded straightbond, resulting in a negative residual. In the remainder of the paper we willassume that the market value of the bundled claim, i.e., the depositary shares, isavailable, and use the expression above to compute the CER.
5.2. Detecting credit enhancement in the FCX depositary shares
We apply the decomposition in Eq. (1) to FCX's depositary shares to ascer-tain whether FCX was able to enhance the credit quality of its depositary shares.We begin by describing the framework of our analysis as it applies to the speci"ccase of the three depositary shares issued by FCX. We then describe in detail thespeci"c terms of the depositary shares, the nature of the embedded derivativecontract, and our procedure to calculate the relative CERs of the two gold-linked securities.
5.2.1. Contemporaneous analysis of the CERThree issues arise in analyzing the pricing of FCX's depositary shares. First,
the depositary shares are exposed to default risk, which is in turn modi"ed bythe structure of the security. Therefore, if we were to estimate the absolute valueof these securities, we would need to estimate the default probability and thecorrelation between the future cash #ows of the depositary shares and FCXrevenues, both of which are unobservable. Second, the three depositary shareswere issued over a one-year period (from August 1993 to July 1994) and thepricing on the day of issue could re#ect di!erent market conditions. Third,although all three securities had the same B1 credit rating from Moodys, wecannot be sure whether the market applied the prevailing B1 yield in valuingthem, since FCX was under a negative credit watch during the period in whicheach of the three securities was issued. This negative credit watch was lifted inNovember 1994, well after the last of the three securities, the silver depositaryshares, was issued.
To get around these problems, we use the silver depositary shares as a bench-mark in the cash #ow decomposition developed in Section 5.1, and analyze allthree depositary shares on the same day, speci"cally, the day on which thesilver-denominated security was issued. Since all three depositary shares wereissued pari passu, we can assume that the straight bond component has the samelevel of default risk for all three depositary shares. In addition, a review of majornews items, SEC "lings, "nancial performance, and annual reports that span theJanuary 1993 to July 1994 period, shows no substantive changes during thisperiod, further ensuring the validity of our comparison across the three issues.
516 N.K. Chidambaran et al. / Journal of Financial Economics 60 (2001) 487}528

We "rst calculate the risky discount rate for the bond component in the silverissue such that the silver CER will be set equal to zero. Thus, the embedded riskybond in the silver issue permits us to infer the market's assessment of FCX'scredit risk. We then apply the above rate to the bond component in the goldissues and calculate the gold CERs. Credit enhancement in the gold issue will becon"rmed if we "nd that the gold CER is positive and the risky discount rateapplicable to the silver depositary share is approximately equal to the marketrate for similarly rated securities.
5.2.2. The embedded derivative contractFig. 5 illustrates the cash #ows for a typical depositary share issued by FCX.
The gold and silver issues have a face value that is denominated in terms of therespective commodity. The depositary shares also pay a sequence of dividendsthat is a percentage of the face value of the share and is also denominated interms of the respective commodity.
There are some noteworthy features of the depositary share structure used byFCX that di!er from the hypothetical gold-linked bond discussed in ourrepresentative example in Section 3. First, the depositary shares have preferredstock as the underlying security. This makes these securities junior to thecurrently outstanding senior debt (which is also rated B1) with respect to claimsagainst the "rm in the event of bankruptcy. The interest payments on thedepositary shares are, therefore, riskier than the coupon payments on debt.A decomposition of the cash #ows of the depositary shares as described inSection 5.1 will overstate the value of the bond and underestimate the CER,thereby biasing against "nding a signi"cant CER even when it does exist. Thismakes our analysis conservative.
Second, unlike the single cash #ow of the hypothetical gold-linked bond, thedepositary shares have a sequence of commodity-linked payments. Multiplyingthe ounces of the commodity by the forward price to calculate the equivalentdollar cash #ow will result in a non-standard bond, with varying but determinis-tic cash #ow. If each of the cash #ows of the embedded bond were di!erent, theentire yield curve corresponding to the B1 rating would be required to value thebond. We simplify our analysis by using the swap rate instead of the sequence offorward rates. This procedure results in a bond that is economically equivalentto that derived by using a sequence of forward rates, since the forward and swapcontracts are assumed to be riskless. This alternative procedure has the bene"tof yielding a standard bond, i.e., a bond with a "xed face value and a "xedpercentage of the face value paid as interest at regular intervals, allowing us touse a summary yield measure for discounting the cash #ows.
Our assumption that the gold-swap is risk-free makes our analysis conserva-tive since it creates a bias against "nding a positive CER. If the swap were toincorporate a non-zero probability of default, the counter-party would demandextra compensation, resulting in a lower swap rate, and thereby a lower value for
N.K. Chidambaran et al. / Journal of Financial Economics 60 (2001) 487}528 517

Fig. 5. This "gure shows the dollar equivalent cash #ows of a typical gold-denominated depositaryshare issued by FCX. The payments are in gold ounces and are converted at the appropriate spotprice to calculate the dollar equivalent value.
the embedded bond. Thus, assuming that the swap is risk-free maximizes thevalue of the embedded bond and minimizes any CER we may "nd.
A critical component in our calculations is the fair-value swap rate. Since dataon long-term swap rates are not available, we use traded futures prices andTreasury strip market data to compute the swap rate. The gold and silver futuresmarkets are incomplete, and data are not available for maturities beyond "veyears. Furthermore, the cash #ow does not exactly match the expiration dateson the available futures contracts. Therefore, we need to use a model for the termstructure of the net-cost-of-carry.
Our approach to modeling futures prices follows Schwartz (1997) and uses allthe available information on the term structure embedded in traded futurescontracts. Schwartz notes that there is a need to extrapolate beyond availablemarket data for pricing commodity contracts, and investigates the use of
518 N.K. Chidambaran et al. / Journal of Financial Economics 60 (2001) 487}528
alternate stochastic processes to model the behavior of commodity futuresprices as a function of interest rates and the convenience yield. He concludes thatboth stochastic interest rates and stochastic convenience yields are relevant forthe pricing of commodity futures. McDonald and Shimko (1998) "nd that theconvenience yield on gold is generally positive in the period 1980}1998, but istime varying. Therefore, we use the implied net-cost-of-carry from the futuresmarket to proxy for the interest rate net of convenience yield, in order to developan empirical pricing model. We then use the model to extrapolate beyond thelongest maturities for which data are available, in our valuation of the deposi-tary shares.
5.2.3. Measuring the relative CERFCX issued its series of silver-denominated depositary shares on July 22,
1994. From Table 7, the dividend yield on these shares is 4.125%. Dividendswere paid quarterly with the "rst dividend of 0.04125 ounces paid on November1, 1994 and the last dividend to be paid on August 1, 2006. The face value isequal to four ounces and is paid in equal annual installments over an eight-yearperiod starting from August 1, 1999 to August 1, 2006. The issue price is fourounces, and the implied real yield is 4.11% compounded quarterly.
We "rst calculate the implied net-cost-of-carry on July 22, 1994 for all tradedsilver futures on NYMEX. To extrapolate beyond available market data, we "ta Vasicek (1977) model to the term structure of the net-cost-of-carry forNYMEX futures. The parameters of the Vasicek term structure model "tted tothese cost-of-carry rates using a modi"ed simplex algorithm are: the speed ofadjustment, a"3.2564; the long-term silver rate, b"0.071; the volatility of theshort rate, b"0.0502; and the instantaneous short-term rate, r"0.00. Weassume that these parameters also apply to the London PM "xing of silverprices. For calculating the swap rate we also need a model for the risk-free rates.We "t the Vasicek model to interest rate data from the Treasury strips market.The parameters of the Vasicek term structure model "tted to these risk-free ratesusing a modi"ed simplex algorithm are: a"0.6709; the long-term rate,b"0.0894; the volatility of the short rate, r"0.0999; and the instantaneousshort-term rate, r"0.0429. Using the above models, the 12-year silver swap ratewith a principal of four ounces and a quarterly payment of 0.04125 ounces is$8.03/ounce.
We next calculate the yield on the embedded risky bond that sets the value ofthe silver CER to zero. We "nd that a yield of 10.56% sets the value ofa silver-denominated depositary share to $21.01 and the silver CER to zero.Comparing with the market rates for July 22, 1994, this yield lies between theprevailing market yields for B1 and B2 rated securities
Using the same methodology as described above to value the components ofthe gold-denominated depositary shares, we calculate the CERs at a yield of10.56%. We "nd that the Gold Series I depositary shares incorporate a CER of
N.K. Chidambaran et al. / Journal of Financial Economics 60 (2001) 487}528 519
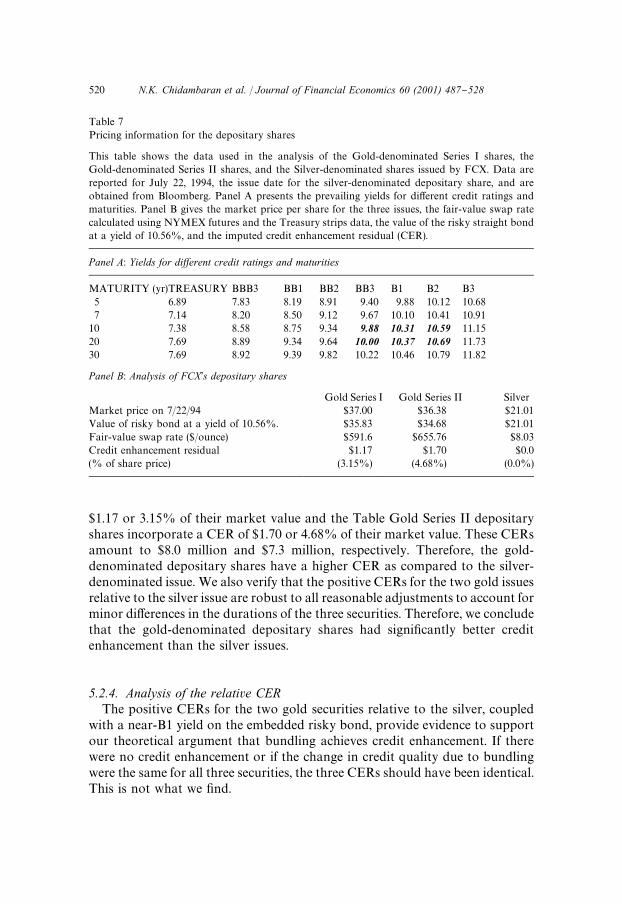
Table 7Pricing information for the depositary shares
This table shows the data used in the analysis of the Gold-denominated Series I shares, theGold-denominated Series II shares, and the Silver-denominated shares issued by FCX. Data arereported for July 22, 1994, the issue date for the silver-denominated depositary share, and areobtained from Bloomberg. Panel A presents the prevailing yields for di!erent credit ratings andmaturities. Panel B gives the market price per share for the three issues, the fair-value swap ratecalculated using NYMEX futures and the Treasury strips data, the value of the risky straight bondat a yield of 10.56%, and the imputed credit enhancement residual (CER).
Panel A: Yields for diwerent credit ratings and maturities
MATURITY (yr)TREASURY BBB3 BB1 BB2 BB3 B1 B2 B35 6.89 7.83 8.19 8.91 9.40 9.88 10.12 10.687 7.14 8.20 8.50 9.12 9.67 10.10 10.41 10.91
10 7.38 8.58 8.75 9.34 9.88 10.31 10.59 11.1520 7.69 8.89 9.34 9.64 10.00 10.37 10.69 11.7330 7.69 8.92 9.39 9.82 10.22 10.46 10.79 11.82
Panel B: Analysis of FCX's depositary shares
Gold Series I Gold Series II SilverMarket price on 7/22/94 $37.00 $36.38 $21.01Value of risky bond at a yield of 10.56%. $35.83 $34.68 $21.01Fair-value swap rate ($/ounce) $591.6 $655.76 $8.03Credit enhancement residual $1.17 $1.70 $0.0(% of share price) (3.15%) (4.68%) (0.0%)
$1.17 or 3.15% of their market value and the Table Gold Series II depositaryshares incorporate a CER of $1.70 or 4.68% of their market value. These CERsamount to $8.0 million and $7.3 million, respectively. Therefore, the gold-denominated depositary shares have a higher CER as compared to the silver-denominated issue. We also verify that the positive CERs for the two gold issuesrelative to the silver issue are robust to all reasonable adjustments to account forminor di!erences in the durations of the three securities. Therefore, we concludethat the gold-denominated depositary shares had signi"cantly better creditenhancement than the silver issues.
5.2.4. Analysis of the relative CERThe positive CERs for the two gold securities relative to the silver, coupled
with a near-B1 yield on the embedded risky bond, provide evidence to supportour theoretical argument that bundling achieves credit enhancement. If therewere no credit enhancement or if the change in credit quality due to bundlingwere the same for all three securities, the three CERs should have been identical.This is not what we "nd.
520 N.K. Chidambaran et al. / Journal of Financial Economics 60 (2001) 487}528

Credit enhancement due to bundling occurs only if there is a signi"cantlypositive correlation between the "rm's revenue stream and the value of thebundled instrument. Since gold accounts for approximately a third of FCX'srevenues, this correlation clearly exists for the two gold securities. Silver isa byproduct of FCX's mining operations, and the correlation between FCX'srevenues and silver prices, although positive, is much lower. FCX's silverreserves are also much lower than its gold reserves. The relative pricing of thethree securities permits us to conclude that the market identi"ed this importantdi!erence for FCX between gold and silver.
From the o!ering prospectus, we "nd that that the fees charged by theinvestment banks to underwrite the depositary shares were about 5% of thetotal amount raised. Although signi"cantly higher than for a bond issue, FCXinformed us that this fee was only marginally higher than the fees quoted tothem for plain-vanilla preferred stock issues, and that the higher fee was paid toinduce a greater marketing e!ort. In any event, this suggests that some of thegains were transferred to the investment banks that successfully put togetherand marketed this "nancially engineered security.
5.3. Announcement ewects
Using the three-factor model for FCX stock price returns (Table 2), we carryout an event study to determine the price impact associated with the gold andsilver issues on FCX common stock. We follow the approach in Ruback (1983)for single-"rm event studies. The "rst gold issue displays a signi"cantly negativeannouncement e!ect, with a two-day abnormal return of !7.57% (t"!2.28);the second gold issue a signi"cantly positive announcement e!ect, with a two-day abnormal return of 6.24% (t"1.96), and the silver issue an insigni"cantannouncement e!ect (two-day abnormal return of !1.82%, t"!0.557).
The di!erential announcement e!ects associated with the second gold issueand the silver issue support our hypothesis that the gold issue was morebene"cial to stockholders than the silver issue. Indeed, the empirical evidencesuggests that there was no signi"cant bene"t to stockholders from the silverissue. While the empirical evidence associated with the "rst gold issue appearsnot to support our hypothesis, this evidence is confounded by a dramatic 6.4%collapse in the gold price on the date of the issue, a move of nearly eightstandard deviations, the largest such move in gold prices in nearly a decade.According to news reports (e.g., Bloomberg, August 5, 1993) this gold pricecollapse was caused by the e!ective dismantling of the European Exchange RateMechanism by allowing most European currencies to trade in a wider band,which di!used tensions in the currency market and caused speculators to moveout of gold positions used to hedge the currency risk. FCX was aware of thesudden plunge in the gold market but could not withdraw the issue withouta signi"cant loss of reputation. They were especially concerned because this was
N.K. Chidambaran et al. / Journal of Financial Economics 60 (2001) 487}528 521

their "rst such issue and they wanted it to be well received. Since the goldprice is the most important driver of FCX's stock price, this extreme volati-lity casts doubt on the validity of our measured announcement e!ect on thisdate.
It is not possible for us to measure announcement e!ects on FCX's debt sincethe bulk of senior debt was bank debt. The only other debt outstanding was thezero coupon exchangeable notes. The bulk of this was redeemed prior to the "rstgold issue and they were completely redeemed prior to the silver issue. Anempirical analysis of other outstanding preferred issues was not possible becausethey were not regularly traded.
As we have noted above, FCX continued to remain under a negative creditwatch for a further four months after the silver issue. FCX debt was upgraded inJuly 1995, one year after the silver issue. Due to the elapsed time, it is notpossible to link this upgrade to the hybrid issues.
5.4. FCX's motives for issuing the gold-denominated depositary shares
The pricing of the gold-denominated depositary shares shows that the creditenhancement was successful. Moreover, the event study provides weak evidencethat FCX shareholders may have also been able to capture some hedgingbene"ts.
FCX management indicated to us in interviews that they believed they weretapping into a market niche by targeting `goldbugsa who were expected to paya premium for gold securities. The low coupon (in gold terms) and minimalrestrictive covenants were considered added bene"ts. Management also felt thatby insulating the "rm from gold price #uctuations through hedging, they couldmake it more transparent to the investment community that FCX was thelow-cost producer in the market.
Whatever management may have believed, our analysis provides a clearjusti"cation for why the gold-linked securities were bene"cial for a "nanciallyconstrained "rm such as FCX, and illustrates the hedging rationale in Mello andParsons (2000). When gold prices are high, FCX's revenues and value are highand the marginal value of liquidity is low. Hence, paying out more on the bondsdoes not create any liquidity constraints that could potentially have detractedfrom the value of the "rm. When the gold prices are low, FCX's revenues andvalue are low and the marginal value of liquidity is high. Hence, the reducedliability on the bonds provided relief when it is most needed.
Credit enhancement was important for FCX as they were "nanciallyconstrained. It is probable that they would not have been able to obtainconventional "nancing on terms even close to those associated with thegold securities. Moreover, for the same reasons, it would have been imposs-ible for them to replicate the gold securities using a conventional derivativesstrategy.
522 N.K. Chidambaran et al. / Journal of Financial Economics 60 (2001) 487}528

5.5. Additional empirical implications
Our theory has additional empirical implications arising from the positiverelationship between the degree of credit enhancement and the degree to whichthe bundled hedge mitigates the "rm's "nancial risk. This can be measured bythe correlation between the value of the indexed security and the value of the"rm's revenue stream. To get signi"cant credit enhancement through debtindexation, this correlation must be signi"cantly positive.
A broader examination of "nancially engineered hybrid securities has thepotential to verify this theory and further clarify their role in risk managementand credit enhancement. In a recent study, Smithson (1998) uses a sample of 159hybrid debt structures and analyzes their impact on equity risk. He "nds weakevidence that hybrid securities do indeed reduce the risk level of the issuing"rms. However, in his study, only 20 issues pertain to risk management in thatthey were issued by "rms whose revenues were exposed to the debt-indexationmeasure.
Our model yields empirical implications that are directly testable. First, thepricing of hybrid securities should be a function of "rm characteristics, especiallyexposure to the measure used to index the value of the security. Controlling forcredit quality, the higher is the correlation between revenues and the value of theindex, the lower is the yield. Second, "rms with a lower credit rating will havea greater reduction in their borrowing costs and manifest a higher propensity touse hybrid structures that combine "nancing and risk management. Examiningthe pricing of hybrid securities in the context of risk management will alsopermit an examination of the alternate hypothesis that higher prices on hybridsare a reward for completing markets.
6. Conclusion
FCX's gold-denominated depositary shares are an excellent example of how"rms can reduce their borrowing costs through "nancial engineering. Bundlingrisk management with "nancing exploits institutional features incorporated incurrent bankruptcy law to credibly enhance the credit quality of the security.
Our contribution is to show that contrary to popular belief, bundling "nanc-ing and risk management through hybrid securities is not identical to "nancingwhile concurrently managing risk by conventional means. This distinction hasimplications beyond the context of this paper. Firms can avoid unintendedwealth transfers by using a bundled hedge within a "nancing instrument. Thenetting e!ects we identify are likely to be widely prevalent, being generallyapplicable whenever a "rm undertakes multiple "nancial transactions with thesame counterparty, either bundled in a single security of the type we haveexamined or undertaken as separate transactions. For example, our "ndings are
N.K. Chidambaran et al. / Journal of Financial Economics 60 (2001) 487}528 523

Table 8
Year Ended December 31
1989 1990 1991 1992 1993(in thousands except per share amounts and ratios)
Income statement data
Revenues $367,886 $434,148 $467,522 $714,315 $925,932Operating income 203,234 204,549 177,720 276,429 154,936Minority interests (17,415) (13,726) (12,199) (13,075) (9,134)Net income (loss)applicable to common stock
98,927 90,179 96,159 122,868 21,862
Net income (loss) per share 0.58 0.52 0.53 0.66 0.11Dividends paid:Per share of common stock 0.56 0.69 0.55 0.60 0.60
Per depositary sharerepresenting:
Special preference stock * * * 0.4910 1.7500Step-up preferred stock * * * * 0.3963Gold-denominated
preferred stock* * * * 0.2805
likely to be relevant for "rms that are considering the issue of #oating-rate debtor foreign currency denominated debt. Such bonds are not always equivalent toissuing "xed-rate debt and entering into an interest rate swap or a "xed-for-"xedcurrency swap. Our "ndings also suggest that providers of subordinated debtare willing to o!er better terms if borrowers agree to simultaneously undertakea hedging transaction with them by indexing the debt.
Crucial to the use of "nancial engineering to achieve credit enhancement arethe di!erences in how obligations of the derivative counterparty are treatedwhen the "rm is in default, especially when the cash #ow on the derivativecontract is correlated with the cash #ow of the "rm. This is likely to dependheavily on the prevailing legal and regulatory environment, as well as oncontractual terms.
While targeted risk management seems to reduce stockholder incentives forunwinding, the challenge of completely eliminating such incentives and therebypreserving the credibility of risk management still remains. This is likely toremain an area of considerable interest to "nancial engineers.
Appendix A
Summary "nancial data for Freeport McMoRan Copper and Gold Inc. forthe "ve years prior to and including 1993, the year in which the gold-de-nominated depositary shares were issued (Table 8).
524 N.K. Chidambaran et al. / Journal of Financial Economics 60 (2001) 487}528

Table 8 (continued )
Year Ended December 31
1989 1990 1991 1992 1993(in thousands except per share amounts and ratios)
Balance sheet data (at end of period)
Net property, plant, andequipment
264,688 502,171 601,675 993,412 1,646,603
Total assets 415,072 676,727 1,157,615 1,694,005 2,116,653Long-term debt (includingcurrent portion andshort-term borrowing)
130,000 294,000 631,961 723,583 260,659
Minority interests 19,632 8,899 14,237 21,449 46,781Gold-denominated preferredstock
232,620
Stockholders' equity 113,759 176,557 172,545 646,457 947,927
Ratio of earnings toxxed charges and minimumdistributions (5)
9.5� 5.6� 3.3X 3.8X 1.4�
Table 9
Shares o!ered bycompany
6,000,000 Depositary Shares representing 300,000 shares of Gold-De-nominated Preferred Stock. Of the Depositary Shares o!ered, 4,500,00shares are being o!ered by U.S. Underwriters and 1,500,000 are beingo!ered by the International Managers. A holder of Depositary Shares isnot entitled to receive the shares of Gold-Denominated Preferred Stockunderlying the Depositary Shares.
Dividends Cumulative cash dividends from the Issue Date, payable quarterly, inan amount equal to the Dollar Equivalent Value of 0.000875 ounces ofgold per Depositary Share per quarter. The "rst quarterly dividend willbe payable on November 1, 1993 and will be based upon the number ofdays the Depositary Shares are outstanding through such date.
Rank The Gold-Denominated Preferred Stock will rank as to payment ofdividends (and distribution upon liquidation) pari passu with theSpecial Preference Stock and the Step-Up Convertible Preferred Stockand senior to the Company's Class A and Class B Common Stock.
Redemption The Depositary Shares will be subject to mandatory redemption, out offunds legally available therefore, on August 1, 2003 at an amount equal
Appendix BThe details of the Gold-denominated Depositary Shares from the O!ering
Prospectus are shown in Table 9.
N.K. Chidambaran et al. / Journal of Financial Economics 60 (2001) 487}528 525

Table 9 (continued )
to the Dollar Equivalent Value of 0.10 ounces of gold per DepositaryShare plus accrued and unpaid dividends. The Depositary Shares willnot be subject to redemption at the option of the company, except thatif on any quarterly dividend payment date the total number of Deposi-tary Shares outstanding shall be less than 15% of the total number ofDepositary Shares outstanding after the o!ering, the Company willhave the right to redeem the Depositary Shares, in whole but not inpart, at an amount equal to the Dollar Equivalent of 0.1 ounces of goldper Depositary Share plus accrued and unpaid dividends to the date"xed for the redemption. The Company will not have the right to makeany mandatory or optional redemption of any Depositary Sharesunless full cumulative dividends for all past dividend periods shall havebeen paid or declared and set aside for payment upon all DepositaryShares and all other outstanding shares of stock of the Companyranking, as to dividends, on a parity with the Depositary Shares.
Reserve coverage o!er If the Company's Reserve Coverage Ratio on any Calculation Date, asshown on a certi"cate prepared by the Company, is below 5.0, theCompany will be required to purchase at a price equal to 0.1 ounces ofgold per depositary shares plus accrued and unpaid dividends, out offunds legally available therefore, the smallest number of DepositaryShares such that, if all such shares had been repurchased on the relevantCalculation Date, the Reserve Coverage Ratio on that date would havebeen greater than or equal to 5.0.
Liquidation rights Each Depositary Share will be entitled to receive, upon dissolution,liquidation, or winding up of the Company, the Dollar EquivalentValue of 0.1 ounces of gold per Depositary Share plus accrued andunpaid Dividends.
The dollar equivalentvalue
The `Dollar Equivalent Valuea of a speci"ed number of ounces of goldmeans the Reference Gold Price multiplied by such number of ounces.
Reference gold price `Reference Gold Pricea means, when used to calculate the amount ofany dividend payable on any quarterly dividend payment date, thearithmetic average of the London PM gold "xing price for an ounce ofgold in the London bullion market on each of the "ve trading daysending on the second trading day prior to the last day of the calendarquarter immediately preceding such payment date. When used tocalculate any other amount payable with respect to the DepositaryShares or to purchase any Depositary Shares on any date, the `Refer-ence Gold Priceameans the arithmetic average of the London PM gold"xing price for an ounce of gold in the London bullion market on eachof the twenty trading days ending on the second trading day prior to (i)in the case of the mandatory redemption of the Depositary Shares,August 1, 2003, (ii) in the case of an o!er to purchase Depositary Sharesdue to a failure to meet the Reserve Coverage Ratio on any CalculationDate, the date of commencement of such Reserve Coverage o!ering, (iii)in the case of any optional redemption of the Depositary Shares, thedate "xed for such redemption, and (iv) in the case of a liquidation
526 N.K. Chidambaran et al. / Journal of Financial Economics 60 (2001) 487}528

Table 9 (continued)
event, the date 30 days prior to the date "xed for the liquidationdistribution.
Listing The Depositary Shares have been approved for listing on the New YorkStock Exchange under the symbol `FCX Pr B,a subject to o$cial noticeof issuance.
Use of proceeds The net proceeds from the sale of the Depositary Shares are expected tobe used in part to reduce borrowing under the PT-FI Credit Agree-ment, thereby increasing the facility's availability for general corporatepurposes, and for general corporate purposes, including continuedexpansion of mining and milling operations.
References
Boot, A., Greenbaum, S., Thakor, A., 1993. Reputation and discretion in "nancial contracting.American Economic Review 83, 1165}1183.
Budd, N., 1983. The future of commodity indexed "nancing. Harvard Business Review 61, 44}50.Foster, W., 1995. Derivatives and bankruptcy: an overview. The Bankers Magazine, May-June, 178
(3), 41}45.Froot, K., Sharfstein, D., Stein, J., 1989. LDC debt: forgiveness, indexation and investment incen-
tives. Journal of Finance 44, 1335}1350.Froot, K., Sharfstein, D., Stein, J., 1993. Risk management: coordinating investment and "nancing
policies. Journal of Finance 48, 1629}1658.McConnell, J., Schlarbaum, G., 1981. Returns, risks and pricing of income bonds, 1956}76 (Does
money have an odor?). Journal of Business 54, 33}63.McDonald, R., Shimko, D., 1998. The convenience yield of gold. Unpublished Working Paper.
Northwestern University, Evanston, IL.Mello, A., Parsons, J., 1995. Maturity structure of a hedge matters: lessons from the Metallgesel-
lschaft debacle. Journal of Applied Corporate Finance 8 (1), 106}120.Mello, A., Parsons, J., 2000. Hedging and liquidity. Review of Financial Studies 13, 127}153.Merton, R., 1990. The "nancial system and economic performance. Journal of Financial Services
Research 4, 263}300.Myers, S., 1977. Determinants of corporate borrowing. Journal of Financial Economics 5, 147}175.Myers, S., Majluf, N., 1984. Corporate "nancing and investment decisions when "rms have
information that investors do not have. Journal of Financial Economics 13, 187}221.Ruback, R., 1983. The Cities Service takeover: a case study. Journal of Finance 38, 319}330.Schwartz, E., 1997. The stochastic behavior of commodity prices: implications for valuation and
hedging. Journal of Finance 52, 923}973.Smith, C., 1986. Investment banking and the capital acquisition process. Journal of Financial
Economics 15, 3}29.Smith, C., Stulz, R., 1985. The determinants of "rms hedging policies. Journal of Financial and
Quantitative Analysis 20, 391}405.Smithson, C., 1998. Questions regarding the use of "nancial price risk management by industrial
corporations. Unpublished Working Paper, CIBC World Markets.Smithson, C., Chew, D., 1998. The use of hybrid debt in managing corporate risk. In: Stern, J., Chew,
D. (Eds.), The Revolution in Corporate Finance. Blackwell, Cambridge MA.
N.K. Chidambaran et al. / Journal of Financial Economics 60 (2001) 487}528 527

Stulz, R., 1990. Managerial discretion and optimal "nancing policies. Journal of FinancialEconomics 26, 3}27.
Tucker, S., 1991. Interest rate swaps and the 1990 amendments to the United States bankruptcycode: a measure of certainty within swap market contracts. Utah Law Review 3, 581}615.
Tufano, P., 1993. American Barrick Resources Corporation: Managing gold price risk. CaseNumber 294}057, Harvard Business School.
Tufano, P., 1996. Who manages risk? An empirical examination of risk management in the goldmining industry. Journal of Finance 51, 1097}1137.
Van Horne, J., 1985. Of "nancial innovation and excesses. Journal of Finance 40, 621}631.Vasicek, O., 1977. An equilibrium characterization of the term structure. Journal of Financial
Economics 5, 177}188.Weiss, L., 1990. Direct costs and violation of priority of claims. Journal of Financial Economics 27,
285}314.
528 N.K. Chidambaran et al. / Journal of Financial Economics 60 (2001) 487}528


![FREEPORT LNG TERMINAL · 2020. 5. 20. · FREEPORT LNG TERMINAL FREEPORT MARINE OPERATIONS MANUAL [04/15/20]2 FREEPORT LNG CONTACT INFORMATION TERMINAL OFFICES Freeport LNG Terminal](https://static.fdocuments.in/doc/165x107/606c9d1603f05e3bdb64da66/freeport-lng-terminal-2020-5-20-freeport-lng-terminal-freeport-marine-operations.jpg)


![FREEPORT LNG TERMINALfreeportlng.com/files/docs/FreeportMarOpsManual2Dock_112818.pdf · freeport lng terminal freeport marine operations manual [10/24/18] 2 freeport lng contact information](https://static.fdocuments.in/doc/165x107/5cd1b81988c993bc268d89de/freeport-lng-freeport-lng-terminal-freeport-marine-operations-manual-102418.jpg)


