Credit and Debt Management and Debt Management – 2008 Survey Research and analysis by the Credit...
176
2008 Credit and Debt Management Survey 2008 Credit Management Research Centre, Leeds University Business School
Transcript of Credit and Debt Management and Debt Management – 2008 Survey Research and analysis by the Credit...

Credit and Debt Management – 2008 Survey
1 Research and analysis by the Credit Management Research Centre, University of Leeds Business School
2008
Credit and Debt Management Survey 2008 Credit Management Research Centre, Leeds University Business School

Credit and Debt Management – 2008 Survey
2 Research and analysis by the Credit Management Research Centre, University of Leeds Business School
CONTENTS
1. Executive Summary
1.1 Consumer and Household Debt 1.2 Commercial Lending and Insolvency 1.3 Debt Collection Agents and Debt Sale 1.4 Survey of DCA’s 1.5 Large Volume Debt Management 2. An Overview of Consumer and Corporate Lending 2.1. Categories of Lending 2.2. Consumer Lending and Indebtedness 2.3. Consumer Credit and Indebtedness 2.3.1. Subjective Evidence 2.3.2 Statistical Evidence 2.4. A Summary of Lending Trends 2.4.1. Secured Lending 2.5 The Over-Indebtedness Debate 2.5.1 Arrears 2.5.2 Trends in Write-offs by Major Lenders 2.6 Personal Insolvency: bankruptcy and Voluntary Arrangements 2.6.1 Bankruptcy Modelling – Key Drivers 2.7 County Court Actions 2.8 Factors Affecting Indebtedness 2.9 Fraud 3. Commercial Lending and Trade Credit 3.1 Business Growth and Insolvency in the UK 3.2 Forecasting Corporate Insolvencies 3.3. Commercial Lending 3.4 Trade Credit 3.4.1 Credit Terms and Credit Management Practice 3.4.2 Motives for the Supply of and Demand for Trade Credit 3.4.3 Credit Management: The Impact on Corporate Performance 3.4.4 The Use of Trade Credit and Payment Behaviour:
The Demand Side Motivation 3.5 Late Payment and Bad Debt 3.6 Late Payment Trends 3.7 Impact of the Late Payment Legislation 3.8 Use of Third Parties in Credit Management 3.8.1 Factoring and Invoice Discounting 3.8.2 Credit Insurance and Related Services 4. Large Volume Debt Management – Case Studies 4.1 Introduction and Objectives 4.2 Background to the Credit Account Life-cycle 4.2.1 Customer Life-Cycle

Credit and Debt Management – 2008 Survey
3 Research and analysis by the Credit Management Research Centre, University of Leeds Business School
4.2.2 Account Life-Cycles 4.3 Elements of ‘Best Practice in Collections’ and Implications 4.3.1 Credit Information and Scoring Technologies 4.3.2 Customer contact and Customer Retention and Collection 4.3.3 Collection department practices
4.3.4 Use of external debt collection agencies for telephone, letter and doorstep contact; litigation
4.3.5 Benchmarking 4.4 Summary 4.5 Short Case Interviews 2007 4.5.1 Collections Department Medium Sized Bank 4.5.2 Commercial Credit Card 4.5.3 Consumer Credit Card 4.5.4 Medium Sized Retail Bank 4.6 Large Volume Collections: Interview Survey 2003 4.6.1 Delinquency Cycles 4.7 Case Studies 2003: large volume collection activities 4.7.1 Case A: Debt Recovery Division of a Major Bank 4.7.2 Case B - Credit Card Provider 4.7.3 Case C: Large Volume Lender Retail Card, Personal Loans 4.7.4 Case D: International Bank Collections and Recovery 4.7.5 Debt Management and Collection in the Utilities Sector 4.7.6 Best Practice in Collections and Recovery: Evidence from US Utilities 4.7.7 Key Performance Indicators Used in Debt Management 4.7.8 Best Practice in Collections and Recovery: The Water Sector 4.7.8.1 Areas of Disadvantage 4.7.9 Credit and Debt Management Practice in the Water Industry 4.7.9.1 General Information 4.7.9.2 Direct billing and other methods 4.7.9.3 Telephone Contact 4.7.9.5 Scoring and Customer Profiling 4.9 Use of Debt Collection Agents 4.9.1 DCA: Case Study 4.10 Debt Sale and Purchase: Trends and Developments 4.10.1 Case Study: Debt Buyer 5. A Survey of Debt Collection Agents and Debt Buyers 5.1 Debt Collection Services 5.2 The Market for Debt Collection Services 5.3 Market Size 5.4 Value and Volumes in the Debt Collection Market 5.5 Quality and Volumes in the Debt Collection Market 5.6 Debt Purchase 5.7 Litigation and Bankruptcy References

Credit and Debt Management – 2008 Survey
4 Research and analysis by the Credit Management Research Centre, University of Leeds Business School
CHARTS AND TABLES
Table 2.1 – Categories of Measurable Lending in the UK (Source:
Keynote Ltd)
Chart 2.3.1.1 – Debt Client Characteristics 2006 (source: Citizens Advice
Bureau Survey 2006)
Chart 2.3.1.2 – Consumer Credit Outstanding (source: Bank of England)
Chart 2.3.1.3 – Consumer Spending Growth (source: Bank of England)
Chart 2.3.1.4 – Total Personal Debt July 2007 (source: Bank of England)
Chart 2.3.1.5 – Total Lending to Individuals Per Month (source: Bank of
England)
Chart 2.3.1.6 – Mortgage Equity Withdrawal 1970-2006 £M (source: Bank
of England)
Chart 2.3.1.7 – Mortgage Equity Withdrawal as a % of Disposable Income
(source: ?????
Chart 2.4.1.1 – Approvals for Secured Lending to Individuals
(thousands) (source: Bank of England 2007)
Chart 2.4.1.2 – 12 Month Growth Rate of Secured Lending Approvals to
Individuals (source: Bank of England 2007)
Chart 2.4.1.3 – Monthly Value of Approvals for Secured Lending to
Individuals (source: Bank of England 2007)
Chart 2.4.1.4 – 12 Month Growth Rate of Value of Approvals for Secured
Lending to Individuals (source: Bank of England 2007)
Chart 2.4.1.5 – Monthly Number of Approvals for Secured Lending to
Individuals (source: Bank of England 2007)
Chart 2.4.1.6 – 12 Month Growth Rate of Number of Approvals for
Secured Lending to Individuals (source: Bank of England 2007)
Chart 2.4.1.7 – Monthly Value of Approvals for Secured Lending to
Individuals (source: Bank of England 2007)
Chart 2.4.1.8 – 12 Month Growth Rate of Value of Approvals for Secured
Lending to Individuals (source: Bank of England 2007)
Chart 2.4.1.9 – Monthly Amount of Total Sterling Secured Gross Lending
to Individuals and Housing Associations (in sterling millions) (source:
Bank of England 2007)
Chart 2.4.1.10– Monthly Amount of Sterling Repayments of Secured
Lending by Individuals (in sterling millions) (source: Bank of England
2007)
Chart 2.4.2.1– Monthly Amount of Total Sterling Unsecured Gross
Lending to Individuals (in sterling millions) (source: Bank of England
2007)
Chart 2.4.2.2– Monthly Amounts Outstanding of Total Sterling Net
Unsecured Lending to Individuals (source: Bank of England 2007)
Chart 2.4.2.3– Monthly Amount of UK Resident Banks’ (inc. Central Bank)
Sterling Credit Card Repayments by Individuals (in sterling millions)
(source: Bank of England
Chart 2.4.2.4– Monthly Amount of UK Resident Banks’ (inc. Central Bank)
Sterling Credit Card Repayments by Individuals/Monthly Amounts
Outstanding of Total Sterling Net Credit Card Lending to Individuals
Chart 2.4.2.5 - End Month Weighted Average Interest Rate, Bank &
Building Societies (source: Bank of England 2007)
Chart 2.5.1 – Debt to Income Ratio (source: ONS and Bank of England
2007)
Chart 2.5.2 – Income Gearing (source: ONS and Datastream 2007)
Chart 2.5.3 – Debt to Wealth Ratio (source: ONS and Bank of England
2007)
Chart 2.5.4 – Credit Card Lending (source: ???
Chart 2.5.5 – Other Unsecured Lending (source: ???
Chart 2.5.6 - SecuredLending (source: ???
Chart 2.5.7 – Ratio of Write offs to Credit Card Lending (source: ???
Chart 2.5.8 – Major UK Banks Annual Write Off Rates (source: Bank of
England 2007
Chart 2.5.9 – Personal Bankruptcies and Individual Voluntary
Arrangements (source: DTI 2007)
Chart 2.5.10 – Personal Bankruptcy Ratio (Source ???)
Chart 2.5.11 – Consumer County Court Judgements 2002-2007 (Source:
Registry Trust)
Chart 2.9.1 – Fraud Trends 1997- 2005 (Source: CIFAS 2007)
Chart 2.9.2 – Fraud Trends 1997- 2005 (Source: CIFAS 2007)
Chart 3.1.1 – Register Size in Great Britain (1992-2006) (Source:
Companies House)
Chart 3.1.2 – Company Birth Rate (2001-2006) (Source: Companies
House)
Chart 3.1.3 – Company Insolvencies (1975-2006) (Source: Companies
House)
Chart 3.1.4 – The Relationship between Insolvencies and the Write-off
Rates of Banks (Source: Bank of England)
Table 3.2 – Variables used to Forecast Insolvencies (Source: CMRC)
Table 3.3.1 – Bank and Building Society Lending to Industrial and
Commercial Companies 1996-2006 (Source: Bank of England)
Chart 3.3.1 – Contributions to Annual Growth Rate from Non Financial
Corporations (Source: ?????)
Chart 3.3.2 – New Leasing and HP Business Finance by Client Size and
Business Investment
(Source: FALA and ONS)
Chart 3.3.3 – Small Business Borrowing and Deposits at Year End (£
Billions) (Source: Bank of England)
Chart 3.3.4 – Changes in Sources of External Finance for SME’s
(Source: ESRC Centre of Business Research)
Chart 3.3.5 – Aggregate Capital Gearing of UK companies
(Source: ONS and Bank calculations)
Chart 3.3.6 – Aggregate Capital Gearing of UK companies
(Source: ONS and Bank calculations)
Chart 3.3.6 –Capital Gearing/Total Debt/Total Assets (Source:
Creditscorer)
Chart 3.3.7 –Income Gearing/Operating Profit (Source: Creditscorer)
Chart 3.3.8 – The Importance of Trade Debtors to the Balance Sheet
(Source: Creditscorer)
Chart 3.3.9 – DSO and Creditor Days Trends (1982-2004)
(Source: Creditscorer)
Chart 3.3.10 – Net Trade Credit Trends
(Source: Creditscorer)
Table 3.4.2.1 – Motivations for Trade Credit Extension (Source: CMRC)
Chart 3.4.4.1 – The Use of Trade Credit and Payment Behaviour – A
Strategy Map
(Source: CMRC)

Credit and Debt Management – 2008 Survey
5 Research and analysis by the Credit Management Research Centre, University of Leeds Business School
Chart 3.6.1 – % of Accounts Paying beyond the Due Date (Source:
CMRC)
Chart 3.6.2 – % of Companies Paying on Time (Source: CMRC)
Chart 3.6.3 – % of Invoices Paid on Time – Sector Analysis (Source:
CMRC)
Chart 3.6.4 – % of Invoices Paid on Time – Sub Sector Analysis for the
Manufacturing Sector (Source: CMRC)
Chart 3.6.5 – Average Debtor Days (Source: CMRC)
Chart 3.6.6 – Payment Beyond the Due Date (Source: CMRC)
Chart 3.6.7 – Debtor Days - Size Analysis
Chart 3.6.8 – Debtor Days - Turnover Analysis
Chart 3.6.9 –Debtor Days – Sector Analysis
Chart 3.6.10 – Debtor Days – Sub Sector Analysis
Chart 3.6.11 –Interest Charged on Overdue Accounts
Chart 3.6.12 – % Firms Affected by Late Payment
Chart 3.6.13–Receivables Beyond 30/90 Days
Chart 3.6.14 – Accounts Beyond 30/90 Days - Sector
Chart 3.6.15 – Accounts Beyond 30/90 Days
Table 3.6.1 – Profile of firms suffering from Bad Debt
Chart 3.6.16– Types of Customer who are Slow Payers
Chart 3.6.17– Assertions about Late Payment
Chart 3.6.18– Possible Policy Measures
Table 3.6.2– % of Companies Pursuing Late Payments through the
Courts
Table 3.6.3– Awareness of the Late Payment Legislation
Chart 3.6.19– Awareness of the Late Payment Legislation
Chart 3.6.20 – Domestic Factoring Trends (Source: FDA)
Chart 3.6.21 – Domestic Invoice Discounting Trends (Source: FDA)
Chart 3.6.22 – Export Factoring and Invoice Discounting (Source: FDA)
Chart 3.6.23 – Firms using Invoice Finance (Source: Bank of England)
Chart 3.6.24 Growth in Demand for Factoring (Source: FDA)
Chart 3.6.25 – Credit Insurance Growth (Source: ICISA)
Chart 3.6.26 – World Market for Credit Insurance (Source: ICISA)
Chart 3.6.27 – Use of Credit Insurance by SME’s (Source: ICISA)
Table 3.6.4 – Reasons for not using Credit Insurance (Source: CMRC)
Table 3.6.5 – Reasons why companies use Credit Insurance (Source:
CMRC)
Table 3.6.28 – Traditional Benefits of Credit Insurance (Source: CMRC)
Chart 4.2.1 – Customer Life-Time Management
Chart 4.2.2 – The Customer Account Life-Cycle
Table 4.2.1 – Account Management Functions (Source: CMRC)
Chart 4.2.3 – Scoring in Account Management
Chart 4.2.4 – Applications to Collections
Chart 4.2.5 – Debt Management and Collection Trends
Chart 4.2.6 – Scoring to Determine Collection Strategies
Chart 4.3.1 – New Debt Management Approaches
Chart 4.3.2 – Motives for Credit Scoring in Consumer Credit
Chart 4.3.3 – Modelling for Collections Strategies
Chart 4.3.4– Behaviour Scoring: Principles
Chart 4.3.5 – Behaviour Scoring
Chart 4.3.6 – Example Behaviour Score Card
Chart 4.3.7 – Behavioural Scoring and the Account Life-cycle
Chart 4.3.2.1 – Champion vs Challenger Strategies in Collection
Chart 4.3.3.1 – Lender Time Horizons
Chart 4.6.1.1 – Delinquency Cycles
Chart 4.7.3.1 – Computer Systems Sued from Application to Collection
Chart 4.7.5.1 – Entire Billing Process (Source SAP Business Intelligence)
Chart 4.7.5.2 – Factors Impacting on Debt in the Utilities Sector
Chart 4.7.6.1 – Revenue to Recovery – Customer Impact
Chart 4.7.8.1 – A Guide to Good Practice
Chart 4.7.8.2 – Number of Customers using Prepayment Meters
Chart 4.7.9.1 – % of Directly Billed Customers
Chart 4.7.9.2 – % of Directly Billed Customers – by size
Chart 4.8.5.1 – A Large Volumes Collections Operation
Chart 4.8.5.2 – A Credit Management Model (1)
Chart 4.8.5.2 – A Credit Management Model (2)
Chart 4.8.5.3 – Recovery Paths and Steps
Chart 4.9.1 – Collections: An Integrated Approach
Chart 4.9.2 – Turnover Trends in UK Debt Collection market
Chart 4.9.3 – Net Worth Trends in UK Debt Collection market
Chart 4.9.1.1 – Example of DCA Collections Process
Chart 4.9.1.2 – DCA Service Optimisation
Table 5.1 Debt Collection And Other Services Offered By Respondents
Chart 5.1 Client Base Trends For The Debt Collection Market
Chart 5.2 Number Of Debts Placed In Market
Chart 5.3 Market Size For Consumer Debt
Chart 5.4 Market Competitiveness For Consumer Debt
Table 5.2 Number Of Debts Worked Per Month – Whole Sample
Table 5.3 Value Of Debts Worked Per Month – Whole Sample
Table 5.4 Number Of Clients And Debts Worked Per Month – Agency
Size Breakdown
Table 5.5 Total Value And Total Number Of Debts Placed – Agency Size
Breakdown
Table 5.6 Sectors For Debt Collection Activities
Table 5.7 Growing And Declining Sectors For Consumer Debt
Table 5.7 Value Of Debts From Largest Client
Chart 5.5 Quality Of Consumer Debt
Chart 5.6 Age Of Consumer Debt
Chart 5.7 Number Of Clients Worked For
Chart 5.8 Debt Purchase Market Growth
Chart 5.9 Growth In Prices Paid In Debt Purchase - 2007
Table 5.8 % Of Purchased Debt Sent For Collection
Table 5.9 % Of Purchased Debt Sent For Collection
Table 5.10 % Of Purchased Debt In Litigation
Table 5.11 % Of Total Debt Referred To Court
Chart 5.10 % Of Agents With Accounts Operating Under An Iva
Table 5.12 Number Of Iva’s Agreed To In Last 12 Months
Table 5.13 Number Of Iva’s Agreed To In Last 3 Years
Table 5.14 Number Of Iva’s Agreed To In Last 3 Years
Table 5.15 Defaults Which Have Been Rescheduled In Last Year
Table 5.15 Number Of Iva’s Agreed To In Last 3 Years
Table 5.16 Bankruptices In The Last Two Years

Credit and Debt Management – 2008 Survey
6 Research and analysis by the Credit Management Research Centre, University of Leeds Business School
1. Executive Summary 1.1 Consumer Lending and Household
Debt
The growth in household debt, both in absolute terms and
The growth in household debt, both in absolute terms and
relative to household income, continues to cause some
concern. As the economic climate changes servicing debt
may become more problematic for a larger proportion of
the UK household sector particularly as mortgage
repayments rise and the opportunities for refinancing and
restructuring current debt decline with the tightening of
lender credit policies. Increases in financial distress and
insolvency in the corporate sector could threaten jobs and
household income in an already fragile economy.
Increases in arrears levels, bad debts and insolvencies
have peaked historically during and/or at the end of
recession due to losses of income. What is particularly
striking about the recent growth in bankruptcy and other
indicators of financial stress is that the trend increase
occurs against a background of generally good macro-
economic and monetary conditions, GDP growth, low
interest rates, high levels of employment and strong asset
prices. The 90’s peak occurred against a backdrop of
economic decline and nominal interest rates in the region
of 13-14% .
The rise in household debt in Britain gained headlines in
2005 when, for the first time, it rose to over £1trillion. By
the first quarter of 2007 the level of outstanding debts was
around £1.4 trillion. This total figure includes secured
lending, the majority of which is first mortgages and
additional ‘equity release’. This amounts to around 80% of
the total consumer lending. Unsecured lending, ‘consumer
credit’, however, has grown rapidly over the past decade
directly related to the growth in the number and type of
credit card products available to consumers. Increased
competition in financial services has fuelled the increase in
available credit products and the degree of product
differentiation. Households owe sums equivalent to 160%
of disposable income.
There are increasing signs that many households are
struggling to service their debts judging by the growth in
the use of private sector and voluntary sector debt
management services. The record levels of personal
bankruptcies as well as the steady rise in the indebtedness
of households, the dramatic increase in the number of fraud
cases, and excessive bad debt losses have prompted the
industry as well as the government to once again examine
the fundamentals of the consumer lending business.
Gauging the extent of the ‘household debt problem’
requires balancing the evidence provided by objective data
from national statistics and the Bank of England with the
vast amount of quasi-subjective information provided by
debt advice groups, lobbyists and surveys of the opinions
of debtors and lenders.
There has been much, often alarming, press and media
coverage that suggests something of a crises in household
finances. These headlines are often fuelled by surveys of
individuals that are in ‘financial difficulty’ and the
apparent increase in debt related problems being reported
to counsellors, debt advice groups, the Citizens Advice
Bureau and varies consumer lobbies.
The increased availability of credit products and the
competition for customers has facilitated a considerable
market for the ‘restructuring of debts’ i.e. moving debts to
lower interest rates (balance transfers) or more typically
extending the time period of the debt with lower monthly

Credit and Debt Management – 2008 Survey
7 Research and analysis by the Credit Management Research Centre, University of Leeds Business School
repayments but, ultimately, at a significantly higher rate
(consolidation loans).
There is considerable evidence of households ‘juggling’
finances via balance transfer, the use of loan consolidation
products, making payments on instalments of secured
credit agreements with unsecured credit (e.g. mortgage
payments with credit card cheques). The Credit Reference
Agency, Experian reported that 8.2 million individuals are
in serious debt; 2.1 million are struggling with repayments;
2.5 million are concerned about their ability to manage
debt and 2 million do not know the extent of their debts.
A notable feature of borrowing in recent periods, since
around 1998, is the extent of mortgage equity withdrawal
as a source of borrowings. This primarily concerns
releasing funds tied up in property for expenditure outside
of the housing market (i.e. not used for house purchase of
home improvements). The considerable growth in property
prices since 2000 has created significant amounts of
‘equity’ relative to initial mortgage. Clearly, households
have been able to finance consumption (and unsecured
debt re-payments) on the back of rising house prices.
The buy-to-let and sub-prime (self-certified) mortgage
market appears to be particularly vulnerable in the UK as
well as the US. The quality of lending in these areas is
suspect. The terms ‘Liar Loans’ and ‘ninanj’ (No Income
No Assets No Job’) are phrases used to describe such
lending in the US press but the quality of sub-prime
mortgage portfolios in the UK is equally a risk to the
housing market
Reported statistics on debt servicing vary considerably and
are, of course, sensitive to the sample selected. Although
the ‘average household’ is spending around 12% of its
disposable income on interest payments if we take only the
‘credit active’ population then, in 2007, households are
spending around 30% of their income servicing debt, up
from around 20% 10 years ago.
The Council for Mortgage Lenders report that the number
of mortgages in short-term arrears rose to 125,100 in June
2007 which was slightly down on the previous year. The
Bank of England’s Financial Stability Report (2007,
October) concludes that arrears will be concentrated in a
small proportion of households with low income/high debt
and that “the number of arrears spanning the majority of
the income and debt distribution is small” but with changes
in interest rates and growth in indebtedness “there is a
growing tail of vulnerable households”
The ratio of write offs-to-amounts outstanding for credit
cards is also increasing steadily with a remarkable peak in
the first quarter of 2002. The secured lending write-offs
show a considerable increase in 2005 and 2006 with a peak
similar to the end of 1999. They have started to decline in
2007.
The levels of personal insolvency as gauged by the number
of bankruptcies and individual voluntary arrangements
show a quite spectacular increase since 2000. The
beginning of this upward trend pre-dates the changes in
bankruptcy law introduced in April 2004 although there is
a clear acceleration in the levels of declared insolvencies
post-2004. The Act appears to have encouraged individuals
on the path to bankruptcy to declare early.
The number of CCj’s against consumers has grown rapidly
since 2004 and reached a ten year high by the end of 2006
with 843,853 judgment orders. The growth has continued
in 2007 with almost 250,000 judgements in Q1 and
therefore the total could reach 1 million judgements by the

Credit and Debt Management – 2008 Survey
8 Research and analysis by the Credit Management Research Centre, University of Leeds Business School
end of the year compared to just over half a million in
2004.
Registry Trust estimates that around 70% of judgements
are ‘credit related’ the remaining 30% being for unpaid tax,
utility bills and motor tax. Interviews with major lenders
found that county court action in order to gain a ‘charge on
the assets’ of a debtor were becoming common practice.
The Credit Industry Fraud Avoidance System (CIFAS)
report an escalation in fraudulent behaviour in the use of
financial products. Recent data released by CIFAS
(October 2007) suggests that fraud trends continue
upwards. Application fraud increased by 23% from 2006-7
with 57,321 detected cases reported to CIFAS and identity
fraud, although slightly down had 57,302 reported cases.
Recent international banking regulations (Basle II
agreement) have drawn much attention to the re-evaluation
of consumer credit risk (default probabilities) and portfolio
risk management. The Basel II rules have given an
impetus to banks to move debt more quickly from their
books to external debt collection agents and debt buyers.
1.2 Commercial Lending and Insolvency
There has been a trend increase in the number of active
companies registered with Companies House. The stock of
active businesses approached 2.3 million in 2006.
According to Companies House the number of new
incorporations has been growing rapidly year on year e.g
43% 2003-6. In total, unincorporated businesses and
SME’s account for a significant proportion of the business
stock. This is estimated to have grown by more than 1.4
million since 1980. The stock of small businesses is
estimated at 3.8 million. SME’s account for 52% of
aggregate business turnover and 56% of private sector
employment according to the SBS.
The number of company insolvencies (compulsory and
creditors’ voluntary liquidations) in the England and Wales
was 3,194 in the last quarter of 2006, nearly half of the
figure that was observed in the third quarter of 1992.
Although the trend fluctuated around 3,500 insolvencies
per quarter between 1995 and 2007, the figures have been
much lower than the levels of the early 1990s’ recession.
The seasonally adjusted figures provided by the Insolvency
Service show 3,032 liquidations in the second quarter of
2007, representing a 4.2% decrease on one year ago.
A forecasting model of aggregate corporate insolvencies
shows that in the long term insolvency rate increases when
income gearing or real CCJ values increase, and when the
employment rate or real money stock decrease. The
Growth in Real Short Term Loans and Business
Confidence are the short-run dynamics of the insolvency
rate. That is, whereas short term increases in the growth in
real short term loans are likely to create short term
increases in the insolvency rate, short term increases in
business confidence are likely to create short term
decreases in the insolvency rate.
The relatively high levels of indebtedness in the corporate
sector coupled with recent interest rate increases and a
decline in business confidence suggest that corporate
insolvencies are set to increase by over 20% in the next 2
years. More recent data derived from an analysis of UK
Company accounts suggests that the ratio of total debts to
total assets has risen quite sharply since 2004.
When we analyse ratios reflecting the ability of firms to
cover their interest repayments on debt we observe a
similar rise since 2004. This suggests that there are a large
number of companies that are not generating sufficient
profit to cover their interest payments. The considerable
growth in private equity-backed leveraged buyouts has

Credit and Debt Management – 2008 Survey
9 Research and analysis by the Credit Management Research Centre, University of Leeds Business School
increased the role of debt in capital structures. It is
estimated that value of investments LBO’s in 2007 was
around £22 bn. Of course, financial distress and insolvency
in the corporate sector threatens jobs and household
income in an already fragile economy.
The late payment of commercial debt as a phenomenon is
enduring. The CMRC Quarterly Review monitors payment
behavior across a sample of 2000 enterprises. Accounts
which pay at or near the due date are currently reported at
54% by sales value. This leaves 46% of all sales accounts
being reported as overdue by our panel of respondents. In
terms of the number of customer accounts, the proportion
of customers paying at or near the due date is slightly
lower. 46% of our survey panel state that customers at an
account level pay on time. This equates to 54% of all
customer accounts currently being paid late. Recent survey
statistics show a deterioration in B2B payment behavior.
This trend is likely to continue since smaller firms rely
increasingly on trade credit when bank credit is restricted.
The Late payment of Commercial Debts (Interest) Act has
had an impact of the extent of outplacement to the DCA
sector. The fact that DCA’s can impose an interest charge
and recover some collection costs has made out-placing
debt more cost effective for the commercial sector and
particularly SME’s. 1.3 Debt Collection Agents and Debt
Sale
A number of trends and industry dynamics have impacted
on the out-placed debt collection and debt purchase sector.
These include: the surge in consumer debt and increase in
the volumes of delinquent debt that have to be processed;
the increased emphasis on cost effectiveness and
performance benchmarking; the continued re-engineering
of centralised in-house collection and recovery functions
and the development of technology and information
systems devoted to account management; the speed of
response of the major lenders in dealing with delinquent
accounts and a shortening of the time period to write-off.
Basel II rules have encouraged the lenders to shift debts off
of their books more quickly and to opt for debt sale rather
than commission-based collection since the former
mechanism transfers ownership of the debt.
The Credit Services Association reported that their member
organisations handle around £15 billion of debt on a
commission basis which consisted of over 20 million
individual cases. This represents a rise of £10 billion since
2000. The CSA membership bought around £6 billion of
debt in 2007 making of total of over £21 billion being
passed to the DCA sector. The CSA estimate that their
market will be worth over £24 billion in 2008.
A source of potential revenue growth for the DC industry
is as a provider of a wider range of out-sourced business
services across the credit life-cycle. Outsourcing
receivables management has increased, particularly for
commercial debt. Government and the public sector are
beginning to utilise the services of DCA’s. The growth in
the internet B2C and B2B has translated into more
collection activity on a global scale.
There has been and continues to be a general trend
amongst the large volume collectors to streamline and
rationalise their use of 'external' collection agents alongside
their 'in-house' collection agents. Debt Collection Agents
have turned to buying debt as an alternative to collection
on commission in 2004 there were over 60 debt buyers
although the DBSG suggests that currently there are
around 40 regular buyers in the market. The growth in the
market has been facilitated by the supply-side.

Credit and Debt Management – 2008 Survey
10 Research and analysis by the Credit Management Research Centre, University of Leeds Business School
In the UK it is difficult to estimate the total size of the debt
sale market since the market continues to evolve quite
rapidly. The market size in 2005/6 was around £6bn face
value selling at an average price of around 8p in the pound.
By 2006/7 this had increased to £7bn and commentators
are expecting the market to peak at around £10bn. Debt
sale is still dominated by ‘distressed debt’ portfolios i.e.
debt that the financial sector would normally write-off
and/or is severely delinquent is sold to the highest bidder
for collection/recovery. It is clear that lenders have
developed an interest in selling younger debt as a means of
improving cash-flow and because of the costs of servicing
the debt collection sector when debt is placed on a
commission basis.
The major lenders and the majority of financial services are
now selling debt and developing specialist departments to
deal with debt sale and respond faster to debt sale
opportunities. The bulk of sales are distressed debt which
can attract only 2-5% of face value but there is evidence of
sellers selling debt earlier, as in the US, typically 90-180
days past due. The changes in accounting rules, Basel II
and resultant changes in internal default definitions and
capital requirements have had an impact on the propensity
of lenders to sell debt. A further development is the sale of
debt that has already been managed to achieve an
‘arrangement to pay’ via a debt management company.
This type of debt can attract 30-40 pence in the pound. The
development of a reseller market is expected to create
further growth in the market.
The main sources of debt sale are credit cards, loan and
overdrafts, retail credit, motor finance and increasingly
mortgage arrears. Further growth in the Debt Purchase
market is likely to come from the sale of non-delinquent
receivables, reselling and from commercial debt.
A problem that is probably hampering the growth of the
debt sale market is that of ‘pricing’. Interviews with major
lenders suggested that there is some lack of ‘trust’ in the
market as a result of extant price variations. If debt is to be
sold at earlier stages and /or segmented by ‘quality’ then
there has to be a mechanism for pricing the individual
debts and the debt portfolio. The development of a ‘broker’
market for debt sale and purchase has provided some uplift
in prices. 1.4 Survey of DCAs In terms of Debt Collection services offered by agencies in
2007 significant differences can be seen since 2003 in
Repossessions (up 25%) and Tracing (down 15%), The
offering of Process Services and Investigations/Status
Reports has declined between the two time periods. The
largest difference between services offered in 2003 and
2007 is in Debt Purchase which is up by 27% among the
sample. 46% of all agencies offer this service in the
marketplace.
The statistics suggest a healthy growth in the market for
debt collection with 75% of agencies indicate that market
size is increasing in 2007. This compares to just 45% in
2003. 99% of agencies believe market competitiveness to
be increasing.
The number of debts worked by agencies each month
across the entire sample has increased dramatically from
between 1,200 in 2003 to 19,000 in 2007. Among the
larger agencies this increase is most significant with
agencies with over 100 employess reporting a rise from
1000 debts per month to 40,000 debts per month. Overall
in the sample, the average value of a debt placed across the

Credit and Debt Management – 2008 Survey
11 Research and analysis by the Credit Management Research Centre, University of Leeds Business School
entire sample has increased from less than £1000 in 2003
to £2400 in 2007.
There appears to be growth in a number of sectors. The
sectors that are generating a faster growth for the out-
placed debt industry are the fixed line telephone sector and
broadband providers. Collections within the retail sector
show the second largest growth among respondents with
85% of collection agents indicating this to be a growing
market. The credit card industry has continued to grow
with 72% of respondents indicating this to be a growth
market.
In 2003 43% of respondents thought that the quality of out-
placed debt was generally worsening. This figure in 2007
is 51% in the sample. 18% of respondents indicated that
the quality of consumer debt was improving.
Over 60% of collection agents generate their business from
under 50 clients and generally collection agents are dealing
with fewer clients than in 2003.
The largest buyer of debt purchased a face value of £458
million compared to just £28 million in 2003. Of the total
debt purchased in 2007 an average of £30 million was
collected during the last year.
In the sample prices paid for debts varied between 5p to
18p in the pound. The average price paid in the pound is 8p
in 2007.
The collection agents were asked if any of their collectable
debts were operating under an Individual Voluntary
Arrangement. 78% of the agencies responding to the
survey had accounts which were linked with an IVA.
The average length of time for an IVA is among the sample
is 4.75 years. Agents also indicated that they expect to
receive 38p in the pound under an IVA and would accept a
minimum of 32p.
In terms of default rates collection agents were asked to
state the the percentage of IVAs which had defaulted over
the last 3 years. The default rate has more than tripled
during the last three years and now stand at 13%.
1.5 Large Volume Debt Management
Organisations faced with large volume debt management
operations are setting up sophisticated customer focused
operations aimed at 'reforming' debtors, if possible, so that
the relationship with them can continue and generate future
profits. This has been partly a response to increased
competition amongst lenders, the emergence of
'consolidation companies' and recognition that changing
life-styles and patterns of work have precipitated periods of
'over-commitment' by debtors which need be managed
longer-term.
The introduction of enterprise wide data sharing has arisen
because of the emphasis being placed on having a
'customer-level' and/or ‘customer-life cycle’ view of each
customer and detailed management information systems.
The expansion of data-sharing closed user groups in the
UK and the development of ‘indebtedness indices’ means
that lenders have access to better information on other
lenders experience of a debtor, and can include this in their
decision making process. The differences in information
costs of in-house and out-placed debt collection are thus
reduced.
Collection cycles have become much shorter in financial
services but opened opportunities for debt buyers. Basel II
rules have resulted in reclassification of debtor portfolios
in financial services with the development of new default

Credit and Debt Management – 2008 Survey
12 Research and analysis by the Credit Management Research Centre, University of Leeds Business School
probability models. Internally lenders have moved to a
‘time-based’ rather than ‘event-based’ view of the debtor
and emphasise re-aging or rescheduling debt away from
collections and back into account management where
possible and transferring ownership of delinquent debt.
The centralisation of collections activity in organizations
has produced an environment in which more sophisticated
decision support systems including statistical and
propensity models, such as behavioural/collection scores,
can be used to formulate the most effective collection
strategies by encapsulating the company's previous
experience of what works for customer segments and
creating variability in collection sequences. A range of
propensity models are employed to score the propensity to
‘self-cure’ (i.e. the customer will pay without being
chased) through to the likelihood of successful litigation.
Champion challenger methodologies coupled with activity-
based costing facilitates the evaluation of collections
effectiveness.
Sophisticated credit management in-house will inevitably
reduce the 'quality' or 'collectibility' of debt that is out-
placed. Many debts passed to debt collectors will already
have been through telephone and letter based collections
procedures, and may even effectively have already been to
one debt collector, if the company has a debt collection
subsidiary. In future it may be that such firms will only
want to make use of a sub-set of the debt collectors service
which they cannot provide for themselves, for example
outsourced services through to door-step collection.
A trend towards using debt sale as an alternative to
commission-based collection and using fewer agents with
closer contact and integrated information systems suggests
that there will continue to be rationalization with
fewer/larger and more sophisticated collection agents/debt
buyers in the future. A increasing role for debt brokers is
expected to increase the scale of the broking market.

Credit and Debt Management – 2008 Survey
13 Research and analysis by the Credit Management Research Centre, University of Leeds Business School
2. An Overview of Consumer and Corporate Lending
In this section, we analyse the main trends in consumer
lending in the UK by examining aggregate time series
statistics. First, we provide a categorisation of the types of
lending activities by the major financial institutions and the
corporate sector.
2.1. Categories of Lending
The following table (2.1) adapted from Key Note Ltd
attempts to list all the categories of lending in the economy
by the source (lender) and ultimate borrower (debtor).
The banks, building societies, finance houses, retailers,
local authorities and insurance companies make various
forms of lending to both commercial and personal
borrowers.
Commercial organisations extend trade credit to their
commercial customers and may make sales on deferred
payment basis or credit accounts to individual households
(e.g. Utilities, Cable TV). These debts are the potential
source of business for the 'out-placed' debt collection
industry.
Lender Class of Lending Debtor(s) Banks & Building Societies Commercial Other financial institutions Commercial Industrial & Commercial Organisations Personal Secured on Dwellings Personal Consumer Credit, including Credit cards Personal Unincorporated and non- Profit-making bodies Finance Houses Personal Secured and unsecured revolving credit Commercial Motor finance Personal Motor finance Retailers and finance houses Personal Retail instalment lending Personal Store and credit cards Personal Mail order credit Local Authorities Personal Various Insurance companies and others Commercial Various Industrial and Commercial Commercial Trade Credit – on invoice Businesses Business to Business Personal Sales on deferred payment (utilities, cable & satellite TV) Source : Adapted from Key Note Ltd
Table 2.1 – Categories of Measurable Lending in the UK (Source: Keynote Ltd)

Credit and Debt Management – 2008 Survey
14 Research and analysis by the Credit Management Research Centre, University of Leeds Business School
2.2. An Overview of Consumer Lending and Indebtedness: Trends
The growth in household debt, both in absolute terms and
relative to household income, continues to cause some
concern. Much of the growth in consumer debt has
occurred within a confident economy with economic
growth, high levels of employment, growing asset prices,
easy access to credit and low interest rates and inflation.
Despite obvious signs of some financial stress within the
household sector most households have managed to service
their debts. The economic climate appears to be changing:
financial markets have highlighted the potential fragility of
some lending portfolios that appear to be riskier than was
anticipated; lenders have tightened credit policies and
borrowers are becoming more cautious; interest rate rises
are impacting on both the household and corporate sector;
confidence in the housing market continues to falter; oil
prices are rising. Servicing debt may become more
problematic for a larger proportion of the UK household
sector particularly as mortgage repayments rise and the
opportunities for refinancing and restructuring current debt
decline with the tightening of lender credit policies.
‘Trading out of trouble’ and’ buying time’ are not going to
be options. Any uncertainties about future income and
property values exacerbates the problem.
It is estimated that consumer credit has been rising by over
to £1 billion per month with total outstanding debt in the
region of £140 billion in 20071
. Households owe sums
equivalent to 160% of income2
. Since 2000, consumer
credit and debt has been the subject of several high profile
government investigations and regulatory initiatives. The
accumulation of household debt, defaults and arrears has
made headlines in the UK and other OECD economies. In
the UK, the “Task Force on Over-indebtedness” has
produced reports that raise many issues relating to lending
practices, risk management, debt management and social
policy. Initiatives and issues relating to Sub-prime lending,
‘Affordable Lending’, The Survey of Low Income Families
and ‘Credit Constraints’ have attracted some prominence
in government. The Competition Commission’s
investigation into the lack of competition in the ‘Home
Credit’ market highlighted asymmetries in available
consumer-level information and the pricing of sub-prime
products. The Data Protection Act raised many issues and
problems for consumer lenders. Recent international
banking regulations (Basle II agreement) have drawn much
attention to the re-evaluation of consumer credit risk
(default probabilities) and portfolio risk management. The
Basel II rules have given an impetus to banks to move debt
more quickly from their books to external debt collection
agents and particularly debt buyers.
At the consumer level, there are increasing signs that many
households are struggling to service their debts judging by
the growth in the use of private sector and voluntary sector
debt management services. The record levels of personal
bankruptcies, as well as the steady rise in the indebtedness
of households, the dramatic increase in the number of fraud
cases, and excessive bad debt losses have prompted the
industry, as well as the government, to once again examine
the fundamentals of the consumer lending business.
Gauging the extent of the ‘household debt problem’
requires balancing the evidence provided by objective data
from national statistics and the Bank of England with the
vast amount of quasi-subjective information provided by
debt advice groups, lobbyists and surveys of the opinions
of debtors and lenders. In the next section we examine the
statistics.

Credit and Debt Management – 2008 Survey
15 Research and analysis by the Credit Management Research Centre, University of Leeds Business School
2.3. Consumer Credit and Indebtedness
The rise in household debt in Britain gained headlines in
2005 when, for the first time, it rose to over £1trillion. By
the first quarter of 2007, the level of outstanding debts was
around £1.4 trillion.3
This total figure includes secured
lending, the majority of which is first mortgages and
additional ‘equity release’. This amounts to around 80% of
the total consumer lending4
. Unsecured lending, or
‘consumer credit’, however, has grown rapidly over the
past decade, directly related to the growth in the number
and type of credit card products available to consumers.
Increased competition in financial services has fuelled the
increase in available credit products and the degree of
product differentiation. Lenders are concerned to cover all
segments of the personal credit market from ‘platinum’ to
‘sub-prime’ with offerings tailored to attract all types of
borrowers and interest rates (APR’s) priced to reflect the
differing risks in each segment. The scramble for market
share has led to a considerable increase in ‘balance
transfer’ activity where consumers are offered low or zero
interest rates for a period of up to 12 months if they
transfer the outstanding balance from one card to a
competitor. Moreover, the increased availability of credit
products and the competition for customers has facilitated
a sizeable market for the ‘restructuring of debts’, i.e.
moving debts to lower interest rates (balance transfers) or
more typically, extending the time period of the debt with
lower monthly repayments but, ultimately, at a
significantly higher rate (consolidation loans).
2.3.1. Survey and Subjective Evidence
There has been much, often alarming, press and media
coverage that suggest something of a crises in household
finances.
These headlines are often fuelled by surveys of individuals
that are in ‘financial difficulty’ and the apparent increase in
debt related problems being reported to counsellors, debt
advice groups, the Citizens Advice Bureau and various
consumer lobbies.
In early 2005, lenders saw a surge in payment arrears,
particularly, but not exclusively, on unsecured lending
products. The Financial Services Authority, in its Financial
Risk Outlook5
, reported that average outstanding balances
on unsecured debt had increased quite substantially for a
large proportion of households. They suggested that around
53% of households had average unsecured debts of £7,065.
The average balance on secured debts was reported as
£67,662 for around 40% of households. There were, at the
time, reported cases where individuals had over £100,000
of outstanding credit card debts set against annual income
levels of around £20,000 and examples of relatively low
income individuals who had large unsecured debts spread
across as many as 20 different credit card lines6
.
A survey by the National Consumer Council7
, in 2007,
concluded that the majority of households are managing to
service their debt commitments. They suggested that 57%
of households have no problems in meeting financial
commitments, that 31% ‘struggle’ from time to time, that
12% have difficulty managing their commitments and that
a subset of 1.6% of households are in serious difficulties.
Converting these figures into numbers of
households/individuals, 3 million are struggling to keep
payments up to date; 1.5 million are falling behind with
payments; and 0.5 million are in serious financial
difficulty, i.e. serious arrears. The trends were of concern.
The NCC suggested that mortgage arrears had increased
4%; repossessions had increased 32%; credit cards arrears
had increased 8.5% from an already high level; and contact

Credit and Debt Management – 2008 Survey
16 Research and analysis by the Credit Management Research Centre, University of Leeds Business School
with advice agencies and debt management plans had
increased by 43% and 48% respectively. A survey in 2006
by the Citizen’s Advice Bureau, “In Too Deep” analysed
567 cases of debtors seeking advice. They suggest that
“debt is a continuing and often debilitating problem for an
increasing number of people, with its effects often felt
most strongly amongst the most vulnerable members of
society”. The CAB report an average increase in household
debt of 30% between 2003 and 2006 with the average
outstanding of over £13000, twice the figure reported by
the FSA. Debts were, on average, 17.5 times the average
monthly income. The majority of individuals in the survey
were young (25-44) and single.
The average household debt reported by Creditaction8
in
November 2007 was £8,681, which rises to £20,189 if only
households with some unsecured debt are included in the
denominator. The average outstanding mortgage was
reported as £98,571.
A recent report suggests the number of house repossessions
have increased 50% in the last year to around 45,0009
. As
borrowers reach the end of fixed interest deals taken out
when interest rates were low, the number of repossessions
could well increase further. New mortgage lending has
fallen rapidly along with activity in the housing market.
Most of the major lenders have reported increases in bad
debts in the period 2005-7. Calls to the National Debt line
have more than doubled since 2005 and stand at more that
300,000 per year. The CAB10
reported that 1.7 million
people sought debt counselling last year; 40% of whom
had credit card and unsecured debt problems. They
reported a 30% rise in cases of individuals struggling to
pay energy bills. There is considerable evidence of
households ‘juggling’ finances via balance transfer, the use
of loan consolidation products, making payments on
instalments of secured credit agreements with unsecured
credit (e.g. mortgage payments with credit card cheques).
Chart 2.3.1.1 – Debt Client Characteristics 2006
(source: Citizens Advice Bureau Survey 2006)

Credit and Debt Management – 2008 Survey
17 Research and analysis by the Credit Management Research Centre, University of Leeds Business School
Attractive refinancing deals are currently harder to find as
lenders tighten credit policy and interest rates rise. The
Credit Reference Agency, Experian11
last month reported
that 8.2 million individuals are in serious debt; 2.1 million
are struggling with repayments; 2.5 million are concerned
about their ability to manage debt; and 2 million do not
know the extent of their debts.
2.3.2 Statistical Evidence
In the UK, the most recent statistics suggest that the value
of consumer credit outstanding on mortgage loans exceeds
£1150bn and around £215bn is outstanding on other forms
of consumer credit (Bank of England, 2007). The trend in
consumer credit (excluding mortgages) has shown a
substantial growth, particularly since 2000. Consumer
credit is defined as borrowing by consumers, i.e. the
household sector excluding sole proprietorships,
partnerships, and non-profit making bodies, to finance
current expenditure on goods and services. Figures from
the Central Statistical Office (on the value of consumer
credit outstanding) suggest over £215 billion outstanding
on forms of consumer credit. These figures exclude credit
where the balance has to be paid off at the end of each
period such as utility bills, but will include balances on
credit cards which are paid off on a monthly basis and
therefore do not, in the strictest sense, represent credit. The
services provided by the utilities, which are often on a
deferred payment basis, represent a sizeable proportion of
total consumer debt.
Chart 2.3.1.2 below shows the strong trend increase year
on year in consumer credit from 1994 to 2007. As the chart
illustrates, the 1980s saw a consumer credit boom; between
1979 and 1989 the volume of consumer credit outstanding
(excluding mortgages) more than doubled, and there was a
similar movement in the amount outstanding on mortgage
loans. Wilson and Summers (1998) suggested various
factors contributed to this, including:
• High inflation in the late 1970s and early 1980s. This
made buying on credit more attractive when compared
with saving for consumer goods, and also had a
negative effect on attitudes to saving which continued
even when inflation dropped;
• The de-regulation of financial markets and controls on
hire purchase;
• The 1986 Financial Services Act in the UK and
similar trends across Europe, which allowed building
societies to compete with banks, and changes in the
regulation of building societies allowing them to get a
higher percentage of funds from sources other than
their members;
• An increase in divorce rates across Europe which has
left more families needing credit to cope financially;
• Government policies encouraging home ownership.
Since 1994, however, the total amount of consumer credit
outstanding (excluding mortgages) has almost quadrupled.
Much of this increase has arisen in the credit and retail card
market. Competition has been fierce in the UK plastic card
market. It has been reported that there are over 1300
different credit cards in the UK (standard, gold, charity,
affinity, co-branded etc) with around 33 card issuers
including the major banks. Estimates suggest that there are
over 75 million credit and debit cards in circulation with
amounts outstanding around £67.25 billion12
. The credit
card market experienced unprecedented levels of
competition largely as a result of new entry by US issuers
that dramatically increased the choice of card rates and
benefits. The trend growth in consumer credit appears to
have slowed in 2007-7.

Credit and Debt Management – 2008 Survey
18 Research and analysis by the Credit Management Research Centre, University of Leeds Business School
The growth in credit outstanding is clearly closely linked to
the level and growth in consumer spending over the time
period. The chart to the right demonstrates the continued
and strong growth in consumer spending in every period
since 1994 and a continued but slowing growth in 2007.
In the context of total consumer borrowing, credit card
debt forms only 4%, with mortgages and personal loans
having the major share.
The chart to the right shows the relative shares of lending
broken down as secured (mortgages) and unsecured (cards and
unsecured loans) over the recent period. Thus, the growth in
debt is associated predominantly with asset accumulation and
house price growth rather than consumer spending.
0
50
100
150
200
250
Consumer Credit Outstanding(excluding mortgages)
‐4%
‐2%
0%
2%
4%
6%
8%
10%
1984
1985
1986
1987
1988
1989
1990
1991
1992
1993
1994
1995
1996
1997
1998
1999
2000
2001
2002
2003
2004
2005
2006
2007
Consum
er Sp
endin
g y‐on‐y
Consumer Spending Growth
Mortages
Credit Cards
Loans etc84%
12%4%
Total Personal Debt – £1.355 bn, July 2007
0
5 000
10 000
15 000
20 000
25 000
30 000
total
secured
consumer
Total Lending to Individuals Per MonthAugust 2005 –August 2007
Totals Outstanding £ 1364742 (100%)secured £ 1150247 ( 84%)consumer £ 214495 ( 16%)
Chart 2.3.1.2 – Consumer Credit Outstanding
(source: Bank of England)
Chart 2.3.1.3 – Consumer Spending Growth
(source: Bank of England)
Chart 2.3.1.4 – Total Personal Debt July 2007
(source: Calculated from Bank of England statistics)
Chart 2.3.1.5 – Total Lending to Individuals Per Month
(source: Bank of England)

Credit and Debt Management – 2008 Survey
19 Research and analysis by the Credit Management Research Centre, University of Leeds Business School
A notable feature borrowing in recent periods, since around
1998, is the extent of mortgage equity withdrawal as a
source of borrowings. This primarily concerns releasing
funds tied up in property for expenditure outside of the
housing market (i.e. not used for house purchase of home
improvements). The considerable growth in property prices
since 2000 has created significant amounts of ‘equity’
relative to initial mortgage. The figures in Chart 2.3.1.6
below examine the total additional amounts borrowed
against properties and the percentage of disposable income
withdrawn against existing equity and reveals a marked
upward trend throughout the period and, after a sharp
decline in 2005, further growth in 2006/7. Clearly,
households have been able to finance consumption (and
unsecured debt re-payments) on the back of rising house
prices during this period.
As a percentage of disposable income Chart 2.3.1.7 shows
a sharp upward trend since 1998, reaching almost 9% by
the end of 2003. The previous high of 7.7% in 1988
coincides with the beginning of the last major UK
recession. The sharp decline in 2005 coincides with a
tightening of credit policy amongst the major lenders as a
result of record high levels of arrears on credit products at
the beginning of 2005. However, the growth in equity
release in relation to income continued to grow in 2006,
reaching 7% at the end of 2006, but has fallen again in
2007 to around 4.5%. This, however, is more likely to be a
supply constraint, as a result of the tightening of lending
terms, rather than a fall in demand.
‐5,000
0
5,000
10,000
15,000
20,000
1970 1988 1998 2003 2006
Mortgage Equity Withdrawal 1970‐2006 £m
‐2.0
0.0
2.0
4.0
6.0
8.0
10.0
Mortgage Equity Withdrawal as a % disposable income
1970 1988 1998 2003 2006
Chart 2.3.1.6 – Mortgage Equity Withdrawal 1970-2006 £M (source: Bank of England)
Chart 2.3.1.7 – Mortgage Equity Withdrawal as a % of Disposable Income (source: Bank of England/ONS)

Credit and Debt Management – 2008 Survey
20 Research and analysis by the Credit Management Research Centre, University of Leeds Business School
2.4. A Summary of Lending Trends
In this section, we report the more recent trends in lending
on secured and unsecured products that are reported by the
Bank of England.
2.4.1. Secured Lending
The latest data showed that the number of total approvals
for secured lending decreased again toward the end of 2007
after recovering from a bottom in January 2007 once again.
However, both the bottom and the top peaks failed to reach
the levels of the recent years up to 2004. This may well be
explained by the increased interest rates in 2004. Number
of UK Resident Banks’ sterling approvals and that of both
Building Societies’ and Other Specialist Lenders’ sterling
approvals have all followed the same trend with the
exception of their growth rates. Further increases in interest
rates coupled with a tightening of lending policies have
taken some effect.
The 12 month growth rates of the number of the total
approvals and UK Resident Banks’ approvals followed
almost the same route as expected from the majority share
of the banks in secured lending. Despite UK resident
banks’ majority and a negative growth rate (-0.5%), in
August 2005, building societies’ and other specialist
lenders’ positive rates (both around 15%) were enough to
make the total rate positive (4%) as well. However, UK
resident banks’ 12 month growth rate is also positive (3%)
in September 2005, which shows an overall rising trend.
However, this stabilized and has shown a steady downward
trend up to July 2007.
050
100150200250300350400450
Jan-
02
Jul-0
2
Jan-
03
Jul-0
3
Jan-
04
Jul-0
4
Jan-
05
Jul-0
5
Jan-
06
Jul-0
6
Jan-
07
Jul-0
7
UK Resident Banks Building Societies Other Specialist Lenders
Chart 2.4.1.1 – Approvals for Secured Lending to
Individuals (thousands) (source: Bank of England 2007)
-1.00000
-0.50000
0.00000
0.50000
1.00000
1.50000
2.00000
Jan-
03
Jul-0
3
Jan-
04
Jul-0
4
Jan-
05
Jul-0
5
Jan-
06
Jul-0
6
Jan-
07
Jul-0
7
Total UK Resident BanksBuilding Societies Other Specialist Lenders
Chart 2.4.1.2 – 12 Month Growth Rate of Secured Lending
Approvals to Individuals (source: Bank of England 2007)

Credit and Debt Management – 2008 Survey
21 Research and analysis by the Credit Management Research Centre, University of Leeds Business School
Similar trends could be observed on the values of
approvals for secured lending, with the other specialist
lenders’ increased share in recent years. Although the level
of numbers was relatively lower in 2005 than it was in
2003 and 2004, the level of values increased through 2006
and 2007 until the last quarter of 2007.
One of the main differences is that although the 12 month
growth rate of UK resident banks for number of approvals
was still negative in August 2005 (-0.5%).
This was the same rate of banks for value of approvals was
well positive even in July 2005 (2.5%) compared to the
negative July growth rates of building societies and other
specialist lenders (-15% and -0.8% respectively). The
growth of specialist lending shows a sharp peak in early
2006 compared to the other lenders since this peak all
trends show a steady decline with the Building Societies
being most pronounced.
0
5000
10000
15000
20000
25000
30000
35000
40000
Jan-
02
Jul-0
2
Jan-
03
Jul-0
3
Jan-
04
Jul-0
4
Jan-
05
Jul-0
5
Jan-
06
Jul-0
6
Jan-
07
Jul-0
7
UK Resident Banks Building Societies Other Specialist Lenders
Chart 2.4.1.3 – Monthly Value of Approvals for Secured
Lending to Individuals (source: Bank of England 2007)
-1
-0.5
0
0.5
1
1.5
2
2.5
Jan-
03
Jul-0
3
Jan-
04
Jul-0
4
Jan-
05
Jul-0
5
Jan-
06
Jul-0
6
Jan-
07
Jul-0
7
Total UK Resident BanksBuilding Societies Other Specialist Lenders
Chart 2.4.1.4 – 12 Month Growth Rate of Value of Approvals for
Secured Lending to Individuals (source: Bank of England 2007)

Credit and Debt Management – 2008 Survey
22 Research and analysis by the Credit Management Research Centre, University of Leeds Business School
Types of Lending
Approvals for House Purchase, Remortgaging and Other
Secured Lending have followed similar trends in recent
years, all having almost equal shares in the pie regarding
the number of approvals (112,000, 112,000 and 83,000
number of approvals in August 2005) that have remained
quite static until the fall in 2007. All types of lending see
the bottom peak in January typically.
In terms of the growth rates, remortgaging and other
secured lending follow nearly the same path unlike the
house purchase one.
However, the growth rates of all three have started to show
alike trends since the middle of 2004. Although all the
three rates had negative values in late 2004 and early 2005,
remortgaging had a relatively higher level. The sharp
upward trend in house purchase in 2006 has been followed
by a decline into negative growth rates in 2007.
0
50
100
150
200
250
300
350
400
450
Jan-
02
Jul-0
2
Jan-
03
Jul-0
3
Jan-
04
Jul-0
4
Jan-
05
Jul-0
5
Jan-
06
Jul-0
6
Jan-
07
Jul-0
7
House Purchase Remortgaging Other Secured Lending
Chart 2.4.1.5 – Monthly Number of Approvals for Secured Lending to
Individuals (source: Bank of England 2007)
-0.6
-0.4
-0.2
0
0.2
0.4
0.6
0.8
Jan-
03
Jul-0
3
Jan-
04
Jul-0
4
Jan-
05
Jul-0
5
Jan-
06
Jul-0
6
Jan-
07
Jul-0
7
House Purchase Remortgaging Other Secured Lending
Chart 2.4.1.6 – 12 Month Growth Rate of Number of Approvals for
Secured Lending to Individuals (source: Bank of England 2007)

Credit and Debt Management – 2008 Survey
23 Research and analysis by the Credit Management Research Centre, University of Leeds Business School
Unlike the similar shares for the number of approvals, a big
difference is apparent for the value of approvals. The share
of other secured lending was only around 8% in August
2005. House purchase and remortgaging had analogous
shares in August 2007, and after peaking in July 2007 a
sharp decline is evident.
Whereas the 12 month growth rates of House Purchase and
Other Secured Lending were negative from July 2004 (the
rate for Other Secured Lending was still negative in August
2005), the growth rate of remortgaging went up to a
positive by the end of 2005. It is also possible to notice
here that the rate of remortgaging did not see the negative
levels of house purchase and other secured lending in late
2004 up to mid 2007.
0
5000
10000
15000
20000
25000
30000
35000
40000
Jan-
02
Jul-0
2
Jan-
03
Jul-0
3
Jan-
04
Jul-0
4
Jan-
05
Jul-0
5
Jan-
06
Jul-0
6
Jan-
07
Jul-0
7
House Purchase Remortgaging Other Secured Lending
Chart 2.4.1.7 – Monthly Value of Approvals for Secured Lending to
Individuals (source: Bank of England 2007)
-0.6
-0.4
-0.2
0
0.2
0.4
0.6
0.8
1
Jan-
03
Jul-0
3
Jan-
04
Jul-0
4
Jan-
05
Jul-0
5
Jan-
06
Jul-0
6
Jan-
07
Jul-0
7
House Purchase Remortgaging Other Secured Lending
Chart 2.4.1.8 – 12 Month Growth Rate of Value of Approvals for
Secured Lending to Individuals (source: Bank of England 2007)

Credit and Debt Management – 2008 Survey
24 Research and analysis by the Credit Management Research Centre, University of Leeds Business School
Gross Lending
The amount of total sterling secured gross lending follows
the trend of value of approvals in a very similar way,
seeing the bottom in January and increasing towards the
summer. Overall, there has been a steady trend increase
since early 2005.
Repayments
In terms of repayments of secured lending, repayments on
redemption, regular repayments, and other lump sum
repayments had alike trends. Repayments on redemption
formed the majority of repayments of secured lending at
around 80% of the total repayments. The amounts have
increased 2 and a half times since 2002.
0
5000
10000
15000
20000
25000
30000
35000
40000
Jan-
02
Jul-0
2
Jan-
03
Jul-0
3
Jan-
04
Jul-0
4
Jan-
05
Jul-0
5
Jan-
06
Jul-0
6
Jan-
07
Jul-0
7
Chart 2.4.1.9 – Monthly Amount of Total Sterling Secured Gross
Lending to Individuals and Housing Associations (in sterling millions)
(source: Bank of England 2007)
0
5000
10000
15000
20000
25000
30000
Jan-
02
Jul-0
2
Jan-
03
Jul-0
3
Jan-
04
Jul-0
4
Jan-
05
Jul-0
5
Jan-
06
Jul-0
6
Jan-
07
Jul-0
7
Chart 2.4.1.10– Monthly Amount of Sterling Repayments of Secured
Lending by Individuals (in sterling millions)
(source: Bank of England 2007)

Credit and Debt Management – 2008 Survey
25 Research and analysis by the Credit Management Research Centre, University of Leeds Business School
2.4.2 Unsecured Lending
Unsecured gross lending trend is likely to move in a zigzag
manner, having the peaks in each December. Whilst credit
card lending has a top peak in December, other consumer
credit lending tends to have a bottom peak. Furthermore,
the level of the bottom peaks of other consumer lending
has an increasing trend unlike the top peaks of credit card
gross lending.
The trend of amounts outstanding of unsecured lending
shows little fluctuation over time. The amounts outstanding
of both credit cards and other consumer credit have
increased steadily except for a short decline in credit cards
in early 2003.
0
5000
10000
15000
20000
25000
Jan-
02
Jul-0
2
Jan-
03
Jul-0
3
Jan-
04
Jul-0
4
Jan-
05
Jul-0
5
Jan-
06
Jul-0
6
Jan-
07
Jul-0
7
0
50000
100000
150000
200000
250000
Jan-
02
Jul-0
2
Jan-
03
Jul-0
3
Jan-
04
Jul-0
4
Jan-
05
Jul-0
5
Jan-
06
Jul-0
6
Jan-
07
Jul-0
7
Chart 2.4.2.1– Monthly Amount of Total Sterling Unsecured Gross Lending
to Individuals (in sterling millions) (source: Bank of England 2007)
Chart 2.4.2.2– Monthly Amounts Outstanding of Total Sterling Net
Unsecured Lending to Individuals (source: Bank of England 2007)

Credit and Debt Management – 2008 Survey
26 Research and analysis by the Credit Management Research Centre, University of Leeds Business School
Despite the apparent zigzag shape, credit card repayments
have a rising trend over time with, however, a lower
growth rate recently.
Repayments-to-Amounts Outstanding ratio has started to
decrease since April 2004 and despite some sharp short ups
and downs it continues to remain quite static.
Both credit card and personal loan interest rates show
similar trends recently, especially in 2005. Both have a
decreasing trend very recently followed by a steady
increase from the start of 2004 to the second quarter of
2005. Regardless of the time, credit card interest rates have
had a slightly higher level than personal loan interest rates
in recent years up until July 2007 where they converged.
0
2000
4000
6000
8000
10000
12000
Jan-
02
Jul-0
2
Jan-
03
Jul-0
3
Jan-
04
Jul-0
4
Jan-
05
Jul-0
5
Jan-
06
Jul-0
6
Jan-
07
Jul-0
7
0
0.05
0.1
0.15
0.2
0.25
Jan-
02
Jul-0
2
Jan-
03
Jul-0
3
Jan-
04
Jul-0
4
Jan-
05
Jul-0
5
Jan-
06
Jul-0
6
Jan-
07
Jul-0
7
0
2
4
6
8
10
12
14
16
18
Jan-
02
Jul-0
2
Jan-
03
Jul-0
3
Jan-
04
Jul-0
4
Jan-
05
Jul-0
5
Jan-
06
Jul-0
6
Jan-
07
Jul-0
7
Credit Card Personal Loans
Chart 2.4.2.3– Monthly Amount of UK Resident Banks’
(inc. Central Bank) Sterling Credit Card Repayments by
Individuals (in sterling millions)
(source: Bank of England 2007)
Chart 2.4.2.4– Monthly Amount of UK Resident Banks’
(inc. Central Bank) Sterling Credit Card Repayments by
Individuals/Monthly Amounts Outstanding of Total
Sterling Net Credit Card Lending to Individuals
(source: Bank of England 2007)
Chart 2.4.2.5 - End Month Weighted Average Interest Rate,
Bank & Building Societies (source: Bank of England 2007)

Credit and Debt Management – 2008 Survey
27 Research and analysis by the Credit Management Research Centre, University of Leeds Business School
2.5. The Over-Indebtedness Debate
Once a borrower reaches the position that they are unable
to meet their debt obligations and scheduled repayments,
i.e. the borrower defaults or falls into ‘arrears’; then they
can be regarded as over-indebted. Most consumer lenders
define ‘default’ as three consecutive missed payments and
‘arrears’ as one or more missed payments on revolving or
fixed term credit accounts. Clearly many borrowers may
miss payments due to some temporary financial difficulty,
but are able to recover the situation and return accounts up
to date and therefore would not be defined as ‘over-
indebted’. On the other hand, some borrowers may be
currently up to date but realise that is not long-term
sustainable and therefore are at risk of being ‘over-
indebted’. Assessing the incidence and extent of over-
indebtedness amongst UK households is, therefore,
problematic.
Households that are ‘in arrears on a structural basis’
eventually default, the extent of which can be estimated by
the numbers of bankruptcies, IVA’s, and to some degree by
the number and values of CCJs and debt write-offs and/or
debts being placed with Debt Collection Agencies and
Debt Buyers. Estimating the number of households ‘at risk’
is far more difficult to determine in the current climate.
Those ‘at risk’ may be conflated with debtors in
‘temporary difficulties’ if we analyse the level of ‘arrears’.
However, the lending market now allows debtors ‘at risk’
to disguise any problems for much longer than in the past
by the ability to continually restructure debts by taking on
products from other lenders or rescheduling their debts
with existing lenders i.e. the balance transfer, ‘arrangement
to pay’ and consolidation loan environment.
Those with a rising property value have also had the option
to re-mortgage and/or ‘equity release’ as a means of
recovering in the short-term. Thus, even though changes in
arrears levels may be a useful proxy for potential over-
indebtedness, it could either seriously under-estimate or
seriously over-estimate the true extent of over-
indebtedness. In the past, the path to default was easier to
track, individuals in arrears soon ran out of refinancing
options. In the recent climate, an individual with serious
debt problems can manage to keep up to date on credit
accounts and show none of the obvious symptoms of
financial distress until the terminal stage. Recent accounts
of up to a million individuals covering mortgage payments
with credit card cheques is perhaps a compelling example
of this (Shelter, October 2007).
In order to assess the household sector’s ability to meet
debt obligations its is important to analyse debt service
ratios, i.e. the funds available to meet monthly interest
payments and debt to income/wealth ratios.
The ratio of household debt to income has risen by 50%
since 200013
and stands at 160% in the first quarter of
2007. The debt to income ratio has been rising steadily
since 1998 with an acceleration in growth rate post 2000.
The recent interest rate rises and the strong growth in debt
levels relative to earnings are likely to further increase the
debt to income ratio.

Credit and Debt Management – 2008 Survey
28 Research and analysis by the Credit Management Research Centre, University of Leeds Business School
The ratio is now close to that in the US economy. A more
important concern, however, is how well the consumer can
service the debt out of current and future cash-flow. In order to
assess the financial fragility of households we need to have a
view of the consumers complete balance sheet position which
takes account of household assets. The latter is more difficult
to proxy.
An indicator of financial health is the share of income
devoted to servicing debt (income gearing). Mortgage debt
service measures have been quite stable since the interest
rate hikes of the late 80’s and have fluctuated around 8-
10% in the period up until 2004 including unsecured debts
the share of income has fluctuated around 20% until more
recent times.
The increase in mortgage debt levels coupled with recent
rises in interest rates has resulted in a sharp increase in the
share of income devoted to servicing debt. Gross interest
payments have increased by more than 2% as a share of
disposable income since 2004. This trend increase is
expected to continue as the impact of larger mortgages and
higher rates feeds through despite the obvious tightening of
credit policy by the lenders. Reported statistics on debt
servicing vary considerably and are, of course, sensitive to
the sample selected. Although the ‘average household’ is
spending around 12% of its disposable income on interest
payments, if we take only the ‘credit active’ population
then, in 2007, households are spending around 30% of their
income servicing debt, up from around 20% 10 years
ago14
.
Chart 2.5.1 – Debt to Income Ratio (source: ONS
and Bank of England 2007)
Chart 2.5.2 – Income Gearing (source: ONS and
Datastream 2007)
Chart 2.5.3 – Debt to Wealth Ratio (source: ONS and
Bank of England 2007)
0%
5%
10%
15%
20%
8 7 8 8 89 9 0 9 1 9 2 9 3 9 4 95 96 9 7 9 8 9 9 00 01 0 2 0 3 0 4 0 5 06 07Repayments as a % of Disposable Income
Incom e G earing
Inte res t o nl y In te re st and mo rta ge rep ayme nts
Source: ON S a nd Datastre am
0 %
2 0 %
4 0 %
6 0 %
8 0 %
1 0 0 %
1 2 0 %
1 4 0 %
1 6 0 %
8 7 8 8 8 9 9 0 9 1 9 2 9 3 9 4 9 5 9 6 9 7 9 8 9 9 0 0 0 1 0 2 0 3 0 4 0 5 0 6 0 7
% of Annual Disposalable Income
D e b t to In c o m e R a t io
S o u rc e O N S a n d B a n k o f E n g la n d
0
1 ,0 0 0
2 ,0 0 0
3 ,0 0 0
4 ,0 0 0
5 ,0 0 0
6 ,0 0 0
7 ,0 0 0
8 ,0 0 0
1979
1980
1981
1982
1983
1984
1985
1986
1987
1988
1989
1990
1991
1992
1993
1994
1995
1996
1997
1998
1999
2000
2001
2002
2003
2004
2005
2006
£ Billion
W e a lth D e b tSo u rce O NS and B ank o f Eng la nd

Credit and Debt Management – 2008 Survey
29 Research and analysis by the Credit Management Research Centre, University of Leeds Business School
Some commentators point to the growth in ‘wealth’
relative to the growth in household debt. Wealth comprises
household assets such as pensions, shares, savings and
property values. The chart shows that the growth in wealth
has outpaced that of debt and the gap between wealth and
debt has increased. Of course, there are problems with such
analysis. Firstly, wealth is something of a ‘will o’ the wisp’
- property prices and share prices can ‘collapse’ and so
with them much of the reported balance sheet wealth.
Secondly, the distribution of debt and wealth across the
population are very different as is the gap between wealth
and debt across the rich-poor the spectrum. A recent study
by the Bank of England (Quarterly Bulletin, 2007 Q1)
reports that older households (55+) have experienced the
greatest net gains in wealth whilst the middle-aged
households (35-54 years) have increased their indebtedness
most over the same period. They suggest that “the
distribution of debt has become more skewed with fewer
households borrowing larger amounts” (p71).
Obviously the middle-age population have a longer
expected future income stream and using the flexibility in
the credit industry can take action to spread current
problems over an extended period and avoid short-term
financial distress. However, this is the same age group that
have the largest outstanding credit card balances and other
unsecured lending products.
2.5.1 Arrears
Arrears levels and trends in arrears are an important
indicator of debt problems and a gauge of the extent of the
shift from temporary difficulties to more structural
problems in debt servicing. Hard statistics on arrears across
the range of financial products are difficult to obtain. The
Council for Mortgage Lenders report that the number of
mortgages in short-term arrears rose to 125,100 in June
2007 which was slightly down on the previous year. The
Bank of England’s Financial Stability Report (2007,
October) attempts to measure the number of households
that are liable to default should economic conditions
worsen. They report a model of household distress that is
disaggregated by age and income. They conclude that
arrears will be concentrated in a small proportion of
households with low income/high debt and that “the
number of arrears spanning the majority of the income and
debt distribution is small” but with changes in interest rates
and growth in indebtedness “there is a growing tail of
vulnerable households” and that the “outlook for the UK
household sector appears to be more uncertain than for
some time”. Moreover, the Bank of England Quarterly
review (2007 Q1) warn that “larger shocks than seen
recently, particularly shocks impacting on interest rates,
income or employment, could cause adverse interactions
between debt, house prices and consumption” (p76).
2.5.2 Trends in Write-offs by Major Lenders
Whereas secured lending write-offs decreased from 2000
to 2004, unsecured lending write-offs, both credit cards
and other unsecured lending, have kept rising steadily since
2000 accelerating from 2003 up until summer 2007.
Together with a lower level of credit card repayments and
an increasing trend in amounts outstanding of unsecured
lending, the steady increase in unsecured lending write-offs
may be the sign of a lowered credit quality level in the
unsecured lending industry. The ratio of write offs-to-
amounts outstanding for credit cards is also increasing
steadily with a remarkable peak in the first quarter of 2002.
The secured lending write-offs show a considerable
increase in 2005 and 2006 with a peak similar to the end of
1999. They have started to decline in 2007.

Credit and Debt Management – 2008 Survey
30 Research and analysis by the Credit Management Research Centre, University of Leeds Business School
Credit Card Lending…
Chart 2.5.4 – Credit Card Lending
(source: Bank of England)
Other Unsecured Lending…
Chart 2.5.5 – Other Unsecured Lending
(source: (source: Bank of England)
Secured Lending…
Chart 2.5.6 - SecuredLending
(source: (source: Bank of England)
The ratio of write-offs to credit card lending peaked in
January 2002 as a result of a considerable increase in
arrears in 2001. Since 2003 the trend has been sharply
upwards until summer 2007.
Ratio: (An Example)
Quarterly Amount of UK Resident Banks’ Sterling Write-offs of Credit Card
Lending to Individuals / Quarterly mounts Outstanding of Total Sterling Net
Credit Card Lending Individuals
Chart 2.5.7 – Ratio of Write offs to Credit Card
Lending (source: ???
0
100
200
300
400
500
600
700
800
900
1000
Dec
-99
Jun-
00
Dec
-00
Jun-
01
Dec
-01
Jun-
02
Dec
-02
Jun-
03
Dec
-03
Jun-
04
Dec
-04
Jun-
05
Dec
-05
Jun-
06
Dec
-06
Jun-
07
0
200
400
600
800
1000
1200
1400
1600
1800
Dec
-99
Jun-
00
Dec
-00
Jun-
01
Dec
-01
Jun-
02
Dec
-02
Jun-
03
Dec
-03
Jun-
04
Dec
-04
Jun-
05
Dec
-05
Jun-
06
Dec
-06
Jun-
07
0
10
20
30
40
50
60
70
Dec
-99
Jun-
00
Dec
-00
Jun-
01
Dec
-01
Jun-
02
Dec
-02
Jun-
03
Dec
-03
Jun-
04
Dec
-04
Jun-
05
Dec
-05
Jun-
06
Dec
-06
Jun-
07
0
0.002
0.004
0.006
0.008
0.01
0.012
0.014
0.016
0.018
Dec
-99
Jun-
00
Dec
-00
Jun-
01
Dec
-01
Jun-
02
Dec
-02
Jun-
03
Dec
-03
Jun-
04
Dec
-04
Jun-
05
Dec
-05
Jun-
06
Dec
-06
Jun-
07

Credit and Debt Management – 2008 Survey
31 Research and analysis by the Credit Management Research Centre, University of Leeds Business School
2.6 Personal Insolvency: Bankruptcy and Voluntary Arrangements
The levels of personal insolvency as gauged by the number
of bankruptcies and individual voluntary arrangements
show a quite spectacular increase since 2000. The
beginning of this upward trend pre-dates the changes in
bankruptcy law introduced in April 2004, although there is
a clear acceleration in the levels of declared insolvencies
post-2004. The Act appears to have encouraged individuals
on the path to bankruptcy to declare early.
The legislation changes allow individuals in serious
financial difficulty to be discharged from bankruptcy after
a maximum of one year as opposed to 3 years under the old
rules. Although the legal changes make the bankruptcy
option more attractive, the bankruptcy trend is more likely
symptomatic of a tremendous increase in the number of
individuals facing severe financial difficulty. The level of
personal insolvency appears to have peaked at the end of
2006 and was at a level almost 3 times higher than the
previous peak in the early 90’s recession.
Chart 2.5.8 – Major UK Banks Annual Write Off Rates
(source: Bank of England 2007
Chart 2.5.9 – Personal Bankruptcies and Individual
Voluntary Arrangements (source: DTI 2007)

Credit and Debt Management – 2008 Survey
32 Research and analysis by the Credit Management Research Centre, University of Leeds Business School
What is particularly striking about the growth in
bankruptcy is that the trend increase occurs against a
background of generally good macro-economic and
monetary conditions, GDP growth, low interest rates, high
levels of employment and strong asset prices. The 90s’
peak occurred against a backdrop of economic decline and
nominal interest rates in the region of 13-14%.
Some commentators argue that the insolvency levels are
still relatively low in relation to the number of individuals
in debt and therefore are not indicative of a general
increase in household financial stress. The personal
bankruptcy ratio, bankruptcy filings per 10000 adults
(source: Insolvency Service and ONS), rose from 0.30 in
1970 to 3.86 in 2005 and is estimated to have reached 4 in
2006.
2.6.1. Bankruptcy Modelling – Key Drivers
The CMRC has produced a model of personal bankruptcy
rates in an attempt to determine the key drivers of
bankruptcy. The purpose is to model variations in personal
bankruptcy in relation to other macro-economic and credit
related statistics.
It is clear that personal bankruptcies, household
indebtedness, and consumer credit are highly interrelated.
Furthermore, it is suggested that the evolution of personal
bankruptcies and laws related to them have been
influenced considerably by the consumer credit expansion.
Although there are some conflicting arguments regarding
why bankruptcies have increased steadily and reached to
record levels, the main reasons are generally cited as the
increased credit availability, decreased credit quality in the
industry, decreased default costs (fall in “social stigma” or
in “legal costs”), changes in regulations and laws, and
macroeconomic shocks.
The data used in our study are described briefly below:
The personal bankruptcy ratio is calculated as the number
of individual insolvencies divided by the adult population.
The insolvency data is gathered from the Insolvency
Service as the number of individual insolvencies in
England and Wales on a seasonally unadjusted and
quarterly basis from 1960 to 2006. The quarterly
population data for the UK is collected from the Office for
National Statistics as the population aged over 16 (ONS
Chart 2.5.10 – Personal Bankruptcy Ratio (Source ???)

Credit and Debt Management – 2008 Survey
33 Research and analysis by the Credit Management Research Centre, University of Leeds Business School
code: MGSL). The England and Wales quarterly adult
population is then calculated from the population estimates
gathered from the General Register Office for Scotland and
Northern Ireland Statistics and Research Agency.
Debt-to-income ratio, an indicator of the household
indebtedness level, is calculated as the total household
liabilities (ONS code: NNPP) divided by the real
households’ disposable income (ONS code: NRJR) with
the ONS data on a quarterly basis from 1987 to 2006.
Quarterly values of Real Households’ Disposable Income
are multiplied by 4 to match the nature of the liability
values. Capital Gearing, a factor that shows the level of
indebtedness relative to household wealth, is calculated as
the ratio of total household liabilities (ONS code: NNPP)
divided by total household financial assets (ONS code:
NNML).
Amounts Outstanding of Net Lending to Individuals, an
indicator of the trend in the consumer credit volume, is
reported both for each lender type and for each type of
lending. The Bank of England data contains information
about UK Resident Banks’, Building Societies’, other
specialist lenders’, retailers’, and other lenders’ lending as
well as secured and unsecured lending in total over time.
However, the data do not inform about the proportion of
secured or unsecured lending for each type of lender.
Write-off Ratio, an indicator of the default behaviour over
time, is calculated as the Amount of Write-offs of Lending
to Individuals divided by the Amounts Outstanding of Net
Lending to Individuals using Bank of England data on a
quarterly basis. The data includes only UK Resident
Banks’ write-off amounts for secured and unsecured
lending. However, amounts outstanding of UK Resident
Banks’ secured or unsecured lending is not available
separately. Therefore, although it is more desired to use the
unsecured lending write-off ratio, such an application is not
possible with the data available. Hence, the ratio calculated
here is the UK Residents’ Banks’ write-off ratio in total
including both secured and unsecured lending due to the
data limitation.
ILO Unemployment Rate for England (ONS code: YCZG)
is selected to represent Unemployment, a proxy of
economic discomfort and financial strain for households.
Since the ILO rate is calculated for the economically active
resident population, it may also be more representative for
the economic shocks for households.
Data for Interest Rates, which could be stated as the cost of
credit, is collected as Treasury Bill interest rates given that,
as widely argued, economic conditions as well as the
inflation may have an effect on Treasury Bill Interest
Rates. Data for Quarterly average rate of discount of 3
mount Treasury Bills is gathered from Bank of England on
a quarterly basis from 1975 to 2006.
Data for Household Savings, which would help to deal
with income shocks, is gathered from the ONS as the
Households’ Saving Ratio (ONS code: NRJS) on a
quarterly basis from 1963 to 2006. Self-employment is
calculated with a ratio as the number of self-employed
divided by the adult population. Data for the number of
self-employed is gathered from the ONS (ONS code:
MGRQ) for the UK and the UK adult population is used to
calculate the ratio accordingly.
Retail Prices Index (RPI), one of the main measures of
inflation, is used as an indicator of the changes in the cost

Credit and Debt Management – 2008 Survey
34 Research and analysis by the Credit Management Research Centre, University of Leeds Business School
of living that may have an effect on households. The RPI
data is collected from the ONS as the RPIX (ONS code:
CHMK) which is the retail prices index excluding
mortgage interest payments to minimise the impact of the
interest rate changes.
Consumer Confidence, a factor that may affect bankruptcy
decisions as public’s confidence in the economy, is
represented with Retail Sales Index (RSI) in terms of
volume with constant prices for predominantly non-food
stores (ONS code: EAGX). Consumer spending, which is
one of the main economic drivers of the whole economy, is
generally cited to be affected by consumers’ confidence in
the economy. Another general view is that when consumer
confidence falls, it is more likely to see a drop in spending
on comfort or durable products than in spending on food.
Income Gearing, an indicator of the affordability of debt, is
considered as both mortgage and total income gearing.
Total Income Gearing, which is related to the total cost of
servicing household debt, is calculated as the ratio of
household interest payments (ONS code: QWMG) to real
households’ disposable income (ONS code: NRJR) on a
quarterly basis. Mortgage Income Gearing is calculated as
mortgage average interest rate (ONS code: AJNL)
multiplied by amounts outstanding of total secured net
lending (Bank of England data) and divided by real
households’ disposable income (ONS code: NRJR).
The series are modelled using a dynamic time-series
methodology which attempts to identify and model those
factors that form a long term relationship with personal
bankruptcy rates with those that affect bankruptcy rate in
terms of short-run dynamics. The debt-to-income ratio and
the indebtedness level of households, emerge as the key
long-term determinants of personal bankruptcies in the
sample period. The econometric model suggests that other
than the debt-to-income ratio, the growth rate of the write-
off ratio and consumer confidence have significant short-
run effects on personal bankruptcies. Although the study
does not find unemployment or inflation significant in the
equation, they still may have an impact on bankruptcies.
The reason of insignificance may be the relatively stable
nature and low levels of such factors in the sample period.
The results of this study need to be interpreted according to
the sample period. The write-off ratio only has a short-run
impact on personal bankruptcies in the sample period. The
ratio used in this research is a general ratio of all lending
types. However, unsecured lending write-off ratio may still
form a long term relationship with personal bankruptcies.
The research is unable to explain a relatively sharper
increase in personal bankruptcies between 2004 and 2006
other than suggesting that the new bankruptcy law is
largely responsible for this increase.
2.7. County Court Actions to Recover Debt
Previous research by CMRC (Debt Survey 2004) indicated
that the use of court action, by the major lenders and credit
card providers, to recover debt from consumers in default
had generally been in decline. In recent interviews with
lenders, however, it is clear that the use of various forms of
court action to secure and recover outstanding debt have
been increasing again. Indeed the Registry Trust recently
commented that, “lenders are increasingly using the court
route to deal with unsecured debts. A judgement opens the
way to further action such as a charging order “(RT Press
Release, October 2007).

Credit and Debt Management – 2008 Survey
35 Research and analysis by the Credit Management Research Centre, University of Leeds Business School
The number of CCJ’s against consumers has grown rapidly
since 2004 and reached a ten year high by the end of 2006
with 843,853 judgment orders. The growth has continued in
2007 with almost 250,000 judgements in Q1 and therefore the
total could reach 1 million judgements by the end of the year
compared to just over half a million in 2004. Registry Trust
estimates that around 70% of judgements are ‘credit related’
the remaining 30% being for unpaid tax, utility bills and motor
tax. Interviews with major lenders found that county court
action in order to gain a ‘charge on the assets’ of a debtor were
becoming common practice.
2.8 Factors Affecting Indebtedness
This section provides some background on trends in consumer
indebtedness and the recent response of collections and
recovery departments. A key point is that consumer
indebtedness has increased substantially in the last 5 years and
households typically have debts spread across multiple
creditors. There are signs of an increasingly fragility in the
economy with a larger proportions of households on the
interface between ‘struggling’ with payments and being in
more serious ‘financial difficulty’.
Households in financial difficulty will typically have a
‘pecking order’ of creditors and are likely to pay those whose
service they value most, those who have most
sanctions/threats and/or those with the most sophisticated and
proactive collections activities.
There are a number of reasons put forward to explain why
accounts become delinquent i.e. the borrower defaults on
payments. Most have always been cited as factors
precipitating financial difficulty. For example, changes in
work circumstances and unemployment or problems with self-
employment; changes in family circumstances such as marital
break-up, separation and divorce or illness and bereavement;
suspicious circumstances such as suspected fraud. Clearly
some of the factors might be interrelated. For instance,
unemployment may place strain on marriages and precipitate
indebtedness. More recently, factors such as over-commitment
and spending sprees have been cited as reasons for advanced
arrears and indebtedness. The latter, in practice, may be
difficult to define. It may be treated as 'quasi-fraud' or
'malicious spending' rather than financial mismanagement.
Understanding the customer's psyche and the difference
between those who are 'free and easy' with spending and those
who are slightly over-committed but 'in control' is important
but not trivial. Understanding the reasons for over-committed
customers is a particularly important for those working at the
Chart 2.5.11 – Consumer County Court Judgements 2002-2007
(Source: Registry Trust)

Credit and Debt Management – 2008 Survey
36 Research and analysis by the Credit Management Research Centre, University of Leeds Business School
sharp end, such as collections agencies that have to develop
collections strategies to deal with this type of customer. From
our interviews with lenders, we can draw the following
general conclusions regarding credit and indebtedness:
• Consumers have found it easier to get credit as
lenders competed for business; even when their
credit worthiness has been highlighted as a problem;
More recently credit policies across both secured
and unsecured lending has considerably tightened
(in the last 2 years) making credit access more
difficult for customers with high levels of debt and
‘restructuring opportunities’ less likely;
• Consumers are likely have more debt and more
unsecured debt as the average outstanding balance
of the credit active household has increased;
• Consumers are more likely to have multiple debts
spread across different lenders; the average value of
outstanding unsecured debt of households that are in
difficulties is estimated as between £20,000 to
£40,000 and spread across multiple creditors;
• Personal finance (e.g. loans; consolidation loans)
now tend to have longer repayment periods
compared to a few years ago and higher interest
rates;
• Lenders are more willing to restructure debt over
longer periods and ‘re-age’ current balances;
• There has been a significant increase in Home
Equity Finance as a means of consolidating
debt;
• There has been a significant increase in lending and
products aimed at the sub-prime market, particularly
sub-prime and buy-to-let mortgages;
• Lenders are beginning to use litigation via the
county court system to obtain ‘charges on assets’;
• Borrowers are increasingly using debt management
and IVAs as a route out of debt.
A common finding from our study of large volume collection
activities was that customers would often find themselves in
financial difficulty and arrears on consumer debt due to 'over-
commitment' i.e. too many debt repayments in relation to
current levels of income. Recent survey evidence suggests that
over-commitment continues to be cited as the major reason for
payment difficulties. Increasingly, however, the borrower
treats the matter with less concern, less urgency and feels less
‘stigma’ about the problem. Because a consumer's
indebtedness is a function of total consumer debt outstanding
it will span all types of credit across many possible lenders.
The practice of spreading debts across a wide range of
products and lenders obviously makes it very difficult for an
individual lender to assess the customer's 'ability to pay' and
the likelihood that they will service the debt.
Increasingly consumers in financial difficulties are applying
for finance without revealing their complete financial position.
The lender is only likely to discover the true position when
repayment difficulties become apparent. Thus information on
over-committed customers, often only comes to light once the
debtor is in an advanced state of arrears and in the collections
system. The Credit Reference Agency, Experian, has recently
launched a new product that attempts to assess the total level
of indebtedness of individual borrowers (Indebtedness Index).
The trend in consumer indebtedness has led to charges of
irresponsible lending on behalf of the lenders and has seen an
escalation in the use of debt consolidation services and 'advice'
organisations. These trends have implications for the debt
collection industry. The large volume lenders that were
recently interviewed expressed some concern that indebted
customers are more likely to use fee-paying advisors and
consolidation companies to manage their debts rather than
confront the situation themselves. Some general conclusions
were observed:

Credit and Debt Management – 2008 Survey
37 Research and analysis by the Credit Management Research Centre, University of Leeds Business School
• Indebted customers are more likely to pay fee
paying advisors in order to avoid confronting the
problem with individual lenders;
• Indebted customers go earlier to advisors;
• They are likely to turn down or avoid free advice
from their creditor/lender;
• There is a trend increase in the number of consumers
using bankruptcy and Individual Voluntary
Arrangements (IVAs) in order to deal with creditors
(Trust Deeds in Scotland);
• The major lenders are beginning to resist IVAs.
Over-commitment may stem from a number of causes, clearly
changes in levels of income e.g. due to unemployment or
divorce may leave a customer unable to meet commitments
that were arranged on the basis of higher levels of expected
income. It may, however, be a function of the mismanagement
of personal finances or rash spending sprees. These latter two
are the most likely reasons for over-commitment i.e. general
indebtedness where the consumer takes on too much debt in
relation to income and spending sprees where injudicious
spending begins to cause mounting problems in servicing
current debts.
The government and regulators have taken an interest in
promoting both ‘responsible lending’ and ‘responsible
borrowing’ in order to mitigate potential debt problems. The
lender-borrower relationship has often been blighted by
problems of incomplete and ‘asymmetric information’. The
lenders require a complete picture of the borrowers income
and asset position in order to be able to assess risk and
appraise credit worthiness. The information provided by
Credit Reference Agencies has provided a incomplete picture
of the potential debtors profile since only recently have some
of the major banks (HSBC, NatWest) agreed to share
information via the CRAs. Recent work by the CRAs to build
‘indebtedness indices’ which profile the customers
debt/income position should be helpful for future lending
decisions but have not been available in the past. The sharing
of positive credit data is another welcome development for
lenders and collection departments.
Recent changes to the Consumer Credit Act and other
government interventions have attempted to improve the
information provided by lenders, particularly transparency on
quoted APR’s, bank and late payment charges and redemption
penalties. The Consumer Credit Bill aimed to create more
competition and protection for consumers. The growth in
payment protection products and other safety-nets should
reduce the impact of ‘changes in circumstance’ on vulnerable
groups.

Credit and Debt Management – 2008 Survey
38 Research and analysis by the Credit Management Research Centre, University of Leeds Business School
2.9 Fraud
The Credit Industry Fraud Avoidance System (CIFAS) report
an escalation in fraudulent behaviour in the use of financial
products. Recent data released by CIFAS (October 2007)
suggests that fraud trends continue upwards. Application fraud
increased by 23% from 2006-7 with 57,321 detected cases
reported to CIFAS and identity fraud, although slightly down
had 57,302 reported cases.
Chart 2.9.1 – Fraud Trends 1997- 2005 (Source: CIFAS 2007)
CIFAS Case TypeJanuary to Sept
2006
January to Sept
2007
% Change
Asset Conversion relates to the sale of assets subject to a credit agreement where the lender retained ownership of the asset, for example a car or a lorry.
Misuse of Facility is where an account, policy or other facility is obtained for fraudulent purposes or the fraudulent misuse of a facility.
Identity Fraud cases include cases of false identity, identity theft, account takeover and other impersonation situations.
Application Fraud/False Insurance Claim relate to applications or claims which include lies or false supporting documentation where the name has not been identified as false.
Facility Takeover Fraud occurs where a person (the 'Facility Hijacker') unlawfully obtains access to details of an existing account holder or policy holder or an account or policy of a genuine customer or policy holder (the 'victim of takeover') and fraudulently operates the account or policy for his benefit or the benefit of another authorised person.
Misuse of Facility 16,774 16,841 0.40%
False Insurance Claim 281 306 8.90%
Facility Takeover Fraud 3,625 4,844 33.63%
Asset Conversion 285 352 23.51%
Identity fraud 58,050 57,302 -1.29%
Application Fraud 46,468 57,321 23.36%
CIFAS Category 1997 1998 1999 2000 2001 2002 2003 2004 2005
Category 1 - False Identity 2,231 1,902 2,189 12,310 27,270 42,029 57,669 69,512 80,894 Category 2 - Victim of Impersonation 17,847 16,810 18,075 22,539 26,266 32,737 43,094 50,455 56,200 Category 3 - Application Fraud Facility Granted 15,338 15,348 11,531 13,524 13,213 18,354 18,893 19,865 22,466 Category 4 - Application Fraud Facility Refused 54,284 60,710 66,006 86,077 123,606 146,431 152,070 162,911 153,290 Category 5 - Conversion* 1,180 1,238 775 751 800 662 832 875 1,140 Category 6 - First Party Fraud 13,343 13,014 17,608 21,867 30,507 36,453 36,526 41,588 41,313 Category 7 - Aiding & Abetting** 0 0 0 6 24 37 12 27 47 Category 8 - Insurance Claims Fraud** 0 0 0 10 144 993 960 802 488 Total 104,223 109,022 116,184 157,084 221,830 277,696 310,056 346,035 355,838
% Change over previous year - 4.60% 7.15% 35.20% 40.46% 25.18% 11.65% 11.60% 2.80%
% Change since 1997 - 4.60% 12.08% 51.53% 112.84% 166.44% 197.49% 232.01% 241.41%
*Sale of assets subject to a credit agreement where the lender retained title to the asset. **Category introduced in the year 2000
Chart 2.9.2 – Fraud Trends 1997- 2005 (Source: CIFAS 2007)

Credit and Debt Management – 2008 Survey
39 Research and analysis by the Credit Management Research Centre, University of Leeds Business School
3. Commercial Lending and Trade Credit
All organisations that are involved in any form of lending
to the commercial sector, corporate and small businesses,
are a potential source of business for the commercial debt
collection, debt purchase and outsourced credit
management services industry. This lending includes all
manner of bank products from overdraft to loans, factoring
and asset-based finance and commercial mortgages all of
which may be subject to default/payment arrears. Indeed
since 1999, the net indebtedness of the corporate sector,
measured by gearing ratios, has shown a marked increase
and remains at an historically high level. Moreover, all
business and organisations involved in business to business
trade (supplying trade credit) on a deferred payment basis
(on invoice) in both product and services markets may
decide to make use of collection agents if debts fall into
arrears. Increasingly, the government sector, as a collector
of taxes or a contractor with the private sector, is becoming
a source of debt collection and recovery business. The
potential size of the commercial debt collection market is,
and will be, influenced by the total amount of corporate
lending activity and the propensity for borrowers to go into
'arrears'. The implementation of the Late Payment of
Commercial Debts (Interest) Act has increased the
propensity for businesses, of all size, to pass on trade debt
to commercial debt collectors. At the time of writing our
analysis forecasts an increase in corporate insolvencies
during 2008-09 and particular pressure on the SME sector
that that is most affected by the recent restrictions in bank
lending to business. The result is to try and substitute bank
credit for trade credit and take extended trade credit where
possible (resulting in late payment). Corporate payment
delays and bad debts are likely to increase along with
insolvencies.
3.1 Business Growth and Insolvency in the UK
The common definition of default, 90+ days late, applies
equally to the commercial and consumer sectors. Basel II
deliberations defined default as 90 days late and such a
definition is commonly used by the credit insurers as a
trigger for claims. Default and ‘arrears’ can be
distinguished. The Finance and Leasing Association (FLA)
regards a debt to be in arrears if it is more than two
payment instalments overdue and/or over 31 days overdue
- approx 3% of outstanding balances in direct and sales
finance were in 'arrears' in their analysis15
. Euler Hermes
estimated that businesses that use collection agents contact
their debtor an average of six times before passing on the
debt to the agency16
. Thus, commercial debt arising from
trade credit can be considerably older than 90 days prior to
being placed with a debt collector. Clearly the 'younger' the
debt is when it is placed with a collection agent, then the
better chance of recovery. The market for commercial debt
sale is, consequently, very small.
As in consumer credit the latter is affected by underlying
economic conditions, the quality of lending and risk-return
decisions and in-house credit management practice, i.e.
how well the debt is worked prior to being out-placed. The
Late payment of Commercial Debts (Interest) Act has had
an impact of the extent of outplacement to the DCA sector.
The fact that DCAs can impose an interest charge and
recover some collection costs has made out-placing debt
more cost effective for the commercial sector and
particularly SMEs. Increasingly DCAs are offering to
collect overdue debts ‘for free’ i.e. the DCA keep the
interest charge (8% + base rate) rather than charge
commission.

Credit and Debt Management – 2008 Survey
40 Research and analysis by the Credit Management Research Centre, University of Leeds Business School
Clearly the volumes of commercial debt out-placed will be
a function of the number of businesses experiencing
financial difficulties and delaying payments to suppliers.
The pattern of corporate bankruptcies and liquidations will
be indicative of the degree of fragility and corporate
financial distress.
There has been a trend increase in the number of active
companies registered with Companies House. The stock of
active businesses approached 2.3 million in 2006.
According to Companies House the number of new
incorporations has been growing rapidly year on year, e.g.
43% 2003-6.
In total, unincorporated businesses and SMEs account for a
significant proportion of the business stock. This is
estimated to have grown by more than 1.4 million since
1980.
The stock of small businesses is estimated at 3.8 million.
SMEs account for 52% of aggregate business turnover and
56% of private sector employment, according to the SBS.
Barclay’s bank estimated that the number of business start-
ups has been growing at approximately 20% pa since 2002;
and in 2003 the number of new start-ups was 465,000.
Business closures, however, are also high. It is estimated
that over 50% of new starts go out of business within 3
years. Of course, not all of these leave unpaid debts behind.
The company birth rate, new registrations and a proportion
of the stock of active companies showed strong growth
from 2000 to 2004 with a levelling off up to 2006 (Q2) at
around 2%.
Number of Registered Companies
0
500000
1000000
1500000
2000000
2500000
2001
3
2001
4
2002
1
2002
2
2002
3
2002
4
2003
1
2003
2
2003
3
2003
4
2004
1
2004
2
2004
3
2004
4
2005
1
2005
2
2005
3
2005
4
2006
1
2006
2
Chart 3.1.1 – Register Size in Great Britain (1992-2006)
(Source: Companies House)

Credit and Debt Management – 2008 Survey
41 Research and analysis by the Credit Management Research Centre, University of Leeds Business School
The number of company insolvencies (compulsory and
creditors’ voluntary liquidations) in the England and Wales
was 3,194 in the last quarter of 2006, nearly half of the
figure that was observed in the third quarter of 1992 with a
record number of 6,509.
Although the trend fluctuated around 3,500 insolvencies
per quarter between 1995 and 2007, the figures have been
much lower than the levels of the early 1990s’ recession.
The seasonally adjusted figures provided by the Insolvency
Service show 3,032 liquidations in the second quarter of
2007, representing a 4.2% decrease on one year ago.
COMPANY BIRTH RATE
0
0.005
0.01
0.015
0.02
0.025
0.03
0.035
2001
3
2001
4
2002
1
2002
2
2002
3
2002
4
2003
1
2003
2
2003
3
2003
4
2004
1
2004
2
2004
3
2004
4
2005
1
2005
2
2005
3
2005
4
2006
1
2006
2
Chart 3.1.2 – Company Birth Rate (2001-2006)
Source: Companies House
Chart 3.1.3 – Company Insolvencies (1975-2006)
(Source: Companies House)

Credit and Debt Management – 2008 Survey
42 Research and analysis by the Credit Management Research Centre, University of Leeds Business School
Corporate failure may be the necessary by product of the
competitive process. One might argue that markets
basically keep efficient firms inside but throw out the
inefficient ones, as the natural process in aggregate
economic activity, in order to secure future growth and the
efficient use of resources. However, company failures
result in immediate social costs for families after possible
job losses or more seriously affect a whole region or a city
if the company is large enough to drive that area’s
economy. Indeed individual corporate failures have a
knock on effect via bad debts that puts pressure on the
cash-flow of otherwise healthy companies and impacts on
their ability to generate new future projects or investments,
and indeed, may push them into bankruptcy.
Company failure investigations can be highly useful for
banks, investors, and also trade credit specialists. On the
one hand, lenders need to know who to give credit safely
and profitably or creditors who to trade with or investors
who to invest in. On the other hand, they also want to
know how companies they have a business relationship
would react to aggregate economic fluctuations. For
instance, the Basel Capital Accord has provided the
impetus to lenders to research and develop adequate
default/failure prediction models for all of the business
sectors of their lending portfolios. Once implemented these
risk management systems have to be ‘stress-tested’ under
different economic scenarios which track the ‘prior
probabilities’ of failure.
Research by the Bank of England shows a clear
relationship between insolvencies and the write-off rate of
the banks.
Chart 3.1.4 – The Relationship between Insolvencies and the
Write-off Rates of Banks (Source: Bank of England)

Credit and Debt Management – 2008 Survey
43 Research and analysis by the Credit Management Research Centre, University of Leeds Business School
3.2 Forecasting Corporate Insolvencies
In order to gain insights into the economic drivers of
business failures, we compile a macro-economic data-base
using aggregate UK data between 1995 and 2007. It is
worth noting that this data is from a period of relatively
stable economic conditions A sample, which is exclusive
of a recession, may offer results that can reveal what
aggregate factors are likely to affect company failures
under a relatively healthy economic environment. Such
results can be considered with an aim of understanding the
factors that keep the number of operating companies at a
maximum. Lower levels of company failures are likely to
lessen not only reverse social costs in the society (e.g. job
losses) but also administrative costs of bankruptcies, which
could be used more productively in the whole economy
instead of officially eliminating ineffective companies.
Having employed advanced econometric methods, it is
found that whereas company birth rate, income gearing,
and money stock form a long term relationship with
corporate insolvency levels, lending to corporate sector,
aggregate profitability, trade credit defaults (county court
actions) and business confidence have significant short-run
effects on corporate insolvencies.
Data sources are generally from publicly available sources
and are as follows:
• The Number of Active Registered Companies
(Companies House);
• Business Confidence Indicator (OECD);
• All Others (Office for National Statistics),the
ONS code of the data set is also provided where
applicable);
• County Court Judgement Information .
Corporate insolvencies are represented with the corporate
insolvency ratio that involves both compulsory liquidations
and creditors’ voluntary liquidations. Members’ voluntary
liquidations are not included because such liquidations do
not necessarily represent insolvency. The corporate
insolvency ratio is calculated by dividing the number of
compulsory and creditors’ voluntary liquidations (ONS
code: AIHQ) by the number of active registered companies
in that period. The liquidation data and registered
companies data are gathered from the Office for National
Statistics and the Companies House respectively.
It is widely argued that corporate insolvency rates may be
related to the “business cycle”. Besides, it is also stated
that business cycles may largely affect company
profitability and, hence, failure rates (e.g. Turner et al,
1992). Therefore, the growth in GDP index at market
prices with chained volume indices1
(ONS code: YBEZ) is
used to control such a relationship. Furthermore, it is also
aimed to control the level of “business investments”, which
is proxied by “Gross Fixed Capital Formation: Business
Investment” in chained volume measures (ONS code:
NPEL).
1 Chained volume measures are used by ONS to represent “constant prices” where the base year is updated regularly.

Credit and Debt Management – 2008 Survey
44 Research and analysis by the Credit Management Research Centre, University of Leeds Business School
Despite some opposing arguments and differing empirical
findings regarding other factors, there is a consensus that
profitability is vastly important for companies.
“Profitability” is controlled with four different variables.
The first one is a straightforward profits variable: Real
Gross Operating Surplus of Private Non-financial
Companies (deflated by GDP deflator) (ONS code:
LRWL). The second one is Gross Rate of Return of Private
Non-financial Companies (ONS code: LRWV). The
remaining two variables considered here are generally cited
as the drivers of profitability. They are: Real Unit Wage
Costs (deflated by GDP deflator) (ONS code: LNNK) and
Real Input Prices (materials and fuel purchased) (ONS
code: RNNK) (deflated by output prices (manufactured
outputs) (ONS code: PLLU) deflator). “Productivity” is
also controlled with proxies of output per filled job (ONS
code: LNNN) and output per worker (ONS code: A4YM)
indices.
Interest rates are commonly mentioned as drivers of
company fragility and failures. It is claimed that real
interest rates can be highly influential for company health.
On the other hand, it is also put forward that inflation
and/or nominal interest rates can be the main cause of
company insolvencies depending on the circumstances. It
is aimed to control both types of interest rates, as well as
inflation, in this study. Nominal interest rates are proxied
by London Clearing Banks’ Base Rate (ONS code: AMIH)
and real interest rates are calculated by using GDP deflator.
Inflation is calculated by using GDP (expenditure) deflator
at market prices (ONS code: YBGB).
The availability of money and/or credit is regarded as an
important factor for the aggregate economic activity. It is
controlled by Real Money Stock (M4) (deflated by GDP
deflator) (ONS code: AUYN) and Real Banks’ and
Building Societies Lending to Non-financial corporations
(deflated by GDP deflator) (ONS code: VQSG).
“Over-indebtedness” and high capital gearing are cited as
possible causes of high levels of corporate failures. It is
argued that tax advantage of debt finance should be
managed carefully not to increase the probability of failure.
Indebtedness is controlled with a proxy of Debt-to-GDP
ratio. Debt is calculated by subtracting liquid assets of
Private Non-financial Companies from their total liabilities
at current prices (ONS code: NLBB-(NKJZ+NKXQ)) and
divided by GDP at current prices to obtain the Debt-to-
GDP ratio.
Income Gearing is used to represent the effects of interest
rates, indebtedness, and how debt is managed in the same
measure. It is calculated by dividing Interest paid by
Private Non-financial Companies at current prices (ONS
code: ROCG) by their Gross Operating Surplus at current
prices (ONS code: CAER).
Tax payments relative to profits are also controlled by
calculating the ratio of current tax payments of Private
Non-financial Companies (ONS code: RPLA) to their
Gross Operating Surplus at current prices (ONS code:
CAER).
Exchange rates are also cited as a possible determinant of
company failure. Sterling Effective Exchange Rate Index
(ONS code: BK67) is used to control such an effect.
Labour conditions are cited as being related to closures and
controlled by a proxy of employment rate (%, age 16-
59/64) in this study (ONS code: MGSU).

Credit and Debt Management – 2008 Survey
45 Research and analysis by the Credit Management Research Centre, University of Leeds Business School
It is also suggested that property prices may influence
insolvency rates since properties are mainly used for
collateral. Besides, the changes in such prices may also
affect the liquidation value of a company. Hence, property
prices are also controlled in the model with a proxy of real
house price index (deflated by GDP deflator) (ONS code:
WMPQ).
Share values are also controlled since they may show a
company’s worth and affect the liquidation value of a
company. The proxy used is Price Index of FTSE industry
sector, non-financials (ONS code: HSER).
It is widely suggested that new companies are more likely
to fail than the old mature ones. Such an effect is
controlled by company birth rate, which is represented by
the growth in active registered companies (Source:
Companies House).
Business confidence is also controlled as it may affect both
borrowers’ and creditors’ decisions. The data is gathered
from OECD as Business Confidence Indicator:
Manufacturing for the UK.
The factors affecting the business failure rate in the long-
term and in terms of short-term dynamics were modelled
using the final data selection tabled opposite.
Table 3.2 – Variables used to Forecast Insolvencies
(Source: CMRC)
The results of the analysis were as expected. That is, in the
long term insolvency rate increases when income gearing
or real CCJ values increase, and when the employment rate
or real money stock decrease.
The Growth in Real Short Term Loans and Business
Confidence are the short-run dynamics of the insolvency
rate. That is, whereas short term increases in the growth in
real short term loans are likely to create short term
increases in the insolvency rate, short term increases in
business confidence are likely to create short term
decreases in the insolvency rate.
VARIABLE DESCRIPTION 1-Insolvency Rate No.of Insolvencies/
No.of registered Companies
2-Company Birth Rate Growth rate of the number of registered
companies
3-Growth in Short Term Loans
4-Growth in Short Term Bank
Loans
5-Capital Gearing Total Debt/Total Assets
6-Income Gearing Interest Payments/
Operating Profit
7-Growth in Operating Profit
8-Inflation Calculated from
GDP Deflator
9-GDP Growth Quarterly
10-Exchange Rate Index Sterling Effective Exchange Rate index
11-Nominal Interest Rate London Clearing Banks’ Base Rate
12-Real Interest Rate Deflated by GDP deflator
13-Real House Price Index Deflated by GDP deflator
14-Employment Rate Between age 16-59/64
15-Business Confidence
Indicator
Manufacturing
16-Real Money Stock (M4) Deflated by GDP deflator
17-Real CCJ Value (total) Deflated by GDP deflator
18-CCJ Count Number of CCJs
in a quarter
19-Real CCJ Value/CCJ Count Ratio

Credit and Debt Management – 2008 Survey
46 Research and analysis by the Credit Management Research Centre, University of Leeds Business School
The relatively high levels of indebtedness in the corporate
sector coupled with recent interest rate increases and a
decline in business confidence suggest that corporate
insolvencies are set to increase in the next 2 years.
3.3. Commercial Lending
Since 1996, the total lending to the non-financial sector, in
the form of loans by the banks and building societies, has
increased by over 75%. The figures include all lending to
PLC's, limited companies and partnerships.
There was some slow down in this form of lending towards
the end of 2000 and early 2001 but the total lending has
increased 23% in the last 5 years.
Lending to non-financial companies rose by £13.3 billion
in the last year to 2005(Q4) with real estate taking a large
share of this total.
Statistics provided by the Bank of England (January 2006)
show a sharp increase in lending growth since 2004(Q2)
compared to deposits from non-financial corporations (see
charts below).
1996 1997 1998 1999 2000 2005 Outstanding Lending at year end (£m) 160,744 178,928 189,260 201,797 228,686 281,606 % change - 11.3% 5.8% 6.6% 13.3% 23.1%
Table 3.3.1 – Bank and Building Society Lending to Industrial and
Commercial Companies 1996-2006 (Source: Bank of England)
Chart 3.3.1 – Contributions to Annual Growth Rate from Non Financial
Corporations (Source: Bank of England)

Credit and Debt Management – 2008 Survey
47 Research and analysis by the Credit Management Research Centre, University of Leeds Business School
Asset finance in the form of HP and Leasing remains an
important source of funding and particularly for SME’s.
Data from the Finance and Leasing Association shows that
total new finance to fund capital investment totalled over
£2.3 billion by June 2005 and that growth in the financing
of investment goods outperformed motor vehicle leasing.
There has been some growth in HP and Leasing to the
SME sector, predominantly to firms in the £1-5 million
turnover.
Recent theories of corporate finance have emphasised the
importance attached to internally generated finance and
managerial preferences for internal over external sources of
finance in certain situations, particularly when managers or
owner-managers are better informed about the firm's future
prospects than can be 'costlessly' conveyed to external
lenders (i.e. the problem of 'asymmetric information'). The
'pecking order hypothesis' (POH) of financial structure, for
instance, suggests that firms will finance projects by first
using internal resources, then debt finance and, as a final
resort, equity. This theory has been empirically verified for
large firms. For smaller and growing firms, the POH may
be particularly relevant when informational asymmetries
are likely to be more acute and potential debt providers
may seek premium interest rates and high levels of
collateral on loans.
The POH theory predicts that smaller firms are likely to
rely to a greater extent on trade credit and short-term bank
finance to support their operations and have a preference
for 'asset-based' finance over external debt and equity.
Chart 3.3.2 – New Leasing and HP Business Finance
by Client Size and Business Investment
(Source: FLA and ONS)
Recent surveys (e.g. Bank of England Surveys of 'Finance
for Smaller Firms') have suggested that 'asset-based'
finance accounts for an increasing proportion of external
finance for the smaller company sector. Leasing and hire
purchase, factoring trade debt, invoice discounting and
pledging trade debtors as collateral for bank finance are all
growing forms of asset-based finance.
The Bank of England study ‘Finance for Small Firms –
Eleventh Report’ suggests that external bank finance for
SMEs is important but not dominant. Leasing and HP has
grown in importance. Operating leases and hire purchase
are common forms of asset-based finance utilised by the
smaller company sector - an important means of spreading
the purchase costs of an asset over the asset's lifespan.
Research has estimated that hire purchase and leasing
account for over 30% of all external finance utilised by
small firms. Factoring and invoice discounting has grown
quite considerably over recent years, albeit from a small
base as discussed below.

Credit and Debt Management – 2008 Survey
48 Research and analysis by the Credit Management Research Centre, University of Leeds Business School
The chart below shows the proportions of overdraft relative
to fixed term lending in the SME sector.
The Bank of England and BAA in their analysis of lending
and deposits to and from the SME sector recently tightened
up their definition of a small firm.
Consequently, data prior to 2002 (Q4) is calculated on a
slightly different basis to more recent figures. Nonetheless
the data shown below reveals that the structure of bank
lending to SMEs has shifted markedly away from overdraft
to more fixed term lending.
Chart 3.3.3 – Small Business Borrowing and Deposits at Year End (£ Billions)
(Source: BBA and Bank of England)
Chart 3.3.4 – Changes in Sources of External Finance for SME’s
(Source: ESRC Centre of Business Research)

Credit and Debt Management – 2008 Survey
49 Research and analysis by the Credit Management Research Centre, University of Leeds Business School
The ESRC Centre for Business Research produce surveys
which illustrate the decline in the proportion of finance
accounted for by traditional bank borrowing and the
growth of the use of leasing and factoring.
Thus in recent years, fixed term loans have replaced
overdrafts as the main source of bank lending for small
businesses. There appears to have been a shift away from
an over-reliance on overdraft and short- term finance to a
more structured approach in addressing capital
requirements. This should have an impact on the late
payment of commercial debt that is often precipitated by
firms juggling short-term finance when they are
undercapitalised.
A recent study by the Bank of England2
shows a sharp,
and to some extent inexplicable rise in the level of capital
gearing in the UK (large) corporate sector. Capital gearing
remains at a historically high level which, some
commentators believe, is a symptom of a fragile economy.
The measures of capital gearing are indebtedness to market
value and indebtedness to capital stock replacement costs
ratios.
The chart below shows the trend increase in these ratios,
particularly since the late 1980s.
2 The determinants of UK Corporate Capital Structure (2005)
Chart 3.3.5 – Aggregate Capital Gearing of UK companies
(Source: ONS and Bank calculations)

Credit and Debt Management – 2008 Survey
50 Research and analysis by the Credit Management Research Centre, University of Leeds Business School
More recent data derived from an analysis of UK Company
accounts suggests that the ratio of total debts to total assets
has risen quite sharply since 2004.
When we also analyse rations reflecting the ability of firms
to cover their debt interest repayments, we observe a
similar rise since 2004. This suggests that there are a large
number of companies that are not generating sufficient
profit to cover their interest payments. The considerable
growth in private equity backed leveraged buyouts has
increased the role of debt in capital structures. It is
estimated that value of investments LBOs in 2007 was
around £22 bn.
Chart 3.3.6 –Capital Gearing/Total Debt/Total Assets
(Source: Creditscorer)
Chart 3.3.7 –Income Gearing/Operating Profit
(Source: Creditscorer)
Capital Gearing(Total Debt/Total Assets)
0
0.02
0.04
0.06
0.08
0.1
0.12
0.14
0.16
2001
3
2001
4
2002
1
2002
2
2002
3
2002
4
2003
1
2003
2
2003
3
2003
4
2004
1
2004
2
2004
3
2004
4
2005
1
2005
2
2005
3
2005
4
2006
1
2006
2
Income Gearing(Interest Payments/Operating Profit)
0
0.05
0.1
0.15
0.2
0.25
0.3
0.35
0.4
0.45
2001
3
2001
4
2002
1
2002
2
2002
3
2002
4
2003
1
2003
2
2003
3
2003
4
2004
1
2004
2
2004
3
2004
4
2005
1
2005
2
2005
3
2005
4
2006
1
2006
2

Credit and Debt Management – 2008 Survey
51 Research and analysis by the Credit Management Research Centre, University of Leeds Business School
3.4 Trade Credit
Trade credit involves supplying goods and services on a
deferred payment basis that is, giving the customer time to
pay. The vast bulk of inter-firm sales are made on credit
terms. Trade credit is a particularly important source of
funding for smaller companies; the stocks and flows of
trade credit are typically twice the size of those for bank
credit. In the UK corporate sector it is estimated that more
than 80% of daily business-to-business transactions are on
credit terms. This form of financing, trade credit, is the
most important and largest form of short-term financing for
the corporate sector. The amount of credit extended by a
business to its customers (and not yet recovered) appears as
a current asset ('trade debtors') on the balance sheet and is
therefore a component of net working capital. The amount
of credit received by a business from its suppliers (and not
yet paid back) appears as a current liability (trade creditors)
on the balance sheet.
These two components represent a substantial market for
debt collection services. Indeed, trade debtors are one of
the main assets on most corporate balance sheets,
representing up to 30-35% of total assets, on average, for
all companies.
The chart compiled from a sample of 100,000
manufacturing companies over 2 decades illustrates the
relative importance of trade debtors as an asset on the
balance sheet. The share of total assets, on average, is in
the region of 30-35% of total assets over the time period.
This contrasts with stocks (inventories) which over time
have fallen as a proportion of total and current assets as
firms have become more efficient in the management of
inventories.
All UK Manufacturing 1977-2004N=100,000 approx.
0
10
20
30
40
50
60
70
1977
1979
1981
1983
1985
1987
1989
1991
1993
1995
1997
1999
2001
2003
Time Period
Per
cent
age
Trade Debtors/Total Assets Trade Debtors/Current AssetsStocks/Total Assets Stocks/Current Assets
Chart 3.3.8 – The Importance of Trade Debtors to the Balance Sheet
(Source: Creditscorer)

Credit and Debt Management – 2008 Survey
52 Research and analysis by the Credit Management Research Centre, University of Leeds Business School
An important aspect of trade credit, however, is the two-
way nature of the transaction. Many companies,
particularly those at intermediate points in the value chain,
both use trade credit as customers and provide it as
suppliers. The debtor (DSO) and creditor days figures
(DPO) were calculated over the same time period as above.
The DSO figures which can be seen in the chart to the right
are in the region of 60-70 days for manufacturing firms and
DPO are in the region of 50-60 days. These aggregates,
however, disguise some wide variations when analysed by
sector and company size. Moreover, for individual firms
the net trade credit position is of more importance.
Managing the net trade credit position is critical. The
CMRC Quarterly survey of businesses tracks the net trade
credit position of respondents. The average net trade credit
position of companies can be seen to the right throughout
the life of the survey. A positive value indicates that firms
are extending more credit than is being received whereas
negative figures suggest the company is receiving more
credit than it is extending. Essentially, the Net Credit Days
figure is the difference between Debtor Days (DSO) and
Creditor Days. There was a significant rise in the Net
Credit Days figure during 2005. A survey in the UK (FPB,
1994) estimated that there was £10 billion (ECU 14.8 bn)
net late trade credit owed to small businesses.
Trade credit can involve a 'one-off' sale on invoice to a
customer to be paid say, in thirty days from receipt of the
goods. In the case of repeat purchasers however, the
supplier may open and manage a customers 'credit
account', whereby the buyer may order goods up to an
agreed limit (the credit limit) and pay funds into the
account according to agreed payment terms.
Companies engaged in exporting their goods or services
across national boundaries may supply them on a deferred
payment basis (i.e. trade credit) but make extra provisions
to finance export trade and/or take additional steps to
'secure' future payments (i.e. 'export-credit').
All UK Manufacturing 1982-2004
0
10
20
30
40
50
60
70
80
90
1982
1983
1984
1985
1986
1987
1988
1989
1990
1991
1992
1993
1994
1995
1996
1997
1998
1999
2000
2001
2002
2003
2004
Time Period
Perc
enta
ge
Debtor Days Creditor Days
Chart 3.3.9 – DSO and Creditor Days Trends (1982-2004)
(Source: Creditscorer)
Chart 3.3.10 – Net Trade Credit Trends
(Source: Creditscorer)

Credit and Debt Management – 2008 Survey
53 Research and analysis by the Credit Management Research Centre, University of Leeds Business School
For small firms, supplying trade credit can be an important
strategic or competitive tool that plays a role in capturing
new business, in building supplier-customer relationships,
in signalling product quality, 'reputation' and financial
health and in price competition and price discrimination.
Yet, for many firms supplying and financing trade credit,
and managing trade debt, can cause cash-flow/financing
difficulties. Trade credit contracts are by their nature
incomplete and often established between supplier and
buyers with asymmetric bargaining positions. Indeed,
enforcing credit terms can be a problem, particularly for
smaller firms. The late payment of commercial debt has
often been cited as a factor that precipitates financial
distress and/or constrains growth amongst smaller firms.
Small firms can be particularly vulnerable to bad debts,
because they tend to have a smaller customer base than
their larger counterparts.
Trade credit as a form of short-term financing is not
costless. The cost of trade credit however, as compared to
other forms of financing (i.e. bank credit, factoring, etc) are
quite difficult to ascertain. The duration and implicit costs
of trade credit loans vary across firms and industries.
Moreover, as we will show later, customers often violate
the stated terms in practice. This obviously creates a debt
collection problem.
3.4.1. Credit Terms and Credit Management Practice
Credit terms refer to the written or stated policies given to
a customer with regard to: the timing of payments;
discounts for early settlements; the methods of payment;
ownership of goods prior to payment (e.g. retention of title
to the goods or other types of security); and (if applicable)
interest or penalties for late payment. The terms of
payment on business-to-business sales can take many
forms and a wide variety of possible payment terms can be
offered. Cash on or before delivery (COD, CBD) obviously
does not involve trade credit. Progress or 'stage payment'
terms usually involve an up-front deposit or down payment
with the outstanding invoice value being spread in
payments over a set period or at specific points in the
fulfilment of a supply contract. The majority of trade credit
sales however, are offered on a net period or a net period
with cash discount for early settlement.
Net terms involve the setting of a period after which
payment should be made in full. This is usually defined
either as a number of days after the invoice date or a
number of days after the end of the month in which the
invoice is issued (e.g. 30 days EOM, meaning thirty days
from the next month end). The use of EOM terms
obviously has a substantial impact on the actual credit
period; if sales are evenly spread through the month 30
days EOM will lead to an average credit period of
approximately 45 days. With two-part terms the supplier
specifies a net period, as with net terms, but also specifies a
shorter period (the discount period) during which payment
will attract a discount. Terms of 2/10 Net 30, for example,
mean a buyer can obtain a 2% discount by paying in 10
days or less, otherwise payment of the undiscounted price
is required in 30 days. Although the percentage discount
offered might often seem small, it is equivalent to a high
annual rate of interest being charged for the additional
extension of credit to net terms. Variations on this concept
also exist, for example, the payment of a rebate to
customers who pay in full by the discount date. This latter
variation protects the seller from the buyer taking unearned
discounts opportunistically.

Credit and Debt Management – 2008 Survey
54 Research and analysis by the Credit Management Research Centre, University of Leeds Business School
Predominantly, the payment period specified, in the UK, is
30 days (net 30 or 30 EOM) but can vary from less than 7
days (near cash) to over 120 days. Typically, credit periods
offered on export contracts are slightly longer than those
for domestic sales, but this varies according to the
destination country, the industry sector, the characteristics
of the buyer and the nature of the product/service involved.
Credit terms and payment behaviour varies within the EU
Member States. In general, Northern/Scandinavian
countries trade on shorter credit periods and pay promptly,
whilst some Southern European countries have long
periods and long delays. Intrum Justitia’s Business Survey
suggests that Portugal, Spain and Italy have the longest
payment periods and Finland, Denmark, Sweden, Austria
and Germany have the shortest. The European Commission
have estimated, based on the FPB estimates, that the total
amount of net (late) trade credit owing to EU businesses
could be in the region of ECU 90 billion at any point in
time. The sectors which are frequently cited as being 'bad
payers' are construction, transport, retail and wholesale,
primary industries and the public sector.
3.4.2. Motives for the Supply of and
Demand for Trade Credit
It is clear, however, from CMRC survey evidence that the
motives individual firms have for extending trade credit to
customers (supply-side) are complex and manifold.
The market for debt collection services is to some extent a
function of the supply of and demand for trade credit and
the factors that affect the level and flows of trade credit in
the corporate sector. This section provides a brief review of
the motivations for extending trade credit (supply-side) and
the factors determining the usage of trade credit (demand-
side) and the implications for the credit management
process.
Trade Credit Extension and Credit Terms: The Supply-Side
Motivation
This section provides a brief overview of the main motives
that (non-financial) firms have for extending credit. In
particular, we examine the motivations for extending credit
from a 'strategic' or 'competitive' perspective.
Firms add value by creating and sustaining competitive
advantages. The seminal work by Michael Porter suggested
that competitive advantages emanate from strategies of
either cost-leadership or differentiation that may or may
not be focused on a well-defined market segment. Others
develop more complex models which suggest that
competitive advantages are established through innovating
products and processes (including information systems);
building and reinforcing relationships with customers and
suppliers (external and internal to the firm); establishing
and maintaining a reputation; and by having 'strategic
assets,' i.e. market dominance or position. One could argue
that the extension of trade credit is an increasingly
important element of corporate strategy and a potential
source of competitive advantage. Offering and managing
credit can be a key element in developing a strategy which
can both create and sustain competitive advantage. In the
context of the Porter model it can clearly play a subtle or
overt role in price competition and can be an engine for
driving differentiation strategies.

Credit and Debt Management – 2008 Survey
55 Research and analysis by the Credit Management Research Centre, University of Leeds Business School
Of course, firms will vary in the extent to which they use
credit pro-actively in this way. Some organisations credit
policy is closely aligned to the sales and marketing
function, whereas in some it is seen as a subsidiary
function to the finance department. In still, others it is seen
forming a vitally important loop between the two. For
instance, suppliers may use trade credit as a means of
competing in markets and generating sales and customer
loyalty. Trade credit as a competitive tool is many faceted
and can be used to respond to customers' sensitivities to
total effective price (goods plus finance); their needs or
demand for short-term finance; their focus on product
quality and after-sales service; and their requirements for
continuity and reliability in the timing and quality of
supplies. The table summarises the way in which trade
credit can provide an important component of business
strategy. None of which, of course, are mutually exclusive
and some of which will depend on the extent of the firm's
market power or 'strategic assets'. The nature and way in
which credit can be used as a tool for gaining competitive
advantages and reducing demand uncertainties will depend
on the competitive structure of the markets facing the
supplier and the customer, their relative bargaining
strengths and the conditions affecting the supply of
alternative sources of corporate finance.
Trade credit extension could be viewed as an important
means of managing 'relationships' with customers, e.g.
generating repeat purchase behaviour, establishing
reputation and building stable and long-term relationships
with customers (i.e. good-will and a future income stream,
and of generating market or customer information). As
discussed above, potential buyers of a product may require
an 'inspection period' in order to ascertain product quality.
In the same way sellers may wish to differentiate their
offering to the market by extending credit as a signal or
'pledge' of product quality.
Table 3.4.2.1 – Motivations for Trade Credit
Extension (Source: CMRC)
Strategy Impact
Market Signalling
and Differentiation
Credit acts as an implicit guarantee of
product quality. Available credit terms
provide a ‘quality signal’ to potential buyers.
Offering credit may be a key factor that
differentiates one supplier among
competing suppliers.
Customer Loyalty
& Information
Trade credit can be used to ‘tie-in’
customers and encourage repeat purchase
i.e. ‘building relationships’. Extending credit
generates potentially useful information on
customers.
Price
Discrimination &
Price Competition
Offering credit terms provides more
opportunities for varying effective price to
buyers with different elasticities of demand
or different credit risk. Credit terms can be
an important element of price competition
and the ‘marketing-mix’ in competitive
markets.
Cost Leadership
Offering a package of both product and
finance that is cheaper than a buyer
negotiating with two parties (supplier &
financier) may generate profitable sales. The
supplier may generate profit from both
activities - profit margin on the product;
(premium) interest on the finance.
Managing
Uncertainties
Using and extending trade credit can be
used to reduce the uncertainties in trading
relationships and minimise ‘transactions
costs’. It can therefore help the firm develop
an environment conducive to innovation.

Credit and Debt Management – 2008 Survey
56 Research and analysis by the Credit Management Research Centre, University of Leeds Business School
Manipulation of standard credit terms through informal
deals is one way in which the extension of trade credit can
be used for marketing purposes and for price
discrimination between customers (e.g. to compensate for
different risks). The presence of such deals to any
significant extent in a market means that the actual price of
trade credit in a particular circumstance can be difficult or
impossible for a third party to determine (or for a potential
customer to determine prior to negotiation). The CMRC
found, for example, that over 30% of firms said they were
likely to vary credit terms to attract new large customers or
promote slow moving products and over 20% were likely
to do so to retain existing customers. Such deals may even
include effectively allowing a customer to pay late or
allowing a customer to obtain discount without paying
early. The willingness of companies to vary terms suggests
that a standard assumption that credit terms are standard in
an industry and perhaps over time must now be
reconsidered in such an environment. Evidence suggesting
that firms are using trade credit terms more pro-actively
and flexibly has implications for the debt collection
industry, which, in the past, has had a poor image in terms
of managing 'customer relationships'.
Extending credit to customers who themselves face highly
competitive product markets can be a useful means of
winning business. Such firms are likely to attach a greater
weight to the availability of credit when choosing amongst
competing suppliers. Indeed these are likely to be the firms
that have difficulty raising institutional credit and/or are
credit rationed by the banking sector. This, however, is
clearly not without risk since credit rationed firms are also
more likely to default or pay late.
The supplier may well be able to offer products with trade
credit and pass on the cost of credit to the buyer. Some
firms will add a premium onto product price in order to
cover the costs of extending credit or to discriminate
between different classes of risk in the customer base.
Others may offer credit at a loss to illiquid buyers but
offset this against a surplus from cash buyers. There may
be other situations where the firm will wish to trade-off the
short-term profitability of individual customers with the
increased volume of sales or market share and, of course,
the potential for generating repeat purchase behaviour and
market or customer information.
Trade credit extension may be used to smooth the pattern
of customer demand over the business cycle or seasonally.
For instance, trade creditors may relax credit terms in order
to stimulate demand in lean periods and recover the costs
of this policy in more buoyant times. Thus, although trade
credit is short-term finance for the recipient, as far as the
supplier is concerned it may be used as part of a long-term
strategy of managing the customer-base. Consequently, the
supplier may be prepared to extend trade credit at a short-
term loss (or cross-subsidised by cash payers) for the
benefits of a long-term relationship and future income
stream. Whereas the seller may regard the bundling of
products and finance from a marketing/relationship point
of view, the buyer may value the financing element.
Finally, in the context of financial markets suppliers may
have cost-savings vis-à-vis institutional lenders both in
assessing credit worthiness initially, and in monitoring it
on-going basis. Some of these cost savings arise from
industry knowledge and others from the contact of the
selling process and potentially from the trade credit
transaction itself. A supplier may also get more collateral
value, in the event of default, from goods sold on credit
than would a third party (e.g. a bank). Offering products
and finance (trade credit) can thus be part of a strategy of

Credit and Debt Management – 2008 Survey
57 Research and analysis by the Credit Management Research Centre, University of Leeds Business School
cost leadership. In such cases, the cost of obtaining both
merchandise and credit from a single firm can be lower
than purchasing them through separate transactions. The
provider may be able to generate profit from both the sale
of the product and from the provision of finance.
3.4.3 Credit Management: The Impact on Corporate Performance
Companies extending and managing trade credit should
establish a credit policy which provides the framework for
making consistent and well-informed credit decisions
which are compatible with the company's strategic
objectives and the goals of the credit function. The credit
policy is a document that specifies the course of action for
granting credit and for recurring credit activities.
Obviously, the credit policy has to be understood by and
communicated to all relevant parties, particularly credit
staff, sales staff and customers.
Credit policies need to be reviewed and monitored on a
regular basis. A carefully documented credit policy is a
fundamental requirement of sound credit management
practice, and should serve at least the following purpose:
• To define the objectives of credit extension in the
context of corporate strategy and organisation
structure;
• To define the authority and responsibilities for
credit granting, establishing and varying terms
and the timing of collection actions;
• To provide documented procedures in relation to
the above that can be communicated to all staff;
• To specify training policy for credit staff;
• To specify performance targets and monitoring
activities for credit staff.
Most large companies will have a documented credit
policy, but many medium-sized and smaller companies
lamentably neglect this aspect of their business. A CMRC
survey in 1995 revealed that only 35% of manufacturing
companies and less than 20% of small companies had a
written credit policy. Over 30% of firms extending credit
did not agree credit terms in writing prior to the sale. More
recent research by CMRC, suggests that credit
management practice, SME financing and banking
relationships and perceptions of the late payment problem
have all improved significantly in the period 1995-2000.
The credit policy of a company should be developed in
accord with the strategic, marketing, financial and
organisational context of the business and be designed to
contribute to the achievement of corporate objectives. The
corporate strategy can include trade credit management,
not just in terms of its contribution to collection and cash
flow, but as a means of generating sales and profits, and of
investing in customers by building relationships.
The management of trade credit can help build stable and
long term relationships with customers, generate
information about the customer and their requirements and
facilitate different customer strategies in terms of credit
granting, credit terms and customer service. The objective
is to generate growing, but profitable sales. Managing
collections lowers cash-flow risks and helps to ensure that
cash is available for investment opportunities. The
objective is to collect in accordance with credit terms,
minimise collection costs and reduce the need for finance
whilst responding quickly to customer queries and/or

Credit and Debt Management – 2008 Survey
58 Research and analysis by the Credit Management Research Centre, University of Leeds Business School
disputes. Managing the total investment in debtors and
‘money at risk’ has a direct impact on profitability and the
ability of firms to raise external funds. Measuring,
monitoring and minimising credit risk is an important
activity for credit management. Minimising bad debt in the
context of the risk-return decision has a direct impact on
profitability.
The decision of the extent to which the firm uses the
services of external agents such as credit reference agents,
credit insurance, factoring, invoice discounting and debt
collection/recovery services is a strategic issue and will
have a bearing on overall performance. The use of credit
insurance can impact on credit management practice and,
in turn, on corporate performance in a number of ways.
Firstly, credit insurance protects cash-flow against
protracted default and protects profits from the risk of bad
debt. Credit insurance, however, imposes a discipline on
the credit management activities of the firm. Thus, sales on
credit have to be agreed formally between the two parties
along with payment dates.
The credit grantor has to monitor payment times in order to
inform the insurer of any overdue and comply with the
terms of the policy. In effect this improves the collection
time on all trade debt and impacts on cash-flow as well as
allowing the firm to analyse individual customer payment
histories. The credit insurer will credit vet all the firm’s
customers, provide the firm with advice on credit limits
and provide early warnings of customers in financial
difficulty. This information may be useful for marketing
decisions and customer relationship management as well as
with credit decisions. Having trade debtors insured may
facilitate the raising of finance from the banking sector and
foster better banking relationships. In turn, a credit insured
company is a better risk from the perspective of current
and potential suppliers since they will be protected against
the ‘knock-on’ effects of bad debt.
In previous research by CMRC, it was possible to
demonstrate that relatively simple credit management
practice could have significant effects and certainly give
the firm an edge over its competitors. For instance, in the
sample as a whole only 20% of companies had a written
credit policy and over 50% did not agree credit terms in
writing prior to a sale. Few used credit reference
information or credit insurance - a substantial number were
extending credit to bad risks. However, those companies
that were devoting more time to ‘front-end’ credit
management (i.e. checking credit- worthiness of
customers; negotiating and agreeing terms in writing and
monitoring credit limits) had: a greater proportion of
accounts paid on time, lower levels of bad debts, lower
average debtor days (controlling for credit periods), and
perceived less of a late payment problem.
Of course, firms will vary in the extent to which they use
credit pro-actively in this way. Some organisation’s credit
policy is closely aligned to the sales and marketing
function, whereas, in some it is seen as a subsidiary
function to the finance department. In still others, it is seen
a forming a vitally important loop between the two. For
instance, suppliers may use trade credit as a means of
competing in markets and generating sales and customer
loyalty. Trade credit as a competitive tool is multi-faceted
and can be used to respond to customers’ sensitivities to
total effective price (goods plus finance); their needs or
demand for short-term finance; their focus on product
quality and after-sales service; and their requirements for
continuity and reliability in the timing and quality of
supplies. The nature and way in which credit can be used

Credit and Debt Management – 2008 Survey
59 Research and analysis by the Credit Management Research Centre, University of Leeds Business School
as a tool for gaining competitive advantages and reducing
demand uncertainties will depend on the competitive
structure of the markets facing the supplier and the
customer, their relative bargaining strengths and the
conditions affecting the supply of alternative sources of
corporate finance.
The strategy map below summarises the routes by which
good credit management practice can impact on a
companies overall performance, i.e. profitability, growth,
shareholder value.
3.4.4 The Use of Trade Credit and Payment Behaviour: The Demand Side Motivation
Understanding how customers, 'buyers', might behave in
respect on their usage of trade credit (their demand for
trade credit), their payment behaviours and the likelihood
of protracted default and/or insolvency is an important
aspect of the credit manager's role and may, in turn, affect
their decision to insure the risks of trade debt. This section
focuses on the factors affecting the demand for trade credit.
CREATESHAREHOLDER VALUE
Financial Perspective
CORPORATE STRATEGY
FINANCIAL STRATEGY MARKETING STRATEGY
CREDIT STRATEGY
OPTIMISECASH CONVERSION
GROW REVENUEMAXIMISE CUSTOMER VALUE
MAXIMISE INVESTMENTIN CUSTOMERS/ MINIMISE
‘MONEY AT RISK’
RISK-RETURN
OPERATIONAL
ORGANISATION
Customer Perspective
CREDIT MANAGEMENT
CREDIT GRANTING RISK MANAGEMENT CREDIT CONTROL
- CUSTOMER PRODUCT DEMAND- CUSTOMER CREDIT DEMAND-TAILORED PRODUCT/CREDIT PACKAGE - MAXIMISE CUSTOMER PROFITABILITY- SERVICE QUALITY/FLEXIBLE TERMS- GENERATE NEW/REPEAT BUSINESS- PRODUCT LIFE-CYCLE MANAGEMENT- CUSTOMER LIFE-CYCLE MANAGEMENT
INFORMATION GENERATIONCUSTOMER AND MARKET KNOWLEDGE
IN-HOUSE ACTIVITIESOUT-SOURCED ACTIVITIES
Collection Strategy
Collection Periods/CostsNet Trade Credit
Customer Relationship ManagementCustomer Portfolio Management
OBJECTIVE
- SALES/CREDIT COORDINATION - MONITOR CREDIT LIMITS - INVOICE EFFICIENCY/PAYMENT OPTIONS- DISPUTE RESOLUTION- PRO-ACTIVE COLLECTION/CRM- MINIMISE OVERDUES/CREDIT NOTES- MAXIMISE CUSTOMER SATISFACTION
- CREDIT INFORMATION- RISK MEASUREMENT- DEFAULT PROBABILTIY- COLLATERAL/GUARANTEES- ‘MONEY AT RISK’/ FINANCING- RISK TRANSFER (BUYER)- RISK TRANSFER (INSURER)
Minimise DelinquencyMinimise Bad Debt Losses
-New customers-Customer Retention
- Customer Profitability
Cost Effective Credit Management- CREDIT REFERENCE DATA/RISK SCORES- DEBT RECOVERY/LITIGATION- CREDIT INSURANCE- FACTORING/INVOICE DISCOUNTING
- CUSTOMER KNOWLEDGE- CREDIT GRANTING/POLICY/CRM- SALES ADMINISTRATION- COLLECTIONS- FINANCING/ RISK PROVISIONS
COST-BENEFIT
SHORT-LONGTERM
Chart 3.4.4.1 – The Use of Trade Credit and Payment Behaviour – A Strategy Map
(Source: CMRC)

Credit and Debt Management – 2008 Survey
60 Research and analysis by the Credit Management Research Centre, University of Leeds Business School
It was suggested above that a buyer may wish to purchase
on trade credit in order to protect against forms of seller
non-compliance e.g. delivering goods of poor quality or
not fully complying with the terms of sale. Moreover a
firm may have no real preference for trade credit over other
forms of finance but accept trade credit as but one element
of the supplier's total 'marketing bundle' (of goods + credit
+ after-sales service etc.). The most likely motivation for
using trade credit is however, to satisfy a financing demand
(financing theory) and/or to minimise transactions costs
(transactions cost theory).
As we have discussed above trade credit, to the recipient, is
primarily a form of short-term financing. If we consider
trade credit as one of several options for financing
purchases, then the attractions of trade credit will depend
on the relative costs and availability of other options. If
credit market imperfections cause some buyers to have
unsatisfied demand for finance, i.e. to experience credit
rationing, then they will be willing to use trade credit even
at a premium cost. Academic studies of trade credit
demand provide some support for this notion. If, on the
other hand, firms are cash rich then trade credit must be
compared with the opportunity cost of other uses of the
money. Possibilities for credit rationing arise where lenders
are not able to set an appropriate rate for each loan
applicant based on the riskiness of the loan. This situation
may arise because of imperfect information; where a lender
is unwilling, due perhaps to economic viability, or unable
to obtain sufficient information on the borrowers
creditworthiness or the risk-return profile of the project for
which the loan is being raised. If a lender is asymmetrically
informed compared to the borrower, they are exposed to
the problems of adverse selection and moral hazard.
Alternatively, the ability of the lender to set an appropriate
rate may be restrained by usuary laws, the way such action
is viewed by the customer base, or the potential impact on
public perceptions of the lender.
If credit rationing exists in a market (e.g. amongst small
growing businesses) then trade credit can be an attractive
way of obtaining finance even if the costs are high due to
foregone discounts or late payment penalties.
This motivation for trade credit demand would imply that
firms who are higher credit risks would have a higher
demand for trade credit, including that at premium cost,
and would be more likely to display behaviours such as
late payment, which are effectively breaches of the terms
of sale. Suppliers may be willing to finance such customers
because the firms have more in common than the financial
transaction; the supplier benefits in the longer term by
helping a customer in temporary difficulty to stay in
business and therefore making future sales. The supplier is
also in a potentially better position to ascertain the
probability of default, than an institutional lender if the
relationship is long term or the selling process facilitates
the collection of credit information. In the event of default
the supplier may be able to obtain greater value from the
goods if they are repossessed than would a third party. The
supplier's credit management department may also be in a
better position to monitor customers on an ongoing basis.
Moreover, suppliers can also use two part terms to obtain
ongoing information on credit worthiness; buyers who fail
to take early payment discount may be signalling financial
difficulty. Finally, the differences between the market
borrowing and market lending rates of interest provide a
financial incentive for suppliers to engage in arbitrage,
using surplus funds to finance customer purchases, rather
than earning interest on the market.

Credit and Debt Management – 2008 Survey
61 Research and analysis by the Credit Management Research Centre, University of Leeds Business School
Even if a firm is not subject to credit rationing, trade credit
may be an economic option compared to other finance
because suppliers are in a position to save on information
costs in assessing a buyer's creditworthiness and in
collection and monitoring costs, particularly with regular
customers. The relative price of trade credit may therefore
be favourable. We might then expect that firms who have
long-term relationships with suppliers might use more
trade credit, and might obtain more favourable terms.
The lack of the fixed costs associated with arranging a loan
or line of credit and the administrative costs to the
borrower may also make trade credit more attractive.
Another factor which may make trade credit a more
attractive option financially is the motivation of the
supplier in extending it; although making a profit from the
credit side of the transaction is a potential motivation, it is
not necessarily the major determining factor - the suppliers
main business is usually the goods being sold. Alternatives
to the profit motive for credit extension are unlikely for
financial institutions, where the credit transaction is
primary business. The CMRC surveys support this notion,
suppliers indicated that they offered credit as a necessary
part of marketing their products and did not think of trade
credit as a potential substitute for bank credit when credit
terms are requested by a customer.
Transactions costs theory emphasises trade credit's
intermediary role in removing a requirement for
simultaneous action by both parties in a trade transaction,
(i.e. simultaneous exchange of money for goods and
services). Trade credit can be seen as a way of reducing the
transaction costs involved in trade exchange. A main issue
is the cost of making money available. To do this, firms
have to convert liquid assets into cash; there are costs to
doing this that may be greater if conversion is frequent
and/or for small amounts, consequently firms have a
demand for precautionary cash balances. Trade credit
reduces the need for this, particularly where there is
uncertainty in the trade exchange. For example, supplier
relationships are important; a firm facing variable and
uncertain delivery schedules with no trade credit available
has to take the risk of a delivery arriving when it does not
have available cash (and therefore incurs implicit or
explicit penalties). This risk level will, of course, influence
the size of the firms precautionary cash balance. Trade
credit gives a buyer notice of when cash is needed for
payments and thus allows them to keep reduced
precautionary balances and to plan movements from liquid
assets to cash in the most cost effective manner; this is
therefore a motive for buyers to use trade credit and we
might expect that uncertain delivery schedules would be
associated with more use of trade credit.
The above argument in fact gives rise to two motives; the
buyer can plan the management of cash versus liquid assets
more effectively optimising returns on assets (the cash
management motive), but the buyer will also potentially
reduce the number of transactions on their current bank
account (because one cheque may be able to pay many
invoices) thereby reducing banking costs (as most banks
charge businesses on a per transaction basis); we refer to
this as the transaction volume motive. The ability to group
invoices for payment at predicted dates in the future may
also make it easier for firms to organise payment by credit
transfer, which would again reduce bank charges as such
transactions usually have a lower fee compared with, for
example, cheques.
The businesses purchasing and delivery schedule would
affect the benefit they could potentially gain from the
transaction volume motive. If a firm requires frequent

Credit and Debt Management – 2008 Survey
62 Research and analysis by the Credit Management Research Centre, University of Leeds Business School
deliveries, particularly from a large number of suppliers
then they have the most potential for gain. Obviously a
business' purchasing and delivery schedule may in turn be
influenced by the availability or otherwise of credit terms;
if a firm has a transaction charge on each individual
purchase they might seek to have fewer, larger purchases
(if their business allows), the trade off being the additional
costs of holding extra stock. We might therefore expect a
positive relationship between use of trade credit and
frequency of orders as those who require frequent orders
have most motivation to use credit.
3.5 Late Payment and Bad Debt
The relative importance of trade creditors and debtors as an
asset and liability has increased in recent years, as shown
earlier. Trade debt, however, is a risky asset as a
component of the seller’s balance sheet. Trade debtors may
generate a future cash flow but need to be financed while
waiting for this cash to be paid. The financing costs of late
payment, additional and unanticipated collection costs
and/or bad debts all impact adversely on the profitability of
credit sales and working capital requirement. Thus,
management decisions regarding credit such as assessing
credit risk, extending credit and setting limits, and
managing/monitoring the credit cycle, are of central
importance.
3.6 Late Payment Trends
However, late payment as a phenomenon is enduring. The
CMRC Quarterly Review monitors payment behaviour
across a sample of 2000 enterprises. As can be seen to the
right, sales accounts which pay at or near the due date are
currently reported at 54%. This leaves 46% of all sales
accounts being reported as overdue by our panel of
respondents.
In terms of customer accounts, the proportion of customers
paying at or near the due date is slightly lower. 46% of our
survey panel state that customers at an account level pay
on time. This equates to 54% of all customer accounts
currently being paid late.
In the CMRC survey3
, when asked about late payment,
89% of firms responding to the survey admited that they
have sometimes faced late payment from customers.
Upon further analysis, we find that one-third of firms in the
sample receive more than 80% of payments at the due date,
while only one-third of firms receive less than 60% and
11% receive less than 20% of accounts at the due date.
These findings are similar, if we consider the accounts as
percentage of customers as opposed to sales invoices.
3 Credit Strategy and Corporate Performance, CMRC 2005
All
Chart 3.6.1 – % of Accounts Paying beyond the
Due Date (Source: CMRC)
(S C C)

Credit and Debt Management – 2008 Survey
63 Research and analysis by the Credit Management Research Centre, University of Leeds Business School
Smaller firms tend to have highest percentage of accounts
paid on time and the figure decrease in opposite direction
with firm size.
Firms in agriculture, hunting and forestry and hotels and
recreations tend to have higher percentage of accounts paid
on time, while firms in construction and business and
financial services have lower percentage of invoices paid
on due date.
In the manufacturing sub sector, textiles and upholstery
and transport equipment have the higher-than-average
percentage of invoices paid on time, while machinery
equipment, metal products and paper, publishing and
printing sector tend to be paid late.
Chart 3.6.2 – % of Companies Paying on Time
(Source: CMRC)
Chart 3.6.3 – % of Invoices Paid on Time – Sector
Analysis (Source: CMRC)
Chart 3.6.4 – % of Invoices Paid on Time – Sub
Sector Analysis for the Manufacturing Sector
(Source: CMRC)
0%
20%
40%
60%
80%
100%
Under 10 10 to 49 50-249 Over 250
Accounts as % of sales Accounts as % of customers
MEAN PERCENTAGE OF PAYING ON TIME - FIRM SIZE ANALYSIS
Employee size bands
Perc
enta
ge o
f firm
s
0% 20% 40% 60% 80% 100%
All sectors
Agriculture, hunting & forestry
Business and financial services
Construction
Hotels/ Recreation
Manufacturing
Retail distribution
Transport/ Communication
Wholesale distribution
Accounts as % of sales Accounts as % of customersPercentage of
responses
PERCENTAGE OF INVOICES PAID ON TIME - SECTOR ANALYSIS
0% 20% 40% 60% 80% 100%
Manufacturing
Food, beverage & tobaco
Textile & uphoistery
Paper, publishing & printing
Chemical, plastic & petroleum
Non-metalic products
Metal products
Machinery & equipment
Electrical & optical equipment
Transport equipment
Accounts as % of sales Accounts as % of customersPercentage of
responses
PERCENTAGE OF INVOICES PAID ON TIME - SUB-SECTOR ANALYSIS FOR THE MANUFACTURING SECTOR

Credit and Debt Management – 2008 Survey
64 Research and analysis by the Credit Management Research Centre, University of Leeds Business School
Debtor days and payment beyond the due date show the
picture of the extent to which payments are made after or
before the due date. The following figures analyse these
indicators to reveal more about the payment behaviour of
firms in the sample. 87% of firms in the sample cite a
debtor day figure of 30-89 and the average value of the
whole sample is 45 days.
Around two-third of firms receive payment from 0 to 30
days beyond the due date
Average debtor days figure is highest in medium firms (50-
249 employees). Large firms (over 250 employees) have
lowest debtor days as well as lowest number of days of
payment beyond the due date
Firms with a turnover from £10-19.9 million have the
highest payment beyond the due date figure, but at the
same time, have the highest debtor days. Firms with a
turnover from over £50 million have lower payment
beyond the due date, and firms with turnover from £20-
49.9 million have the lowest debtor days.
Chart 3.6.5 – Average Debtor Days
#
Chart 3.6.6 – Payment Beyond Due Date
Chart 3.6.7 – Payment Beyond the Due Date
Chart 3.6.7 – Debtor Days - Size Analysis
Chart 3.6.8 – Debtor Days - Turnover Analysis
Percentage of responses
0%
20%
40%
60%
80%
100%
0 to 29 days 30 to 59 days 60 to 89 days 90+ days
AVERAGE DEBTOR DAYS
Average debtor days
Perc
enta
ge o
f firm
s
Percentage of responses
0%
20%
40%
60%
80%
100%
0 to 14 days 15 to 29 days 30 to 59 days 60+ days
PAYMENT BEYOND THE DUE DATE
Payment beyond the due date
Perc
enta
ge o
f firm
s
0
10
20
30
40
50
60
Under 10 10 to 49 50-249 Over 250
Average debtor days Average payment beyond the due date
AVERAGE DEBTOR DAYS AND AVERAGE PAYMENT BEYOND THE DUE DATE - FIRM SIZE ANALYSIS (NO. OF EMPLOYEES)
Employees size bands
Num
ber o
f day
s
0
10
20
30
40
50
60
<1 1-2.4 2.5-4.9 5-9.9 10-19.9 20-49.9 >50 £ Millions
Average debtor days Average payment beyond the due date
AVERAGE DEBTOR DAYS AND AVERAGE PAYMENT BEYOND THE DUE DATE - TURNOVER ANALYSIS
Turnover size bands
Num
ber o
f day
s

Credit and Debt Management – 2008 Survey
65 Research and analysis by the Credit Management Research Centre, University of Leeds Business School
The average debtor days figure is high within firms in
transport and communication, followed by retail
distribution and some sub-manufacturing sector as paper,
publishing and printing, metal product, textile and
upholstery. To the contrary, ‘debtor days’ indicator is low
within firms in agriculture, hunting and forestry, business
and financial services, hotels with recreation and food,
beverage and tobacco sector.
The average payment beyond the due date figure is high in
transport, communication, wholesale distribution,
chemical, plastic and petroleum sector, and is low in
agriculture, hunting and forestry, retail distribution, non-
metal products, electrical and optical equipment sectors.
71% of responses indicate that their credit terms allow
them to charge interest on overdue accounts. There is
evidence for the positive correlation between the incidence
of firms having such a credit policy and firm size, implying
that large firms are more likely to have conditions of sale
that allow them to charge interest on overdue accounts.
58% of firms use the interest rate from 2% to 5%. 31%
charge a 6% to 10% interest rate on overdue accounts.
Interestingly, 12% of firms in the sample are willing to
execute this condition when it is needed (i.e. actually
charge interest on overdue accounts). However, 76% of
firms never or rarely to do so.
Around one third of firms in the sample see late payment a
serious or very serious problem for their businesses.
Chart 3.6.9 –Debtor Days – Sector Analysis
Chart 3.6.10 – Debtor Days – Sub Sector Analysis
Chart 3.6.11 –Interest Charged on Overdue Accounts
Chart 3.6.12 – % Firms Affected by Late Payment
0 10 20 30 40 50 60 70 80
All sectors
Agriculture, hunting & forestry
Business and financial services
Construction
Hotels/ Recreation
Manufacturing
Retail distribution
Transport/ Communication
Wholesale distribution
Debtor days Payment beyond the due date
AVERAGE DEBTOR DAYS AND AVERAGE PAYMENT BEYOND THE DUE DATE - SECTOR ANALYSIS
Number of days
0 10 20 30 40 50 60 70 80
Manufacturing
Food, beverage & tobacco
Textile & upholstery
Paper, publishing & printing
Chemical, plastic & petroleum
Non-metalic products
Metal products
Machinery & equipment
Electrical & optical equipment
Transport equipment
Debtor days Payment beyond the due date
AVERAGE DEBTOR DAYS AND AVERAGE PAYMENT BEYOND THE DUE DATE - SUB MANUFACTURING SECTOR ANALYSIS
Number of days
0%
20%
40%
60%
80%
100%
0-1% 2% to 5% 6% to 10% 10% +
RATE OF INTEREST CHARGED ON OVERDUE ACCOUNTS
Perc
enta
ge o
f firm
s
0%
10%
20%
30%
40%
50%
Not at allimportant
Very important
Domestic customers Overseas customers
IS LATE PAYMENT A SERIOUS PROBLEM FOR YOUR BUSINESS?
Perc
enta
ge o
f firm
s

Credit and Debt Management – 2008 Survey
66 Research and analysis by the Credit Management Research Centre, University of Leeds Business School
22% of firms seriously rate the threat of bad debt from
domestic customers on their operation. Firms in the sample
obtain an average receivables volume of £1.62 million
beyond 30 days and £0.35 million beyond 90 days.
The business and financial services and transport
equipment sector have the higher than average volume of
receivables beyond 30 days, while retail/wholesale
distribution, hotels, recreation, and construction.
Most of sub-sectors in the manufacturing industry average
below 30 days. Over 90% of firms have receivables
beyond 90 days while this figure for receivables beyond 30
days is 65%.
Chart 3.6.13– Receivables Beyond 30/90 Days
Chart 3.6.14 – Accounts Beyond 30/90 Days - Sector
Chart 3.6.15 – Accounts Beyond 30/90 Days
0%
20%
40%
60%
80%
100%
0 to 100k 100k to 500k 500k to 1m 1m to 5m 5m+
30 days 90 days
RECEIVABLES BEYOND 30/ 90 DAYS
Receivables
Perc
enta
ge o
f firm
s
0.0 0.5 1.0 1.5 2.0 2.5 3.0 3.5 4.0
All sectors
Agriculture, hunting & forestry
Business and financial services
Construction
Hotels/ Recreation
Manufacturing
Retail distribution
Wholesale distribution
£m30 days 90 days
AVERAGE RECEIVABLES BEYOND 30/ 90 DAYS - SECTOR ANALYSIS
Receivables
0.0 0.5 1.0 1.5 2.0 2.5 3.0 3.5 4.0
Manufacturing
Food, beverage & tobacco
Textile & upholstery
Chemical, plastic & petroleum
Non-metalic products
Metal products
Machinery & equipment
Electrical & optical equipment
Transport equipment
£m30 days 90 days
AVERAGE RECEIVABLES BEYOND 30/ 90 DAYS - SUB MANUFACTURING SECTOR ANALYSIS
Receivables

Credit and Debt Management – 2008 Survey
67 Research and analysis by the Credit Management Research Centre, University of Leeds Business School
Bad debt as percentage of turnover for the last year of
trading is recorded at 0.47% on average for the whole
sample. This level of bad debts represents £4,700 lost for
every £1 million of turnover. There are clear variations in
the amounts written off as bad debts in the sample.
Large businesses, the NHS and central government are
claimed by more than 40% of firms in the sample as slow
payers. These are followed by local government (37%);
individuals (37%), small businesses (34%) and European
commission (26%). Medium businesses appear to be the
most prompt payers, with only 24% of respondents
indicating them as slow.
Nearly half of firms (45%) conduct a formal analysis of the
reasons for late payment. Of these, 96% of record an aged
debt profile; 53% categorize customers into different risk
classe;, and 21% mark these customers on aged debt
reports.
We find that larger firms tend to have higher level of bad
debt written off. The following table presents the profile of
firms with a high level of bad debts. However, some levels
of bad debt are inevitable, but good credit management
practice involves growing profitable sales and minimising
bad debts.
Profile of firms with high level of bad debts - Large firms - Products are standardized and similar to those of other competitors - Operate in highly concentrated industries - Have higher frequency of daily order from customers - Use credit terms rather than price to promote sales
Firms with high level of bad debts appear to - Focus more on the importance of credit management to corporate
performance, especially on profit before tax - More likely to cope with corporate fraud by a documented fraud
response plan - Resort more to debt collection agents for receivables/ debt collection - More likely to use Alternative Dispute Resolution
0% 20% 40% 60% 80% 100%
Small businesses (less than 50 employees)
Medium businesses (50 to 99 employees)
Large businesses (200 to 499 employees)
Individuals
Central government
Local government
European Commission
NHS
Never Always
WHICH TYPES OF CUSTOMERS ARE SLOW PAYERS?
Percentage of responses
Table 3.6.1 – Profile of firms suffering from Bad Debt
Chart 3.6.16– Types of Customer who are Slow Payers

Credit and Debt Management – 2008 Survey
68 Research and analysis by the Credit Management Research Centre, University of Leeds Business School
3.7. Impact of the Late Payment Legislation
In the UK and EU, the crux of the recent debate on the late
payment of commercial debt, and its impact on small firms,
revolved around whether legislation, or simply improved
credit management practice, was required to alleviate the
problems. Various lobbying groups put forward cases for
and against the right to statutory interest and other policy
interventions. Others stressed the need for a greater
awareness of, and training in, 'best practice' credit
management. For example, the Institute of Directors (IOD,
1993) argued that the majority of overdue debtors can be
reduced by improved credit management. However, the
Forum for Private Business (FPB), a representative of
small UK businesses, was amongst the most vociferous
advocates of government intervention to mitigate the
effects of late payment on the smaller firm sector.
The policy prescription favoured by the FPB was the
statutory imposition of interest on late payment by debtors.
It was argued that such a provision would simultaneously
bind all firms into paying promptly, create a level playing
field in payment behaviour and ease the cash flow
problems of small firms, who will be compensated for any
overdue payments (HMSO, 1998). The 'causes' of late
payment behaviour are complex and summarised in the
diagram. Dominant customers are often able to leverage
cash-flow and profits if they have a good bargaining
position vis-à-vis their suppliers or very competitive supply
chains.
dominant customersdominant customersexploit competitiveexploit competitivesupplier marketssupplier markets
poor credit andpoor credit andfinancial financial
management;management;product/serviceproduct/service
qualityquality
undercapitalised firmsundercapitalised firmscredit rationing/credit rationing/
inappropriate financeinappropriate finance
Assertions About Late PaymentAssertions About Late Payment
financial distressfinancial distressand insolvencyand insolvency
financial difficultyfinancial difficulty
inefficienciesinefficienciesimperfect competitionimperfect competition
macro/financial environmentmacro/financial environment
Chart 3.6.17– Assertions about Late Payment

Credit and Debt Management – 2008 Survey
69 Research and analysis by the Credit Management Research Centre, University of Leeds Business School
Late payment is often a function of poor credit
management practices of the supplier or poor quality and
after-sales service. Firms in financial difficulty often
stretch their creditors in order to alleviate cash-flow
problems. These may be firms on the path to failure or
small and growing firms that have difficulty raising
institutional finance. The different and complex causes of
late payment behaviour suggests that policy measures
aimed at tackling late payment would have to attack the
problem in a number of ways and led to a vigorous debate.
A range of possible measures might have an impact.
Measures to tackle dominant bargaining positions of
customers; education and training in credit and financial
management and improvements in the flow of finance to
SMEs would all help as would macro-economic policies
that avoid boom and bust and consequent high levels of
business failure and financial distress.
Arguments against the statutory imposition of interest for
late payment were formulated in terms of 'contractual
freedom'; in that trade credit is often used as a competitive
tool and as a means of building trading relationships.
Suppliers may wish to retain the flexibility to vary
(informally) credit terms for specific customers, and
customers may value the freedom to negotiate payment
periods with their suppliers as financial circumstances
dictate. A further powerful argument against legislative
intervention contended that the imposition of statutory
interest might in fact, dwindle a key source of short-term
finance for the small firm sector. Small firms have been
shown to value trade credit as a source of finance for its
flexibility and freedom from formal restrictions. It is also
posited that trade credit is used widely by small firms who
are unable to obtain sufficient finance from other sources,
such as financial institutions.
competition policy – MMC, Office of Fair Tradingcodes of practice and improved information
Asymmetric Bargaining Power
Management Practice/inefficiency
education and awareness - credit and financial managementSME support services - out-placed and out-sourcedprogress - information and technological advances
Financial Markets/Banking RelationshipsFinancial Markets/Banking Relationshipsfunctioning of financial markets - financing SME’s
- growth and export financebanking relationships & efficiency
- informed decisions- specialist products
macro-economic management - smoothing the cycle- rescue culture
Possible Policy Measures ?
Chart 3.6.18– Possible Policy Measures

Credit and Debt Management – 2008 Survey
70 Research and analysis by the Credit Management Research Centre, University of Leeds Business School
CMRC in an empirical study of the demand for trade credit
by small UK firms, found strong evidence of a financing
demand for trade credit. They surmised that small firms,
which pay trade credit liabilities late, appear to do so when
they reach their limit on short-term bank finance. These
'credit rationed' firms were typically growing and export
oriented. In consequence, if the imposition of statutory
interest significantly reduces the trade credit offered to
smaller firms, this may lead to severe liquidity problems
and increased failure rates unless alternative finance is
readily available.
A number of other solutions to the problem of late payment
have been put forward. For example, it has been argued
that credit management is a neglected function in many
organisations with a focus on collection rather than the
front-end activities of negotiating, risk screening, using
credit information and establishing clear credit policies.
The CMRC identified poor credit management practices as
one of the underlying causes of late payment. In addition to
poor credit management practices, causes were considered
to include over reliance on trade credit and short term
finance and consequently an increased sensitivity to late
payments. The Bank of England report on finance for
small firms (BOE, 1996) observed a similar occurrence of
ad hoc credit management that was viewed as being
inefficient. They concluded that this was due to the
inherent lack of administrative resources in the small firm
sector.
It is argued that policies that emphasise the provision of
financial and credit management training for smaller
businesses would have a beneficial impact. This may also
raise awareness of the services and potential benefits of
credit insurance and factoring and the returns to
investments in information technology. Other measures
that have been proposed or implemented include voluntary
codes of practice; a British standard for payments; the
establishment of the 'Better Payment Practice Group'; the
compulsory disclosure of payment policies in company
accounts and the streamlining of legal procedures for the
recovery of debt. In response to the above debate, and
following a period of consultation, the current government
introduced legislation (the Late Payment of Commercial
Debts (Interest) Act 1998) entitling firms to claim a
statutory right to interest on late payment of trade debts, to
be phased in over four years.
The first stage, introduced in November 1998, allows only
the smallest companies to claim interest from larger
companies and the public sector in recognition of their
vulnerability to dominant customers. Small firms had a
statutory right to interest from each other two years later,
and large firms will be able to claim interest from 2002.
In 1998, the Credit Management Research Centre was
commissioned by the Department of Trade and Industry to
monitor the proposed introduction of the Late Payment of
Commercial Debts (Interest) Act.
Referred to as the Government’s Late Payment
Observatory by Barbara Roche (Hansard 1997), the CMRC
was able to construct a panel of 1100 Credit Professionals.
It was agreed that the Observatory would also identify best
practice in credit management so that small businesses can
benchmark their own performance. The CMRC then
developed a quarterly trend database to assess the impact
of measures introduced to combat late payment and
provide an indication of changes in credit management
culture in the UK. 82% of businesses were aware of the
Late Payment Legislation in 2002.

Credit and Debt Management – 2008 Survey
71 Research and analysis by the Credit Management Research Centre, University of Leeds Business School
The number of firms using the legislation has consistently
been low with figures showing it to be 5% of those eligible
(CMRC Quarterly Review, 1999, 2000, 2001, 2002).
CMRC have argued for some time that actual use of the
Legislation is not necessarily a measure of the overall
effectiveness. Relations between the payment behaviour
and patterns of payment are far more complex and this
report attempts to examine firms’ attitudes to the statutory
right to charge interest on late payments and highlights
other key indicators of late payment to provide a
comprehensive review of large and small firms in terms of
late payment in 2002. A large number of firms in the
sample (79%) are aware of the UK first phase (November
1998) and second phase (November 2000) of the late
payment legislation. But only 38% of firms actually make
their customers aware of their rights under the late payment
legislation when negotiating terms and conditions for
granting trade credit. 36% of these firms admit that being
charged interest makes them pay a debt more quickly than
otherwise would have been the case.
It seems that firms in the sample have not placed high
expectations on the effect of the Legislation on the UK
payment culture. 69% of sample firms have a neutral
opinion about this.
21% of firms see it is advantageous and around 10% show
a negative feedback: ‘the legislation/ Directive will
generate detrimental impacts on the UK payment culture in
the long term’. We find that those firms that have high
expectations about the effectiveness of the Legislation are
those that view bad debt and late payment as a serious
problem for their businesses. They tend to conduct formal
analysis of the reasons for late payment and are more likely
to apply the third phase of the legislation in charging
interest on late payments.
However, for the whole sample, firms show some
hesitation when being asked whether they would use the
third phase of the legislation to charge interest on late
payment. 57% of sample firms confirm that they would not
do it for any customer. 35% of firms do so to some
customers and only 3% apply for all customers. Not many
firms quote a specific reason for this, but a great part of the
obtained responses (20%) rely on the fact that the
relationship with customers will be damaged if they do so.
Nonetheless, if the situation worsens, 78% of sample firms
are willing to pursue late payments through the courts and
97% of them are willing to consider claiming interest for
late payment. As expected, firms that specify their rights
under the late payment legislation when negotiating terms
and condition of credit grants are more likely to pursue late
payments through the court.
Do you pursue late payment through the courts (1)
Sub-group of firms that
specify their rights
Sub-group of firms that do not specify their rights
Significant
0.87 0.73 0.011* * Significant at 5% level, (1): ‘0’ for ‘no’ and ‘1’ for ‘yes’
Table 3.6.2– % of Companies Pursuing Late Payments through the Courts

Credit and Debt Management – 2008 Survey
72 Research and analysis by the Credit Management Research Centre, University of Leeds Business School
62% of firms are not willing to receive more information
about the legislation. This is reasonable as most of these
firms are aware of the UK first and second phase of the late
payment legislation.
3.8. Use of Third Parties in Credit Management
Once a firm has decided to offer trade credit, an important
decision relates to the way in which the firm chooses to
organise its credit management process.
Statistical evidence shows that firms that are not aware of
the late payment legislation are requesting more
information about how to implement it.
There is a scale of strategies from full integration of the
credit function within the organisation (i.e. vertical
integration) through to externally run credit management
(i.e. contracted out to agents).
The need for further
information of the legislation (1)
Sub-group of firms are
aware of the legislation
Sub-group of firms that are not aware of
the legislation
Significant
0.31 0.67 0.000** ** Significant at 1% level, Value for (1): ‘0’ for ‘no’ and ‘1’ for ‘yes’
CUSTOMERS
SUPPLIERS
CREDIT MANAGEMENT
AGENTS IN HOUSE
Services provided by Agents
Credit References Debt Collection
Credit Insurance Invoice Discounting
Factoring
Credit Management Functions
Credit Risk Assessment Credit Granting Decision
Sales Ledger Administration Collection of Monies Owing
Financing Accounts Receivable Bearing Credit Risk
Table 3.6.3– Awareness of the Late Payment Legislation
Chart 3 6 19 Awareness of the Late Payment Legislation

Credit and Debt Management – 2008 Survey
73 Research and analysis by the Credit Management Research Centre, University of Leeds Business School
Thus, organisations may choose to manage the entire credit
administration process 'in-house'. In contrast, however,
some or all of these activities can be 'out-sourced' to
specialised institutions that perform the various credit
administration functions. There are, of course, various
institutions or agents that will provide services for credit
management: factoring companies who will take over a
company's sales ledger and collect outstanding balances on
behalf of the company (finance, collection and, in some
cases, risk-bearing); credit insurers who will insure trade
credit against bad debt risks (credit risk assessment and
risk bearing); credit reference agencies who provide
information about companies or individuals with which
people may wish to trade and, by providing credit ratings
or credit scores, advise on the risks of dealing with certain
customers (credit risk assessment); and debt recovery
agents who will recover monies owed, directly or via the
legal system (collection and recovery).
The services provided by these organisations have, in the
past, overlapped to some extent but nonetheless remained
quite distinct. However, this situation is changing quite
rapidly. Almost all organisations in credit services have at
their 'core' a large I-T investment in the collation and
management of corporate databases and 'data warehouses'
that support their various credit service activities.
Consequently, as information technology progresses, the
boundaries between companies engaged in credit
insurance, credit reference provision, factoring and debt
management and collection activities are becoming
increasingly blurred as each can develop new products
which cut across these various inter-related services. For
instance credit insurers can feasibly offer credit reference
information, market intelligence, debt collection services
and general credit management advice. Credit insurers can
also work with banks and other finance providers to offer
finance packages collateralised by insured trade debt.
Developments in information technology facilitate the
development of credit management and credit insurance
packages targeted to specific corporate sectors (e.g. small
and growing firms). The rapid growth in the number of
debt collection and related services on the internet offering
'on-line' collections will clearly have an impact on the
structure and economics of the commercial debt collection
industry.
Information and communication technologies have
improved the interface between the service provider and
the customer via 'on-line' links and have considerably
speeded up response times for, say, chasing debtors. The
move is now to a greater degree of 'customer focus' and
market segmentation within the credit services industry.
Moreover, technological developments are changing the
economics of the costs and benefits of 'in-house' versus
'out-sourcing' decisions at the level of the firm. Whereas
scale economies and economies of information may have
made contracting out elements of the credit management
function more cost-effective in the past, developments in
information provision and the lower costs of data
warehousing and analysis may have shifted the balance in
favour of in-house credit management for some larger
organisations. For the smaller and medium-sized
organisations, on the other hand, that now find themselves
trading at greater geographical distance, utilising the
services of large-scale and global credit service providers
may prove an attractive and cost-effective solution.

Credit and Debt Management – 2008 Survey
74 Research and analysis by the Credit Management Research Centre, University of Leeds Business School
Developments in electronic trading and payment systems
may impact upon the demand for credit insurance and other
credit services. Corporate credit cards, debit cards and
payment cards (a corporate charge card which logs
purchase order and VAT information about transactions)
can be considered as substitutes for certain of these
services should they become widespread in the future,
although they may not be options for all firms (those with
high value goods for example). All these systems offer the
seller guaranteed money within a few days. Effectively
from an administrative point of view all transactions are
like cash (or perhaps cheque) sales; there is no need to
support a sales ledger and there is no need to assess and
take on credit risk. The possibility that a significant amount
of trade credit risk may shift to the financial services
provider (e.g. purchase card provider) has obvious
implications for the out-placed collection industry since it
implies collection activity moving in-house to the large
volume lenders.
3.8.1 Factoring and Invoice Discounting
Factoring is an important source of finance for businesses
with growing sales but low asset bases. The global market
for domestic factoring is nearly £800 billion with Europe
accounting for around 70% of the total global market.
Cross border factoring generates £68 billion17
.The UK
has a well established market for factoring services. By
July 2006, total advances by FDA members to business
was around £4.5 billion. Growth in the demand for has
been relatively low during the last 3 years in contrast to the
value of Invoice Discounting which has exhibited strong
growth since 2000 and stands at around £ 30 billion in
2005.
Domestic Factoring £M
0500
100015002000250030003500400045005000
Mar-95
Mar-96
Mar-97
Mar-98
Mar-99
Mar-00
Mar-01
Mar-02
Mar-03
Mar-04
Mar-05
Domestic Fcatoring
Domestic Invoice Discounting
0
5000
10000
15000
20000
25000
30000
35000
Mar
-95
Mar
-96
Mar
-97
Mar
-98
Mar
-99
Mar
-00
Mar
-01
Mar
-02
Mar
-03
Mar
-04
Mar
-05
Domestic Invoice Discounting
Chart 3.6.20 – Domestic Factoring Trends (Source: FDA)
Chart 3.6.21 – Domestic Invoice Discounting Trends (Source: FDA)

Credit and Debt Management – 2008 Survey
75 Research and analysis by the Credit Management Research Centre, University of Leeds Business School
Export factoring and export invoice discounting advances
were in the region of £250m and 1.1billion respectively.
Again invoice discounting advances show the strongest
growth.
The Bank of England4
point out, however, that for firms
with a turnover of less than £1million factoring provided
just less than £1billion in finance compared to the £9
billion that bank overdrafts provide as a source of finance.
The data to the right demonstrates that most of the growth
in the demand for factoring came from firms with
turnovers in the region of £1-10million. Table shows the
average amounts advanced by size of firm. The amounts
involved are considerably larger than the average overdraft
(approx. £10k).
4 Bank of England 11th Report on Financing of Small Firms
0
200
400
600
800
1000
1200
1 3 5 7 9 11 13 15 17 19 21 23 25 27 29 31 33 35 37 39 41
Export FactoringExport Invoice Discounting
Chart 3.6.22 – Export Factoring and Invoice Discounting (Source: FDA)
Chart 3.6.23 – Firms using Invoice Finance (Source: Bank of England)
Chart 3.6.24 - Growth in Demand for Factoring (Source: FDA)

Credit and Debt Management – 2008 Survey
76 Research and analysis by the Credit Management Research Centre, University of Leeds Business School
3.8.2. Credit Insurance and Related Services
Credit insurance is traditionally used by companies to
protect their business against bad debts, payment delays
and protracted default which can seriously erode
profitability and liquidity. The size of the trade credit
insurance market, measured by global premiums, is in the
region of £3.75 billion. The market is dominated by
increasing global trade and the development of new
markets in China, Asia and Eastern Europe has stimulated
the growth of credit insurance particularly in the latter
regions. Growth in the US has been slow and Western
Europe has experienced only moderate growth in recent
years but still accounts for almost 75% of the total global
market. Penetration rates in the major European markets
and the US have generally increased over the past 15 years
although France and Italy have experienced a downturn in
the share of GDP in the new millennium. The penetration
rate in the US is very small but rising.
The market structure for credit insurance provision can be
characterized as oligopolistic, concentrated yet
competitive. Recent years have witnessed consolidation via
merger activity. The 4 largest players, Atradius, Euler
Hermes, Coface and Credito y Caucion have a combined
market share of over 80%. Credit Insurance is an industry
where there are considerable economies of scale and scope,
particularly in information, I-T and networks brought about
by the necessity of having a global coverage. Credit
insurance is a very cyclical business in terms of premium
generation, claims and profit/loss. Claims/losses vary with
the business cycle and particularly the aggregate
insolvency rate of businesses in the economy.
Clearly the growth in internet and information technology
has helped reduced the cost base of credit insurers as they
increasingly integrate their information systems with those
of their clients. Increased connectivity has to some extent
facilitated the growth in direct selling as apposed to
broking or, at least, extended the broker-base by enabling
smaller players to enter the market. Alliances with banks
and factoring companies has help to extend the reach of
credit insurance.
0.00%
0.01%
0.02%
0.03%
0.04%
0.05%
0.06%
1990
1992
1994
1996
1998
2000
2002
2004
USA Germany FranceItaly Austria Switzerland
World Market 2004 ICISA members (credit insurance)Total Market appr. EUR 4,56 bn
Credito y Caucion8,6%
CESCE2,4%
Coface17,8%
Mapfre2,5%
QBE1,7%
AIG2,4%
Others11,5%
Atradius21,1%
Euler Hermes34,4%
Chart 3.6.25 – Credit Insurance Growth (Source: ICISA)
Chart 3.6.26 – World Market for Credit Insurance (Source: ICISA)

Credit and Debt Management – 2008 Survey
77 Research and analysis by the Credit Management Research Centre, University of Leeds Business School
The penetration of credit insurance in the SME market has,
over the past decade, been poor but is seen as the market
segment that has the most to benefit form credit insurance
products and the most potential for growing premiums and
cross selling other credit management services in the
future. In particular credit insurers have increasingly
marketed bundled services that attempt to offer a ‘credit
management solution’ rather than just insurance cover and
have necessarily diversified into receivables management,
credit and market information services, collection services
along with risk coverage.
A recent survey undertaken by the CMRC5
suggested that
the penetration of credit insurance amongst SMEs was less
than 2% compared to around 30% in the largest company
sector. Given that SMEs are the predominant form of
business across Europe and the globe then the potential
market for credit insurance and credit management services
is huge. In a recent survey of UK businesses undertaken by
CMRC6
firms were asked why they do not use credit
insurance.
5
Nicholas Wilson and Don Leahy (1998): “Credit insurance in
the UK and Europe”, The Stationery Office.
6
Corporate Strategy and Growth, CMRC, January 2005
The main reasons cited were that credit insurance was
perceived to be too expensive (68% of firms). The second
highest reason was that firms believed that credit insurers
provided inappropriate cover (51.2%). 39% do not use it
because they believe that it requires too much
administration and reporting. 21% thought credit insurance
had a poor image and 25% used other credit services. The
results of this part of the survey are summarized in the
chart below.
05
101520253035
Small enterprises (<10 Mn. €)Medium-sized entities (between 10 and 150 Mn. €) Large companies (>150 Mn. € turnover)
Not at all Very much
1 2 3 4 5 Poor insurance image 20.9 11.6 46.5 7.0 14.0 Too expensive 0.0 2.0 30.0 22.0 46.0 Inappropriate cover 7.0 7.0 34.9 23.3 27.9 Involve too much admin/ reporting 7.3 19.5 34.1 12.2 26.8
Use other credit services 25.0 10.7 39.3 14.3 10.7 Table : Why do you NOT use credit insurance – percentage of responses
Chart 3.6.27 – Use of Credit Insurance by SME’s (Source: ICISA)
Table 3.6.4 – Reasons for not using Credit Insurance (Source: CMRC)

Credit and Debt Management – 2008 Survey
78 Research and analysis by the Credit Management Research Centre, University of Leeds Business School
Credit insurance can be made more attractive to the SME
market through increased automation to both reduce the
cost base of the service and reduce the administration and
reporting burden by developing better software interfaces
with the client and simplifying the reporting/claims
process.
Further ground could be made in this market by extending
the range of services offered and marketing the ‘product’
by emphasizing the impact that good credit management
practice can have on the overall business performance, i.e.
that the credit insurer is offering a credit management
solution that has a wider impact than merely protecting
cash-flow. Such re-branding could involve developing the
range of services offered, improving and modifying
existing services and/or changing the ‘image’ of existing
services via marketing activities.
The obvious benefits of using credit insurance are that it
transfers credit risk to insurers; it protects the insured
company’s balance sheet and reduces uncertainties in
earnings; it provides a variety of related services:
continuous monitoring of the creditworthiness of the
insured’s customers, maintaining account receivables,
suggesting payment and delivery conditions and supporting
debt collection; it can improve access to financing in that
firms with credit insurance can get better credit terms from
banks since the debtors book is collaterised. Finally, it can
help to generate sales and repeat business through agreed
credit limits.
In the survey cited above, when credit insured businesses
were asked why they use credit insurance, 85.9% of firms
in the sample respond that the do so for peace of mind. The
second highest reason is to protect cash flow (74%). Only
16% and 21.8% of firms use credit insurance to raise
finance and to enter new markets.
Not at all Very much
1 2 3 4 5 Previous bad debt experience 12.3 16.8 23.5 22.9 24.6 To grow the business 17.1 17.6 24.1 27.6 13.5 To protect cash flow 4.4 6.1 15.5 40.9 33.1 Helps raise finance 29.6 32.0 22.5 8.3 7.7 Help enter new markets 25.9 30.0 22.4 15.9 5.9 To improve knowledge of customers 13.1 16.6 26.9 28.6 14.9
Peace of mind 3.1 0.6 10.4 35.6 50.3
Table 3.6.5 – Reasons why companies use Credit Insurance (Source: CMRC)

Credit and Debt Management – 2008 Survey
79 Research and analysis by the Credit Management Research Centre, University of Leeds Business School
A recent CMRC survey showed that those companies with
credit insurance were more likely to indicate that they
received preferential credit terms from their own suppliers
thus improving the overall cash and working capital cycle.
Credit insured firms are more likely to gain the confidence
of the supply chain because their own cash-in position is
more certain and therefore they are less likely to pay
suppliers late.
Moreover, 43% of businesses suggested that credit
insurance is useful for generating customer knowledge.
The users of credit insurance showed that they have to
spend less time resolving disputes and chasing late payers,
they have better control over cash flow and understanding
of the customer portfolio and they are more likely to have
software packages that improve the management of the
customer and sales ledger. It is clear, therefore, that credit
insurance has a wider impact on the overall customer
relationship management and the overall performance of
the business. Emphasis on these wider impacts may attract
new customers for all markets and particularly SMEs.
The chart below outlines the traditional view of the
benefits of credit insurance as a means of helping to protect
and manage cash-flow and customer risk. The technology
and information used in managing a credit insurance policy
however confers other benefits. A secured trade debtor
book can be useful in obtaining other sources of finance
from the banking sector and may help to reduce the firms
cost of capital and access to finance. Credit insurance can
indirectly help to improve supplier relationships. A credit
insured business is probably in a better position to pay its
own suppliers promptly and therefore may get preferential
credit terms form suppliers and enjoy a more stable
supplier base. Credit insurance can facilitate improved
customer relationship management by generating more
customer ‘knowledge’, having the systems in place to
better manage and resolve invoice disputes and confers
advantages form being able to offer customers both credit
and products/services. Finally, the information base of
credit insurers can be utilized to identify new market and
customer opportunities and facilitates speedy decision-
making in respect of new requests of credit accounts and
limits.
Cash-flow and Debt
management
Banking Relationship,
Cost of Capital
and Financing
Supplier
Relationship
Management
Customer
Relationship
Management
Traditional area of focusTraditional area of focus
- intelligence- technology
Table 3.6.28 – Traditional Benefits of Credit Insurance (Source: CMRC)

Credit and Debt Management – 2008 Survey
80 Research and analysis by the Credit Management Research Centre, University of Leeds Business School
4. Large Volume Debt Management – Actual Case Studies
4.1. Introduction and Objectives In this section, we report a synthesis of interviews with
organisations involved in large volume debt management.
The aim is to provide a framework from which an
organisation can begin to assess whether they are
employing good practice in relation to the collection of due
and overdue debt in terms of: (1) taking enough action to
prevent debt from occurring; (2) pursuing debts quickly by
using appropriate methods to obtain payment cost
effectively; and, (3) investing in debt management systems
and more sophisticated recovery activity in order to collect
cost effectively within the ‘regulatory constraints’.
We examine trends and developments in debt management,
debt collection and recovery and look at the processes and
practices of large volume lenders in the consumer credit
industry and utlilties. The study looks at current practices
in collections and recovery amongst large volume lenders
and looks at the forces recent driving change in the credit
and collections departments. The report highlights new
approaches to collections and customer-base management
including new technologies and innovations and attempts
to assess the performance impact of these new investments.
We review recent trends in the collections strategies and
the general approaches taken towards customer
indebtedness, collection and recovery. The analysis
examines the path through which debts are processed, the
timing of various collection/recovery actions (i.e. the ‘debt
path’) and the effectiveness of actions at each stage. The
focus of this part of the study is to identify ‘best practice’
in collection and recovery departments and ascertain the
processes, procedures and technologies that help to
minimise the level of ‘un-collectable’ and ‘bad debt’ from
the domestic (household) market.
Organisations providing financial services have a different
context and regulatory environment than organisations
providing gas, electricity, water and telecoms. Financial
services are in effect competing for debt and customers but
have to maximise collections performance and minimise
bad debt losses within a relatively short time horizon on
individual accounts. Water suppliers have limited sanctions
against late and non-payers in that they cannot disconnect
supply and have no choice over their customers. Gas and
Electricity suppliers have some choice over their customers
and can take action to secure payments from riskier
customers (pre-payment meters, deposits, credit
references). They have, of course, the sanction of
disconnection to non-payers. Gas and Electricity
companies, however, have to compete for customers and
the industry has been subject to considerable restructuring
(mergers, acquisitions, outsourcing customer service and
collections). We draw upon evidence of ‘good practice’ in
this sector from a series of structured interviews and a
forum that has been devoted to benchmarking credit and
collections performance and credit/debt management
practices. We are able to identify the good performers in
then UK utilities from the Utilities Benchmarking Forum
data-base and analyse the specific factors that appear to
impact on debt levels in this sector. From this we are able
to draw up a check-list of perceived ‘good practice’ in the
sector.
The section is organised as follows. First we provide a
generic overview of the credit account life-cycle. We then
examine current good/best practice in debtor management
and collections as synthesised from the various case

Credit and Debt Management – 2008 Survey
81 Research and analysis by the Credit Management Research Centre, University of Leeds Business School
studies. We then provide a summary of the findings from
the surveys undertaken since our first study in 1998 in
order to trace major trends. We then report on the case
studies and updates.
4.2. Background to the Credit Account Life-cycle
4.2.1. Customer Life-Cycle
This section provides some background to the typical
processes and stages in the management of a credit
account. In financial services lenders are typically starting
to move towards a ‘customer-level’ view of individuals not
only across different products but over the possible life-
time of the customer. Although this section focuses on the
management of individual accounts it is worth noting that
financial services may take a life time view of the
profitability of a customer and manage individual accounts
with cross-selling opportunities in mind and long term
profitability as an objective.
Chart 4.2.1 – Customer Life-Time Management
4.2.2. Account Life-Cycles
Although the operational processes and strategies will
differ between lenders there are some basic, common
elements. Credit accounts will generally go through a
series of stages, illustrated below. The consumer credit
sector is characterised by lenders that typically deal with
large volumes of accounts and consequently manage
millions of relatively low value transactions on a day-to-
day basis.
The stages in the process of account management equally
apply to the trade credit, business to business context. In
the latter case the lender will typically have a much smaller
customer-base and higher average invoice/order value. An
examination of the credit account life-cycle provides a
useful background from which we can examine the main
trends and forces driving change in debt collection as
gleaned from the series of interviews undertaken over the
past 10 years.
Chart 4.2.2 – The Customer Account Life-Cycle
Marketing/Recruitment
ApplicationProcessing
AccountIn Use
Authorisations andAccount Management
Collectionsand Recovery
Set UpAccount
New Prospects

Credit and Debt Management – 2008 Survey
82 Research and analysis by the Credit Management Research Centre, University of Leeds Business School
The usual way of classifying consumer credit products is as
either 'revolving credit' or 'fixed term credit'. Revolving
credit allows the customer to make purchases up to an
agreed credit limit, regular (monthly) payments by the
customer release available credit and allow further
purchases to be made. There has, of course, been a recent
proliferation of segmented Credit Card products and many
variations under the revolving account heading. The other
main type of credit account, fixed term credit, involves the
customer paying for a single purchase or paying off a loan
by instalments.
The number of instalments and the payment regime are
usually fixed at the start of the credit agreement. Recent
trends have seen a general increase in the repayment terms
of personal loans (from 3 years a few years ago to 5-10
years now). Of course customers that have experienced
payment difficulties on credit card or loan products may
have put in place an ‘arrangement to pay’, i.e. a fixed
monthly payment plan aimed at recovering debt over a
longer time period.
The application process for a new financial product is an
important means of establishing the customer's credit
worthiness and risk profile. Information is generally
gathered via account/product application forms which can
vary from simple coupons in magazines asking for only
name address and telephone number, (as in the case of
some mail order catalogues), to forms covering several
pages and requesting detailed financial information such as
salary and balances outstanding on current credit
agreements. Of course there are often informational
asymmetries between lender and borrower at this stage.
The lender may not have a complete picture of the
borrowers assets, liabilities and future prospects.
It is important for lenders to ascertain a profile of the
potential borrowers past behaviour (e.g. payment pattern
on previous loans), current behaviour (e.g. how is the loan
applicant handling their credit cards or current account)
and total credit commitments. The latter is particularly
important, as borrowers will now typically spread their
outstanding credit across multiple products and multiple
lenders. Most credit grantors in the UK contribute to closed
user groups, such as CAIS or Insight, which provide
information on the accounts the applicant has currently, or
has had, with other credit grantors, i.e. total credit
exposure. Credit reports can be obtained from Credit
Reference Agencies, which provide details of, for example,
the Electoral Roll at the applicant's address (to check
residency), county court judgements against the applicant,
or recent credit searches done by other credit grantors. The
CRA data-bases have recently been considerably enhanced
by the major lenders HSBC and Natwest agreeing to share
account level information and the development of
indebtedness indices that evaluate an individuals debts in
relation to disposable income. Some lenders will now score
applicants according to risk and their forecasted ability to
service outstanding debts.
17
Credit Application
Cre
dit
App
licat
ion
Data Input
Cre
dit
App
licat
ion
Data Input
DECLINEDECLINE
Decision Engine
ACCEPT REFER
Manual ReviewProofs
DECLINEDECLINE
Decision Engine
ACCEPT REFER
Manual ReviewProofs
DECLINE
Decision Engine
ACCEPT REFER
Manual ReviewProofs
DECLINE
Decision Engine
ACCEPT REFER
Manual ReviewProofs
Other Data Gathering
Internal Files
CRA Bureau
Data
Other Data Gathering
Internal Files
CRA Bureau
Data

Credit and Debt Management – 2008 Survey
83 Research and analysis by the Credit Management Research Centre, University of Leeds Business School
The Basel II initiative has drawn attention to lender risk assessment systems but more work can be done in this area. Risk assessment at the point that the customer applies for credit has, historically, utilised credit scores that rely on information regarding the applicants past performance on credit accounts. New scoring systems, that are more forward looking, and factor in a more complete picture of the customers’ indebtedness in relation to current and potential income flows along with features reflecting the impact of interest rate changes and the economic cycle will undoubtedly lead to a reclassification of portfolio risks”.
Thus an integral part of the process is application scoring,
based on the consumer's characteristics, and automated
(accept/reject) or manual (review) decision processing. For
instance, the credit granting decision process may involve a
mixture of credit scoring, applying the company's policy
rules, and human judgement. There may also be checks
against the company's in-house information; for example
checks for duplicate applications, checks for fraud and
checks on the applicant's performance on other credit
accounts held with that company.
Usually a decision process will have three outcomes;
accept, reject and refer (referred applications could be
those with scores around the borderline, for example, or the
company may have policy rules to refer certain types of
application). Referred applications will usually be
processed by more senior staff, with queues of applications
to be reviewed being maintained by the system.
The Application Processing system may also make
decisions in areas such as the setting of credit limits.
Consumers that have several credit accounts with the same
credit grantor, (several store cards can be run by one
finance company for example), may be set a credit limit on
their new account based on their exposure on existing
accounts. Alternatively, the lender might set an overall
credit limit for the customer. This total limit may be
distributed across accounts and products. Application
scores may allocate new accounts into certain life-style
clusters or segments which are then used in account
management and or for cross-selling. In mobile phone life-
time value, risk and fraud are key dimensions that are often
assessed at the account set up stage since recovering the
initial investment in the customer (handset and network);
managing fraud in a fast moving market and managing
payment risk are key to a profitable relationship. In the
utilities, assessing risk in order to match the appropriate
payment method and plan; securing deposits where
necessary and clustering customers according to
consumption patterns and life-style indicators can be
valuable in managing collections and overall customer
profitability.
Account management involves a variety of activities that
take place either on a regular basis or in response to
specific circumstances or behaviour. One objective is to
keep the customer in account management and prevent
progression into delinquency and recoveries. Some lenders
put effort into identifying payment risk pre-delinquency by
monitoring transactions and potential over-commitment.
The figure overleaf taken from Wilson and Summers (1998
p45) summarises the regular activities that a typical
account management system would support.

Credit and Debt Management – 2008 Survey
84 Research and analysis by the Credit Management Research Centre, University of Leeds Business School
The key activity is processing payments and allocating the
funds to the appropriate accounts. A variety of payment
methods/options are usually offered (cash, cheque,
standing order, direct debit, switch, bank transfer etc)
although individual lenders may encourage particular types
of payment method.
Direct debits are usually processed within the BACS
system. BACS distribute payment requests to the banks
concerned. Direct debits can be used to make variable
payments, for example paying either a full amount
outstanding or a minimum payment on an option account,
such as a credit card. Direct debit is regarded as an
attractive payment method for fixed term loans and is
increasingly encouraged for revolving credit as a risk
management device. The latter was not the case a few
years ago since most credit card profit/income comes from
interest on the balance outstanding.
Account management systems have to be able to cope with
payments that cannot be matched to accounts. These can
arise from, for example, incorrectly stated account numbers
on a standing order or when a cheque and payment slip
become separated.
Unmatched payments are normally posted to a suspense
account and both automatic and manual efforts will be
made to match them to an account, perhaps using the name
on the cheque or an expected payment value to search for
potential matching accounts. The payments in suspense can
be interrogated if a customer queries an un-posted
payment.
In addition to payments, for revolving credit accounts there
will also be transactions representing purchases made with
the account and potentially credit notes if, for example,
goods are returned. Many transactions are now recorded
electronically although paper vouchers are still in use,
particularly in smaller outlets taking credit cards. Details of
transactions may come to the lender direct or through
intermediaries, as is the case with credit cards. Some
transactions may also be generated automatically, for
example, the annual fee on a credit card or insurance
charges for things like payment protection.
Account Management Functions
Regular As Required
Transactions Authorisations Payments Credit lim it changes Calculate interest Address changes Statements Settlement Account renewals Correspondence Merchant support Lost cards Diary/Account history Missed payments Insurance Over limit processes Behavioural scoring Strategy management Fraud detection
Table 4.2.1 – Account Management Functions (Source: CMRC)

Credit and Debt Management – 2008 Survey
85 Research and analysis by the Credit Management Research Centre, University of Leeds Business School
Scoring models are increasingly used at all stages of the
account life-cycle. Increasingly profitability or debt
servicing ability may be ascertained at the point of
application. Scores to detect early signs of problems and
the likely debt path from ‘self-cure’ to arrears may aid the
collection process by either taking no action in the case of
‘self-cure’ individuals or fast tracking cases through the
collection sequences. Litigation scores may be used to
assess the likely success of legal action and scores may
help in pricing debt for sale.
These scores under the generic heading of behavioural
scoring are used at various stages of the accounts life. The
production of behavioural scores (see later for an overview
of Behavioural Scoring) which provide an indication of
the way an account is being conducted and the level of risk
it represents, may be produced by the Account
Management system itself or by a separate system
interfacing with it. If an account goes into arrears the
Account Management system may either manage the
collections process itself or pass the account's details to a
separate collections system. If the lender uses behavioural
scoring then systems need to be in place to regularly
update the behavioural scores. These may be part of the
account management software or may be provided by a
link to a separate system.
Alongside behavioural scoring there may also be strategy
management processing; for each account a strategy may
be assigned for anticipated circumstances, such as a request
for an increased credit limit or missing a payment, based
on the behavioural score and/or other factors.
Increasingly, account management systems will keep a
record of the history of each account, showing all the
transactions applied to it, and a diary of contact with the
account holder on any actions in progress, such as
following up queries about statements. These will be of use
to the customer services department when contact is made
with the account holder, as well as, the historic information
Account Management Early Delinquency Recoveries
Collections Environment Recovery/ SaleDebt Prevention
‐Application scores‐ Limit Scores‐ Affordability scores‐ Revenue/Risk Score
‐ ‘Self‐Cure’ Score‐ Roll Rate Score ‐ Behaviour Score‐ Collection Score
‐ Recovery Score‐ Litigation Score ‐ Debt Price
Chart 4.2.3 – Scoring in Account Management

Credit and Debt Management – 2008 Survey
86 Research and analysis by the Credit Management Research Centre, University of Leeds Business School
being potentially a useful input to behavioural scorecard
development. Information collected from contact with a
customer in arrears may be used to modify collections
strategies that are being determined automatically. An
obvious case is where an otherwise prompt paying
customer has got into arrears because of a unexpected
event such as loss of income, accident or illness.
Account management systems have to be able to deal with
authorisations. On revolving credit accounts there can be a
requirement for sales over a certain value to be authorised
before they go ahead. This can be done by a phone call or
automatically when the card is swiped through an EFTPOS
terminal. Checks done at authorisation stage might include
calculating whether the transaction will take the account
over its credit limit and an assessment of the likelihood of
fraud on a large transaction. As indicated earlier plastic
card fraud is a major and escalating problem. Fraud is one
area where non-statistical models such as expert systems
and neural networks are most often used rather than
statistical models. These techniques can cope with the
rapidly changing nature of fraud, and identify new patterns
of fraudulent behaviour. The identification of a potential
fraud can result in customer services contacting the
account holder and checking on the transaction.
Account management software will need to check credit
limits as transactions are posted. When an account goes
over the limit a decision is needed on the action to be
taken, and some evaluation made of whether the problem is
likely to be a result of fraud. This might be based on the
amount by which the limit is exceeded and the customer's
previous behaviour. Usually, systems maintain a shadow
credit limit (an amount of credit above the known limit that
the company would be happy to give the customer based
on their perception of risk). The shadow limit allows the
call centre to respond promptly to customer requests for an
increased limit if the request is within the shadow limit
bounds. Responses to over limit situations include a
message on the statement, a letter or a phone call. The
account management system might have a strategy
allocated to the customer to deal with this eventuality.
Customers may also contact the lender with other requests
and enquiries, for example a change of address, a statement
query, a lost card or a request to pay off a fixed term loan
early. Customers who wish to pay off a loan early can
request a statement from the company of the amount
required to pay off the loan by a certain date. This will
require new interest payment calculations and there may
also be early settlement penalties and administration fees to
calculate.
The account management systems generate different levels
of management information that is used to produce reports
to support operational and strategic decisions. This might
include volumes of business, volumes of payments and
aged debt reports, split by variables such as product and
source of business. Having real time information on
delinquency levels is seen as important for modifying
collection and recovery stratgeies and/or realigning risk
and behavioural scores.

Credit and Debt Management – 2008 Survey
87 Research and analysis by the Credit Management Research Centre, University of Leeds Business School
When an account shows signs of going into arrears, the
lender needs to ascertain what the appropriate action might
be to remedy the situation. Arrears may be a sign of
financial difficulty and a deteriorating profile or simply
represent a situation where a person regularly pays their
monthly bill a few days late, perhaps coinciding with when
they receive wages/salaries. Collections systems primarily
provide a diary function, so that a record is kept of contacts
with the accountholder and actions taken, and a queuing
system that enables the processing of accounts to be
controlled. Accounts entering collections will be allocated
to a particular queue initiating a particular action, such as
telephone contact with the customer or the sending of a
letter.
Clearly a strategy needs to be adopted that minimises
contact/collection costs but effectively remedies arrears.
There may be several collections strategies, perhaps based
on collection scoring, involving phone calls, reminder
letters or passing the accounts to an external debt collection
company.
The lender needs to identify the best route to take for a
particular account as promptly as possible. At this stage, a
decision may be made to pass the debt to an internal or
external collection agent. Collection agents will often use a
collection score to determine the most cost effective
actions to recover the debt.
Application App lication Processing S ystemP rocessing S ystem
Account Account M anagem entM anagem entS ystemS ystem
BehaviouralB ehaviouralScoring / S trateg yScoring / S trategyS ystemS ystem
C ollectionsCo llectionsM anagem ent M anagem ent S ystemS ystem
Debt Management & Collection TrendsDebt Management & Collection Trends
telephone contact (power diallers)more personal telephone / letter contact
debt collection agencies(internal and/or external) litigation
phone letter doorstep
Chart 4.2.4 – Applications to Collections
Chart 4.2.5 – Debt Management and Collection Trends

Credit and Debt Management – 2008 Survey
88 Research and analysis by the Credit Management Research Centre, University of Leeds Business School
The timing of further actions is usually driven by a review
date that can be set by the collector or by the computer
system after an automatic action such as the sending of a
standard reminder letter. Accounts within a queue can be
prioritised by criteria such as value of debt, time in arrears,
or some combination of criteria.
Wilson and Summers (1998) identified differing collection
strategies for different types of financial services.
They write, "as a simple example Company A, who run an
in-house store-card system, would attempt to transfer
customers onto direct debit for payment of the card
wherever possible. This simplifies and speeds collection.
The objective here is to clear account balances in order to
facilitate further spending in the store. Company B, a
credit card provider, operate a very similar collection
system but have made a policy decision not to encourage
direct debit as this would reduce the profitability of the
customer base. The objective here is to allow profitable
debt to build but at the same time minimise the risk of
default and costly collection activities".
Letter & telephoneDoor step collection
Litigation
No ActionWrite-off
Receive Bad Debt
Scoring/Decision Tree (classifies debt)
StrategyStrategyAllocationAllocation
Chart 4.2.6 – Scoring to Determine Collection Strategies

Credit and Debt Management – 2008 Survey
89 Research and analysis by the Credit Management Research Centre, University of Leeds Business School
In the later stages of arrears accounts may be passed to
debt collection agencies, sold or go to litigation. The
collections system now usually provide for monitoring/
review of accounts passed to an external agent or litigation.
Some systems include litigation functions but separate
litigation packages are also available. In the case of debt
sale, information has to be provided so that the buyer can
undertake due diligence.
The large volume lenders have relatively sophisticated
management information systems that facilitate the
tracking of customer risk and the progression of delinquent
debt. Such information is essential for making provisions
for bad debt write-off. Clearly the actual amounts
outstanding will be converted fully into cash because a
proportion of borrowers will default on some or all
repayments. Management information systems have
improved substantially in recent years and allow various
profiles and ‘drill downs’ of the current portfolios.
Lenders attempt to model debt progression from current to
delinquent in order to determine provisions and set targets
for collections and recovery operations. Common methods
for projecting bad debt levels are ‘roll-rate’ models and
variants, such as Markov Chains. The former tracks the age
of debt and predicts the proportion of debt say in the 1- 30
days overdue category that will progress into the next
category of arrears 30-60 days overdue. By analysing
recent history the proportion that will roll forward can be
estimated. In practice roll rates will often be calculated on
a daily basis, i.e. how much of the 1 day overdue rolls onto
2 days overdue.
The Collection departments may look at the profile of
delinquency at each collection cycle or collection action in
order to estimate the returns in relation to actions.
Collection departments will be interested in analysing ‘cure
rates’, that is the proportion of accounts that are currently
overdue that are fully or partially returned to order.
4.3. Elements of ‘Best Practice in Collections’ and Implications
This section is based on an analysis of a series of case
studies of the collection systems and structures of some
organisation that have large volumes of consumer debt to
manage, collect and recover which we refer to as ‘large-
volume lenders’. The lenders cover: (a) Financial Services:
Credit Card, Current Accounts, Personal Loans, Charge
Cards, Insurance Products, mortgage lenders; (b) Utilities:
Gas, Water and Electricity; (c) Telecommunications:
Mobile and Fixed Line (d) Home Shopping: major Mail
Order Companies. Interviews have been conducted within
a selection of organisation in the categories above at
various intervals since the initial survey in 1998. This
report summarises the interview responses from the
original survey in 1998 (see 'Debt Collection in the UK and
Europe', by Wilson and Summers 1998 for more detail).
and the updates provided in 2001, 2003 and 2007. Thus,
major trends in the collection systems and strategies can be
gauged with a particular emphasis on the back-end of the
collection and recovery cycle and the usage of 'out-placed'
collection agents by large volume consumer lenders and
the more recent trend to use debt sales as an alternative to
placing for collection on commission. The trends in 'in-
house' collections systems and procedures have obvious
implications for the 'external' debt collection industry.

Credit and Debt Management – 2008 Survey
90 Research and analysis by the Credit Management Research Centre, University of Leeds Business School
This purpose of this section is to draw some general
conclusions from tracking developments within
organisations engaged in high volume consumer lending
and debt management. The focus was an examination of
recent trends and strategies in collections. Interviews
allowed us to gain insights into the 'state of the art' in
information provision, risk analysis and decision support
and debt progression software, with a view to identifying
common and 'best' practice whilst focusing on the forces
driving change in the credit and collections departments of
these organisations. The analysis provides a benchmark for
organisations interested in appraising their current practice.
Clearly any investment 'in-house' in new debt management
philosophies and technologies should affect internal
collections performance and efficiency and will have an
impact on the type, age, quality and volume of debt that is
made available to external debt collectors and debt buyers.
An attempt was made to focus on organisations held as
examples of 'best practice' within the industry, or
organisations that had recently re-organised their credit-
debt management activities and/or invested in new
information-technology and collection systems. A synthesis
of the main trends affecting high volume collection
concludes the section.
Marketing
ApplicationProcessing
AccountIn Use
Account Management
Collectionsand Recovery
Set UpAccount
New Prospects
DCA’s ?Sale ?
Marketing
ApplicationProcessing
AccountIn Use
Account Management
Collectionsand Recovery
Set UpAccount
New Prospects
DCA’s ?Sale ?
Marketing
ApplicationProcessing
AccountIn Use
Account Management
Collectionsand Recovery
Set UpAccount
New Prospects
DCA’s ?Sale ?
Credit Card Bank Loan Current Account
Marketing
ApplicationProcessing
AccountIn Use
Account Management
Collectionsand Recovery
Set UpAccount
New Prospects
DCA’s ?Sale ?
Product Level View
Customer Level View
CRA’s
Chart 4.3.1 – New Debt Management Approaches

Credit and Debt Management – 2008 Survey
91 Research and analysis by the Credit Management Research Centre, University of Leeds Business School
4.3.1. Credit Information and Scoring Technologies
Profiling and understanding the ‘customer’ is at the heart
of best practice account management debt prevention and
collections/recovery. Organisations in financial services
have and continue to invest in data-base systems that
facilitate the generation of a view of the customer
(customer-level) rather than behaviour in respect of a
specific product (account-level).
This has involved matching all internal product use with
particular customers (e.g. bank account, credit card,
mortgage) and gaining an insight into the customers
behaviour and level of indebtedness with the credit
accounts of other lenders via the credit reference agencies.
The latter has been aided by major lenders, such as HSBC
and Natwest sharing their data and the development of
‘indebtedness’ indices by the CRAs (e.g. Experian,
Callcredit). Prior to these initiatives, the lender had a very
partial view of an individual’s debt commitments and
ability to service debt (creditworthiness).
The compilation and management of 'data warehouses'
including credit reference data, lifestyle and geo-
demographic data, and 'closed user group' data has been
facilitated by sophistication in computer technology and
software. Thus there has been a move towards profiling the
'customer' across all credit products, rather than a 'product
focus' and gaining a view of total indebtedness.
Organisations have been re-organising data and
information systems to be able to 'manage the customer not
the debt'. Decisions are informed by scoring systems and
propensity modelling, but there has been considerable
resources devoted to the capturing of ‘up to date’ and
‘event’ data from telephone and letter contact with the
customer. For instance, a customer may currently have a
good risk score but telephone contact reveals that the
household has recently lost income through job changes.
The profile of the customer can then be changed
accordingly by combining both the quantitative
information from scoring systems with ‘qualitative’
information from customer contact. Profiling customers
will usually involve 'segmenting' the customer base into
groupings with similar characteristics and behaviours
and/or in relation to appropriate collection activity.
15
coping with high volumes with low value in a competitive environment
pricing risk – segmentation
managing and understanding customers (relationships) andmaximising profits
Credit Scoring
Propensity(probability)Modelling
‘If’ ‘when’
timing
Chart 4.3.2 – Motives for Credit Scoring in Consumer Credit

Credit and Debt Management – 2008 Survey
92 Research and analysis by the Credit Management Research Centre, University of Leeds Business School
Organisations use statistical models and 'scorecards' to
support credit decisions at all stages of the credit lifecycle
from credit applications to account management via
'behavioural scoring'. The term ‘credit scoring’ was coined
in relation to application scoring used for reject/accept
decisions in high volume low value credit granting
environments. The technique has evolved to model many
‘propensities’ as well as risk. For instance, there is an
increased use of models to predict/understand customer
'churn'; payment behaviour; collection scores; life-time
value and profitability etc. Different techniques are often
combined, e.g. statistical methods for scorecard building;
neural networks for account monitoring (behaviour, fraud
etc); expert systems for implementing 'policy rules'.
Organisations are placing more emphasis on monitoring
scorecard performance after implementation and
monitoring different strategies towards customer segments.
More recently, emphasis has been placed on modelling the
‘timing’ of behaviours to determine the optimal ‘timing’ of
actions. Scoring models are essential for the accurate
‘pricing’ of debts and debt portfolios should a debt sale
opportunity arise.
Best practice systems incorporate many of the elements
charted below. Data combinations that are able to profile
account or service usage; the customer life-style;
indebtedness and income. Data is updated at every
opportunity. This information feeds into propensity models
that help to segment customer behaviours and determine
strategies to be employed in responding to customer
behaviours. This facilitates the efficient deployment of
resources and skills in managing customers. MIS systems,
strategy testing and benchmarking aids continuous
improvement and adaptation to change.
DATACustomer LevelAccount Level
CustomerBehaviour
ContactUpdates
Credit ReferenceData
PROPENSITYMODELS
InformedProcesses andStrategies
‐ Customer segmentation
‐ Tailored Collectionand Recovery Processes
‐Focussed resources and skills
‐ Champion‐ Challengertesting
‐ Cost‐benefit Analysis
‐ Sophisticated MIS
Chart 4.3.3 – Modelling for Collections Strategies

Credit and Debt Management – 2008 Survey
93 Research and analysis by the Credit Management Research Centre, University of Leeds Business School
Collections or behavioural scores are one variant on
propensity scores that may be used to accept/reject an
application for finance. Risk scores rank the customer in
terms of the probability that they might become delinquent.
Collection scores are compiled based on risk and recent
behaviour. They are designed to determine the probability
of collection and/or the percentage of debt that should be
collected. Collection and recovery scores help the collector
prioritise actions and the debt path for each delinquent
customer. Thus, the score provides empirically an
assessment of ‘collectibility’ and therefore determine an
appropriate collection strategy. As outlined above
delinquent accounts flow through a collections life-cycle or
debt path and require different techniques to solve the
problem. The overdue payment will initially be dealt with
in the ‘account management’ system and then flow through
to ‘collections’, internal and external ‘DCAs’, 1st
, 2nd
and
perhaps 3rd
placements with DCAs and then through to
write-off, ‘debt surveillance’ or ‘debt sale’. The collection
score can be utilised the path and the timing of actions.
Such score can also be utilised to help determine a ‘price’
for debt sale.
The need for monitoring activities versus returns and
decision software tools has grown with the use of scoring
models. Champion-Challenger (see below) is commonly
used to test different strategies on different customer
segments (based on scores). The collection process/strategy
is therefore adaptive and varied at regular intervals. Thus,
the key features of such a system are: (1) Segmentation -
the collection department must be able to identify customer
sub-groups with similar characteristics/behaviour; (2)
Score calculation and implementation - the system must be
able to warehouse customer data from various sources,
calculate and update scores and incorporate them into the
decision process; (3) Adopt a champion-challenger
environment for continual testing and strategy
improvement; (4) Undertake ‘what if’ scenarios for future
strategy implementation; (5) Report detailed management
information on collections activities and returns and
provision for bad debt.
In order to build and utilise behavioural scores as a means
of making more effective and automated decisions the user
has to have a sophisticated customer data base and a high
frequency of behavioural information. Typically, the user
will have a high number of accounts, high volumes of
usage and historic performance, comprehensive and robust
periodic dates, a highly automated and integrated account
processing system and automated delivery mechanisms.
Samples of data can then be downloaded and analysed in
relation to a particular outcome.
The principle is as follows and summarised in the diagram
overleaf. An outcome (i.e. 3 payments down) may be used
to build the behavioural score. Data is taken at the
observation point for a sample of good/bad accounts.
Account characteristics and behaviour in the previous 12
months is analysed and related to the particular good/bad
outcome and behavioural scoring model is built and used to
classify the probability that current good accounts will
become bad at the outcome point.
Behaviour Scoring: Principles
ObservationPoint
OutcomePoint
24 months ago 12 months ago Today
Behaviour
Window
Chart 4.3.4– Behaviour Scoring: Principles

Credit and Debt Management – 2008 Survey
94 Research and analysis by the Credit Management Research Centre, University of Leeds Business School
The chart to the right provides information on the types of
variables that might be collected in the ‘behaviour
window’
A statistical process is employed to derive points or
weights for each behaviour variable. These are summated
for each account to derive an overall behavioural score. An
example is provided in the Chart opposite.
The behavioural scores might be used to make decisions
about an account at the various stages in the life cycle.
Additional data and behaviour can be added to create
‘collection scores’ and ‘recovery scores’ as highlighted in
the Chart opposite.
Behaviour Scoring: historic performance characteristics
- How the account has been operating historically, e.g.
- Number of times over the limit in last 3 months- Average balance over the last 6 months- Average payments/Average balance over the last 6 months- Average outstanding balance over the last 3 months/ averageoutstanding balance last 6 months
- Decision point details
- Current balance- Current balance/limit %- Age of account- Current facilities
Example Behaviour Score Card
Balance / limit%
Ave payment / Balance%(last 6 months)
Cash advances/total debits %(last 3 months)
Age of account (months)
Worst arrears stage(last 6 months)
0 - 30 31 - 80 81- 100 101+
0 - 5 6 - 20 21 - 50 51 - 100
0 - 5 6 - 50 51 - 80 81 +
0 - 6 7 - 12 13 - 24 25 +
0 - 1 2 3+
+50 0, -30 -100
-60 0, +20 +35
-10 -30, -20 -150
-10 0 +10 +30
0 -35 -120
valuepoints score
Application Early Behaviour Behaviour/Delinquency Recovery
Pre-acceptance 1st bill- 6 months 6th months- final bill Final Bill Write-off
Customer provideddata to assess futurerisks and credit limits,billing and paymentplans and security Application risk score
and early behavioursuch as early transactionsand payment
Analyse actual customerbehaviour such as payments,overdues, balances .. Toassess risk and set collectionor treatment priorities
Behavioural Scoring and the Account Life-cycle
Liklihood of this account leaving anunpaid balance,arrangement vs action
Strategy asdetermined byrecovery score;Litigation ?DCA?Sale?Write-off ?
Chart 4.3.5 – Behaviour Scoring
Chart 4.3.6 – Example Behaviour Score Card
Chart 4.3.7 – Behavioural Scoring and the Account Life-cycle

Credit and Debt Management – 2008 Survey
95 Research and analysis by the Credit Management Research Centre, University of Leeds Business School
4.3.2. Customer contact and Customer Retention and Collection
In Financial Services, one of the impacts of Basel II rules
and the default definition (90 days) has been to focus the
attention of lenders on the time path of debts. An emphasis
is now placed on detecting indebtedness problems and
potential payment difficulties at an early stage and if
possible to solicit some payments that enable the debt to be
reclassified. This may involve the use of scoring or
behaviour triggers to alert account management to relevant
changes. Customers may be contacted for counselling or
‘money management’ and pre-emptive action to relieve
financial pressure via the restructuring of finances or debt
being re-aged. Emphasis is on customer retention and
rehabilitation in order to prevent future delinquencies.
Customer retention emphasises early contact with
individuals and their education regarding payment habits
and indebtedness and referrals for 'debt counselling' in
some circumstances. Supported by 'on-line' and timely
information on the individual's account history and
payment scores.
Call centre staff have increased flexibility and discretion in
the approach to indebted customers with an emphasis on
resolving the problem and negotiating solutions to the
problem, e.g. restructuring payments. It is recognised that
financial difficulties can be transitory (due to changing life-
styles and income streams) and customers in arrears can be
rehabilitated. Significant resource is put into keeping
account information up to date particularly contact
information, employment status, income and assets. This
information is used to modify the treatments that may be
automatically determined by the scoring systems.
Customers in early stage delinquency are contacted
immediately and repeatedly in order to resolve any
problems quickly. Again, restructuring debts and
implementing a program to recover outstanding balances is
the priority. Collection staff must be multi-skilled to deal
with multiple products on multiple systems. Recalcitrant
customers will be passed on to a 'collections' environment
when the early stage collection has not been successful, i.e.
broken promises, arrangements not kept up.
Customers are segmented by risk and outstanding balances
and much champion-challenger testing in relation to
strategies and the timing of actions is undertaken. Scores
focus on ranking customers by ‘propensity to pay’. The
cycle from arrears to recovery action and write-off has
become much shorter but accounts and debts are worked
much harder or more aggressively in the early stages.
Delinquent accounts are passed into the ‘external
environment’ via debt sale or to a DCA much sooner where
the emphasis is on recovering arrears through repayment
plans.
The Champion-Challenger environment is commonplace in
collections. Champion/challenger systems can be used to
develop strategies over time. The basic approach is
illustrated in the chart below. In collections, a particular
collection sequence will be in operation for certain types of
accounts. The approach/sequence is then slightly varied for
a sub-set of accounts (challenger strategy) and the
outcomes are monitored and tested against the champion
strategy statistically. If the challenger outperforms the
champion it becomes the new champion that in turn is
tested against new challengers.

Credit and Debt Management – 2008 Survey
96 Research and analysis by the Credit Management Research Centre, University of Leeds Business School
By adopting different collection sequences with different
timings across a segmented collections portfolio
collections performance can be continually improved. The
effect of changing the collections sequence provides an
uplift to collections performance simply by removing the
predictability of the collections sequence from the
perspective of the debtor. A debtor that can predict the
sequence of actions to recover payment will rationally wait
until the end stage before paying or until collection efforts
‘get serious’. If the collections sequence is constantly
changed, then this can stimulate the debtor into better
payment habits. Champion-challenger can increase
effectiveness by targeting actions that solicit the best
response from customer segments and removing collection
stages that have been shown to add little value in the
collection process. The process of continual improvement
may involve creating ‘specialist’ collection teams that
focus on particular debt stages or particular customer
segments.
Organisations have implemented systems that are able to
identify quickly if an account is going into arrears and
decide an appropriate collection strategy. Various
information support systems are now available to help the
organisation make timely and suitable decisions.
Collection support systems have the following features:
• A diary function which records contacts with an
account holder and the actions taken;
• Queuing systems to control the processing and
progression of overdue accounts: different queues
initiate different actions; different queues for
different account types; choice of queue can be
determined by risk scores; timing of next action
can be automatically set and implemented;
prioritisation within a queue by value, age, risk of
Champion 80% accounts Challenger 20% accounts
£’s OutstandingRisk ScoreLow Medium High
Low
Medium
High
£’s OutstandingRisk ScoreLow Medium High
Low
Medium
High
CollectionStrategy
Time
Letter
Phone
DCA
Letter
Phone
DCA
LetterPhonePhone
Legal
DCA
LetterPhonePhoneDoorstep
DCASale
Chart 4.3.2.1 – Champion vs Challenger Strategies in Collection

Credit and Debt Management – 2008 Survey
97 Research and analysis by the Credit Management Research Centre, University of Leeds Business School
default etc.; automatic sending of reminder
letters;
• SMS messaging is used to invite inbound calls.
Inbound calls are deemed a very successful
strategy for resolving payment problems;
• Collection staff will be monitored on cash
collected, promises kept, ATPs arranged, call time
etc. Collection staff now works in a competitive
environment and will often receive bonuses based
on performance.
4.3.3. Collection department practices
Leading edge collection departments tend to have the
following characteristics:
• Centralisation of the collection function
especially in the early stages and specialisation as
the debt progresses;
• Use of 'champion/challenger' approach to ensure
that collection strategies are constantly updated
and effective; statistical analysis of C/C
strategies;
• Customer tailored collections paths are more
likely; different strategies for different ages of
debt using different collection approaches;
emphasis on rehabilitation of customers and cash
recovery;
• Use of on-line customer information systems and
credit reference agencies to provide payment
histories;
• Use of automated collection systems using
decision support information to prioritise debts
and determine the appropriate collection strategy;
• Management information for documenting and
monitoring actions taken and responses by
debtors; collectors' performances; early detection
of non-compliance incorporating the use of
scorecards to identify individuals most likely to
default and the probability that they will repay.
The ‘timing’ of actions is deemed to be very
important and lenders are researching the impact
of varying delinquency cycles;
• There is recognition that ‘debt resting’ may be an
appropriate strategy for certain accounts. If a low
risk customer has been affected by an unexpected
‘event’, such as divorce or employment change
then it may be more cost effective to allow the
customer to recover his/her financial position
before collection action is taken;
• There is more use of ‘behavioural’ and ‘collection
scoring’ to segment customer-bases and
determine the escalation process for each debt,
i.e. debts may not all pass through the same
sequence of actions. In order to be effective, these
collection strategies have to be monitored and
tested continually in a champion-challenger
environment. New strategies based on customer
risk profiles and ‘propensity to pay’ scores are
implemented and monitored to establish possible
sources of cost saving and efficiency in
collections activities;
• Implementation of activity-based costing to
monitor cost effectiveness of actions versus
recovery;

Credit and Debt Management – 2008 Survey
98 Research and analysis by the Credit Management Research Centre, University of Leeds Business School
• 0nce non-compliance established early contact
with debtors via the telephone; use of
power/predictive dialling telephone technology;
investment in new contact modes that encourage
the debtor to make inbound calls. For instance,
SMS messaging and or Interactive Voice
Response (IVR) calls;
• Early categorisation of debtors who 'can't pay'
from those who 'won't pay';
• Early establishment of a realistic payment plan;
• Negotiation with debt management organisations
and IVAs.
Debt sale is on the increase and all the lenders that were
interviewed were actively participating in the debt sale and
purchase market. The market for debt sale is increasing
since the time horizon of the lender and the DCA is
different and facilitates the customer shifting from a short-
term payment plan (credit card) to a longer term
arrangement (DCA arrangement to pay).
In interviews, Debt Sale was usually undertaken post-
write-off. Usually debt would be written-off after being
out-placed once or twice unsuccessfully. At this stage
portfolios of written off debt would be sold by tender to
organisations specialising in debt purchase.
One lender was offering portfolios of around £20million
plus for sale several times per year. The price of these
debts would range from 2% to 10% of face value.
Portfolios are often broken down into segmented ‘buckets’
and sold for differing prices, but many lenders expressed
the view that they had little confidence in the pricing
mechanisms for debt. Almost all of the lenders
interviewed expressed an interest in selling debts at an
earlier stage, i.e. pre-write-off. Most lenders that sell debt
take some steps to maintain their ‘brand image’. There is,
of course, some ‘reputation’ risk if debts are sold for
collection by more aggressive or ‘unscrupulous’ collectors.
The role of brokers was beginning to result in some price
uplift.
Debt Lifecycle
Debt Cleared
Bad Event, e.g. divorce
Arrears
Default
Write Off
Reached divorce settlement
Repayments re‐start
Loan Established
Time
Collections Litigation Activity
Chart 4.3.3.1 – Lender Time Horizons

Credit and Debt Management – 2008 Survey
99 Research and analysis by the Credit Management Research Centre, University of Leeds Business School
4.3.4. Use of external debt collection agencies for telephone, letter and doorstep contact; litigation
There has been a significant rationalisation of the use of
collection agents and constant performance benchmarking
between agents and between agents and in-house collection
activities. Our previous studies reported that clients were
insisting on having closer contact with collection agents
via integrated information systems. Close monitoring of
the outcomes of placing with agents. More recently,
perhaps due to the pressures of Basel II systems, lenders
are keen to remove delinquent debt from their books via
debt sale (ownership transfer) rather than placing for
commission collection.
Where placement occurs, collectors use in-house and
external collection agents in more sophisticated ways.
Lenders will typically use a panel of around 6 DCAs and
possibly 2 trace and collect specialists for ‘absconders’.
The panel of DCAs will be monitored closely and their
collection success measured. Usually the lender will have
direct access to customer-level information as it is worked
within the DCA. This includes access to all computer
systems and diary records along with collection ‘outcome’.
Complaints against the DCA will also be monitored closely
and may be one criteria (along with recovery rate) by
which debt is allocated to the DCA in then future.
Benchmarking is undertaken to further assess the relative
performance of individual DCAs including the client’s
internal DCA. First placed debt (1st
placement) typically
has a recovery rate of 1-3% of face value. Debt may be
placed a second time if the first placed agency is
unsuccessful. Second placed debt has a recovery rate of 1%
or less. Of course the recovery rate is dependent on the age
of the debt when passed out.
4.3.5. Benchmarking
Benchmarking is now utilised widely in credit management
in order to gauge and monitor the relative performance of
the credit/debt management department. Benchmarking is a
continuous process which involves measuring activities
against other similar organisations in the industry sector,
comparing individual performance against the industry
leaders and comparing internal performance indicators
through time. This process allows the identification of
demonstrably better practice which will lead to measurable
improvements in performance. “Companies must be
flexible to respond rapidly to competitive and market
changes. They must benchmark continuously to achieve
‘best practice’ (Michael Porter, Harvard Business Review,
December 1996).
The quantitative side of benchmarking involves
establishing and defining Key Performance Indicators
(KPIs) that will be comparable through time and across
organisations in the sector. The KPIs measure the
performance of an organisation and/or a function within an
organisation. For debt management departments, for
instance, measures of account delinquency, bad debt levels,
roll rates or aged debt profiles, operating costs, collection
cost per customer or per activity, call centre absenteeism
etc. can be measured periodically tracked over time and
compared with the results of other organisations in the
benchmarking group. KPIs should be continually and
consistently measured across organisations and across
time. The KPIs help to establish internal goals that all
employees in the department can identify with e.g. reduce
bad debt by x% this year. Once the KPIs have been
measured and compared then the relative positions of each
participating organisation can be established. The
benchmarking group can then focus on the qualitative

Credit and Debt Management – 2008 Survey
100 Research and analysis by the Credit Management Research Centre, University of Leeds Business School
attributes of the departments processes and practices to
determine what management practices, techniques,
technology employed etc, contribute to the performance of
the ‘best in class’. ‘Best practice’ information can then be
discussed and shared within the group. An important part
of benchmarking is recognising that the data (KPIs) is a
result of processes and practices and that these must be
modified and ‘tweaked’ according to ‘best practices’ in
order to improve performance continually.
“Benchmarking is needed for continuous improvement and
should be an on-going, dynamic process”
The steps involved in benchmarking are summarised
below:
• Decide what the measure (KPIs)/benchmark
making sure that the criteria aligns with the
department mission/goals;
• Measure and document your own performance
historically and going forward;
• Identify the ‘best’ in the industry (or at least an
organisation that is outperforming you in at least
one dimension);
• Analyse and compare results taking care to
establish that the KPIs are truly comparable
between companies;
• Study the practice and processes to establish why
they are a superior performer;
• Implement new practices to improve your own
performance;
• Monitor and measure your KPI’s and start the
process again.
4.4. Summary
The picture then, is of large organisations setting up
sophisticated customer focussed operations aimed at
'reforming' debtors, if possible, so that the relationship with
them can continue and generate future profits. This has
been partly a response to increased competition amongst
lenders, the emergence of 'consolidation companies' and
recognition that changing life-styles and patterns of work
have precipitated periods of 'over-commitment' by debtors
which need be managed longer-term. Collection cycles
have become much shorter in financial services but opened
opportunities for debt buyers. Basel II rules has resulted in
reclassification of debtor portfolios in financial services
with the development of new default probability models.
The centralisation of collections activity in organisations
may produce an environment in which more sophisticated
decision support systems including statistical and
propensity models, such as behavioural scores, can be used
to formulate the most effective collection strategies by
encapsulating the company's previous experience of what
works and creating variability in collection sequences.
The introduction of enterprise wide data sharing has arisen
because of the emphasis being placed on having a
'customer-level' view and detailed management
information systems. The expansion of closed user groups
in the UK means that firms have access to better
information on other lenders experience of a debtor, and
can include this in their decision making process. The
differences in information costs of in-house and out-placed
debt collection are thus reduced.

Credit and Debt Management – 2008 Survey
101 Research and analysis by the Credit Management Research Centre, University of Leeds Business School
Sophisticated credit management in-house will inevitably
reduce the 'quality' or 'collectibility' of debt that is out-
placed. Many debts passed to debt collectors will already
have been through telephone and letter based collections
procedures, and may even effectively have already been to
one debt collector, if the company has a debt collection
subsidiary. It may be that such firms will only want to
make use of a sub-set of the debt collectors service which
they cannot provide for themselves, for example, door-step
collection.
As well as the obvious affect of making it more difficult to
make a profit with charges based on the value of debt
collected, this decrease in the 'quality' of debt may further
impact on the competitiveness and efficiency of the
'external' debt collection industry. The larger debt
collection operations that have traditionally taken the bulk
of their business from the banks and credit card industry
have in the past been able to develop scoring systems
based on their own history of recovery and bad debt write-
offs. The development of scoring models however, requires
that the data sample, based on a history of account
experience, have sufficient variation between 'good' and
'bad' accounts. The move towards more sophisticated
collection systems by the credit providers has meant that
the type of debt that is eventually passed on to debt
collectors is debt that has already been worked and is likely
to be skewed heavily towards the 'bad' end of the debt
spectrum. That is, there is insufficient variation in the
quality of debt coming through their books to permit a
meaningful statistical analysis and predictive modelling.
Effectively the client companies are reducing the
information content of the data by making use of it in their
own behavioural models prior to outsourcing.
A trend towards using fewer agents with closer contact and
integrated information systems suggests that there will be
fewer/larger and more sophisticated collection agents in the
future.
4.5. Short Case Interviews 2007
During the spring and summer of 2007, a series of
interviews were carried out with major lenders involved in
the banking, mortgage and credit card sector with a view of
updating our case studies on the trends in collections and
recoveries and soliciting opinion on the current position
and expectations. Interviewees were asked to comment on
the level of indebtedness in the UK and the risk factors.
4.5.1. Collections Department: A Medium Sized Bank
The collections department of the bank handle debt from 3
products: credit cards, personal loans and current accounts.
Mortgages and commercial lending are handled by a
separate unit.
The collections unit is undergoing some change in order to
develop a full ‘customer view’ since the data-bases are
currently organised by product. Collection is undertaken
via a call centre inclusive of 150 seats and an in-house debt
collection agency (operating with a different name to the
lender). A pre-delinquency team attempt to identify cases
showing signs of delinquency and contact via call centres
may be made in order to take preventive action or give
advice.

Credit and Debt Management – 2008 Survey
102 Research and analysis by the Credit Management Research Centre, University of Leeds Business School
The reasons cited for non-payment are over-commitment
and a changing attitude towards debt. The appears to be
less stigma attached to debt and debtors are better informed
about their options and are aware of how long it will take
to ‘buy time’ Rate of interest rises are having an impact on
arrears and IVAs. As a result, accept rates are being
tightened as are credit limits.
Debt that arrives for collection is segmented (strategic
segmentation) according to risk (high, medium, low) and
outstanding balance and each case will be allocated with a
call and letter sequence. The segmentation is informed by
behavioural scores using CRA and in-house data. Around
50% of cases do not have a accurate telephone number.
Debt that is 100 days old is sent to the internal DCA.
Champion challenger is used and being developed
alongside activity based costing. There has been
investment in telephony and alternative contact methods,
e.g. SMS to generate inbound calls and Interactive Voice
Response (IVR) systems. Outbound IVR is also used to
verify transactions when fraud is suspected. Collectors do
not get cash bonuses.
The emphasis of early collections is to educate the
customer and achieve payment. Call centre collectors can
take payments by debit/credit card; direct debit, etc. If a
promise to pay is achieved then a follow-up will take place
within 7 days. The customer will be warned about late
payment charges where applicable. If there are 2 missed
payments (60 days) a default notice will be issued and
logged with the CRAs. Individuals that are identified as in
financial difficulty are referred to counselling and a ATP or
payment plan will be negotiated. An external partner is
used to manage any IVAs with more effort being placed on
maximising the returns and trying to get customers to
establish ATPs internally. After 100 days, the debt is
passed to the internal DCA and a more manual and skilled
process is initiated. Tracing may be used at this stage.
There is an internal litigation team and they are
experimenting with litigation scoring. Litigation is used to
recover debt and/or achieve charging orders. After 180
days the debt is written-off and placed with an external
DCA- a core of 4 DCAs are used. Commission is 10% on a
first placement and 20% on a second placement. The
internal DCA is benchmarked against external DCAs and
roll rates are monitored.
At the moment, only small volumes are sold and are
usually debts that are 360+ days old. The price is generally
around 2-4p in the £. The problem with debt sale is the
pricing issue for debt at different stages and the data
required for pricing
The main developments are using scorecards to determine
collection paths; analysing recovery rates against the costs
of activities; control over IVAs; increasingly automated
early collections with IVR technology; focussed and
segmented collections.
4.5.2. Commercial Credit Card
Corporate credit cards are split into merchants (card
acquiring) and card issue (company cards). Merchants
receive commission on credit card sales and charge backs
through purchasing. Company cards are used primarily for
expenses of key personnel in the company. The majority of
customers are referred to the credit card division via the
main bank (70%). Large accounts with credit limits in
excess of £300,000 are assigned an account manager.

Credit and Debt Management – 2008 Survey
103 Research and analysis by the Credit Management Research Centre, University of Leeds Business School
The management of card accounts is highly automated.
The card portfolio is categorised by trade and risk with risk
scores generated using an external CRA. Security may be
requested against risky credit limits. In house behavioural
scores are used to monitor credit limits and pick up
fraudulent transactions. The behavioural scores use
external CRA data, the bank branch networks and ccj
information to update risk scores. Scores are used to
measure risk and detect fraud.Where possible, customers
are signed up to direct debit payments. The merchant side
of the business has a revolving debt book of around £10.1
million with around £2.6 million written off in 2006 and
£5million recovered.
An account that misses a payment or direct debit is
segmented into a category based on risk score and balance
outstanding along with analysis of the reason a DD was
returned. Contact with the customer is made within 3 days
with a phone/letter combination. Merchant card debt is not
always clean because of charge-backs and will involve
specialist knowledge from the collectors. The internal
collection team operate a small scale call centre with debts
of more than £200 being referred to in-house debt
collection if initial contact is unsuccessful. The merchant
side has an internal investigation agency that may use visits
in order to assess the appropriate actions. Legal action such
as charging orders and baliff services are used as recovery
strategies. If charges on assets and other legal enforcement
is unsuccessful then the debt is written off and passed to a
DCA. The merchant side has a problem with fraud with the
merchants often being the victims of fraud. The nature of
insolvency has changed with more cases of CVA’s being
encountered with rates of recovery versus costs worsening.
Company cards include credit cards, charge cards and
business cards. The interest rates are variable but more
work is being undertaken to price risk across the portfolio.
Fraud losses have been reduced through chip and pin
(although foreign ATM’s often don not use chip and
pin).Cloning and organised fraud is still a problem. The
company card operation utilises the services of DCA’s
early in the collection process. Three DCA’s are used in
competition. Debts of greater than £10,000 will be
investigated by an internal team. Debt sale is not common
but around £150,000 of corporate card debt was sold in
2006. Bad debt write-offs have been reduced as a result of
improvements in application scoring and risk scoring and
more sophisticated use of credit limits. The improvements
in and automation of collection systems has resulted in
lower bad debt provisions.
4.5.3. Consumer Credit Card
A step shift in the approach to collections occurred as a
result of large increase in delinquency, arrears, cases being
referred to debt management organisations and
bankruptcies during the period after January 2005. A task
force was set up in order to re-examine the quality of the
lending book and the collection strategy. There appeared to
be problems in every risk sector (bucket) of the portfolio.
New debt management software was commissioned around
this time at a cost of over £25 million. The problems with
the portfolio were linked to over-indebtedness of the
customer base and a mis-classification of customers into
risk buckets i.e. prime, near prime and sub-prime. This
resulted in the collections having no clear picture of
indebtedness and risk. Repayment plans and delinquency
continued to increase to March 2005.

Credit and Debt Management – 2008 Survey
104 Research and analysis by the Credit Management Research Centre, University of Leeds Business School
A number of trends emerge. A scoring system has
reclassified customers and the collection process is moving
from being a ‘event-driven’ process to a ‘time-driven’
process with more sophisticated management information
being used to report daily on the level of delinquency.
Lenders are under more pressure to reduce the number and
value of debts over the 90 day range as a result of Basel II
rules. This in practice has led to re-aging of debt if the
customer can make some payments if not the full balance.
The operation has made considerable investment in the
collection process in terms of debt management software,
telephony and scoring systems. Attempts to generate a
data-base that gives a full ‘customer view’ have not been
completed but are in progress. This has had an impact on
the sophistication of scoring which, it is believed requires a
customer level view in order to benefit collections.
Collection strategies and champion-challenger techniques
are used throughout the collection stages. Collection staff
are motivated by incentives and bonuses based on £’s
collected, number of accounts processed. Bonuses are paid
to teams on the basis of performance against collection
forecasts and to individuals on the basis of relative
performance in the team. Collectors are organised by a
classification of debt types and stages in the process.
Collection staff have discretion to negotiate with the
customer on re-aging and ATP’s
Call centre activity has been moved overseas including
South Africa, the USA and India. DCA’s are used with a
core of 5 being selected (including a DCA in the USA).
Call centre work requires more sophistication in targeting
calls because there are diminishing returns to call centre
activity. The objective is to increase the penetration rate on
dialling and combined with activity based costing work out
optimum penetration rates. Scoring is becoming more
sophisticated with a move to develop recovery scores and
assess the NPV of ATP’s. Debt is allocated to in-house and
external DCA’s and to debt sale. Commission rates are in
the region of 10-12% and debt is old for around 1-2 p in
the £. The level of trust in the debt sale market is not high
due to pricing uncertainty. There has been more activity in
door step collection.
IVA’s and bankruptcies are on the increase and the
company are developing a strategy to deal with IVA’s that
balances increasing returns with keeping the IVA from
failure. In card default cases the company is now more
likely to seek a charging order on any assets of the
customer via the county court.
Fraud continues to be a problem with ‘card not present’
causing the biggest challenge. Application and other fraud
has been countered with chip and pin.
The challenges for the future are to increase revenue;
develop more accurate risk scores, collection scores, ‘self-
cure’ scores and debt pricing mechanisms and close
dormant accounts. The development of ‘self-cure’ scores,
roll rate scores, write-off and recovery scores are all being
investigated. It is recognised that scoring systems play an
important part in determining optimum collection
strategies and fast track accounts through different
collection paths. There is now a preference to keep as
much of the process in-house as possible. There is
recognition that external CRA data is of better quality and
more comprehensive.

Credit and Debt Management – 2008 Survey
105 Research and analysis by the Credit Management Research Centre, University of Leeds Business School
4.5.6. Medium Sized Retail Bank
The bank has a full range of financial products 50% of
which are internal and 50% offered via third parties (e.g.
credit cards). Internally offered products are current
accounts, personal loans and mortgages. 65% of mortgage
business is generated by brokers and 50% of personal loans
via the internet. A large proportion of new customers do
not have an existing relationship with the bank.
Application scoring has evolved to include an
‘affordability’ model in order to minimise over-committed
customers. The model uses share data to estimate gross
income; living costs and total debt (CRA debt
information). The bank will decline applicants if the model
predicts a debt servicing problem. At the moment the bank
perceive that only a small number of households in their
portfolio are struggling but lending has been tightened,
particularly to younger age groups. The main reasons cited
for non-payment is financial mismanagement and over-
commitment. That is the debtor profile is an individual
with an income and possibly property but problems with
debt servicing. Arrears levels are now more sensitive to
economic conditions and interest rates, a sign of fragility.
The biggest perceived risk for the future is a house price
‘correction’ and a growth in the culture of bankruptcy and
IVA’s . Currently around a third of IVA’s fail and the
others generate a return only after 2-3 years. Fraud losses
are increasing, especially ‘soft fraud’ (fraud that is not
classified as such). Compromised credit and debit cards,
identity theft, card ‘not present’ fraud and cloned cards
used abroad (i.e. not chip and pin) are all areas of concern.
Mortgage fraud is high, particularly associated with inner
city new builds. This is likely to be organised fraud. The
buy to let market is an area subject to fraud. Incentive
payments to customers that are not divulged to the lender;
overvaluation of properties, off-plan properties sold but
never completed; re-mortgaging scams are all examples of
the latter frauds.
Payments on the loan portfolio are all paid by direct debit.
If a DD is unpaid the debtor will receive a letter-phone
combination of contact in order to get payments up to date.
If a loan remains unpaid for 90 days it is passed to an in-
house DCA who will spend 2 weeks trying to establish a
repayment pattern. The debt will then be passed to a broker
who sends it to DCA’s on a commission based collection
path. The broker receives 21% commission. Debts will be
written off after 6 months and sold to debt buyers via the
broker.
The collections operation has increased both in scale and
sophistication. Roll rates and arrears have been increasing.
A behaviour score and balance determines the collection
path of a debt. Champion challenger analysis informs
further segmentation. Collection staff have doubled in size
and the company has invested in debt manager software.
Debt is rescheduled on the unsecured portfolios where
possible

Credit and Debt Management – 2008 Survey
106 Research and analysis by the Credit Management Research Centre, University of Leeds Business School
4.6. Large Volume Collections: Interview Survey 2003
During the period May to July 2003 interviews were
arranged with the major lenders that have contributed to
this study over the past 5 years along with some other
major financial institutions participating for the first time.
The expectation prior to the 2003 survey was that there
would be some changes in practices but these would be
incremental rather than radical. However it was soon
apparent that some quite radical shifts in the organisation
of collection and recovery functions had occurred and that
collection strategies and approaches to the customer had
also shifted quite noticeably. These changes are reflected in
the updated case studies and comment presented below.
The main shifts in collection strategies were as follows:
(1) There has been a movement towards early detection of
delinquency and earlier and repeated contacts with the
customer in order to establish any problems and
rehabilitate the account back into ‘order’. The cycle from
early arrears to write-off has become much shorter but
accounts and debts ware worked ‘harder or more
aggressively in the early stages. A typical example of
escalation of actions is presented in figure 2.15. The point
0 represents accounts that are up to date and in order.
Accounts in early arrears are contacted in 4 ‘delinquency
cycles’ both phone and letter combinations. The early
cycles are geared to identifying problems, gaining
customer level information, prompting for payment and
reaching ‘reasonable’ agreements with the customer. Such
arrangements will be geared to getting the customer to pay
the arrears in full or establish promises to clear arrears
within a relatively short period of time.
4.6.1. Delinquency Cycles
After delinquency cycle 4 (i.e. 3-4 missed payments) the
account may be passed into a collections/recovery
environment. This will also include customers who have
‘broken promises’ or failed to respond. This usually
involves a name change for the customer. The
correspondence will now come from an internal Debt
Collection Agent that goes under a different name from the
lender or from an internal solicitor. At this stage a default
notice will be issued. Thus debts are being escalated
quicker into a default and recovery situation. The emphasis
will now be on recovering arrears through repayment plans
which may be longer term and recover lower proportions
of the outstanding debts. Some lenders do NPV type
analyses to establish whether it is more beneficial to
negotiate a settlement involving a lump sum payment (a %
of the total outstanding) as opposed to low monthly
repayments over a longer period. This activity is clearly
more suited to the financial services sector than the
utilities. There is a considerable amount of debt
rescheduling taking place amongst the large lenders in
order to rehabilitate customers. The default rate on
arrangements to pay (ATP’s) is less than 12%. Again at
this stage considerable effort will be geared to establishing
contact via phone, free phone-in, text message etc and to
gaining information on the debtors’ employment,
circumstances, financial and ‘asset’ position. Establishing
whether the debtor has employment and assets is important
in determining decision regarding litigation.

Credit and Debt Management – 2008 Survey
107 Research and analysis by the Credit Management Research Centre, University of Leeds Business School
After a number of delinquency cycles the debts will then
be passed on to external debt collection agents and may be
placed a second time if the first DCA is unsuccessful. At
this stage the debt may also be written-off and sold. The
whole process from early arrears to write-off will take less
than 9 months. One lender ‘charged-off’ debt at 90 days.
That is the debt is passed on to external collection after 90
days delinquency.
(2) There is more use of ‘behavioural’ and ‘collection
scoring’ to segment customer-bases and determine the
escalation process for each debt i.e. debts may not all pass
through the same sequence of actions. In order to be
effective these collection strategies have to be monitored
and tested continually in a champion-challenger
environment. New strategies based on customer risk
profiles and ‘propensity to pay’ scores are implemented
and monitored to establish possible sources of cost saving
and efficiency in collections activities. Activity-based
costing helps to establish the cost-return trade-off for each
collection activity. That is, monitor and measure the
‘success of actions’ against the ‘cost of actions’. The
emphasis is on ‘working smarter’.
Activity-based costing is an area where most lenders were
aiming to implement. As one collection manager
commented, “we need to know more specifically what
action generates what return and the cost of each action.
At the moment we know the cost of broad areas of actions
and can evaluate their cost effectiveness but we need to
drill down further whilst avoiding ‘paralysis by analysis’.
(3) The ‘timing’ of actions is deemed to be very important
and lenders are researching the impact of varying
delinquency cycles. There is recognition that ‘debt resting’
may be an appropriate strategy for certain accounts. If a
low risk customer has been affected by an unexpected
‘event’ such as divorce or employment change then it may
be more cost effective to allow the customer to recover
his/her financial position before collection action is taken.
(4) Increasingly lenders as well as working early
collections more intensively attempt to identify customers
that may be heading for financial problems. Certain types
of behaviour triggers may prompt a call to the customer to
try and pre-empt any problems. For instance a customer
with a change in the pattern of spending such as an
increases in payments going out of the account, new direct
debits or standing orders etc.
Account management Internal Debt Collection External DCA Write-off Debt Sale 0 1 2 3 4 5 6 7 8 210 Days Late Payment Penalties Imposed Account in order
Delinquency Cycle Recovery Cycle
Chart 4.6.1.1 – Delinquency Cycles

Credit and Debt Management – 2008 Survey
108 Research and analysis by the Credit Management Research Centre, University of Leeds Business School
The customer may be contacted by the lenders ‘money
management service’ in order to help the customer evaluate
the level of indebtedness and take actions or restructure
finances in order to prevent future difficulties. Lenders are
thus being more proactive and attempting to assess the
customer’s ‘total indebtedness’ or broader financial
position before identifying a ‘solution’.
(5) An increased emphasis on generating customer-level
information in order to improve the contact rate with
customers i.e. phone and mobile numbers, email addresses
etc and information on any changes in customer
circumstances, employment, behaviour, indebtedness with
other lenders and products.
(6) Collection and account management staff work more
flexibly in terms of hours and activity. Collection staff are
less likely to be specialists are certain delinquency cycles
but work across all cycles. As one financial services
organisation commented, “we are now driving out
specialist teams, the collection process is the same no
matter which route the debt is coming in from. Collection
and recovery shouldn’t be a fragmented set up”. Collectors
will have the discretion to negotiate arrangements to pay
and promises. Collection staff will be monitored on their
performance, particularly the collection rate or £’s
collected per hour/month etc. Solutions negotiated and
promises kept may continue to be monitored but the
emphasis has shifted to cash targets. One lender produces
league tables of the collection rates of every individual
collector and pays bonuses on league table positions.
Another lender has a ‘balanced scorecard’ for measuring
and monitoring collection staff on an individual and team
basis. The formula includes measures such as income
recovered per hour, percentage of time on and off the
phone, ‘solutions’ impact. Some lenders award cash
bonuses based on collections performance others hold
competitions for best collections performances and award
non-cash prizes.
(7) Call Centre and Collection staff undergo a significant
period of training in negotiation, customer relationship
management and collection/recovery skills. Most enders
suggested the period of training lasted up to 6 months
before a collector had sufficient skill/knowledge to work
cases independently. Training was both formal class room
and on-the-job using a ‘buddying’ approach.
(8) The use of Debt Management services by customers
with debt problems has been increasing. Many customers
will seek the advice of the Citizen’s Advice Bureau,
national debt line etc and/or allow a fee charging Debt
Management organisation to negotiate payment
arrangements with all of the customers’ creditors. Another
approach would be to seek a ‘consolidation loan’ from one
of the many organisations that advertise these as a ‘way out
of debt’. One lender revealed that out of 300,000 live
‘collections/recovery cases they had over 20,000 customers
making repayments via a debt management organisation.
This represented an increase of 3000 debt management
cases in one year. Another lender indicated an increase in
debt management cases of 200% in a period of just over 2
years. Consolidation loans or arrangements to pay may
extend the period for re-payments up to 20 years. Most
lenders suggested that they were taking a ‘harder line’ with
debt management and negotiating on repayment plans. A
figure of 2% recovery per month from ATP agreements
was cited as the target.

Credit and Debt Management – 2008 Survey
109 Research and analysis by the Credit Management Research Centre, University of Leeds Business School
(9) Most lenders will use external debt collection agents
(DCA’s) along side their internal DCA. Usually debt will
be out-placed to external agents after having been through
the entire process internally. Thus the debt will have gone
through the collection cycle, internal DCA/solicitor and
then be passed externally if there has been no success. Few
of the large lenders undertake any litigation internally
unless it is clear that the borrower has some worth i.e.
assets/regular income stream. Some lenders will often do
tests and litigate a sample of say 500 accounts in order to
evaluate the success rate and cost effectiveness. Recovery
rates are around 2-3% of balances from litigation.
Litigation, however, may be an option in the recovery
strategy for external agents. In practice few external
DCA’s litigate to recover debt but use letter/phone cycles
and ‘doorstep’ collections or visits. The latter can be useful
in gathering further information about the debtors’
financial position and assets. Most DCA’s will, however,
threaten litigation as a recovery strategy. Most large
lenders will have a ‘service level agreement’ with the DCA
that sets out they type of approaches that the DCA can use
to recover the client’s debt. All of the DCA’s processes will
be vetted. This is designed to protect ‘reputation/brand’.
DCA’s will usually receive a significant amount of
‘customer-level’ information and risk scores or ‘charge-off
reason code’ in order to inform their recovery strategy.
This, however, means that the lender has a ‘cost’ associated
with ‘servicing’ the DCA arrangement and may evaluate
this in future when making decisions about ‘out-placing’
versus ‘debt sale’. Some use a ‘scoring model’ to decide
whether to ‘place’ or ‘sell’.
Lenders will typically use a panel of around 6 DCA’s and
possibly 2 trace and collect specialists for ‘absconders’.
The panel of DCA’s will be monitored closely and their
collection success measured. Usually the lender will have
direct access to customer-level information as it is worked
within the DCA. This includes access to all computer
systems and diary records along with collection ‘outcome’.
Complaints against the DCA will also be monitored closely
and may be one criteria (along with recovery rate) by
which debt is allocated to the DCA in then future.
Benchmarking is undertaken to further assess the relative
performance of individual DCA’s including the client’s
internal DCA. First placed debt (1st
placement) typically
has a recovery rate of 1-3% of face value. Debt may be
placed a second time if the first placed agency is
unsuccessful. Second placed debt has a recovery rate of 1%
or less. Of course the recovery rate is dependent on the age
of the debt when passed out. One lender suggested that
their DCA’s often recovered up to 6%. Normally debt will
be 120 days overdue by the time it gets to an external agent
but this varied from 90-270 days in our interview sample.
Given that the lender works the debt intensively in-house
prior to out-placing it is surprising that DCA’s have any
success at all. One lender suggested that external DCA’s
still manage to collect because of (1) a further change of
name (2) a different approach to collection and more threat
of litigation (3) because of ‘timing’ i.e. by the time the debt
reaches the external DCA the customer may have had a
chance to recover their financial position. This is
particularly the case for individuals who have had a sudden
change of circumstance e.g. divorce, unemployment etc.
(10) Debt sale is on the increase and all the lenders that
were interviewed were actively participating in the debt
sale and purchase market. Debt sale was usually
undertaken post-write-off .Usually debt would be written-
off after being out-placed once or twice unsuccessfully. At
this stage portfolios of written off debt would be sold by
tender to organisations specialising in debt purchase. One
lender was offering portfolios of around £20million plus

Credit and Debt Management – 2008 Survey
110 Research and analysis by the Credit Management Research Centre, University of Leeds Business School
for sale several times per year. The price of these debts
would range from 2% to 10% of face value. Portfolios are
often broken down into segmented ‘buckets’ and sold for
differing prices. Almost all of the lenders interviewed
expressed an interest in selling debts at an earlier stage i.e.
pre-write-off. Most lenders that sell debt take some steps to
maintain their ‘brand image’. There is, of course, some
‘reputation’ risk if debts are sold for collection by more
aggressive or ‘unscrupulous’ collectors.
4.7. Case Studies 2003: large volume collection activities
4.7.1. Case A: Debt Recovery Division of a Major Bank
As a result of the major re-structuring of the customer
service/collection operations a leading bank established a
Debt Recovery Division approximately 4 years ago. This
was seen as a continued trend towards centralisation in
collections to exploit economies of scale. The division acts
as collectors for all the sections of the bank and for all
financial products, predominantly unsecured debt. The
bank has introduced a counselling service to counteract the
flight of customers to money advisors and debt
consolidation businesses. This is promoted as a ‘money
management service’ and is designed to identify possible
problems and resolve them to prevent the customer being
passed into recovery i.e. it is pre-emptive. However if the
relationship with the customer breaks down the account
will be passed to DRD i.e. 3+ arrears, no contact, broken
promises.
The purpose of the DRD is to maximise recoveries at
minimum cost. The emphasis of this division is on
recovery not customer retention and therefore the approach
to the customer is firmer in collection actions and in
establishing whether the customer has assets and an
income stream. The debts are worked intensively, by the
relevant customer service/account management teams,
prior to being passed to the DRD. The focus of the DRD
team is 'the customer' rather than the product where the
debts occur.
Thus the Debt Recovery Division receives for collections
action unsecured debt that has been deemed by their
internal clients to be non-rehabilitable i.e. where the
customer relationship has irretrievably broken down
(missed 3-4 payments) and the sole objective is now to
collect the debt. Thus the recovery team receive debt from
fixed term loans, overdrafts, variable period/rate loans,
credit card debt, secured consumer loans, secured and
unsecured business loans and trade debt. Debt values can
range from £25 up to £1m+. The average values are in the
region of £1500 to £4000 and are between 90 and 150 days
old prior to being passed into recovery. The team currently
handles around 300,000 live cases with approximately
20,000 new cases per month. Total balances outstanding
are in excess of £700 million of which around £10m per
month is recovered.
The department comprises of over 130 staff including 80
recovery staff, 20 qualified legal staff and 30 support staff.
All staff are trained in collection techniques,
communication and negotiation skills. The objective is to
be the creditor that makes the 'best first contact' with the
debtor. A bespoke debt recovery IT system is used in
conjunction with a solicitors software package (an
automated time recording, billing and case management
system). Collection strategies are undertaken through
different trading styles i.e. the use of 'in-house' agents
trading under a different name to the bank and in-house

Credit and Debt Management – 2008 Survey
111 Research and analysis by the Credit Management Research Centre, University of Leeds Business School
solicitor companies. This 'separateness' from the bank is
considered integral to the effectiveness of the debt recovery
operation. Up to 7 different names are used to approach the
customer.
The recovery staff attempts to recover debt through single
settlements or through an agreed instalment plan. The
collection strategies include the use of predictive diallers,
interactive voice response, and automated lettering (under
the different trading headings). An escalation process is
adopted to reflect the severity of the non-payment
situation. Where repayment is not effected via early contact
and it has been established that the debtor has assets, then
litigation may be pursued as the primary recovery route.
Any repayment plan that is negotiated has to take account
of the reality of the debtor's financial position and ability to
pay. Debts are segmented by type and debtor
characteristics and the appropriate collection/recovery
route is then ascertained. Debt characteristics might
include: source of debt, debt size, time since last payment
etc and debtor characteristics might include: age of debtor,
employment, homeowner, telephone, extent of
indebtedness etc. Credit reference information is available
on-line to support decision-making.
Champion challenger approaches are used to identify the
optimum recovery processes. Thus letter text and telephone
scripts, frequencies of letters/calls etc are varied to identify
the most effective process relative to the debt and debtor
type. Activity-based costing is used to monitor actions
against recoveries in order to optimise the cost/recovery
ratio. A document imaging system is being introduced in
order to track customer contacts on-line. It is envisaged
that the use of the internet in collections will take-off in the
future and fundamentally change the
economics/approaches to collection. Behavioural scoring is
used to guide strategies and segmentation. There is an
intention to make more use of 'debt surveillance' i.e. taking
no action until the debtors' financial circumstances change
and the use of debt sale to external agents. A problem for
collectors is the use of 'death' as an excuse for not paying.
This is a sensitive issue and collectors have to be careful
when verifying the death of a customer/debtor i.e. Death
Certificate as proof. The success of DRD has led them to
experiment with collecting debts on behalf of other
organisations rather than being an exclusive operation for
the bank i.e. to act like an external agent.
In-house tracing of debtors is undertaken although external
agencies are used on a trace and collect basis.
External agents are used increasingly on a trace and collect
basis when in-house processes have proved to be
unsuccessful. Up to 10% of all accounts that have been
referred to DRD are placed directly with external agents
without any recovery activity. This process allows the
DRD to monitor its own performance against the external
collection agents. The policy is to use only 'four of the
largest and most effective UK agents'. The performances
can then be used for benchmarking internal processes.
Agents have to sign a strict Service Level Agreement
aimed at protecting the bank's image.
New business is allocated to external agents on a
percentage split based on how they have performed over
the last 3-6 months, the better the agent performs the
bigger percentage they receive. Accounts are taken off
agents after 6 months if they have not received any
payments. However the accounts are then transferred to
other agents for a further 18 months making 24 months in
total. The agents are paid a commission on successful
cases. Most of the agents use a field force for doorstep
collection.

Credit and Debt Management – 2008 Survey
112 Research and analysis by the Credit Management Research Centre, University of Leeds Business School
In summary, "each of the style and methods used within the
collection process are different and unique, and are very
deliberate in terms of attempting to convince the debtor
that due to their continued non-payment, their situation is
becoming more serious".
The Company does not sell debt and rarely uses litigation
as a recovery option. Litigation is used very selectively and
judgements are enforced by attachments of earnings,
charging orders and warrants of execution.
4.7.2. Case B: Credit Card Provider
Company B, a major financial services organisation which
has over 10 million and runs a centralised collections
facility which also handles accounts which have exceeded
their credit limits and looks at accounts in these areas for
signs of fraud. The department has its own 'in-house'
collection agent that trades under a different name from the
bank and uses external agents for collection. They have
recently rationalised their use of agents to 6 'best in class'
collection agents. At any point in time approximately 1.8
million accounts will be delinquent (overdue by at least 1
day).
The company has recently replaced their computer systems
with a new system jointly developed with a commercial
partner, this is a 'customer service' system rather than a
collection system. The Company has also implemented
Fair, Isaac's TRIAD. TRIAD is used predominantly as a
customer relations management tool rather than a
collections tool. They have introduced software for late
collections (’Debt Manager’). The Company develop,
research and implement scoring methodologies and are
constantly re-appraising scoring methodologies for account
applications, fraud and collections in the context of their
developing systems. Scoring is currently used for
application processing, authorisations, collection scoring,
behavioural scoring and recently a propensity to repay
score has been developed.
There has been an increased emphasis on the customer
assistance element of customer management. Customers
going into arrears are kept within the CRM system and
staff attempt to negotiate and manage 'solutions' with the
customer. This is aimed a rehabilitation and gradual
progression into good payment habits. The emphasis in
recent years has switched to a ‘US style’ of collection
where staff are incentivised to ‘collect cash’ and league
tables of collections performance are produced, monitored
and bonuses allocated on the basis of collections. Staff can
receive bonuses up to £9,000 per annum on the basis of
cash targets and ‘promises kept’. CRM staff are trained to
recognise that delinquency may only be temporary and that
customers should be retained in the CRM system if at all
possible. Passing the debtor to collections usually marks
the end of the customer relationship. Thus the focus of
CRM is to understand the reasons that an account is out of
order and implement a strategy to return the account to
order. Different strategies are adopted with the debtor
based on behavioural scores and age and size of debt.
CRM staff have a tool-box of solutions; defer payment, re-
age the account, establish a repayment programme, change
credit limits. The process could keep the account in the
CRM system for 6 months before collection activity is
implemented. Work is being undertaken to develop an
intelligent agent that automatically suggests the 'best'
solution for a customer. The company use segmentation
and champion challenger strategies in CRM management.

Credit and Debt Management – 2008 Survey
113 Research and analysis by the Credit Management Research Centre, University of Leeds Business School
Major trends in the last 3 years have been (1) focus on
gaining contact early (2) increasing contact rate through
accurate phone number, mobiles (3) use of text messaging
to ask the customer to phone in (4) more resource put into
collection activity (i.e. staff). (5) an emphasis of evaluating
actions versus recovery and researching the optimum
‘timing’ of actions. (6) taking a harder stance with debt
management organisations in negotiating repayment terms.
The company currently uses a collections management
package to control the collection process, an in-house
system for the Recovery section and a litigation package
(Debt Manager). The litigation package will take care of
standard paperwork such as the issuing of warrants,
thereby leaving the collectors free to deal with exceptions.
The objective of collections is 'to collect out as much as
cheaply as possible'. There is almost no use of litigation
with a preference now for 'debt surveillance' the use of
agents and 'debt sale'.
A power dialler is used for outgoing calls and a telephone
management system is used for incoming calls. This
system provides on line statistics on productivity. Queues
are managed by scoring systems.
The company has made significant investments in the MIS
system i.e. 'we have invested heavily in measurement'. The
key to success is regarded as measurement, learning and
knowledge. Solutions versus outcomes are monitored and
reported on. Performance drivers are identified and
monitored The monitoring of champion challenger
strategies has become more sophisticated. The front end to
the reporting system is customised, offering department
specific options. Managers can view budgets, actual profit
& loss figures, productivity, staffing reports and exception
reports. Reports such as profit & loss accounts versus
budgets can be viewed at different levels (e.g. cost centre,
nominal account) allowing the user to go to the level of
detail they need on a particular query. The MIS department
has developed desktop macros to perform routine tasks.
This has led to a significant reduction in the number of
staff needed for routine work.
Collection is split into two main sections; customer
assistance (Credit) and late collections (internal debt
collection agency). Supporting the activity is a Business
Improvement team that provide management information,
implement and test new strategies. Problem accounts are
now detected much earlier that a few years ago and
solutions put in place. After 4 collection cycles the account
will be passed straight into the internal collection agents
processes.
The Power Dialling section usually makes the first
attempts to contact the customer in the early stages of
arrears, although it is also being used in mid range arrears,
tracing gone-aways and providing "welcome calls" to new
account holders. Operators work part time on 4 hour shifts
with break time allowed. Working the power-dialler is seen
as an intensive job that cannot be maintained for long
periods. The working mode also fits well with the pattern
of hit rates for call connection. The aim at this stage in
collections is to manage the customer not the debt.
Customers are now encouraged to 'phone-in' using a free-
phone number to discuss arrears positions.
The section does make use of agency staff and recognises
that with permanent staff there is a balance to be found
between the quality of staff and the length of time they are
likely to stay with the job. New staff are given a 12 week

Credit and Debt Management – 2008 Survey
114 Research and analysis by the Credit Management Research Centre, University of Leeds Business School
training course followed by ongoing training sitting with
an experienced collector and training in the collection
system. The section has supervisors and floor walkers who
are able to provide assistance with lengthy or difficult calls,
although there has been a trend towards a lower number of
supervisor referrals over time.
Outbound power dialling is usually done in the evenings
between 6 and 9 and on Saturday mornings. Daytime calls
are made using the account holders work number and
evening calls using the home number. On being connected
operators are given an initial screen of account information
which includes the last two actions taken with the account,
and the operator can bring up other information including a
full diary of contact as necessary, solutions and promises.
Emphasis is being placed on collecting data on customers
through this process and providing assistance staff with a
'customer-level' view.
Although the Power Dialling section try different strategies
on calls, the current system gives them no way to track the
results of their strategies automatically. The new systems
being implemented have improved this situation so that
actions and responses can be tracked.
The focus of customer assistance is managing the customer
not the asset. Customers are segmented according to the
type and age of arrears and approached with different
strategies based on 'balance and behaviour score'.
Behaviour types are also treated differently in the 'contact-
pay' environment.
Interpersonal skills are a key competency in this area, as
staff need to negotiate with the account holder. The
emphasis is mainly on individual collector judgement in
this section, although the supervisors can monitor collector
performance through the MIS system. One aim here is to
get the accountholder to see the Company as the preferred
creditor, i.e. the one they will pay first. Some
accountholders pay cards bills first in any case, so that they
can retain their credit card. A main aim here is to limit the
loss to the business, either assisting cardholders in keeping
to a repayment plan perhaps by reducing or stopping
interest, or if a repayment plan cannot be achieved, to
decide the most effective method of recovery.
A new member of staff will be learning the role over a
period of up to 6 months, although the exact time is
dependent on the individual collector.
Collectors use TRIAD for champion/challenger strategy
trials.
Once an account has reached a position where solutions are
not being kept it will move into the in-house debt
collection agency, although the route taken by an
individual account depends on the collector's judgement.
The 'in-house' agency is a wholly owned subsidiary with its
own registered company name. The use of the agency,
giving the impression to the customer of external
involvement in the debt collection process, is seen as being
extremely effective. The company also use 6 external
agents and benchmark their performance against the in-
house agent. Debts are allocated outside on the basis of
recent performance. Monthly performance statistics are
monitored closely.
The Company is looking to use debt sale more in the future
on earlier stage delinquencies.

Credit and Debt Management – 2008 Survey
115 Research and analysis by the Credit Management Research Centre, University of Leeds Business School
4.7.3. Case C: Large Volume Lender- Retail Card, Personal Loans
Company C offer three types of product; a retail
chargecard, unsecured personal loans and a reserve
account. The average delinquent balance of a personal loan
account (£6,500) is significantly higher than those on card
accounts (£800) and this can influence the strategy for
dealing with arrears in the different account types. The
company deals with around 2.5 million active accounts and
has over 50 million account records. Like many retail cards
the company find that customers use this as a last resort
borrowing facility and delinquency has risen. However,
recover income as a percentage of arrears has grown in
recent years as a result of restructuring collection processes
and strategies. The approach has become more aggressive
in timing and collection effort in early stage delinquency.
Accounts are charged off into collection/recovery after 90
days arrears.
A number of computerised systems are used to manage the
accounts from application time through to collections, as
illustrated below. The system is highly automated to deal
with high volumes of accounts with automated inbound
procedures and predictive dialer outbound.
Company C use packaged systems supplied by Experian (a
major credit reference agency). An application processing
system is used to process applications for credit with
accepted applications being passed to the account
management system. The account management system
monitors for various types of delinquency, including going
into arrears and cardholders exceeding their credit limit.
Behavioural scores are produced for accounts on a regular
basis, and these are used in areas such as setting of shadow
limits (the maximum credit limit an account would be
allowed), processing credit limit changes and deciding
strategies for dealing with arrears.
C A R D P A C- A c c o u n t
M a n a g e m e n t
A U T O S C O R E- A p p lic a tio n
P ro c e s s in g
T R IA D- B e h a v io u ra l
s c o rin g /s tra te g y
O L C (O n lin e C o lle c tio n s )- C o lle c tio n s
M a n a g e m e n t
Chart 4.7.3.1 – Computer Systems Used from Application to Collection

Credit and Debt Management – 2008 Survey
116 Research and analysis by the Credit Management Research Centre, University of Leeds Business School
The behavioural score classifies the risk associated with
the account as high, medium or low. Company C a
behavioural scoring and strategy package to control the
decision making processes in account management and
collections. The company subscribes both good and bad
account information to a closed user group at a credit
reference agency, so account information from other
lenders is available to their decision systems.
If an accountholder misses a payment the collections
system is activated and an indicator on the account is set to
reflect its arrears status. This indicator, together with others
indicating for example an over limit situation are used in
deciding whether to include the account in the stop list sent
to stores. Many of the accounts in this early stage of arrears
will make a payment to resolve their arrears without further
action; they may be account holders who have gone on
holiday and forgotten to pay their bill first, for example.
Accounts which regularly pay late will be moving in and
out of arrears as they go through a monthly cycle. At this
stage there is a high proportion of debt rescheduling. The
collections system interfaces with the strategy management
system to decide on how to progress an account through
collections.
Accounts in arrears are classified by risk or a ‘propensity
to pay score’ and placed into queues for contact with each
queue containing accounts with similar characteristics e.g.
high risk accounts with low balances. There can be up to
200 different queues, with accounts put forward for action
from each on a review date basis. Accounts are
automatically moved to a different queue as a result of
customer contacts, so that they are in the correct queue for
their next scheduled contact. The behavioural score and
account balance are key in prioritizing actions.
The aim throughout the collection process is to establish
contact with the account holder and make arrangements for
payment. Initial contact is initiated 5-10 days after a
payment has been missed preferably by phone, or if this is
not possible, by letter. The next statement will also carry
an arrears message if payment has not been received. If
there is no response to these measures a stronger letter is
sent. If an account progresses to 2 or more payments in
arrears it will be considered for charge-off or debt
recovery.
The telephone/letter cycle will only continue for 60 days
and then an in-house solicitor will send a letter; a notice of
default will be issued after 75 days and the account
charged-off for recovery after 90 days. After 30 days
overdue a late payment charge of £15 is added to the
account. This action has been perceived as having a very
positive effect on collections.
Company C differ from the other collections departments
documented above in that they are more a marketing tool
to the firms retail business whereas for the other firms
financial services are their main business. This has
implications for the way in which they handle arrears and
payment in general. For example, Company C will
encourage customers to use Direct Debit for either full or
minimum payment, offering a reduced interest rate to those
who do. This is not a profit maximising strategy for card
products generally as the provider earns interest on any
balance not paid off each month so full payment would not
be encouraged.

Credit and Debt Management – 2008 Survey
117 Research and analysis by the Credit Management Research Centre, University of Leeds Business School
As elsewhere there is an emphasis on customer care, but
this seems to be strengthened further by the marketing
orientation; the aim is always to rehabilitate. The Debt
Management department deal with Citizens Advice
Bureaux, who offer advice to their customer and submit a
payment plan to Company C, and also with CCCS, an
organisation offering professional financial advice and debt
counselling with a fee to the creditor of 15% of the debt.
Financial difficulties account for 25-30% of Company C’s
debts. In these cases account holders are offered a lower
payment or interest is suppressed, with a review of the
situation taking place after 3 months. At that point if there
still a possibility of improvement the account will be
scheduled for review after a further 3 months. If there is no
sign of improvement the debt is passed to debt recovery.
Contrary to experience elsewhere Company C did not find
the setting up of an in-house debt recovery company with a
separate identity effective so debt recovery is done through
outside companies.
The department consists of 67 staff in Early/Mid
Collections and 19 in Debt Management and Recovery. All
charged-off debt (90+ days) is passed to external DCA’s.
Company C is moving towards a more flattened
management structure and away from ‘specialist teams’.
The departmental manager gets a report on the
performance of the company and communicates news on
the business as a whole and on local issues to the staff via
monthly team briefings. The computer systems provide
information on the status of each processing queue and the
activities of each team to enable the manager to identify
bottlenecks and adjust things accordingly. Staff are
encouraged to make suggestions for improving the
department through a formal suggestion scheme.
A new recruit to the department is first given a two week
induction to the company as a whole, followed by a period
of up to five weeks structured training under the guidance
of a more experienced mentor. The exact length of the
training period is determined by the recruit’s abilities.
The telephone team deal with incoming calls and will work
the outgoing contact queues between calls. It is normal
policy to try telephone contact first, but if this has not been
successful after 3 days then letters are used. The evening
shift also work primarily on telephone contact.
Company C have a power dialler which is used in
telephone contacts. The dialler will work a selection of
queues generated by the collection system. Operators are
aware of the type of queue being processed so that they can
be prepared for a particular type of call, and the operator
will not be given a mixture of calls from widely different
queues mixed together. This is helpful in that the operator
is not having to make dynamic changes of tactic for each
call, thus increasing effectiveness.
The Company use 6 DCA’s 2 of which are for 2nd
placement. In addition they use 2 trace and collect
agencies. Performance measurement is undertaken and
benchmarking. The external DCA’s may manage some of
the ATPs which have been set up internally. The Company
sells written-off debt including ‘goneaways’ and IVA’s.

Credit and Debt Management – 2008 Survey
118 Research and analysis by the Credit Management Research Centre, University of Leeds Business School
Q: What techniques do you use to develop score-cards?
A: We use a number of techniques in developing
scorecards. The main one is traditional regression analysis
and most of our scorecards have been developed using this
technique either by ourselves or by third parties such as
Experian. We also use neural networks (e.g. for fraud
detection). In the past we have experimented with genetic
algorithms as a methodology.
Q: What types of score are used, how many different
scores are there, what outcome is modelled?
A: We have application scores to predict the likelihood of
someone becoming 'bad' (30 days in arrears). We have
behavioural scores which are used in collections to predict
the likelihood of someone becoming delinquent or
‘propensity to pay’. These are used in segmenting cases for
different action sets. At 60 DPD we have a propensity to
pay scorecard that predicts the likelihood of someone
paying their arrears again. The scores are used for
segmenting for different actions.
Q: Do you use Strategy Management/Champion-
Challenger approaches?
A: 'Strategy Manager' is used in application processing and
is our main decision manager incorporating the application
scorecards and our overriding policy rules (e.g. decline for
CCJs).
Champion-challenger is currently used in our collections
environment (TRIAD) to select a random percentage of
accounts for different action sets. The outcome of these
different actions are then monitored and compared to the
Champion (e.g. increased recovery income, more accounts
rehabilitated) and if they are better than the Champion they
replace it and a new Challenger is introduced in an iterative
way.
This function is also available in Strategy Manager during
application processing and we plan to use it to challenge
whether our policy rules are effective by taking on
controlled samples of accounts who would normally fail
some criterion and monitor their performance.
Q: What type of monitoring do you do?
A: Standard reports from TRIAD showing recovery
income and numbers of accounts at each stage of
delinquency. We also use roll rates to show movements
between delinquency stages. We have performance data on
all customers showing all application details and scores
and their actual outcome.
4.7.4. Case D: International Bank – Collections and Recovery
Company D represents the collection activity for 4 banks
under its ownership in the UK. The collections operation
deals with unsecured finance: personal loans, current
accounts, credit cards. Outstanding balances on these
products are typically £6000 for loans, £500 on current
accounts, £1700 on credit cards. The collections operation
deals with 180,000+ accounts per annum.
Delinquent accounts arrive in collections at various stages
of delinquency depending on the product. Loan accounts
will be dealt with when they reach 5 days past due; current
accounts 30-45 days depending on a behavioural risk
score; credit cards 2 days past due or according to risk
score. Scores are determined at the bank level and the

Credit and Debt Management – 2008 Survey
119 Research and analysis by the Credit Management Research Centre, University of Leeds Business School
TRIAD system is used to set strategies and champion-
challenger test. The collection system uses Debt Manager.
The collection team have a power dialler, case/diary
system, online CRA data, ability to take payments by
switch and can negotiate ATPs. Initially the department
contacts and tries to collect under the banks name and uses
phone/letter cycles. Debts are segmented by risk and value
to determine actions. Higher risk accounts will receive up
to 3 calls in a short time period. The collection operation
recently reviewed its strategy and has taken a more
aggressive stance. This was in response to a number of
perceived trends: customers are not longer worried about
indebtedness, there is less stigma, they use fee paying
counsellors more frequently, average balances are
increasing month on month, IVA’s and bankruptcy is
increasing, instalment payments offered by debt
management companies are too small.
After 60-90 days a default notice is issued if there have
been no payments. This is dealt with by an in-house
solicitor under the solicitors’ name. ATP’s may be
negotiated at this stage. At 135-140 days the debt will be
passed to the first internal DCA. The system is highly
automated with little human intervention with automated
strategies. Write-off occurs at 180 days so this period 140-
180 represents an attempt to gain an arrangement and
rehabilitate the customer.
The department has an in-house litigation team and around
6,700 accounts per month move into litigation. The
litigation team are charged with gathering information on
assets and income in order to ascertain if the account is
worth taking to court for recovery. Accounts where there is
poor information will be passed to external DCA’s. The
success rate on litigation is 2-3% of balances recovered.
The department uses 8 external DCA’s, 6 deal with trace
and collect. The bank sells debt to 4 debt buyers. The debt
is allocated randomly to DCA’s but in future the
department will allocate on the basis of DCA performance.
At the moment there is no integration of information
systems with the DCA’s. Commission rates are 20-25% for
1st
placed debt and 35% for 2nd
placed debt. After 270
days the debt will be withdrawn if the DCA has been
unsuccessful. Increasingly the department is selling debt at
2-3p in the £.
There are 120 FTE’s working on inbound and outbound
telephone collections. The internal DCA has 20 FTE’s; 15
staff work ‘specialist collections’ ; 8 work on tracing, 8 on
fraud and 20 in litigation. A team of 6 manage external
DCA’s and debt management organisations. Staff are
trained for 6 months in policies, procedures, negotiation
both on the job and in class. The staff have cash collection
targets, and are monitored on promises and talk time.
The department is looking at activity-based costing,
producing a ‘customer-level’ view, and process
benchmarking.

Credit and Debt Management – 2008 Survey
120 Research and analysis by the Credit Management Research Centre, University of Leeds Business School
4.7.5. Debt Management and Collection in the Utilities Sector
This section draws on information from a number of
sources. The CMRC has run benchmarking groups from
major companies supplying gas, water and electricity
which has generated data on the billing, collection and
cycles. Information on practices and processes supporting
collection and recovery were shared by the group. More
detailed interviews were conducted with companies in the
water industry. These case studies are reported along with
a synthesis of ‘best practice’.
The Utilities sector by definition have large volumes of
customer accounts and debts to manage in that all
households and businesses utilize their services. The
process generally follows that charted below ; metering,
billing, collections and recovery. The vast amounts of data
and information generated at each stage suggests that there
is much scope for using data analytics and automated
processes to support debt management.
The purpose of the Utilities Benchmarking Forum was to
define and measure a series of comparable Key
Performance Indicators covering debt management issues
in the utilities sector; to identify and share best practices;
and to identify and quantify drivers of performance
improvement. The Forum collected and compared detailed
data on all aspects of debt management which was
subjected to some sophisticated statistical analysis of the
data.
The data sets were split by household/consumer supply and
business/commercial supply. This analysis in this section of
the report focuses on household supply. The detailed
questionnaire was organised in terms of activity under the
main headings of: customer acquisition; customer billing;
live account management; final account management; cost
effectiveness; and results. The results section measures bad
debt/sales; days sales outstanding, aged debt profiles,
customer retention/attrition.
Chart 4.7.5.1 – Entire Billing Process (Source SAP Business Intelligence)

Credit and Debt Management – 2008 Survey
121 Research and analysis by the Credit Management Research Centre, University of Leeds Business School
Although the forum collected and compared data on a large
number of dimensions of the debt management operations
the following key performance indicators provided much
focus of attention:
• days sales outstanding
• bad debt as a percentage of sales
• age of debt profile
• tracing results on "gone away" customers
• number of "gone aways"
• contact calls per hour
• percentage of outbound calls on power-dialler
• percentage of customers on direct debit
• percentage of customers with known phone
number
• percentage of accounts with held bills.
Multivariate statistical analysis was been undertaken to
examine the patterns of variation in key variables such as
the bad debt ratio, using techniques such as multiple
regression analysis. The purpose of this analysis is to
determine what factors drive the differences in bad debt
levels between services, over time and in relation to debt
management practices and customer-base characteristics.
For instance, we are able to model the bad debt ratio taking
into account the simultaneous effect of many determining
characteristics.
A model of the factors impacting on debt levels i.e. debtor
days; aged debt profile; levels of uncollectible and bad
debt; write-off - was developed to guide statistical analysis
and good practice. This is summarised in the chart below:
Factors Impacting on Debt in the Utilities Sector
Customer TypeEmployment StabilityIncome StabilityDeprivation/Geo‐demographicsCustomer Risk /Debt ProfileMarital StatusProperty Type
Customer MobilityChange of SupplierChange of AddressChange of RegionChange in Circumstances
Customer KnowledgeAccurate AddressAccurate Phone Numbers Name of Bill Payer Head of HouseholdHousehold OccupantsProperty TenureService UsageChange in UsageAcorn Code/Geo‐demographics
Billing CycleAccurate ‘Read’ Accurate Billing (Customer Details; Usage/Tariff)‘Clean’ BillTimely BillingDispute Resolution
Payment ArrangementPayment tailored to riskPayment tailored to income (available £’s)Deposits arranged according to riskConvenient payment methodsMaximise cash‐flow (NPV)
Customer ContactCollections strategyContact ‘Success’ rateCall effectivenessSolutions negotiated/ATPDispute resolutionPromises keptCash CollectedOutsource decision
Chart 4.7.5.2 – Factors Impacting on Debt in the Utilities Sector

Credit and Debt Management – 2008 Survey
122 Research and analysis by the Credit Management Research Centre, University of Leeds Business School
Each of these factors is thought to impact on the customer
debt profile. Some of these factors relate to management
practices and the efficiency of the collections processes;
others relate to the ‘nature’ of the customer-base and the
company’s ability to gather and maintain intelligence on
the customer. Often the former (collection efficiency) can
be ‘constrained’ by the latter (poor customer information).
Clearly much of credit management and collection activity
is dependent on having a good customer relationship
management data-base. Of vital importance is accurate
‘customer information’ that is details of the person charged
with paying the bill at the address and accurate contact
details i.e. address, phone number, mobile number, work
phone number, email address etc. This activity, of course,
involves tracking changes in occupancy and movements of
indebted customers. Activity is geared to attempting to
minimise the proportion of the customer-base that is ‘gone
away’ or ‘unknown’ and verifying properties that are
‘vacant’ or ‘unoccupied’. Gas and Electricity customers
can change supplier at the same address whereas water
customers only change supplier by moving into another
supplier region. Knowledge of the customer’s employment
status, income and assets (i.e. property owner) is important
for both tracking changes in customer circumstances and
tailoring payment methods and tariffs to customer risk
(available £’s) and, of course tailoring the payment method
to suit the customer’s circumstance. Service suppliers
should attempt to maximise the present value of cash-
flows. For instance, if a bill is due for payment in total at a
particular point in time then it should if possible be
collected at that time. Arrangements to pay over a longer
period (budget accounts, monthly direct debit) effectively
reduce the NPV of revenues.
Accurate billing will have a bearing on debt profile since
an accurate bill will be subject to fewer disputes and
queries which delay the collection process. Bills which
relay on meter readings may be held up and queried if an
accurate meter reading has not taken place. Bills may be
estimated and/or be based on an inaccurate reading. The
proportion of estimated bills or the proportion of customers
yet to have a meter reading will impact on the debt profile
of the customer-base. Where there are disputes the more
quickly that they are settled the more quickly revenues can
be collected. The aim is to collect due revenues at the first
billing and therefore maximise cash flow and minimise
collections costs.
Employment, income and property information, as
suggested above, will be useful in gearing payment method
to customer type and ascertaining whether security or a
deposit should be requested. The task is to ease the
payment for the customer where appropriate and/or make
payment as convenient as possible to avoid arrears and
delinquency. For some utilities this may involve using a
pre-payment meter or usage on a ‘pay as you go’ basis.
Clearly water companies, who have an un-metered
customer-base, predominantly, do not have this option.

Credit and Debt Management – 2008 Survey
123 Research and analysis by the Credit Management Research Centre, University of Leeds Business School
Collections activity, should an account become overdue,
depends on having customer information and accurate
billing/usage information. Customer information should
guide the collections approach and billing information will
facilitate the resolution of disputes. Collections activity
should involve ‘informed’ and ‘prompt’ action after the
initial sequence of billing and reminder. Early contact via
phone will establish the customer’s ‘problem’ with
payment, resolve any dispute or payment method problems
and ‘collect’ immediately or establish a promise to pay.
More sophisticated operations will prioritise collections
actions or letter/phone sequences based on risk scores and
account balances. Debt progression will be based on
risk/behaviour profiles in order to minimise collection
costs. The collections performance will be a function of the
accuracy of customer contact details and current phone
numbers. Decisions on later stage debt progression i.e.
outsourcing to DCA’s or legal action should be based on
cost-recovery probabilities.
4.7.6. Best Practice in Collections and Recovery: Evidence from US Utilities
Interviews were undertaken with members of the
International Utility Group, a group of US Utility
Companies offering combined services, gas, electricity and
water. A follow up interview was conducted with the credit
and collections managers of a US Water Company. The
purpose of this series of interviews was to document
current collections and recovery practices in the US
Utilities, assess and document perceptions of ‘best
practice’ and analyse current collections performance and
trends in the key performance indicators used for
benchmarking.
Common elements of ‘best practice’ as perceived by US
practitioners can be summarised as follows: Collection and
‘revenue recovery’ activities are regarded as central to the
success of Utility Company performance and are organised
around clear and simple ‘mission statements’ which all
employees are aware of and focused on. Mission
statements tend to be ‘customer focussed’ which recognise
that effective collections and low write-offs ultimately can
lower prices for the customer-base. As one utility
remarked, “we want to minimise the percent of accounts
overdue, we aren’t doing customers a justice by letting
them get so far behind”
An example of the key elements of such a mission
statement was: “to keep rates low for customers and
improve net income by – minimising write-offs;
maintaining a safe, cost-effective operation; ensuring that
every customer pays for the service that they use”
The idea is that all actions are aligned to ‘corporate goals’.
An individual employee is encouraged to understand how
their own work ‘fits’ or contributes to overall goals
Best practice involves ensuring effective policies and
processes throughout the life-cycle on the customer – from
customer recruitment through to debt recovery. At all
stages of the life cycle the customer’s risk has to be
assessed, measured and monitored. Risk assessment is not
a ‘one-off’ activity but is undertaken at the ‘front-end,
middle and back-end’. Clearly such risk assessment
requires a considerable customer intelligence data-bank
that can be analysed where relationships between risk and
payment can be understood and modelled and ‘behaviour’
scores implemented.

Credit and Debt Management – 2008 Survey
124 Research and analysis by the Credit Management Research Centre, University of Leeds Business School
The life-cycle can be categorised as:
(1) ‘front-end’ that deals with new or returning customers
applying for the service. The processes involved in setting
up a new account involve positively identifying the
customer, risk scoring the customer using a credit bureau
application score and analysing the risk history of the
premises being supplied. There may be amounts owing
from the customer of ‘premises’ that would be settled
before a new account is established. In the latter case,
depending on the circumstances, the owed bill might be
settled or waived prior to connection of supply. Based on
risk scores the new account may be set up only after a
deposit is made.
There may be several alternatives in relation to the amount
and conditions of the deposit e.g. advance payments,
deposit in instalments. For instance a customer may be
required to pay a deposit if (a) they have filed for
bankruptcy (b) there is a possibility of default on payment
in the future (c) an existing customer has moved into
delinquency (d) the account has been back-billed for usage
because of theft (e) the customer has an unpaid bill from
previous service (f) the customer only wants the service for
a short period. Typically deposits are calculated as 2
months usage.
Revenue Recovery Customer Impact
Active Accounts
Final Notices Mailed
Accounts For Collection Action
Collection Actions
Disconnects
Past DueFinal BillWrite-off
% of Customers
Field -47% OTC- 53%
Effective FieldWork – 42%
OTC contact– 58 %
-100%
- 12%
- 6%
- 3%
- 0.8%
- 0.4%
-0.2%
Chart 4.7.6.1 – Revenue to Recovery – Customer Impact

Credit and Debt Management – 2008 Survey
125 Research and analysis by the Credit Management Research Centre, University of Leeds Business School
(2) ‘Middle’ relates to account management and
maintaining customer service. The key to good revenue
management is accurate and consistent billing, the setting
of payment arrangements appropriate to customer risk and
circumstances (including additional deposits if required),
and effective collections actions (outbound calls and field
actions) first billing, final notices, service charges etc. An
example of the collection process is given below with the
approximate percentage of the customer base which
progresses through the account management and collection
process:
Behavioural scoring underpins account management and
collection actions. Collection actions include final notices
issued, outbound collection calls and field visits. Other
actions that might be implemented as a result of behaviour
scores could be requests for additional deposits or
establishing a payment arrangement with the customer.
The risk score dictates whether or not to incur the costs of
collection activities. One utility found scoring useful when
evaluating ‘final account’ customers. The behavioural
scoring system generated a ‘final account score’. This
score was used to make a ‘will pay/won’t pay’ prediction
and assign more resource to the ‘won’t pay’ segment and
prioritise collection actions.
Scoring process and customer data-bases are used to :
improve applicant identification; make deposit
management more effective; reduce delinquencies; reduce
the number of disconnections; reduce the costs of
collection activities; minimise the number of calls and
contacts related to collection activities i.e. make them more
effective; increase the level of customer satisfaction;
reduce charge-offs/write-offs; calculate reserves more
accurately. As a result of the implementation of scoring
systems in the collections process one utility claimed a 1.6
million reduction in correspondence, 12% reduction in in-
bound calls, 59% reduction in disconnections and field
visits, 25% reduction in delinquency over 30 days and 40%
in delinquency over 60 days, and a 12% reduction in DSO.
Collection actions are evaluated and any ‘loopholes’ in the
processes are identified and dealt with. Of course, the US
utilities undertake benchmarking activities in order to
identify variations in performance and to learn to improve
practices and processes.
(3) ‘Close Service’ involves closing the account by
providing the customer with a final bill and includes
dealing with cases that have filed for bankruptcy. Actions
classified as ‘pre-write-off recovery’ will be undertaken
such as final demand letters, tracing, transferring balances
to active accounts, the use of external DCA’s, fraud
investigations.
4.7.7. Key Performance Indicators used in Debt Management
• Bad Debt Loss Ratio =
Net Uncollectibles divided by revenue
• Delinquency ratio =
Total Number of delinquent customers divided by
active customer-base
• Days Sales Outstanding
• Aged Debt Profile
• Operating Costs per employee
• Customer Accounts per Credit Employee
• Average Cost of Collection per Customer

Credit and Debt Management – 2008 Survey
126 Research and analysis by the Credit Management Research Centre, University of Leeds Business School
• Collections Effectiveness Index =
____ ( 1- non current receivables ) * 100______
(last month’s total A/R + sales for current month) – current A/R)
the proportion of overdue amounts at the end of
the month relative to the total amount of
receivables available for collection during the
month.
4.7.8. Best Practice in Collections and Recovery: The Water Sector
In this section we provide some detailed survey and case
study evidence on credit management practice in the water
sector. First we detail a guide to ‘good practice’
synthesized from the various interviews and data. We then
evaluate current practice against this checklist.
This guide to good practice in the water sector was derived
from structured interviews and consultation carried out
with representatives from the UK water industry. The
purpose of these interviews was to provide a check list of
feasible/desirable activities, processes and information
requirements deemed necessary to implement an effective
collections operation. Larger operations clearly have the
scale economies to implement certain systems and
processes which may not be the case in the smaller supply
companies. Later in the report we document the current
practices of a representative sample of water supply
companies against this check list.
Case studies from these interviews are reported later in this
report. Detailed questions were asked relating to customer
type and knowledge, billing cycles, payment methods and
arrangements, customer contact and account management,
collections and recovery and training, technology and
software.
A Guide to Good Practice
Customer Type and Knowledge
CharacteristicsName of PayeeDate of BirthMarital StatusAccurate AddressAccurate Phone Number(s)Previous addressHousehold OccupantsProperty TypeProperty TenureEmployment StatusHomeowner Status
Data‐base managementAcorn/Mosaic/Geo‐demographicsDeprivation/Geo‐demographicsCustomer Risk ProfileChanges of contact detailsData update and enhancement strategy
Absconder managementTrack house movesTrack gone‐away/vacantIdentify ‘unknown’, empty propertyIn‐house/external tracing capabilityReturned bill coding Returned bill strategyVerify persistent non‐payers in occupation
Billing Cycle
Tariffs and SegmentationEnsure tariffs are correctmetered/un‐meteredhousehold/commercialidentify ‘vulnerable’ customers
BillingBilling clear and understandablecater for disadvantaged (e.g. Braille, large print)
‐ clarity of debt progression proceduresfor the customer and employees
Timely billingmeter reading to billing efficiency
Queries and DisputesAccurate and regular meter readingsReview tariffs appliedMinimise ‘estimated‘ readingsQuery and dispute resolutionphone in helplineletter answer efficiencycall‐in (face to face) facilitysegmented contact centreemployee discretion/empowerment
People, Training and Technology
PeopleMission statementTraining (classroom,on‐the‐job)Empowerment and discretionQualificationsSpecialisationwhere appropriateTargets and incentives where appropriate
Technology/SoftwareAutomation and integration where possibleManual interventionOptimise flow processesDocument processes/proceduresData‐base management and ‘scoring’Champion‐challenger facilityManagement Information System
Chart 4.7.8.1 – A Guide to Good Practice

Credit and Debt Management – 2008 Survey
127 Research and analysis by the Credit Management Research Centre, University of Leeds Business School
4.7.8.1. Areas of Disadvantage Specific to Water
There are a number of areas that prevent and/or constrain
water supply companies from adopting the ‘best practice’
model in collections and recovery. Sophisticated
collections operations rely on detailed customer level
information to build automated collection systems driven
by ‘behavioural scoring’ models. Collection activities are
prioritised and varied according to customer risk and
balances outstanding. Management information systems
facilitate the varying of collection strategies and debt paths
for each customer and the costs-benefits are analysed for
continual improvement. Collection activities are proactive
and intense in early stage arrears (30 days overdue).
Contact rates with customers are high. Of course, most
companies providing a product or service can ‘choose their
customers’ i.e. reject high risk customers, price the risk,
and insist on advance payment and or security/collateral.
Some key factors in relation to ‘customer information’ and
‘early’ collections activities or ‘sanctions’ are not available
to the collections operations of water supply companies.
Water companies are constrained by regulations governing
the water supply contract and the (sequence of) actions that
can be taken in the event of payment default (e.g. ban on
disconnection). Some investments in collection technology
and software may only be feasible for large scale
operations (e.g. the technologies employed by large
volume lenders).
Payment Methods and Arrangements
Payment MethodsDirect Debit PenetrationStrategies for payment from non‐bank account customersDirect deductions from benefitsInstalment/Budget Account Arrangements(weekly/fortnightly/monthly)‘Switch’, ‘over‐the‐phone’ paymentsInternet paymentsPayment tailored to income (available £’s)Deposits arranged according to riskConvenient payment methodsCharitable trust
in‐houseexternalShared
Maximise cash‐flow (NPV)
Customer Contact and Account ManagementTimely response to overdue/queriesPhone contact (alternative numbers)MinicomPower‐dialler/Caller linked to account data‐baseStrategy for ‘engaged’, ‘voicemail’ etc‐ Letter strategyIn‐bound customer contact and managementPhone help‐lineDocument imaging and management systemAccount management systemOut‐bound calling facility and management
Collections and RecoveryCollectionChase action
‐ Speed of response‐ Reminder Strategy ‐ Letter Sequence, Clear ‘Instructions’, Clear ‘debt progression’‐ Phone/Letter alternatives
Powerdialler/Caller linked to account data‐baseDiary/case management systemAlternative contact methods (Phone/SMS/Personal Visits)Segmented DelinquentsBehavioural/Collection ScoresPrioritisation of actions and sequencesEffective ‘timing’ of actionsEffective sequence and wording of written notices
Escalation Strategy‐ Behaviour score – debt progression sequence
LitigationPre‐court action predictive modellingverification of debtverification of customer incomeverification of customer ‘assets’Policy on recovering court costsPrompt actionApproach to court optionscharges on incomecharges on propertyGarnisheeWarrantsOral examination
External Debt CollectionEnsure Code of Practice (CSA membership)Benchmark DCA panelAccess to performance informationAccess to debt ‘outcome’ informationContractual arrangementsTerminated/open debt policyStrategy on placement (1st, 2nd, litigation etc)

Credit and Debt Management – 2008 Survey
128 Research and analysis by the Credit Management Research Centre, University of Leeds Business School
These issues are summarised below and will be
documented in our check-list of ‘good practice’ later in the
report:
No choice over ‘customer’ (applicant)
Water supply companies are unique in that they have a
commitment to supply every household regardless of risk
or payment behaviour. They cannot credit vet new
customers or retrospectively risk score existing customers.
No security deposits can be requested in relation to supply.
No contract with the customer
Water companies supply water without having a ‘contract’
with the customer. This, amongst other things, means that
they can only gather information about the customer if the
customer volunteers it. Basic information such as name and
address of the customer, phone contact details,
employment status etc are often unknown. Such
information is regarded as essential for most other
‘collection’ operations.
The problem of ‘gone-aways’ can be more pronounced for
this sector because the customer feels under no obligation
to inform the supplier when moving property (unlike
telephones, gas and electricity where the supplier may
move with the customer)
No customer ‘risk assessment’ on connection or in
‘account management’
Lack of a contract and customer level information means
that water companies cannot employ ‘risk and behavioural
scoring’ methods that are used in most other collection
environments to prioritise actions and debt path sequences
thus minimising collection costs. Behavioural scores
require payment behaviour information along with
customer characteristics information.
Chart 4.7.8.2 – Number of Customers using Prepayment Meters

Credit and Debt Management – 2008 Survey
129 Research and analysis by the Credit Management Research Centre, University of Leeds Business School
No pre-payment meter option
Gas and Electricity supply companies manage customer
risk by installing pre-payment meters for customers with a
history of payment difficulties. This is an option not
available to water supply companies. The growth in the
usage of pre-payment meters is summarised in the chart
below:
Minimal level of customer information prior to
‘delinquency’
In most collection environments effort is placed on
proactive collections. This involves identifying customers
with payment difficulties and resolving the problem prior
to delinquency. Should a customer go into early stage
delinquency (e.g. 1 missed payment) then early efforts to
recover arrears are made. Water companies will have
limited information about a customer until the customer
has defaulted on a payment. Chasing actions therefore
takes place much later than in other collection
environments and it is only at this stage that some
customer level data can be gathered.
Infrequent billing/payment behaviour
Infrequent billing and payment (unless on monthly) makes
it more difficult to assess customer risk and build timely
‘behavioural scores’. Behavioural scoring, as mentioned
earlier really requires data from frequent transactions (e.g.
monthly bills and payments). Water companies do not have
the volume and frequency of information to build effective
scores.
Behaviour scoring unsophisticated
Behavioural scoring requires both frequent payment
behaviour data and basic customer characteristics data (see
above).
Champion-Challenger
Champion-challenger collection strategies are used by
large lenders. Varying collections approaches and the
ability to test new strategies is seen as essential for
effective collection. Water companies have to adopt a
predictable sequence of collections actions (by regulation)
and don’t have the decision support infrastructure to adopt
champion-challenger.
Relatively small outstanding balances
Initially a customer in arrears with water charges will have
a relatively small outstanding balance (£300-£400).
Collection actions may not be cost effective.
Continuous charging therefore accumulating debt
Water charges accumulate year on year and can build into
a substantial debt for a customer that has neglected to pay.
The higher and older the debt, the more difficult it is to
collect
Limited or ineffective ‘early’ sanctions for non-payment
Water supply companies have no sanctions to prompt
payments other than court action. Effective use of the
courts requires detailed customer level information on
income and assets and may be more cost effective when
large volumes of actions are processed.

Credit and Debt Management – 2008 Survey
130 Research and analysis by the Credit Management Research Centre, University of Leeds Business School
Debt accumulated before effective action can be
implemented and/or enforced
By then time a debtor gets to court the debt may have
accumulated to a significantly higher level making it more
difficult to collect.
4.7.9. Credit and Debt Management Practice in the Water Industry
The data presented in this section is derived from a study
carried out on a sample of sixteen water sector companies.
Areas covered included the structure of the debt recovery
department in relation to customer base, timings and
effectiveness of debt recovery operations, bill referral,
county court actions, the use of scoring and customer
profiling, knowledge of the customer base, tracing and
outsourcing and the payment options offered (frequency
and methods). The charts below show the responses from
each individual firm and the high, low and mean figures for
each variable. Not all companies responded to all questions
either because the question was not applicable and/or the
data was not available. The identities of responding firms
have been made anonymous for the purpose of this section.
4.7.9.1 General Information
In this section, information was sought from each company
regarding their domestic and commercial customer base
and the extent to which customers are billed directly versus
local authorities or other agents. Information was also
recorded on the level of staffing in each recovery
department. For the purposes of analysis the responding
companies have been divided into two categories, large
companies (turnover in excess of £1 million) and small
companies (turnover less than £1 million).
4.7.9.2 Direct billing and other methods
As can be seen below, the majority of companies bill the
customer base directly with 9 of the 18 respondents
indicating that direct billing accounts for 100% of activity.
However, when this variable is broke down by size of
customer base large companies in the sample average 89%
of customers directly billed compared with almost 100%
for the small water provider. One large company reports
that at present, only 57% of their customer-base represent
direct billing. This breakdown can be seen in the chart
below.
% of Directly billed customers
0102030405060708090
100
1 2 3 4 5 6 7 8 9 10 11 12 13 14 15 16 MinMax
Mean
Respondent ID
%
% of Directly billed customers
0
1020
30
4050
60
70
8090
100
Min Max Mean
Respondent ID
% SmallLarge
Chart 4.7.9.1
Chart 4.7.9.2

Credit and Debt Management – 2008 Survey
131 Research and analysis by the Credit Management Research Centre, University of Leeds Business School
A number of respondents (8) indicated that they bill via their
own local authority with the highest percentage billed using
this channel being 14% for one individual company. On
average 4.92% of bills from the larger firms (by customer-
base) in the sample are via a local authority compared with
just 0.21% for smaller companies. Clearly the use of LA
collection would be beneficial for the water sector and reduce
overall collection costs (i.e. because of duplication) if the right
kind of commercial arrangement could be agreed with the
LA’s. Currently many water suppliers regard LA collection as
not being cost effective.
Other agents or water companies are also used by 7 of the
sample with one company indicating 32% of all billing via
this method. None of the smaller water companies in the
sample currently use agents or water companies to bill their
customer base.
A full summary of the information on billing to each
respondents’ customer base can be seen in the chart to the
right. As can be seen to the rightt, the majority of
companies bill the customer base directly with 9 of the 18
respondents indicating that direct billing accounts for
100% of activity.
% of Customers billed via local authorities
0
2
4
6
8
10
12
14
16
1 2 3 4 5 6 7 8 9 10 11 12 13 14 15 16 MinMax
Mean
Respondent ID
%
% of Customers billed via other agents/other water companies
0
5
10
15
20
25
30
35
1 2 3 4 5 6 7 8 9 10 11 12 13 14 15 16 MinMax
Mean
Respondent ID
%
% of Directly billed customers
0%
10%
20%
30%
40%
50%
60%
70%
80%
90%
100%
1 2 3 4 5 6 7 8 9 10 11 12 13 14 15 16Respondent ID
% of customersbilled via otheragents/otherwater companies
% of customersbilled via localauthorities
% of directly billedcustomers
Chart 4.7.9.3
Chart 4.7.9.4
Chart 4.7.95

Credit and Debt Management – 2008 Survey
132 Research and analysis by the Credit Management Research Centre, University of Leeds Business School
Companies responding to the survey were asked about
their internal collections activities and whether or not they
have an internal recovery department. All 16 companies
indicated that they have an internal debt recovery
department. 10 companies stated that they have an internal
field recovery department and 6 companies indicated that
they have an internal collection agency. The results of the
ratios of customer base to staff can be seen below.
When the number of staff per 1000 customer is analysed
there is a slight difference between the two samples. Larger
water companies have 0.04 per members of staff per 1000
customers and smaller firms have 0.05 members of staff
per 1000 customers. This represents an average of 22,225
customers per staff member (large firms) and 26,415
customers per staff member (small companies).
The time taken in days for collection of debt along with the
% success at each stage is a strong indicator of the
effectiveness in collections. As can be seen in the charts
below information was gathered on the timing of bills to
first, second and third notice and the success rate at each
stage. On average it takes the water sector 20 days before
the first notice is issued. These findings are consistent for
both sizes of company in the sample (19.75 days – large;
19.29 days – small).
Customer base per staff member
0
10000
20000
30000
40000
50000
60000
1 2 3 4 5 6 7 8 9 10 11 12 13 14 15 16 MinMax
Mean
Respondent ID
no. c
usto
mer
s
Staff Per 1,000 Customers
0
0.02
0.04
0.06
0.08
0.1
1 2 3 4 5 6 7 8 9 10 11 12 13 14 15 16 MinMax
Mean
Respondent ID
%
Time from bill to 1st notice
0
10
20
30
40
50
60
70
1 2 3 4 5 6 7 8 9 10 11 12 13 14 15 16 MinMax
Mean
Respondent ID
No.
days
Chart 4.7.9.6
Chart 4.7.9.7
Chart 4.7.9.8

Credit and Debt Management – 2008 Survey
133 Research and analysis by the Credit Management Research Centre, University of Leeds Business School
Each company in the sample issues a second notice and the
average number of days it takes to issue is 35 days. Slight
differences are evident in the timing of the second bill with
an average of 32 days for the smaller and 36 days for larger
water utilities.
11 of the 16 companies indicated that they issue a third
notice to late paying customers. The average number of
days among respondents it takes for the third notice to be
issued is 48 days. Greater differences emerge according to
the size of company at the 3rd
notice stage. It takes on
average 56 days for the larger companies in the sample to
bill the third notice compared with just 44 days among the
smaller sector.
Where firms were able to provide information on the
success rate of billing at each stage the results showed an
average of 57% of bills being paid in the water industry on
first notice. An average of 38% of bills are successfully
paid at second notice and 42% at third notice.
4.7.9.2 Telephone Contact
Information was also sought on the time taken between billing
and first and second telephone contact with the customer. As
can be seen opposite, it takes an average of 58 days for the
water sector to make telephone contact with the customer after
the first bill.
Time from bill to 2nd notice
0
10
20
30
40
50
60
70
1 2 3 4 5 6 7 8 9 10 11 12 13 14 15 16 MinMax
Mean
Respondent ID
No.d
ays
Time from bill to 3rd notice
0
10
20
30
40
50
60
70
1 2 3 4 5 6 7 8 9 10 11 12 13 14 15 16 MinMax
Mean
Respondent ID
No.d
ays
Bill to 1st telephone contact
0
20
40
60
80
10
0
1 2 3 4 5 6 7 8 9 1
0 11 12 13 14 15 1
6MinMa
xMea
nRespondent ID
Chart 4.7.9.9
Chart 4.7.9.10
Chart 4.7.9.11

Credit and Debt Management – 2008 Survey
134 Research and analysis by the Credit Management Research Centre, University of Leeds Business School
Large companies take considerably less time to contact the
customer by telephone after the first bill (46 days)
compared with larger smaller companies (53 days).
Telephone contact with the customer is made on average
70 days after the bill is first issued.
The companies were asked the time taken from the bill to
referral to an external agency. As can be seen below it
takes on average 131 days before referral. Larger
companies and smaller companies roughly take the same
time in this case.
The water utilities were also asked the time taken before a
County Court claim is made. Where applicable firms
indicated that on average it takes 82 days before a court
claim is made.
As can be seen there is a diversity in terms of the number
of court claims made by respondents.
Bill to 2nd telephone contact
0
20
40
60
80
100
1 2 3 4 5 6 7 8 9 10 11 12 13 14 15 16 MinMax
Mean
Respondent ID
No.
day
s
Bill to country court claims
0
50
100
150
200
250
1 2 3 4 5 6 7 8 9 10 11 12 13 14 15 16 MinMax
Mean
Respondent ID
No.
of d
ays
How many County Court claims did you raise in 2002/03?
0100002000030000400005000060000700008000090000
100000110000
1 2 3 4 5 6 7 8 9 10 11 12 13 14 15 16 Min
Max
Mea
n
Respondent ID
Num
ber
Bill to referral to external agency?
0
50
100
150
200
250
1 2 3 4 5 6 7 8 9 10 11 12 13 14 15 16 MinMax
Mean
Respondent ID
No.
of d
ays
Chart 4.7.9.12
Chart 4.7.9.13
Chart 4.7.9.14
Chart 4.7.9.15

Credit and Debt Management – 2008 Survey
135 Research and analysis by the Credit Management Research Centre, University of Leeds Business School
When county court claims are analysed according to customer
base there is clearly an increase in claims according to the
customer base size (see below). There may well be scale
effects that determine the cost effectiveness of court action.
4.7.9.2 Enforcement
9 companies indicated that they enforce a warrant of
execution and the chart below shows the number of
warrants carried out be each respondent in 2002/2003.
10 of the companies responding indicated that they enforce
an attachment of earnings on the customer.
0
0.5
1
1.5
2
2.5
3
3.5
0 500,000 1,000,000 1,500,000 2,000,000 2,500,000 3,000,000 3,500,000
Number of warrants 2002/03
0
2000
4000
6000
8000
10000
12000
14000
1 2 3 4 5 6 7 8 9 10 11 12 13 14 15 16 MinMax
Mean
Respondent ID
Num
ber
Number of attachment of earnings 2002/03
0
4000
8000
12000
16000
20000
1 2 3 4 5 6 7 8 9 10 11 12 13 14 15 16 MinMax
Mean
Respondent ID
Num
ber
% of success of attachment of earnings
0
20
40
60
80
100
1 2 3 4 5 6 7 8 16 9 10 11 12 13 14 15 MinMax
Mean
Respondent ID
%
Chart 4.7.9.16
Chart 4.7.9.17
Chart 4.7.9.18
Chart 4.7.9.19

Credit and Debt Management – 2008 Survey
136 Research and analysis by the Credit Management Research Centre, University of Leeds Business School
4.7.9.3 Scoring and Customer Profiling
7 of the respondents to the survey indicate that they use
scoring/profiling/customer segmentation as part of their
debt recovery process. 9 of the companies provided
information on the percentage of customers that they hold
telephone numbers for. On average the sector holds
telephone numbers for 56% of their customer base.
4.8.5 Identifying Good Practices in the Water Sector
In the previous sections of this report we have documented
and analysed the collections and recover practices of
leading edge organisations in the financial services in order
to establish current ‘best practice’. We have shown that the
collections and recovery operations of large volume
lenders in the consumer credit industry are characterised by
sophisticated customer-base information systems,
outbound call centres and automated decision-making
driven by behavioural scoring and constantly varying
collection/recovery strategies.
These sophisticated collections operations rely on detailed
customer level information to build automated collection
systems driven by ‘behavioural scoring’ models. Collection
activities are prioritised and varied according to customer
risk and balances outstanding. Management information
systems facilitate the varying of collection strategies and
debt paths for each customer and the costs-benefits are
analysed for continual improvement. Collection activities
are proactive and intense in early stage arrears (30 days
overdue).
Contact rates with customers are high. Of course, most
companies providing a product or service can ‘choose their
customers’ i.e. reject high risk customers, price the risk,
and insist on advance payment and or security/collateral.
The utilities in Gas and Electricity have options to manage
risk by pre-payment meters and, of course, can stop supply
in cases of non-payment thus minimising further losses.
These companies supply on a contract basis and therefore
have a right to customer-level information when setting up
an account, chasing delinquent payments and tracing
absconders.
Adopting all aspects of the ‘best practice’ model is not
feasible for water sector companies due to regulatory and
legal constraints and the technological investments that
require large scale activities. We have highlighted the areas
where the water companies are at a disadvantage when
competing for household repayments generally and in
relation to the other utilities.
% of customers with known telephone numbers
0
20
40
60
80
100
1 2 3 4 5 6 7 8 9 10 11 12 13 14 15 16 MinMax
Mean
Respondent ID
%
Chart 4.7.9.20

Credit and Debt Management – 2008 Survey
137 Research and analysis by the Credit Management Research Centre, University of Leeds Business School
In this section we focus on extant ‘good practice’ in
collections and recovery in the utilities sector and
specifically the water sector. The purpose is to distil and
draw up a check-list of good practice relevant to the water
sector both as a benchmark from which to evaluate current
practice and guide future development. We can draw on
information from a number of sources. We conducted
detailed structured interview with the billing and
collections departments of a cross section of UK water
companies in order to identify trends and developments in
collections and document the key elements of perceived
good practice.
4.8.5.1 Case Study Analysis
During a series of detailed interviews were undertaken
with a cross-section of water supply companies. The
interview schedule was based on a combination of the large
volume lenders questionnaire and the debt focus
questionnaire. The sample consisted of a selection of the
largest and smallest water companies and reflected both
rural/urban and north/south. Eight companies were
interviewed in detail. The case study selection reported
below brings out some of the salient features of ‘good
practice’ in water company collection and recovery
operations and highlights efforts made by the water sector
to emulate ‘best practice’ given current regulatory
constraints. The full selection of detailed interviews are
summarised in the check-list of good practice at the end of
this section. Commercial confidentiality precludes the
reporting of detailed individual cases.
Case 1 – large volume, out-sourced collection operation
This water company operates in a geographical region that
has a population of over 7 million. The customer base has
2.8 million domestic customers and over 250,000
commercial customers. The domestic customer base is
predominantly un-metered (85%), almost 17000
households are unknown i.e. billed as ‘the occupier’. The
company operate a ‘hardship’ fund for income-deprived
customers where payments are matched £ for £ by the
company in order to reduce and manage arrears.
The billing and collection aspects of the business is out-
sourced and has around 190 employees. Internal to the
water company is a small ‘revenue strategy’ team of 15
people who decide the overall customer strategy and
policy; deal with regulatory issues and provide
management information and reports. The out-sourced
operation deals with billing, debt recovery and has an in-
bound call centre with a further 3-400 staff. The call centre
deals with routine payment arrangements and customer
service. Staff can take payments over the phone and
actively encourage the setting up of direct debit by offering
a discount.
Bills are issued in February and March for payment on the
1st
April. From the 15th
-28th
April reminders are issued
and the call centre can react to calls about reminders. The
customer-base is segmented into ‘poor payers’ and ‘better
payers’ based on previous years experience, bad payers
being reminded first. After 21-28 days a legal notice is
issued through an in-house solicitor. An in-house collection
agency can be used for collections at this stage (going
under a different name).

Credit and Debt Management – 2008 Survey
138 Research and analysis by the Credit Management Research Centre, University of Leeds Business School
Few summonses are issued and county court action
according to the customer characteristics. The company
attempt to segment by council/non-council, rented/owner,
acorn classification, previous CCJ history, voters roll
matching and information about the customer’s income and
assets. Enforcement is usually by warrant and a small
number of charging orders. The internal DCA has 13 staff.
The DCA receive debts after the legal notice i.e. at 45-60
days delinquency. Summonsing is usually carried out by an
external DCA. External DCA’s are benchmarked against
the internal DCA.
Scoring is used but is quite crude and ranks customers
based on the previous years’ experience. A behaviour score
of 0 to 100 is allocated to customers and can be used to
tailor collection sequences and operate a champion-
challenger environment. Serious debtors are managed
through ‘Debt Manager’ software which has strategy and
champion-challenger functionality.
The company periodically try and update customer
information and phone number accuracy. If there is a
change of tenancy the company try and obtain information
basic customer level information. The company have an
out-bound calling strategy pre and post reminder and are
planning to build behavioural scoring into the system to
drive strategy. The company indicated that they ‘lack tools
for collection’ i.e. customer level data. Improvements in
data and data capture would facilitate a more flexible rather
than predictable collection sequence.
Payment methods are as flexible as possible and tailored to
customer income with an active policy of rehabilitating
delinquent customers back into good payment habits.
Case 2 – smaller company, outsourced collection
operation
This company has close to 500,000 un-metered domestic
customers and 250,000 on meters. Meters can be fitted free
of charge but only 5% of the customer base per year switch
to meters and these tend to be low volume customers.
The billing cycle for unmeasured domestic customers is
documented in the tables below for half-yearly payers and
instalment customers. In all there are 140 different
payment plans. Approximately, 30% of the customer-base
pay by 10 instalments, by direct debit. Although, currently,
no incentives are offered for direct debit. Metered
customers have a reading twice annually and usually pay
on a budget plan with a fixed sum per month taken on
direct debit.

Credit and Debt Management – 2008 Survey
139 Research and analysis by the Credit Management Research Centre, University of Leeds Business School
Unmeasured Billing and Recovery Cycle
Half-yearly Customers Min No of days Cumulative No days
since previous since initial bill action Bill 0 0 Reminder 21 21 Pre-court claim notice 14 35 Pre-litigation letter1 14 49 Pre-litigation letter2 6 55 Court Claim 8 63 Judgment 22 85 Post-Judgment letter1 1 86 Post-Judgment letter2 28 114 Enforcement letter1 14 128 Enforcement Action 14 142
Instalment Customers Min No of days Cumulative No days
since previous since initial bill action Booklet 0 0 Reminder (1 month arrears) 21 21 Pre-court claim and instalment Cancellation notice 14 35 Pre-litigation letter1 6 41* Pre-litigation letter2 6 47 Court Claim 8 55 Judgment 22 85 Post-Judgment letter1 1 86 Post-Judgment letter2 28 114 Enforcement letter1 14 128 Enforcement Action 14 142

Credit and Debt Management – 2008 Survey
140 Research and analysis by the Credit Management Research Centre, University of Leeds Business School
Approximately 74% of the customer-base pay or agree a
plan on receiving the first bill. After the second reminder
20% of the customers either pay or contact customer
service. 4-5% of the customers receive the pre-litigation
letter and 7000 cases per year are pursued through the
courts. Normally 9-10,000 summonses are issued of which
about 50% progress to judgment. The company have
limited information about the customer to be able to assess
whether court action might be worthwhile. Enforcing
judgments is a major problem and there are significant
debts that are over 48 months old i.e. ‘hardened debtors’. A
range of enforcement actions are tried from warrants to
charging orders to attachment of earnings. However, debt
from ‘hardened debtors’ is building and 52% of
outstanding debt is owed by only 15% of the customer-
base. The credit management function has 42 full-time
staff and 2 field staff. The credit management function is
split into 3 teams (Credit Management, Litigation and
Enforcement, Income protection). The Credit Management
team deal with front-end collections, letter and phone
contact and follow the process through to court action and
judgement.
The Litigation and Enforcement team (10 people) apply
available enforcement procedures for debt recovery. The
third team (income protection) deal with special cases and
accounts that have fallen through other processes.
They are involved with tracing and liase with debt
collection agents. The company use a panel of 3 DCA’s and
recover debt form previous occupiers with debt. They
manage some post litigation instalment (repayment) plans.
The advantage of DCA’s is that they have the technology –
power diallers, monitoring systems and collection
software. The company has not the scale of operation to
justify investment in out-bound calling facilities and
because of a lack of customer-level data.
Case 3 – large company, in-house operation
This is a large scale operation covering over 3 million
customers. Almost 3.5 million domestic customers are
directly billed and around 700,000 have meters. The scale
of the operation in terms of collections and recovery
actions is summarised in the chart below (See chart below).
The company processes large volumes of court claims and
enforcements. Around 3% of the customer-base is dealt
with by 6 local authorities who collect water charges with
property rent. Almost 40,000 accounts have unknown
occupancy and the company has to attempt to find out
occupier details for the billing and collection process as
well as tracing absconders.
CUSTOMER RELATIONS
600CommercialSuppliesCut Off for Non Payment
3,500 Charging Orders Issued
3.8m Calls Answered
xx m BillsRevenue £ xx m
Bad Debt xx %
22,000 Attachment Of Earnings
1m LegalNotices
2.5m ReminderNotices
50,000Debt Related Visits
140,000Outbound Calls made 260,000
Telemessages
InstalmentCancellations180,000
95,000Court Claims
Large Volume Collections Operation
Chart 4.8.5.1 – A Large Volumes Collections Operation

Credit and Debt Management – 2008 Survey
141 Research and analysis by the Credit Management Research Centre, University of Leeds Business School
The company has a process-driven credit management
operation with specialist teams in different locations across
the supply region. Like most companies the billing and
collection cycle is adjusted to cater for metered and non-
metered, domestic and commercial customers. The
company has a large volume collection operation akin to
other large scale lenders. The salient features are illusrrated
below.
Chart 4.8.5.2 – A Credit Management Model (1)
LitigationClaims
LitigationEnforcement
DEBT
DEBT
Collection(Comm)
Collection(Dom)
Predictive Dialler
Payment Processing
External Agencies
CCA Visits (Field)
Collection
Litigation enforcement
Support Services
PAYMENT
SECURED
FRONT OFFICEBILLING &
OPERATIONALCONTACTS
DEBT ENQUIRIES CONTACTS
BACK OFFICESALES & BILLING
BACK OFFICECREDIT
MANAGEMENT STR
ATE
GIC
CH
AN
GE
SER
VIC
ES
CUSTOMER METERING CREDIT MANAGEMENT
FIE
LD
ST
AFF
SALES
COMPLAINTS REVIEW TEAM
PERFORMANCE PLANNING
Chart 4.8.5.2 – A Credit Management Model (2)

Credit and Debt Management – 2008 Survey
142 Research and analysis by the Credit Management Research Centre, University of Leeds Business School
Behavioural Scoring
The company has developed a behavioural scoring system
to flag risky accounts and tailor appropriate action. The
behavioural score, developed in-house, ranks customers on
a 0-99 index according to payment history. The score can
be used to vary the debt path and the timing of actions
according to risk so that risky customers are progressed
more quickly. The score can be used to segment the
customer-base for action on the power-dialler out-bound
calling and could facilitate champion-challenger collection
actions backed up by a sophisticates MIS and data-base
management technology and activity-based costing.
Litigation
The Company processes large volumes of accounts for
court action and litigation, approximately 80,000 per
annum. The company is moving towards a more
sophisticated screening process before legal action is taken.
It is important to ascertain the profile of the debtor prior to
legal action to ensure that the action will be cost effective.
The profiling includes a behavioural score, the existence of
previous CCJ’s, Acorn profile, deprivation index, home
ownership and rateable value and employment status. A
team of 40 staff are involved with dealing with the court
system. The company use all options to enforce successful
judgements with charges on income or assets being the
most preferred. Debt management software is used to
process post-judgement accounts.
Case 4 – medium to large company, in-house operation
This company has a customer base of approximately 1.2
million accounts and covers both domestic and commercial
accounts. Like the previous case the company has
developed, in-house, a risk scoring system that drives and
prioritises collections actions.
Recovery Paths and Steps
UD1Overdue Account
App 101Day 14
UD2Notice of Legal
ActionApp 103Day 35
UD3Solicitor'ss Letter
App 114Day 56
UD4Agency or
SueDay 77
UnmeasuredDomestic
UC1Payment Demand
App 110Day 14
UC27 Day Letter
App 092Day 35
UC6Agency or
SueDay 100
UnmeasuredCommercial
UC3Audit Report to
assess ifdisconnection
possibleDay 56
UI4/MI4Withdrawal of
Instalment PlanApp 107Day 91
UI5/MI5Solicitor'ss Letter
App 114Day 112
UI6/MI6Agency or
SueDay 133
UnmeasuredInstalments/Multi
Instalments
UI2/MI2Overdue Inst Plan
App 112Day 49
UI3/MI3Instalment Arrears
App 113Day 70
MD1Overdue Account
App 101Day 21
MD2Final demand
App 102Day 42
MeteredDomestic
MD3Solicitor'ss Letter
App 114Day 63
MD4Agency or
SueDay 84
MC1Payment Demand
App 110Day 21
MC27 Day Letter
App 092Day 42
MC6Agency or
sueDay 96
MeteredCommercial
MC3Audit Report to
assess ifdisconnection
possibleDay 52
Metered MultiInstalments/Budget Plan
Closed Accounts
CA1Overdue Account
App 101Day 14
CA2Solicitors Letter
App 104Day 35
CA4Send toTrace &CollectAgencyDay 77
OccupierUnknown
OU1Occupier
Unknown A/FApp 159
OU2Inst. to Disc
App 162
OU3Visit DCAApp 160
CA3Solicitor'ss Letter
App 114Day 56
UI1/MI1Nothing Sent
App 099Day 28
MI/BP4Withdrawal of
Instalment PlanApp 107Day 111
MI/BP5Account reviewed- If no payment,
re-pathed to MD3/MC5
MI/BP2Overdue Inst Plan
App 112Day 51
MI/BP3Instalment Arrears
App 113Day81
MI/BP1Nothing Sent
App 099Day 21
OU4Martin E Visit
App 260
UC4Property Visit
ReportApp 093A
Day 58
UC5Solicitor'ss Letter
App 114Day 79
MC4Property Visit
ReportApp 093A
Day 54
MC5Solicitor'ss Letter
App 114Day 75
Chart 4.8.5.3 – Recovery Paths and Steps

Credit and Debt Management – 2008 Survey
143 Research and analysis by the Credit Management Research Centre, University of Leeds Business School
Typical debt paths are reported in Chart Case 4.1. Collections
actions can be varied according to risk so that a different
collection strategy can be adopted in a champion-challenger
type environment. The Company has an in-bound and out-
bound call centre operation and makes out-bound calls usually
in the evening. The collectors chase up payment, are able to
take payment over the phone (Switch), encourage direct debit
take up and/or arrangements to pay. An important aspect of
the work is to ensure that customer contact details are up to
date and as complete as is possible.
The company deal with 6 DCA’s, 2 of which specialise in
trace and collect. The DCA performance is monitored and
benchmarked to ensure continual improvement and to identify
areas where the DCA’s can perform better than in-house
collection/recovery efforts.

Credit and Debt Management – 2008 Survey
144 Research and analysis by the Credit Management Research Centre, University of Leeds Business School
Good Practice Matrix CHECK LIST CODE: Not Present/implemented = X Partial/Planned = 1
Significant/Partially Implemented = 2 Complete/Fully Implemented = 3 WATER COMPANIES
Existing OFWAT
guideline? Regulatory constraints Scale effects 1 2 3 4
5
6 7
8
Customer Type and Knowledge
Name of Payee -
Having no contract with the customer limits the amount and type of customer level data
2 2 2 2 2 2 2 2
Date of Birth - 1 1 1 1 1 1 1 1 Marital Status - 1 1 1 1 1 1 1 1 Accurate Address - 2 2 2 2 2 2 2 2 Accurate Phone Number(s) - 2 2 2 2 2 2 2 2 Previous address - 1 1 1 1 1 1 1 1
Household Occupants - Partial Information In all cases 1 1 1 1 1 1 1 1
Property Type - 2 1 2 1 1 2 2 1 Property Tenure - 1 1 2 1 1 1 1 1 Employment Status - 1 1 1 1 1 1 1 1 Homeowner Status - 2 1 2 1 1 2 2 1 Data-base management Acorn/Mosaic/Geo-demographics YES As above 2 1 2 1 1 2 2 1 Deprivation/Geo-demographics YES 2 2 2 2 2 2 2 2
Customer Risk Profile - No credit reference information
Scoring limited by data/information 2 1 2 1 1 2 2 1
Changes of contact details -
Having no contract means that customers do not feel obliged to inform of vacation of property
2 2 2 2 2 2 2 2
Data update and enhancement strategy -
Scale effects- requires outbound as well as inbound call centre activity
2 1 2 1 1 2 2 1

Credit and Debt Management – 2008 Survey
145 Research and analysis by the Credit Management Research Centre, University of Leeds Business School
Absconder management
Track house moves -
Use DCA’s and tracing agencies – internal and external
2 2 2 2 2 2 2 2
Track gone-away/vacant - 2 2 2 2 2 2 2 2
Identify ‘unknown’, empty property - Labour and time- intensive process Scale effects 2 1 2 1 1 2 2 2
In-house/external tracing capability - 2 1 2 1 1 2 2 2 Returned bill coding - 2 2 2 2 2 2 2 2 Returned bill strategy - 2 2 2 2 2 2 2 2 Verify persistent non-payers in occupation - segmentation 2 1 2 1 1 2 2 2 Billing Cycle Tariffs and Segmentation Ensure tariffs are correct - 3 3 3 3 3 3 3 3 - metered/un-metered - 3 3 3 3 3 3 3 3 - household/commercial - 3 3 3 3 3 3 3 3 - identify ‘vulnerable’ customers - 2 2 2 2 2 2 2 2 Billing Billing clear and understandable YES 3 3 3 3 3 3 3 3 - cater for disadvantaged (e.g. Braille, large print) YES
Large investments in billing systems 3 3 3 3 3 3 3 3
- clarity of debt progression procedures for customer and employees YES 3 3 3 3 3 3 3 3 Timely billing 3 3 3 2 2 3 3 3 - meter reading to billing efficiency YES Large % unmeasured 3 2 3 2 2 3 3 3 Queries and Disputes Accurate and regular meter readings - Large % unmeasured 2 2 2 2 2 2 2 2 Review tariffs applied - 2 2 2 2 2 2 2 2 Minimise ‘estimated‘ readings - Targets for % reads 2 2 2 2 2 2 2 2 Query and dispute resolution 3 2 3 2 2 2 3 3
- phone in helpline -
Scale effects of document Imaging and processing systems
3 3 3 3 3 3 3 3
- letter answer efficiency - 3 3 3 3 3 3 3 3 - call-in (face to face) facility - 3 3 3 3 3 3 3 3

Credit and Debt Management – 2008 Survey
146 Research and analysis by the Credit Management Research Centre, University of Leeds Business School
Collections and Recovery Collection Chase action - Speed of response YES 3 3 3 3 3 3 3 3 - Reminder Strategy YES 3 3 3 3 3 3 3 3 - Letter Sequence, Clear ‘Instructions’, Clear
‘debt progression’ YES 3 3 3 3 3 3 3 3 - Phone/Letter alternatives - 3 2 2 X X 2 3 X - Powerdialler/Caller linked to account data-
base - 2 2 2 X X 2 3 X - Diary/case management system - 2 2 2 2 2 2 2 2 - Alternative contact methods
(Phone/SMS/Personal Visits) - 2 2 2 2 2 2 2 2 Segmented Delinquents 2 2 2 1 1 2 2 1 - Behavioural/Collection Scores - 2 1 2 1 1 2 2 1 - Prioritisation of actions and sequences - Limited by regulation 2 1 2 1 1 2 2 1 - Effective ‘timing’ of actions YES 1 1 1 1 1 1 1 1 - Effective sequence and wording of written
notices YES 1 1 1 1 1 1 1 1 Escalation Strategy - Limited by regulation 2 2 2 2 2 2 2 2 - Behaviour score – debt progression sequence - 2 1 2 1 1 2 2 1 Litigation
Pre-court action predictive modelling - Limited by information available Partial 2 2 2 1 1 2 2 1
- verification of debt - 2 2 2 2 2 2 2 2 - verification of customer income - 2 2 2 2 2 2 2 2 - verification of customer ‘assets’ - 2 2 2 2 2 2 2 2 Policy on recovering court costs - 2 2 2 2 2 2 2 2 Prompt action - 2 2 2 2 2 2 2 2

Credit and Debt Management – 2008 Survey
147 Research and analysis by the Credit Management Research Centre, University of Leeds Business School
Approach to court options - - charges on income - 2 2 2 2 2 2 2 2 - charges on property - 2 2 2 2 2 2 2 2 - Garnishee - 2 2 2 2 2 2 2 2 - Warrants - 2 2 2 2 2 2 2 2 - Oral examination - 2 2 2 2 2 2 2 2 - External Debt Collection Ensure Code of Practice (CSA membership) YES 3 3 3 3 3 3 3 3 Benchmark DCA panel - 2 1 1 1 1 2 2 2 Access to performance information YES 1 1 1 1 1 1 1 1 Access to debt ‘outcome’ information - 2 2 2 2 2 2 2 2 Contractual arrangements - 3 3 3 3 3 3 3 3 Terminated/open debt policy - X X X X X X X X Strategy on placement (1st, 2nd, litigation etc) - 2 2 2 2 2 2 2 2 LOCAL AUTHORITY 1 People and Training, Technology and Software People Mission statement - 1 1 1 1 1 1 1 1 Training (classroom,on-the-job) - 2 2 2 1 1 2 2 1 Empowerment and discretion - 1 1 1 1 1 1 1 1 Qualifications - 1 1 1 1 1 1 1 1 Specialisation where appropriate - 2 2 2 2 1 1 2 1 Targets and incentives where appropriate - X X X X X X X X
Technology/Software Automation and integration where possible - 1 1 1 1 1 1 2 1 Manual intervention - 2 2 2 2 2 2 2 2 Optimise flow processes - 2 2 2 2 2 2 2 2 Document processes/procedures - 2 2 2 2 2 2 2 2 Data-base management and ‘scoring’ - 2 1 2 1 1 2 2 1 Champion-challenger facility - 2 2 2 1 1 1 2 1 Management Information System YES 2 2 2 2 2 2 2 2

Credit and Debt Management – 2008 Survey
148 Research and analysis by the Credit Management Research Centre, University of Leeds Business School
4.9 Use of Debt Collection Agents
A number of trends and industry dynamics have impacted
on the out-placed debt collection and debt purchase sector.
These include: the surge in consumer debt and increase in
the volumes of delinquent debt that have to be processed;
the increased emphasis on cost effectiveness and
performance benchmarking; the continued re-engineering
of centralised in-house collection and recovery functions
and the development of technology and information
systems devoted to account management; the speed of
response of the major lenders in dealing with delinquent
accounts and a shortening of the time period to write-off.
The latter trend has been given much impetus by the Basel
II rules that have encouraged the lenders to shift debts off
of their books more quickly and to opt for debt sale rather
than commission-based collection since the former
mechanism transfers ownership of the debt.
The Credit Services Association reported that their member
organisations handle around £15 billion of debt on a
commission basis which consisted of over 20 million
individual cases. This represents a rise of £10 billion since
2000. The CSA membership bought around £6 billion of
debt in 2007 making of total of over £21 billion being
passed to the DCA sector. The CSA estimate that their
market will be worth over £24 billion in 2008.
There has been an increasing preference amongst lenders,
(particularly credit cards) to sell debt to debt buyers rather
than place for commission-based collection.
Consolidations in industries that service the debt collection
sector e.g. utilities, telecommunications, and retail
industries have impacted on the market for DCA services.
Industry consolidations imply that organisations have
bigger portfolios and can negotiate lower prices for higher
volumes of business and/or invest in new internal
collection and recovery operations. Price competitiveness
has in turn led to consolidations in the debt collection
industry in order for them to gain efficiencies of scale and
develop close and integrated relationships with key clients.
The sale and purchase of debt portfolios has opened up
avenues for the DCA’s but in turn requires more
sophistication in the pricing and collection processes. A
source of potential revenue growth for the DC industry is
as a provider of a wider range of out-sourced business
services across the credit life-cycle. Outsourcing
receivables management has increased, particularly for
commercial debt. Government and the public sector are
beginning to utilise the services of DCA’s. The growth in
the internet B2C and B2B has translated into more
collection activity on a global scale.
There has been and continues to be a general trend
amongst the large volume collectors to streamline and
rationalise their use of 'external' collection agents alongside
their 'in-house' collection agents. Our original 1998 survey
found that the large lenders would pass out debts, on
commission, to a large range of external collection agents
and on quite an ad hoc basis. At this time the lender viewed
the relationship with the customer as terminated and had no
further interest in the customer Little effort was put into
monitoring the success rate of the different agents. Our
later surveys identified that that large volume lenders were
beginning to prefer to have a closer and more sophisticated
interface with a smaller number, say 4-5, main collection
agents. Often the performance of each agent would be
monitored according to the type and age of debt that they
were working and benchmarked against each other and
against the performance of the in-house collection agent.
Some were operating champion-challenger style
monitoring of the agent's performance. The lenders were
keen to track the customer after they had been passed out

Credit and Debt Management – 2008 Survey
149 Research and analysis by the Credit Management Research Centre, University of Leeds Business School
to agents in order to monitor outcomes. This, to some
extent, requires that the collection agent's information
system can integrate with that of the client. Thus the
lenders were attempting to develop seamless information
systems that could track the customer from account
management/customer service through to collections, out
to the collection agents and back into the lender where
possible. The implication for the debt collection sector was
that scale was becoming more important as was the
investment in I-T systems that would rival and or add value
to those of their clients. As a consequence we were seeing
fewer but larger and more sophisticated collection agents
with closer working relationships/interfaces with their
clients.
As in-house collection functions were improving their own
speed of response and internal collection efforts it meant
that the DCA’s were receiving debts that were both
younger and that had been ‘worked’ harder. These trends
have continued into 2007 with the lenders looking for
further efficiencies and additional expertise and
specialisation from the DCA’s.
A potential problem for debt collection agents is that these
'in-house' operations, buoyed by their successes, are
(considering) taking debts from clients other than their
internal clients i.e. become competitors to the external
agents. The response of the larger DCA’s has been to
invest in technology, communications and expertise to
develop a range of specialist services for segmented debt
portfolios. The growth in outsourced recovery services has
created new opportunities.
The lenders used to place debt for collection with DCA’s
after a specific period of time and in-house collection
cycle. The more recent trend is to experiment with placing
at different stages of the collection cycle and employ the
services of DCA’s at various stages of the billing and
delinquency cycle as charted below.
The NewApproach
CustomerAcquisition
Billing & Sales Ledger
ArrearsManagement
DebtCollection
Litigation &3rd PartyCollections
OutsourceIn‐house
Multiple Outsource Points
Period of Delinquency
Chart 4.9.1 – Collections: An Integrated Approach

Credit and Debt Management – 2008 Survey
150 Research and analysis by the Credit Management Research Centre, University of Leeds Business School
Analysis the accounts of 177 known DCA’s we can track a
substantial increase in the average turnover and net worth
of these organisations.
Chart 4.9.2 – Turnover Trends in UK Debt Collection market
Chart 4.9.3 – Net Worth Trends in UK Debt Collection market

Credit and Debt Management – 2008 Survey
151 Research and analysis by the Credit Management Research Centre, University of Leeds Business School
4.9.1 DCA: Case Study
The diagram below represents the debt processing path of a
large DCA beginning with the matching of debtors to
information sources in order to profile and score the debtor
into a particular debt segment. The DCA uses multiple
collection strategies with an emphasis of early contact with
the debtor.
Contact is a sophisticated process that involves power-
dialling and other telephony timed to achieve the best and
most cost-effective results.
An arrangement to pay can then be negotiated with the
debtor with multiple payment options. Champion
challenger strategies are used to maximise the effectiveness
of collection actions.
The lenders typically will monitor the performance of the
DCA closely and benchmark their performance versus in-
house and other external DCAs. Information systems are
linked to the lender and the DCA service is optimised as
charted below.
Data Enhancement
Portfolio Segmentation
Multiple Collections Strategies
Maximised Contact
Payment Conversion
Optim
ised Co
llections
Multiple data source matching
Full names, correct addresses, home, work and mobile telephone no.s
Segmentation using account characteristics
Type of debt, balance, previous payment history, location, presence of telephone no. etc
Different debt treatment paths for different segments
Varied contact identities, letters, intervals, postal tariffs, payment methods
Application of contact methods and tools at the best times
Use of predictive diallers, SMS and e‐mail, “right time to call” analysis
Optimised collections contributions when contact is made
Most effective payment methods, optimised negotiation tactics, effective default procedures
Compliance
Staff Incentives, training and development
Chart 4.9.1.1 – Example of DCA Collections Process

Credit and Debt Management – 2008 Survey
152 Research and analysis by the Credit Management Research Centre, University of Leeds Business School
4.10 Debt Sale and Purchase: Trends and Developments
The debt sale/purchasing market has attracted much
interest in the recent years and is perhaps the fastest
growing segment of the debt collection and management
industry based on the potential value of debt available for
purchase. In the US the debt sale and purchase market is
well established By 2000 It was estimated that the face
value of debt purchased was over $60 billion in the US
which had a collection value of around $3.6 billion. The
market has continued to grow in the US and was over $150
bn in 2006.
In the UK it is difficult to estimate the total size of the debt
sale market since the market continues to evolve quite
rapidly. The market size in 2005/6 was around £6bn face
value selling at an average price of around 8p in the pound.
By 2006/7 this had increased to £7bn and commentators
are expecting the market to peak at around £10bn. Debt
sale is still dominated by ‘distressed debt’ portfolios i.e.
debt that the financial sector would normally write-off
and/or is severely delinquent is sold to the highest bidder
for collection/recovery. In the early stages of the debt sale
market the pricing of ‘distressed debt’ was of little issue
for the seller since any price attracted was a bonus for debt
already written-off. Such debt traded for 1 or 2 pence in the
£. In 2006/7 it is estimated that the average price has
increased to an range between 2-5 pence in the pound as a
result of increased competition in the debt buyer market
and more sophistication in debt pricing. The value of debt
Weekly Service ReviewAll aspects of Client AdministrationAttendees: Account Manager, Client Services Manager
Quarterly Strategic ReviewHigh level review of major projects and future initiatives and improvements UK Board
Inputs Actions
Weekly Collections ReviewDetailed consideration of all collections metricsAttendees: Account Manager, Sector Collections Manager
Monthly Commercial ReviewOverall review of all aspects of service and performanceSales Director, Operations Director
Client Feedback
League Tables
Internal Data / KPI’s
Staff Feedback
Complaints
Legislation and Regulators
Outcomes
Tactical Short Term Actions
Benchmarking and testing of new strategies
Communication of issues to the client
Re‐mapping of business processes
Project based improvement initiatives
Compliance reviews
Client Specific Intranet Site for all key data and information
Chart 4.9.1.2 – DCA Service Optimisation

Credit and Debt Management – 2008 Survey
153 Research and analysis by the Credit Management Research Centre, University of Leeds Business School
decreases with age and the numbers of collection cycles
and placing that it has been through. However it is clear
that lenders have developed an interest in selling younger
debt as a means of improving cash-flow and because of the
costs of servicing the debt collection sector when debt is
placed on a commission basis. If the costs of administering
debt collection services (servicing costs) are taken into
account along with commission rates then it may be more
costs effective in some cases to sell debts outright. “As
financial institutions get more comfortable selling debt, we
believe they will sell a greater amount of performance debt
that they want to get rid of for strategic reasons” R H
Reitzel (quoted in the Kaulkin Report 2001, p 38).
Most of the Debt Collection Agents have turned to buying
debt as an alternative to collection on commission in 2004
there were over 60 debt buyers although the DBSG
suggests that currently there are around 40 regular buyers
in the market. The growth in the market has been
facilitated by the supply-side. The major lenders and the
majority of financial services are now selling debt and
developing specialist departments to deal with debt sale
and respond faster to debt sale opportunities. The bulk of
sales are distressed debt attracting the 2-5% price but there
is evidence of sellers selling debt earlier, as in the US,
typically 180 days past due. The changes in accounting
rule, Basel II and capital requirements have had an impact
as a result of changes in internal default definitions. A
further development is the sale of debt that has already
been managed to achieve an ‘arrangement to pay’ via a
debt management company. This type of debt can attract
30-40 pence in the pound. The development of a reseller
market is expected to create further growth in the market.
The main sources of debt sale are credit cards, loan and
overdrafts, retail credit, motor finance and increasingly
mortgage arrears. The utility and mobile phone companies
have sold debt. This debt is typically old and of low value.
Difficulties in collecting this type of debt have depressed
prices. The credit card environment appears to be the most
attractive sector. Here average value is in the region of £
2000-4000. The debtor is likely to be employed with an
incentive to ‘recover’ their position and return to being
credit active. Interviews with a major debt buyer suggests
that the average balance on credit card debt has increased
from £4000 to £8000 in the last 2 years. There has, of
course, been some sale of IVA’s as the volume has
increased but there have been concerns over the quality of
the IVA (the debtor rarely has any assets) and the fees
taken by the IVA practitioner. The market for commercial
debt in the UK is currently small given the scale of
corporate receivables but there is evidence that the market
is beginning to grow e.g from corporate credit cards,
outsourced receivables management operations and
insolvency practitioners.
A problem that is probably hampering the growth of the
debt sale market is that of ‘pricing’. Interviews with major
lenders suggested that there is some lack of ‘trust’ in the
market as a result of extant price variations. If debt is to be
sold at earlier stages and /or segmented by ‘quality’ then
there has to be a mechanism for pricing the individual
debts and the debt portfolio. Clearly in order to price debt
something has to be known about the ‘default probability’,
the collection probability (including percentage recovered),
the timing of possible recovery (i.e. collection period) and
the costs of collection/recovery. The type and source of the
debt will have a bearing on its value in a debt sale. Of
course, ultimately the value of the debt is a function of the
net present value of the future cash-flow in relation to
collection costs. The seller, of course, would wish to

Credit and Debt Management – 2008 Survey
154 Research and analysis by the Credit Management Research Centre, University of Leeds Business School
achieve the maximum price for the debt but has an
informational advantage over the potential buyer. That is
the seller is likely to have the information necessary to
accurately price debt but has an incentive not to reveal this
to the buyer. Markets tend not to function well when price
is not transparent. In the US this ‘pricing’ function has
been performed by intermediaries, ‘debt brokers’ who
specialise in portfolio analysis. Accounts can be ‘scored’
independently on the basis of likely recovery rates. Brokers
have the ability to put together more attractive ‘packages of
debt’ emanating from different lenders. There are some
specialist brokers in the UK (eg.TDX and recent US
entrants) but currently most debt is sold in a tender-bidding
environment with inefficient pricing. Once the UK market
has further developed this type of expertise in packaging
and pricing debt then the market should mature and prices
should achieve some uplift. Gauging the ‘quality’ of debt is
problematic at the time of purchase because of
informational asymmetries between buyer and seller and in
relation to the individual debtor. Not least an individual
that has debts with one lender is likely to have debts with
other lenders that could be consolidated by the debt
purchaser. Internet auction markets still do not appear to
have the confidence of the debt sellers yet such systems
have the potential for creating an efficient market in debt
sale/purchase.
Debt buyers have typically invested in sophisticated I-T
and customer scoring capabilities in order to maximise the
efficiency of the debt management and recovery process
and generate profit. This is likely to involve developing a
customer-level view. A major debt buyer indicated that
over 20% of the debts that they receive are from debtors
that are already known to them. That is, debtors tend to
have multiple debts spread across different lenders. A
challenge for the debt buyer is to identify and consolidate
these multiple debts into a single arrangement to pay.
Adding value to account data using scoring models to
understand the debtor profile and determine the NPV of
future cash flows, effective customer contact and
developing realistic and ‘collectable’ ATP’s is fundamental
to generating profitable business.
Further growth in the Debt Purchase market is likely to
come from the sale of non-delinquent receivables, reselling
and from commercial debt.
4.10.1 Case Study: Debt Buyer
Interviews with a large UK buyer focussed on the process
involved in purchasing and processing consumer debt.
Then company employs over 350 full time staff but will
grow to over 600. The company currently processes over 2
million accounts, predominantly from UK lenders but with
an increasing international portfolio with a face value of,
on average, £2000. The average face value has been
increasing with a larger proportion in the region of £4-5000
for cards and £8000 for loans. The average price paid is in
the region of 2-5 pence in the pound but price variations
have been increasing along with the average price paid
Purchase is usually by tender and bidding after due
diligence on the debt portfolio has been carried out. The
source of debt is predominantly distressed credit card debt
with some loan portfolios and retail credit. The company
has not had success with utilities and mobile phone
portfolios. After the notice of assignment has been sent to
the debtor the priority is speedy contact with the debtor by
phone/letter combinations. The aim is to quickly establish
the debtors profile and financial circumstances and
negotiate an arrangement to pay some or all of the
outstanding debt Emphasis on negotiating a realistic deal

Credit and Debt Management – 2008 Survey
155 Research and analysis by the Credit Management Research Centre, University of Leeds Business School
that allows the debtor to begin making payments. This may
involve starting the debtor at a low repayment level and
increasing the monthly payments over time. In fact, 55%
of the accounts pay by direct debit and the overall default
rate is around 9%. The debtor is offered other options to
repay including cheques, post office cards, over the phone
collections. The main reasons cited for being in debt are
over-commitment; change in personal circumstances (ill,
divorced, loss of first and/or second income) .
Contact and information is key to a successful outcome.
Contact is mad primarily via a call centre and call centre
staff are trained to establish a relationship with the debtor
and negotiate the arrangement to pay. If an initial deal
cannot be established the options are to write-off, ‘rest’ the
debt for a period (up to 12 months), use a third party or
doorstep collector or explore litigation if the debtor has
assets. Almost 40% of debtors agree to a ATP after first
contact. The company has an internal tracing team to track
debtors that have changed address. Currently the company
does not use external CRA data or the sellers internal
scores but relay on their own internal account data.
However, access to ‘white’ customer information via the
CRA’s is seen as desirable in adding collections.
New accounts are ‘scored’ through an internal scoring
system to determine the probability of repayment and the
accounts are segmented by score and other aspects of
account profile. Further information on income and assets
is gathered via the call centre where possible. Internal
behavioural scores are employed to determine the likely
time scales of repayments and the profitability of the ATP.

Credit and Debt Management – 2008 Survey
156 Research and analysis by the Credit Management Research Centre, University of Leeds Business School
5. A Survey of Debt Collection Agents and Debt Buyers
Our previous sections presented an overview of the size of the market for debt collection services and debt sale/purchase. The
research suggests a markets size in the region of £25 billion per year with an increasing share being taken by debt sale. The sector
has been characterised by rationalisation through technology investments and mergers and acquisitions. Fewer and larger agencies
have closer links with their clients through integrated information systems and benchmarking for continuous improvements in
collections and operational efficiency. Consumer and commercial debts derives from banks, finance houses, credit cards, retail
cards, utilities and telecoms and the public sector. In this section we report the results of a survey of individual debt collection
agents and debt buyers in the UK. This follows up our previous surveys in 2003 and 2001 and provides some trend information.
The DCA sector covers both consumer and commercial debt and offers collection on a commission basis or the outright purchase of
debt. In the latter case the debt buyer acquires all of the rights and duties of the original creditor. In the case of contingency debt
collection (commission-based) the ownership of the debt resides with the client and debts can be passed back to the client if
uncollected after a period of time. This creates a secondary and tertiary market for debts since these uncollected debts may be
placed with another DCA. Commission rates are a function of the age and type of debt Trade debt from B2B relationships may be
placed for commission-based collection. The DCA’s offer services such as tracing absconders, asset tracing, repossessions of
goods, litigation, and status reports and investigations.
5.1 Debt Collection Services
• 46% of all agencies offer Debt Purchase, an increase of 27% since 2003.
• Repossession has increased by 25% to nearly half of all agencies.
In terms of Debt Collection services offered by agencies in 2007 significant differences can be seen since 2003 in Repossessions
(up 25%) and Tracing (down 15%), The offering of Process Services and Investigations/Status Reports has declined between the
two time periods. The largest difference between services offered in 2003 and 2007 is in Debt Purchase which is up by 27% among
the sample. 46% of all agencies offer this service in the marketplace.

Credit and Debt Management – 2008 Survey
157 Research and analysis by the Credit Management Research Centre, University of Leeds Business School
TABLE 5.1 DEBT COLLECTION AND OTHER SERVICES OFFERED BY RESPONDENTS
CONSUMER DEBT COLLECTION
Consumer debt collection 2003 2007 % change
Trace and collect 60.4% 61.5% 1.1%
Tracing 68.8% 53.8% -15%
Court action 60.4% 53.8% -6.6%
Card recovery 29.2% 23.1% -6.1%
Repossessions 22.9% 48.5% 25.6%
Bailiff 10.4% 7.7% -2.7%
Process serving 35.4% 23.1% -12.3%
Debt surveillance 22.9% 23.1% 0.2%
Status reports and investigations 58.3% 46.2% -12.1%
Outsourced debt management 41.7% 46.2% 4.5%
Debt purchase 18.8% 46.2% 27.4%
Consultancy 45.8% 38.5% -7.3%
Training 33.3% 23.1% -10.2%

Credit and Debt Management – 2008 Survey
158 Research and analysis by the Credit Management Research Centre, University of Leeds Business School
5.2 The Market for Debt Collection Services
• 67% of agencies indicate an increasing number of clients.
• 55% indicate a growth of debts being placed in the market.
• No companies report a decline in the number of debts placed.
The respondents to the survey in the 2001, 2003 and 2007 surveys were asked whether their client base and the numbers and values
of debts were declining, stable or increasing.
As in 2001, 67% of respondents indicated that their client-base was increasing. Just over a quarter of respondents indicated that
their client base remained stable with 8% suggesting a decline in client base.
CHART 5.1 CLIENT BASE TRENDS FOR THE DEBT COLLECTION MARKET

Credit and Debt Management – 2008 Survey
159 Research and analysis by the Credit Management Research Centre, University of Leeds Business School
Respondents were asked to indicate on a 5-point scale whether the number of debts had been declining (1) increasing (5) in the last
financial year. The statistics suggest a healthy growth in the market for debt collection with 80% of respondents ticking the 4/5
categories on the scale and 55% indicating growth in the number of debts placed at the highest score of 5 in 2007. 46% of
respondents suggested that the market had remained stable and no companies indicated a decline in the number of placed debt.
CHART 5.2 NUMBER OF DEBTS PLACED IN MARKET
5.3 Market Size
• 75% of agencies indicate that market size is increasing in 2007.
• This compares to just 45% in 2003.
• 99% of agencies believe market competitiveness to be increasing.

Credit and Debt Management – 2008 Survey
160 Research and analysis by the Credit Management Research Centre, University of Leeds Business School
A number of questions on the survey were designed to obtain information on the nature of the consumer debt collection market.
These questions ascertained opinion on the size/growth of the market overall, specific sources of out-placed debt, the age and
quality of debt that is out-placed and the overall competitiveness of the market for consumer debt collection. Respondents were
asked to indicate whether they thought that the overall market for consumer debt was increasing, stable or decreasing at present. As
can be seen from the chart on the scale from (1) increasing to (5) decreasing almost 75% of respondents indicated that they believed
that the market was increasing in 2007. This compares to just 45% in 2003.
CHART 5.3 MARKET SIZE FOR CONSUMER DEBT
Although the size of the market was generally thought to be increasing the respondents felt that the market for out-placed consumer
debt remained very competitive.
5.3.1 Market Competitiveness for Consumer Debt
The vast majority of respondents indicated that the market for consumer debt collection was very competitive. 85% of firms ticked
4 or 5 on the scale to indicate a currently competitive marketplace. 99% of agencies believe the market competitiveness to be
increasing compared to just 85% in 2003.

Credit and Debt Management – 2008 Survey
161 Research and analysis by the Credit Management Research Centre, University of Leeds Business School
CHART 5.4 MARKET COMPETITIVENESS FOR CONSUMER DEBT
5.4 Value and Volumes in the Debt Collection Market
• The largest agencies report a 526% increase in average collective debt value from £228 million in 2003
to £1.2 billion in 2007.
• The average individual debt value has more than doubled since 2003.
• The number of debts worked on per month has increased from an average of 1,200 to 19,000 in 2007.
An increase of 1900%.
• Large agencies work on 40,000 debts per month in 2007 compared with just 1,000 in 2003
The number of debts worked by agencies each month across the entire sample has increased dramatically from between 1,200 in
2003 to 19,000 in 2007. Among the larger agencies this increase is most significant with agencies with over 100 employess
reporting a rise from 1000 debts per month to 40,000 debts per month.

Credit and Debt Management – 2008 Survey
162 Research and analysis by the Credit Management Research Centre, University of Leeds Business School
The chart below shows the distribution of debt collectors by the number of debts worked per month i.e. where at least one action
has been taken to collect the debt. In 2001 collectors in the consumer debt market dealt with considerably larger volumes of debt
than those servicing the commercial sector with over half working over 1000 debts per month. In 2003 this trend changed with a
lower volume of debts being worked in consumer collection than before. However in 2007 agencies are now clearly collecting a
higher number of debts per month with 56% of agencies stating that they work over 5000 debts per month.
TABLE 5.2 NUMBER OF DEBTS WORKED PER MONTH – WHOLE SAMPLE
Number of debts 2001 2003 2007
Less than 500 30% 50% 11%
501- 1000 18% 21% 20%
1001 – 5000 41% 14% 13%
Over 5000 11% 15% 56%
The table below summarises information on the average value of debt received in £s. Overall in the sample, the average value of a
debt placed across the entire sample has increased from less than £1000 in 2003 to £2400 in 2007.
TABLE 5.3 VALUE OF DEBTS WORKED PER MONTH – WHOLE SAMPLE
Value of debt 2001 2003 2007
Less than £250 35% 27% 2%
£251-£500 26% 16% 8%
£501-£1000 9% 5% 10%
£1001-£2000 22% 41% 38%
Over £2001 10% 11% 42%

Credit and Debt Management – 2008 Survey
163 Research and analysis by the Credit Management Research Centre, University of Leeds Business School
TABLE 5.4 NUMBER OF CLIENTS AND DEBTS WORKED PER MONTH – AGENCY SIZE BREAKDOWN
Size of Agency (employees) Average Number of Clients Average Number of debts
per month worked
Average Value of a Debt
placed
2003 2007 2003 2007 2003 2007
6 to 10 100 80 500 300 £1500 £150
11 to 25 13 8 2920 14000 £4000 £400
26 to 50 35 98 1010 25000 £758 £817
51 to 100 56 112 1300 11500 £1860 £5250
Greater than 100 156 30 1000 40000 £1087 £2370
The table below gives an indication of the total values and total numbers of consumer debts placed with the respondent debt
collection agents organised by size of the agent. As can be seen below the largest agents have seen a significant increase in the
value associated with the largest agencies operating in the market. In 2003 the largest agencies reported a total value of £228
million for debts placed. This figure in 2007 is now £1.2 billion.
TABLE 5.5 TOTAL VALUE AND TOTAL NUMBER OF DEBTS PLACED – AGENCY SIZE BREAKDOWN
Size of Agency
(employees)
2001 2003 2007
number Value number value number value
6 to 10 13,000 £3,125,000 26,000 £6,500,000 3,600 £520,000
11 to 25 14,000 £10,000,000 68,000 £22,757,250 168,000 £67,200,000
26 to 50 177,000 £62,045,829 212,000 £130,000,000 300,000 £245,000,000
51 to 100 200,000 £141,000,000 290,000 £200,000,000 338,000 £104,000,000
Greater than 100 779,000 £210,000,000 911,000 £228,000,000 980,000 £1,200,000,000

Credit and Debt Management – 2008 Survey
164 Research and analysis by the Credit Management Research Centre, University of Leeds Business School
A factor affecting the collection success rate will obviously be the age of the debt that is being received into the collection agency.
The survey gathered information on whether the debt collection agents were handling primary, second or third placed debts and the
proportions of the total debt received that could be categorised under these headings. Again it is clear that some agents specialise in
first placed debt whereas others take a high proportion of second and third placed debt.
TABLE 5.6 SECTORS FOR DEBT COLLECTION ACTIVITIES
Sector Average % of Total Business
2003 2007
Bank 45 47
Credit Cards 60 48
Finance Houses/ Retail 40 45
Local Authority/ Central 55 51
Utilities 82 60
Telecoms 60 30
Mail Order 40 38

Credit and Debt Management – 2008 Survey
165 Research and analysis by the Credit Management Research Centre, University of Leeds Business School
Respondents were asked to indicate which were the fastest growing or declining sectors for out-placed consumer debt. Responses
were coded on a five-point scale from Declining (1) to Growing (5).
TABLE 5.7 GROWING AND DECLINING SECTORS FOR CONSUMER DEBT
Declining Stable Growing
1 2 3 4 5
2001 2003 2007 2001 2003 2007 2001 2003 2007 2001 2003 2007 2001 2003 2007
Banking 4.2 0 20.2 4.2 14.3 9.8 42 14.3 9.1 50 57.1 50.0 0 14.3 10.9
Credit cards 4.5 0 15.3 13.6 0 0 27.3 27.8 13.1 36.4 55.6 57.1 18.2 16.7 14.5
Finance
houses
8.7 0 11.8 4.3 5 10.4 34.8 40 22.2 52.2 45 44.4 0 10 11.2
Retailers 4.5 0 11.7 18.2 6.7 1.4 40.9 60 1.5 36.5 20 29.7 0 13.3 55.7
Utilities:
Gas 0 7.1 0 21.4 0 14.3 14.3 42.9 14.3 42.9 42.9 28.5 21.4 7.1 42.9
Electricity 0 7.1 12.8 20 0 22.2 20 42.9 11.1 26.7 42.9 22.2 33.3 7.1 31.7
Water 7.1 8.3 40.2 14.3 0 19.8 21.4 50 20.7 35.7 25 0.0 21.4 16.7 19.3
Telecoms:
Fixed line 7.1 0 0 7.1 40 0 28.6 40 1.7 35.7 13.3 63.8 21.4 6.7 34.5
Mobile 0 0 0.8 5.6 14.3 2.2 16.7 57.1 35.4 27.8 28.6 32.1 50 0 29.5

Credit and Debt Management – 2008 Survey
166 Research and analysis by the Credit Management Research Centre, University of Leeds Business School
There appears to be growth in a number of sectors judging by the responses on the 4 and 5 points on the scale. However, some
sectors are generating a faster growth for the out-placed debt industry. In 2007 the fixed line telephone sector is the most buoyant
sector with 98% of collection agents indicating a 4 or 5 on the growth scale. This compares to just 29% in 2003.
Collections within the retail sector shows the second largest growth among respondents with 85% of collection agents indicating
this to be a growing market. The credit card industry has continued the 2003 growth trend which is most likely a result of the
growth of this particular industry. 72% of respondents indicate this to be a growth market.
The water industry is the one sector which is reported to be declining in terms of growth in 2007.
Questions over the last seven years have solicited opinion on the age and the quality of out-placed consumer debt. These
characteristics clearly have a bearing on the difficulty of collecting these debts and the efforts and resources that have to be
employed to collect the debts.
As can be seen below, 39% of companies state that the total value of debts comes from their largest client.
TABLE 5.7 VALUE OF DEBTS FROM LARGEST CLIENT
2007
Largest client 39%
2nd
largest client 14%
3rd
largest client 9%

Credit and Debt Management – 2008 Survey
167 Research and analysis by the Credit Management Research Centre, University of Leeds Business School
5.5 Quality and Volumes in the Debt Collection Market
• 51% of agencies in 2007 feel that the quality of consumer debt is worsening.
• 66% believe that debt is getting older in 2007 compared to 11% in 2003.
• The majority of agencies have between 21 and 50 clients.
In 2003 43% of respondents thought that the quality of out-placed debt was generally worsening. This figure in 2007 is 51% in the
sample. 18% of respondents indicated that the quality of consumer debt was improving.
CHART 5.5 QUALITY OF CONSUMER DEBT

Credit and Debt Management – 2008 Survey
168 Research and analysis by the Credit Management Research Centre, University of Leeds Business School
In 2007, 69% of companies feel that debt was generally getting older. This is compared to just 11% in 2003.
CHART 5.6 AGE OF CONSUMER DEBT
Over 60% of collection agents generate their business from under 50 clients and generally collection agents are dealing with fewer
clients than in 2003. The table below summarises the data further.
CHART 5.7 NUMBER OF CLIENTS WORKED FOR

Credit and Debt Management – 2008 Survey
169 Research and analysis by the Credit Management Research Centre, University of Leeds Business School
5.6 Debt Purchase
• The largest buyer of debt in 2007 paid £458 million compared to just £28 million in 2003.
A 1600% increase in the last four years.
• 63% indicate the Debt Purchase market is still growing in 2007.
• 64% state that prices paid for purchased debt are increasing.
• Prices paid for debt are now more concentrated in 2007 and average 8p in the pound.
CHART 5.8 DEBT PURCHASE MARKET GROWTH
The general growth of the debt purchase market continues in 2007 with 63% of companies indicating an increased market.
However, a quarter of respondents (25%) report the market to have stabilised compared to 18% in 2003.
A series of questions were included in the 2003 and 2007 surveys aimed at gathering further information on the debt purchase
activities of UK collection agents.

Credit and Debt Management – 2008 Survey
170 Research and analysis by the Credit Management Research Centre, University of Leeds Business School
The largest buyer of debt purchased a face value of £458 million compared to just £28 million in 2003. Of the total debt purchased
in 2007 an average of £30 million was collected during the last year.
In the sample prices paid for debts varied between 5p to 18p in the pound. The average price paid in the pound is 8p in 2007. This
shows more of a concentration of debt sale pricing since 2003 when the range was between 1p and 24p in the pound. As can be
seen below 64% of responding agents indicate that overall prices are increasing in the debt purchase market.
CHART 5.9 GROWTH IN PRICES PAID IN DEBT PURCHASE - 2007
Companies were also asked the percentage of debt purchased which is collected directly, restructured or resold. As can be seen in
the table below 89% of purchased debt is collected, 10% is sold on to another party and 1% is restructured.
TABLE 5.8 % OF PURCHASED DEBT SENT FOR COLLECTION
What percentages of consumer debt do you: 2007
Collect 89%
Restructure/ refinance 1%
Resell 10%

Credit and Debt Management – 2008 Survey
171 Research and analysis by the Credit Management Research Centre, University of Leeds Business School
5.7 Litigation and Bankruptcy
• 16% of live consumer debts were under some form of litigation process in 2007.
• Only 3% of debts are collected via the court process.
• There were only 434 court actions from an average of 228,000 debt placements in the last yer.
• The number of IVA’s has increased by 700% in the last three years.
• 78% of agents have accounts linked to an IVA.
• IVA Default Rates have more than tripled in the last three years.
• 98% of defaults are re-scheduled by agencies.
• The average value of each bankruptcy has doubled in 2 years to £6000.
One of the most important aspects of debt collection is contact with the debtor. When individuals get into arrears they often become
increasingly difficult to trace. As can be seen the agencies were asked the percentage of their live consumer workload which was
goneaway and then successfully traced in the last financial year. 23% of consumer debts were reported to be goneaway with 17%
successfully traced. This means that 6% of all accounts were untraceable in the last 12 months.
TABLE 5.9 % OF PURCHASED DEBT SENT FOR COLLECTION
Live consumer debts in 2007 2007
Gone away 23%
Successfully traced 17%
As can be seen below 16% of live consumer debts were under some form of litigation process in 2007 – although agencies only
reported an average of 434 court actions per year. When this is considered in the context of agencies handling on average 19,000
placements per month, clearly the legal process is not being used significantly.

Credit and Debt Management – 2008 Survey
172 Research and analysis by the Credit Management Research Centre, University of Leeds Business School
TABLE 5.10 % OF PURCHASED DEBT IN LITIGATION
Live consumer debts in 2007 2007
In litigation 16%
No. of court actions 434
There were slightly more consumer debt referred to court during 2007 with an average of 1428 across the sample. Of these cases
only 3% of debts were received.
TABLE 5.11 % OF TOTAL DEBT REFERRED TO COURT
Live consumer debts in 2007 2007
Number referred to court 1428
% of total number of debts received 3%
5.7.1 Individual Voluntary Arrangements (IVA’s)
The collection agents were asked if any of their collectable debts were operating under an Individual Voluntary Arrangement. 78%
of the agencies responding to the survey had accounts which were linked with an IVA.
CHART 5.10 % OF AGENTS WITH ACCOUNTS OPERATING UNDER AN IVA
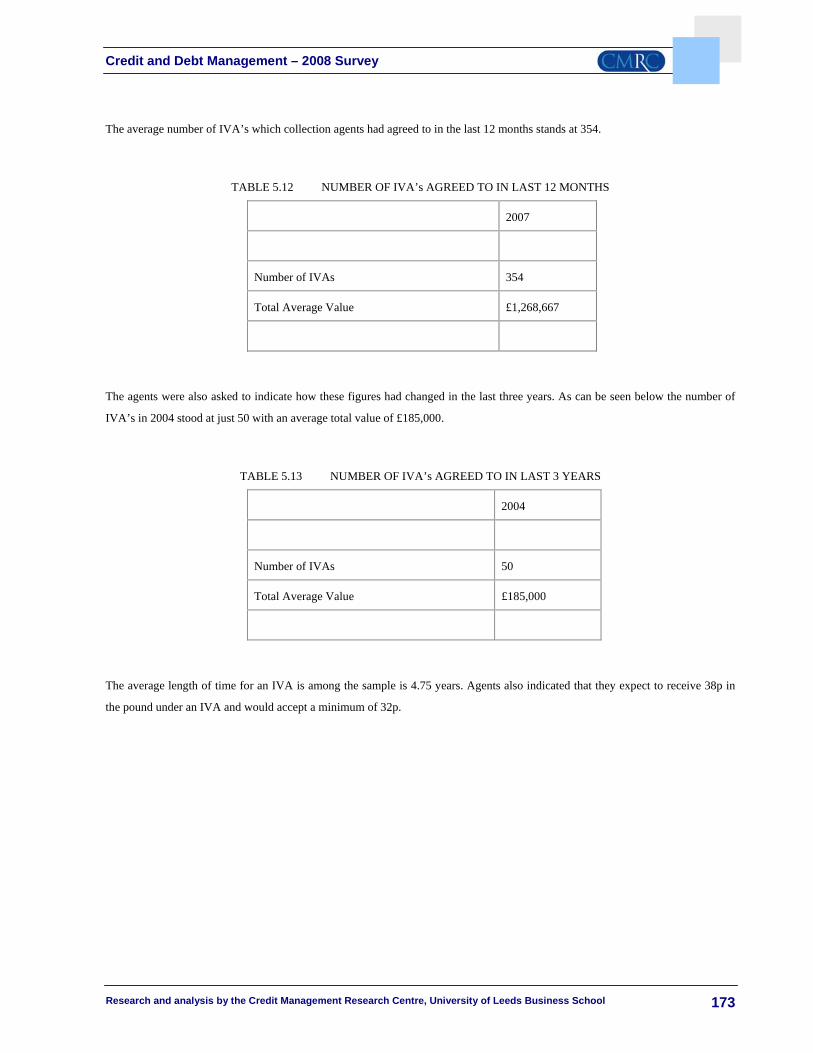
Credit and Debt Management – 2008 Survey
173 Research and analysis by the Credit Management Research Centre, University of Leeds Business School
The average number of IVA’s which collection agents had agreed to in the last 12 months stands at 354.
TABLE 5.12 NUMBER OF IVA’s AGREED TO IN LAST 12 MONTHS
2007
Number of IVAs 354
Total Average Value £1,268,667
The agents were also asked to indicate how these figures had changed in the last three years. As can be seen below the number of
IVA’s in 2004 stood at just 50 with an average total value of £185,000.
TABLE 5.13 NUMBER OF IVA’s AGREED TO IN LAST 3 YEARS
2004
Number of IVAs 50
Total Average Value £185,000
The average length of time for an IVA is among the sample is 4.75 years. Agents also indicated that they expect to receive 38p in
the pound under an IVA and would accept a minimum of 32p.

Credit and Debt Management – 2008 Survey
174 Research and analysis by the Credit Management Research Centre, University of Leeds Business School
In terms of default rates collection agents were asked to state the the percentage of IVAs which had defaulted over the last 3 years.
As can be seen below default rates have more than tripled during the last three years and now stand at 13%.
TABLE 5.14 NUMBER OF IVA’s AGREED TO IN LAST 3 YEARS
Default rates of IVA’s 2007
Last year 13%
Last 2 years 9%
Last 3 years 4%
98% of these defaults were rescheduled in the last year. 2% were written off.
TABLE 5.15 DEFAULTS WHICH HAVE BEEN RESCHEDULED IN LAST YEAR
2007
Re-scheduled 98%
Written-off 2%

Credit and Debt Management – 2008 Survey
175 Research and analysis by the Credit Management Research Centre, University of Leeds Business School
5.7.2 Bankruptcy
The responding agents reported an average of 250 bankruptcies in the last 12 months with an average total value of £1, 458,000.
This represented 1.35% of the total consumer debt workload.
TABLE 5.15 NUMBER OF IVA’s AGREED TO IN LAST 3 YEARS
2007
Number 250
Total value £1,458,000
When asked to compare the figures of each individual debt there has been a progressive increase in the average individual of each
bankruptcy in the last two years. As can be seen below the average value of each bankruptcy is £6000 – almost doubling in size
from £3200 two years ago.
TABLE 5.16 BANKRUPTICES IN THE LAST TWO YEARS
Value
Average value currently £6000
Average value 1 years ago £5200
Average value 2 years ago £3200

Credit and Debt Management – 2008 Survey
176 Research and analysis by the Credit Management Research Centre, University of Leeds Business School
References 1 Creditaction Debt Facts and Figures – October 2007
2 Creditaction Debt Facts and Figures – October 2007
3 Bank of England (UKV2QB) UK Personal Borrowing Outstanding
4 Bank of England “Statistical Release” September 2007
5 Financial Risk Outlook 2006, Financial Services Authority
6 BBC News website – www.bbc.co.uk
7 National Consumer Council “Debt Summit” November 2006
8 Creditaction Debt Facts and Figures November 2007
9 Council of Mortgage Lender 2007
10 Citizens Advice Bureau Press Release September 2007
11 Experian Press Release November 2007
12 British Bankers Association Statistics September 2007
13 Office for National Statistics and Bank of England October 2007
14 Creditaction Debt Facts and Figures – October 2007
15 Finance and Leasing Association Statistics 2007
16 Euler Hermes Press Relase 2007
17 World Factoring Yearbook (BCR) 2006)